roesfiansjah rasjidin roesfiansjah rasjidin teknik industri - ft - eu struktur dan perilaku sistem...
TRANSCRIPT
ROESFIANSJAH RASJIDINROESFIANSJAH RASJIDIN
TEKNIK INDUSTRI - FT - EU
Struktur dan Perilaku Struktur dan Perilaku Sistem DinamisSistem Dinamis
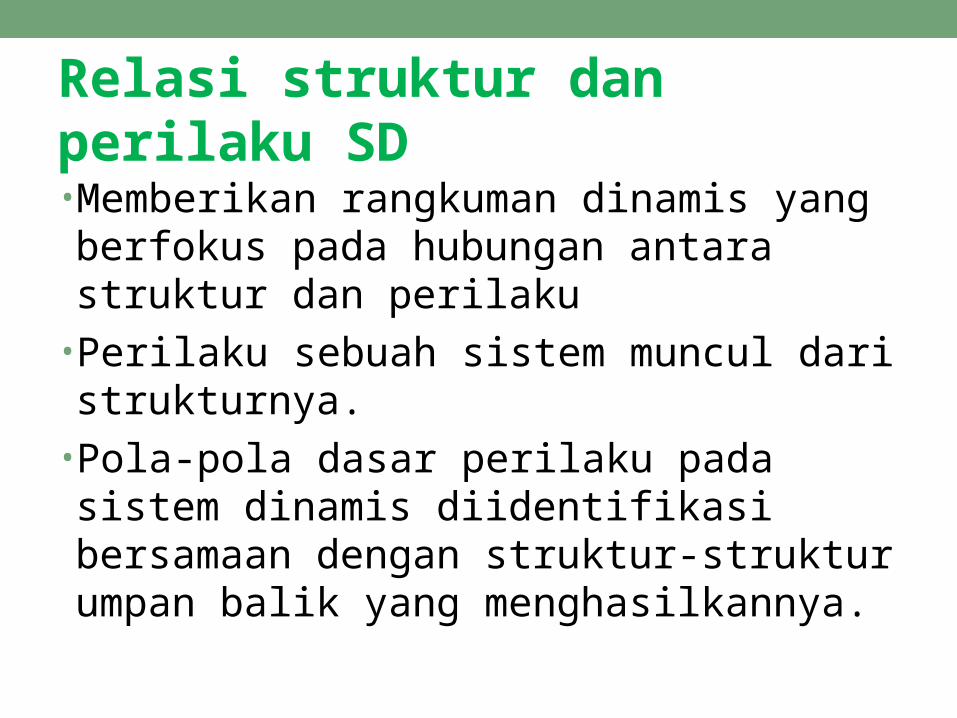
Relasi struktur dan perilaku SD
• Memberikan rangkuman dinamis yang berfokus pada hubungan antara struktur dan perilaku
• Perilaku sebuah sistem muncul dari strukturnya.
• Pola-pola dasar perilaku pada sistem dinamis diidentifikasi bersamaan dengan struktur-struktur umpan balik yang menghasilkannya.

Pola-pola dasar perilaku dinamisPerubahan terjadi dalam berbagai bentuk atau pola, dan variasi dinamis yang sangat beragam.
Kebanyakan dinamika mengikuti sejumlah kecil pola-pola perilaku berbeda.
Exponential Growth
Time
Goal Seeking
Time
Oscillation
Time
S-shaped Growth
Time
Overshoot and Collapse
Time
Growth with Overshoot
Time
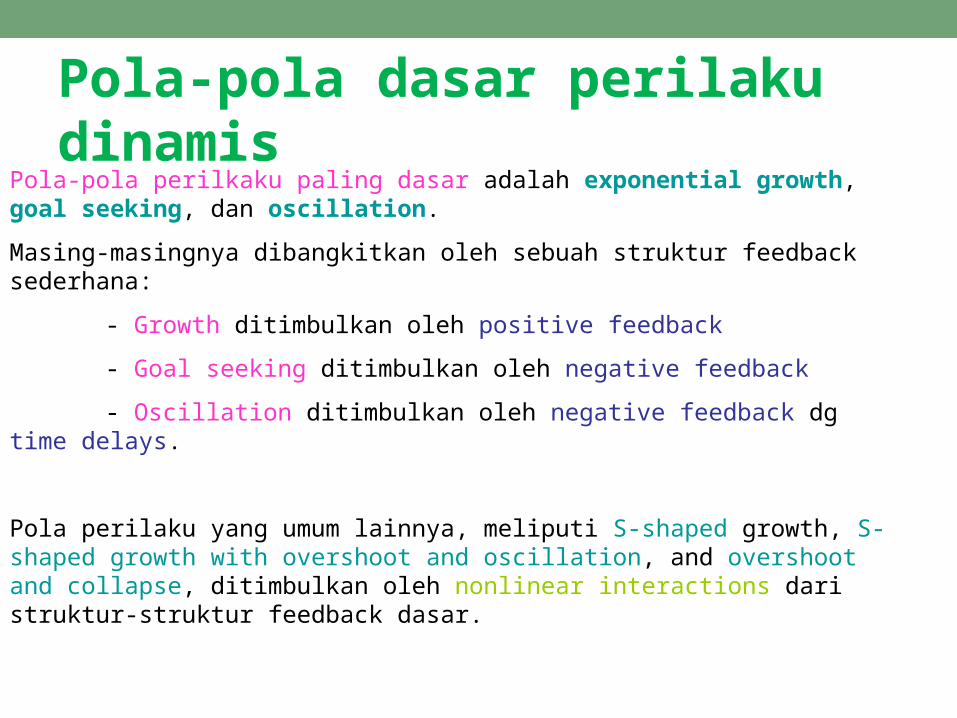
Pola-pola dasar perilaku dinamis Pola-pola perilkaku paling dasar adalah exponential growth, goal seeking, dan oscillation.
Masing-masingnya dibangkitkan oleh sebuah struktur feedback sederhana:
- Growth ditimbulkan oleh positive feedback
- Goal seeking ditimbulkan oleh negative feedback
- Oscillation ditimbulkan oleh negative feedback dg time delays.
Pola perilaku yang umum lainnya, meliputi S-shaped growth, S-shaped growth with overshoot and oscillation, and overshoot and collapse, ditimbulkan oleh nonlinear interactions dari struktur-struktur feedback dasar.
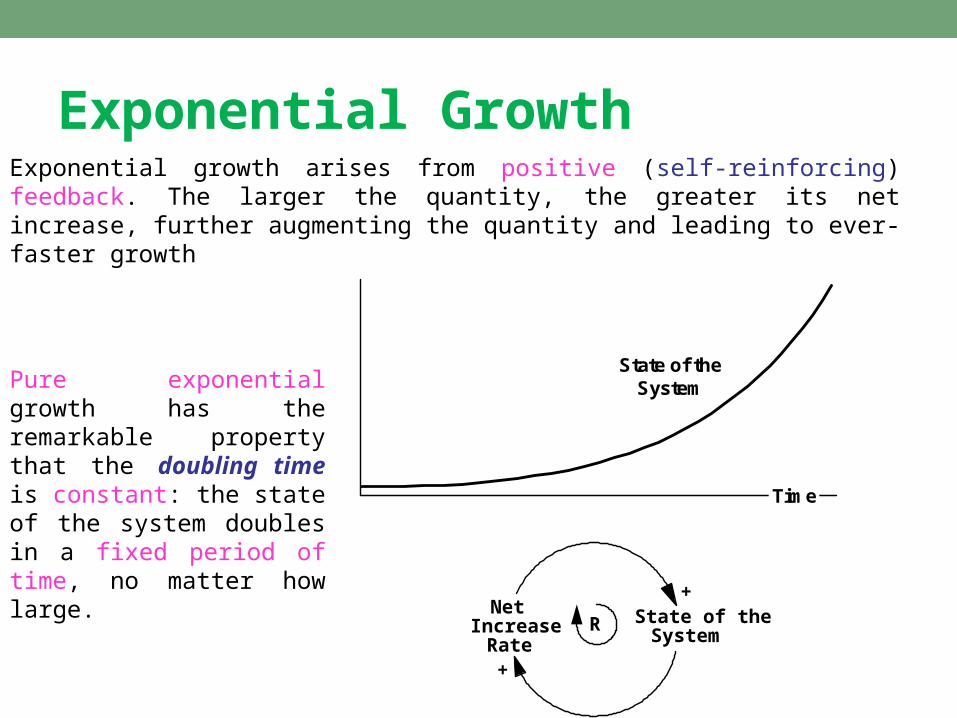
Exponential GrowthExponential growth arises from positive (self-reinforcing) feedback. The larger the quantity, the greater its net increase, further augmenting the quantity and leading to ever-faster growth
RNet
IncreaseRate
State of theSystem
+
+
Time
State of theSystemPure exponential growth has
the remarkable property that the doubling time is constant: the state of the system doubles in a fixed period of time, no matter how large.

Exponential GrowthPositive feedback need not always generate growth. It can also create self-reinforcing decline
As when a drop in stock prices erodes investor confidence which leads to more selling, lower prices, and still lower confidence.
What about linear growth?
Linear growth is actually quite rare.
Linear growth requires that there be no feedback from the state of the system to the net increase rate, because the net increase remains constant even as the state of the system changes.
What appears to be linear growth is often actually exponential, but viewed over a time horizon too short to observe the acceleration.

Exponential Growth
0
2
4
6
1900 2000
0
2
4
6
0 400 800 1200 1600 2000
Bil
lio
n P
eop
le
Lower Bound
Upper Bound
Average Growth Rate:1900 - 1950: 0.86%/year (doubling time 80 years)1950 - 1997: 1.76%/year (doubling time 40 years)
0
300
600
900
1200
1920 1940 1960 1980 2000
Th
ou
san
d P
eop
le
Average Growth Rate:1926 - 1995: 3.5%/year (doubling time 20 years)1970 - 1995: 6.8%/year (doubling time 10 years)
0
3
6
1965 1970 1975 1980 1985 1990 1995 2000
80868080 80286386
486
Pentium
PentiumPro
Average Growth Rate:33%/year (doubling time: 2 years)
4004Best Fit Exponential
102
103
104
105
106
107
1965 1975 1985 1995
Mil
lio
nTr
ansi
sto
rs/C
hip
0
4000
8000
1850 1900 1950 2000
Bil
lio
n 1
992
$/Y
ear
Average Growth Rate 3.45%/yearDoubling Time 20 years
US Real GDP
World Population
US Prison Population
Transistors per Chip, Intel Microprocessors
Average growth rate 3.45%/Year
Doubling time 20 Years
Bill
ion
$/Y
ea
r
Average growth rate
1926-1995 3.5%/Year D.time 20 Years
1970-1995 6.8%/Year D.time 10 Years
Average growth rate
1900-1950 0.86%/Year D.time 80 Years1950-2000 1.76%/Year D.time 40 Years
Average growth rate34%/Year D.time 2 Years
Upper Bound
Best Fit Exponantial

In dynamic modeling, the term "rate" generally refers to the absolute rate of change in a quantity.
The term "birth rate" here refers to the number of people born per time period.
Often, however, the term "rate" is used as shorthand for the fractional rate of change of a variable.
For example, the birth rate is often interpreted as the number of births per year per thousand people
Similarly, we commonly speak of the unemployment rate.
The word "rate" in these cases actually means "ratio": the unemployment rate is the ratio of the number of unemployed workers to the labor force.
Select variable names that minimize the chance for confusion.
Be sure to check the units of measure for your rates.
The units of measure for rates of flow are units/time period; the units of measure for fractional rates of flow are units per unit per time period = 1/time periods.
When a rate is not a rate
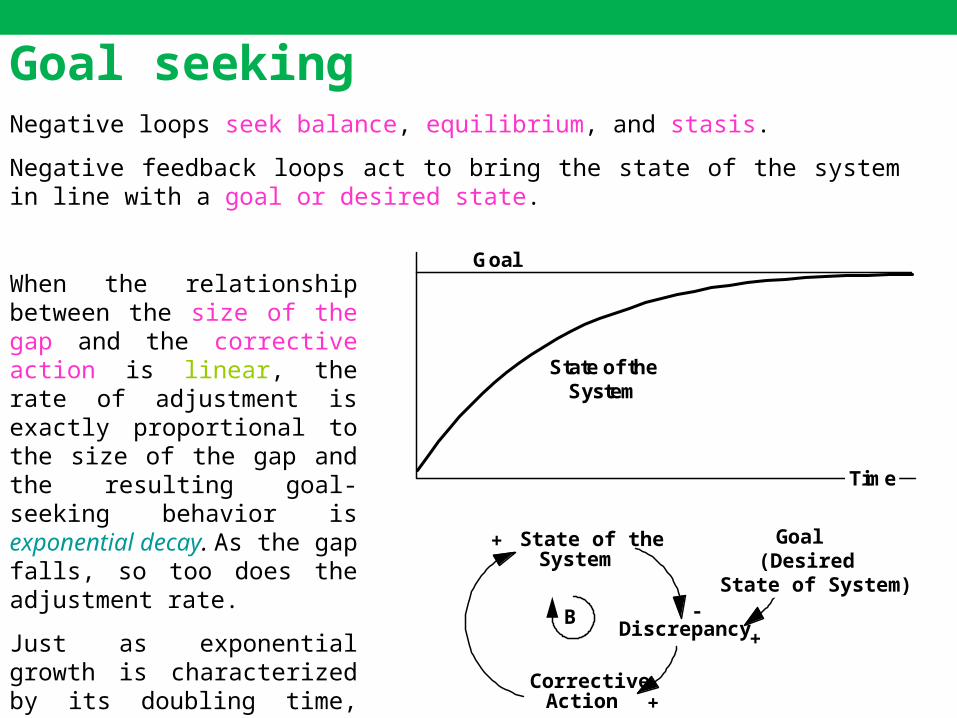
Goal seekingNegative loops seek balance, equilibrium, and stasis.
Negative feedback loops act to bring the state of the system in line with a goal or desired state.
Time
State of theSystem
Goal
CorrectiveAction
BDiscrepancy
+
-
+
Goal(Desired
State of System)
State of theSystem
+
When the relationship between the size of the gap and the corrective action is linear, the rate of adjustment is exactly proportional to the size of the gap and the resulting goal-seeking behavior is exponential decay. As the gap falls, so too does the adjustment rate.
Just as exponential growth is characterized by its doubling time, pure exponential decay is characterized by its half life -the time it takes for half the remaining gap to be eliminated
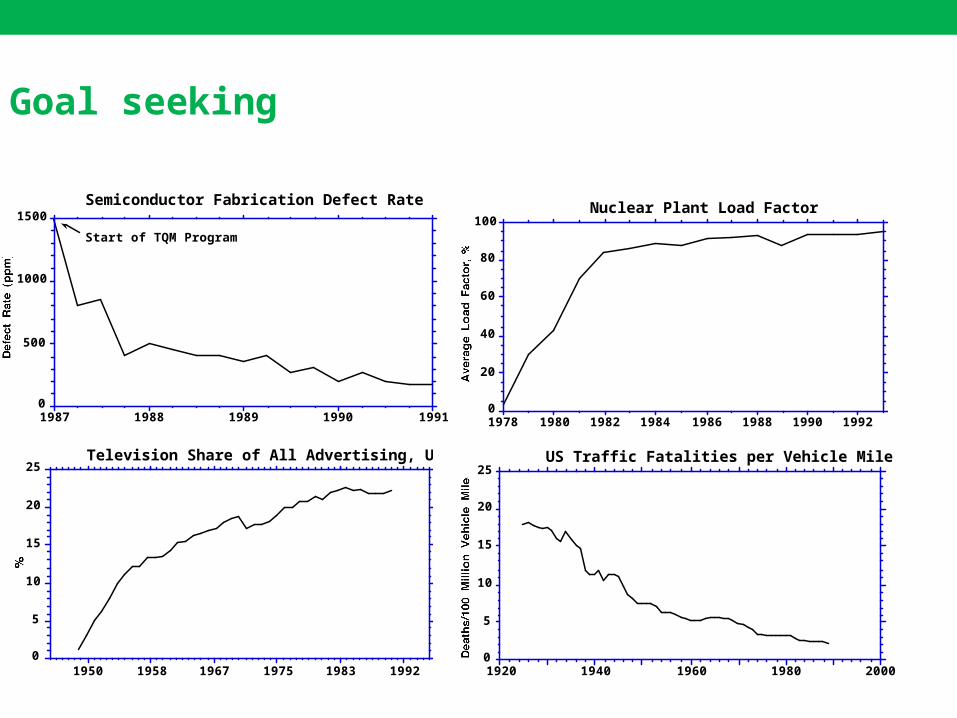
Goal seeking
0
500
1000
1500
1987 1988 1989 1990 1991
Semiconductor Fabrication Defect Rate
Start of TQM Program
0
20
40
60
80
100
1978 1980 1982 1984 1986 1988 1990 1992
Nuclear Plant Load Factor
0
5
10
15
20
25
1950 1958 1967 1975 1983 1992
Television Share of All Advertising, US
0
5
10
15
20
25
1920 1940 1960 1980 2000
US Traffic Fatalities per Vehicle Mile
Oscillation
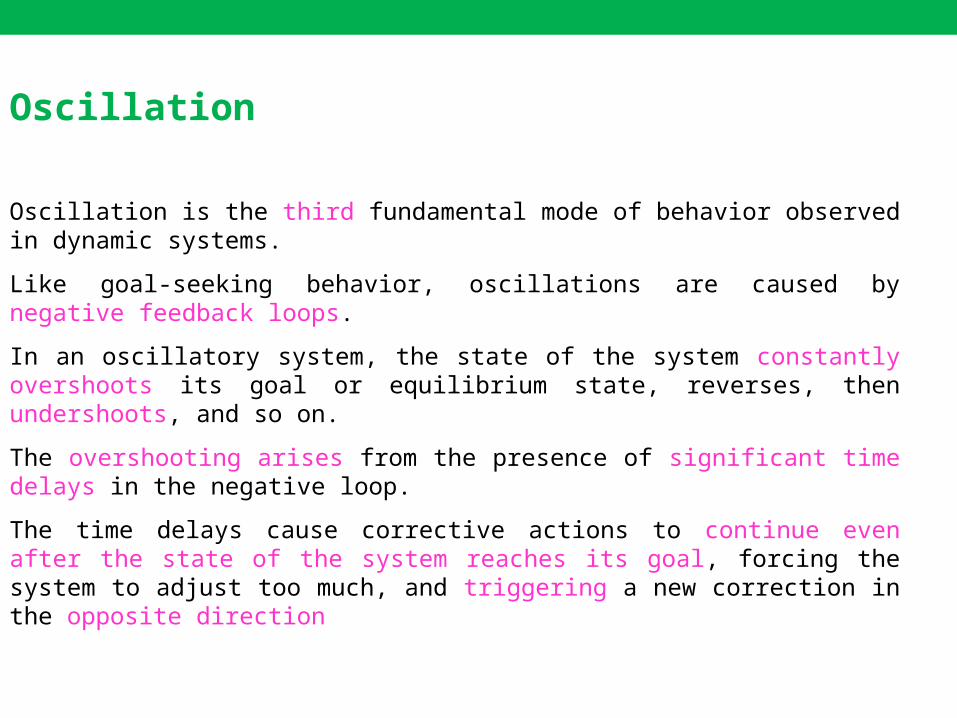
Oscillation is the third fundamental mode of behavior observed in dynamic systems.
Like goal-seeking behavior, oscillations are caused by negative feedback loops.
In an oscillatory system, the state of the system constantly overshoots its goal or equilibrium state, reverses, then undershoots, and so on.
The overshooting arises from the presence of significant time delays in the negative loop.
The time delays cause corrective actions to continue even after the state of the system reaches its goal, forcing the system to adjust too much, and triggering a new correction in the opposite direction

Oscillation
BDiscrepancy
+
-+
State of theSystem
DelayCorrective
Action
Delay
Delay
+Administrative andDecision MakingDelays
Time
State of theSystem
Goal
Measurement,Reporting, andPerceptionDelays
Goal(Desired
State of System)ActionDelays

Oscillation
Oscillations are among the most common modes of behavior in dynamic systems.
There are many types of oscillation, including:
Damped oscillations
Limit cycles
Chaos
Oscillations can arise if there is a significant delay in any part of the negative loop.
- There may be delays in perceiving the state of the system caused by the measurement and reporting system.
- There may be delays in initiating corrective actions after the discrepancy is perceived due to the time required to reach a decision.
- There may be delays between the initiation of a corrective action and its effect on the state of the system.
Oscillation
It takes time for a company to measure and report inventory levels, time for management to meet and decide how much to produce, and more time while raw materials procurement, the labor force, and other needed resources respond to the new production schedule.
Sufficiently long delays at anyone of these points could cause inventory to oscillate.
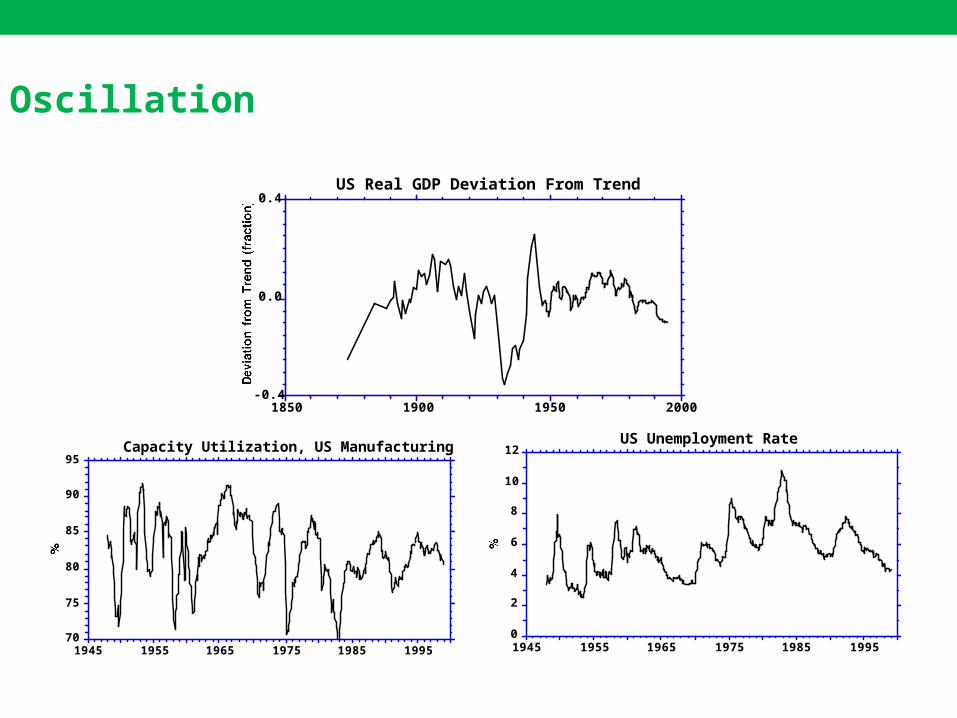
Oscillation
-0.4
0.0
0.4
1850 1900 1950 2000
US Real GDP Deviation From Trend
70
75
80
85
90
95
1945 1955 1965 1975 1985 1995
Capacity Utilization, US Manufacturing
0
2
4
6
8
10
12
1945 1955 1965 1975 1985 1995
US Unemployment Rate

S-shaped growth
No real quantity can grow forever: eventually one or more constraints halt the growth.
A commonly observed mode of behavior in dynamic systems is S-shaped growth-growth is exponential at first, but then gradually slows until the state of the system reaches an equilibrium level.
The shape of the curve resembles a stretched-out "S"
To understand the structure underlying S-shaped growth it is helpful to use the ecological concept of carrying capacity.
The carrying capacity of any habitat is the number of organisms of a particular type it can support and is determined by the resources available in the environment and the resource requirements of the population.
As a population approaches its carrying capacity, resources per capita diminish thereby reducing the fractional net increase rate until there are just enough resources per capita to balance births and deaths

S-shaped growth
Time
Carrying Capacity
State of theSystem
BResourceAdequacy
CarryingCapacity
FractionalNet Increase
Rate
R
NetIncrease
Rate
+
+
+
-
+
+
State of theSystem

S-shaped growth
A system generates S-shaped growth only if two critical conditions are met:
First, the negative loops must not include any significant time delays
Second, the carrying capacity must be fixed.
0
100
200
300
0 14 28 42 56 70 84
Growth of Sunflowers
Days
0
25
50
75
100
1960 1962 1964 1966 1968 1970 1972
Adoption of Cardiac Pacemaker by Physicians

S-shaped growth with overshoot
S-shaped growth requires the negative feedbacks that constrain growth to act swiftly as the carrying capacity is approached.
Often, however, there are significant time delays in these negative loops.
Time delays in the negative loops lead to the possibility that the state of the system will overshoot and oscillate around the carrying capacity
Time
Carrying Capacity
State of theSystem
BResourceAdequacy
R
+
+
+
-
+
Delay
State of theSystem
FractionalNet Increase
Rate
NetIncrease
Rate+
Delay
CarryingCapacity
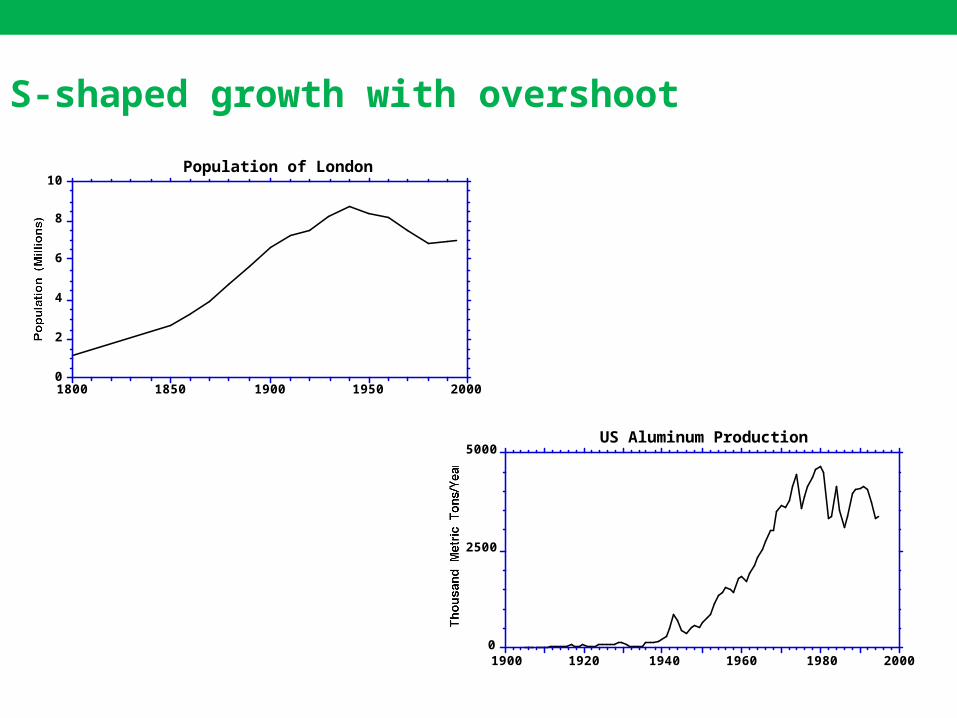
S-shaped growth with overshoot
0
2
4
6
8
10
1800 1850 1900 1950 2000
Population of London
0
2500
5000
1900 1920 1940 1960 1980 2000
US Aluminum Production

Overshoot and collapse
The second critical assumption underlying S-shaped growth is that the carrying capacity is fixed.
Often, however, the ability of the environment to support a growing population is eroded or consumed by the population itself.
For example, the population of deer in a forest can grow so large that they overbrowse the vegetation, leading to starvation and a precipitous decline in the population.
Time
Carrying Capacity
State of theSystem
B
R
NetIncrease
Rate
State of theSystem
+
+
+
-
+
+
B
Consumption/Erosion of
Carrying Capacity
-
+
ResourceAdequacy
CarryingCapacity
FractionalNet Increase
Rate

Overshoot and collapse
0
50
100
150
1880 1900 1920 1940 1960 1980 2000
New England Haddock Catch
0
10
20
30
40
1950 1960 1970 1980 1990 2000
Net Change in World Nuclear Power Capacity
0.0
0.5
1.0
1.5
2.0
1976 1978 1980 1982 1984 1986
Sales of the Atari Corporation
About $600 M Loss
DISKUSIDISKUSI
&&
TANYA JAWABTANYA JAWAB
Referensi• Sterman, J.D. (2000) Business dynamics• Shadrokh, S. System Dynamics: Structure and Behavior
of Dynamic Systems.