statistik dana pensiun · 2019-11-29 · statistik dana pensiun 2018/ pension fund statistics 2018...
TRANSCRIPT
Stat
isti
k D
ana
Pen
siun
201
8/P
ensi
on F
und
Stat
isti
cs 2
018
A
STATISTIKDANA PENSIUN
2018PENSION FUND STATISTICS

Oto
rita
s Ja
sa K
euan
gan
Ind
one
sia/
Indo
nesi
a Se
rvic
es A
utor
ity
B
Statistik Dana Pensiun 2018diterbitkan oleh
Otoritas Jasa Keuangan Indonesia
Pension Fund Statistic 2018Published by
Indonesia Financial Services Authority
www.ojk.go.id
Stat
isti
k D
ana
Pen
siun
201
8/P
ensi
on F
und
Stat
isti
cs 2
018
i
KATA PENGANTARFOREWORD
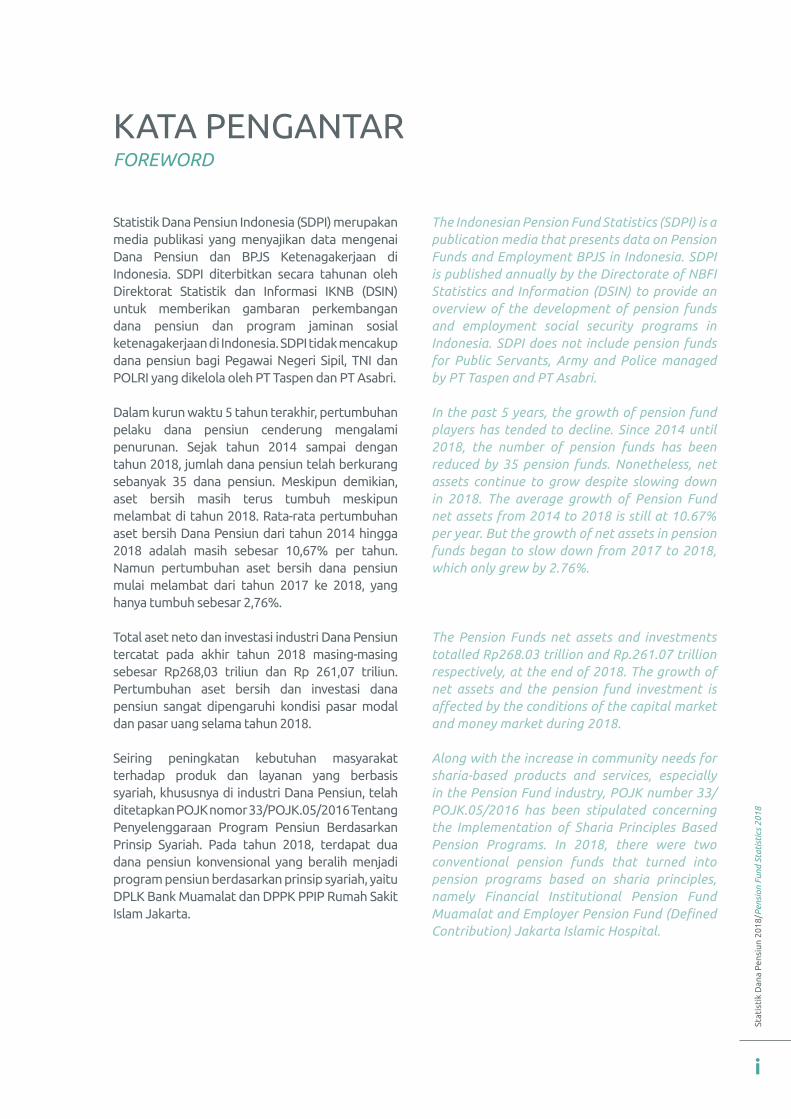
Statistik Dana Pensiun Indonesia (SDPI) merupakan media publikasi yang menyajikan data mengenai Dana Pensiun dan BPJS Ketenagakerjaan di Indonesia. SDPI diterbitkan secara tahunan oleh Direktorat Statistik dan Informasi IKNB (DSIN) untuk memberikan gambaran perkembangan dana pensiun dan program jaminan sosial ketenagakerjaan di Indonesia. SDPI tidak mencakup dana pensiun bagi Pegawai Negeri Sipil, TNI dan POLRI yang dikelola oleh PT Taspen dan PT Asabri.
Dalam kurun waktu 5 tahun terakhir, pertumbuhan pelaku dana pensiun cenderung mengalami penurunan. Sejak tahun 2014 sampai dengan tahun 2018, jumlah dana pensiun telah berkurang sebanyak 35 dana pensiun. Meskipun demikian, aset bersih masih terus tumbuh meskipun melambat di tahun 2018. Rata-rata pertumbuhan aset bersih Dana Pensiun dari tahun 2014 hingga 2018 adalah masih sebesar 10,67% per tahun. Namun pertumbuhan aset bersih dana pensiun mulai melambat dari tahun 2017 ke 2018, yang hanya tumbuh sebesar 2,76%.
Total aset neto dan investasi industri Dana Pensiun tercatat pada akhir tahun 2018 masing-masing sebesar Rp268,03 triliun dan Rp 261,07 triliun. Pertumbuhan aset bersih dan investasi dana pensiun sangat dipengaruhi kondisi pasar modal dan pasar uang selama tahun 2018.
Seiring peningkatan kebutuhan masyarakat terhadap produk dan layanan yang berbasis syariah, khususnya di industri Dana Pensiun, telah ditetapkan POJK nomor 33/POJK.05/2016 Tentang Penyelenggaraan Program Pensiun Berdasarkan Prinsip Syariah. Pada tahun 2018, terdapat dua dana pensiun konvensional yang beralih menjadi program pensiun berdasarkan prinsip syariah, yaitu DPLK Bank Muamalat dan DPPK PPIP Rumah Sakit Islam Jakarta.
The Indonesian Pension Fund Statistics (SDPI) is a publication media that presents data on Pension Funds and Employment BPJS in Indonesia. SDPI is published annually by the Directorate of NBFI Statistics and Information (DSIN) to provide an overview of the development of pension funds and employment social security programs in Indonesia. SDPI does not include pension funds for Public Servants, Army and Police managed by PT Taspen and PT Asabri.
In the past 5 years, the growth of pension fund players has tended to decline. Since 2014 until 2018, the number of pension funds has been reduced by 35 pension funds. Nonetheless, net assets continue to grow despite slowing down in 2018. The average growth of Pension Fund net assets from 2014 to 2018 is still at 10.67% per year. But the growth of net assets in pension funds began to slow down from 2017 to 2018, which only grew by 2.76%.
The Pension Funds net assets and investments totalled Rp268.03 trillion and Rp.261.07 trillion respectively, at the end of 2018. The growth of net assets and the pension fund investment is affected by the conditions of the capital market and money market during 2018.
Along with the increase in community needs for sharia-based products and services, especially in the Pension Fund industry, POJK number 33/POJK.05/2016 has been stipulated concerning the Implementation of Sharia Principles Based Pension Programs. In 2018, there were two conventional pension funds that turned into pension programs based on sharia principles, namely Financial Institutional Pension Fund Muamalat and Employer Pension Fund (Defined Contribution) Jakarta Islamic Hospital.
Oto
rita
s Ja
sa K
euan
gan
Ind
one
sia/
Indo
nesi
a Se
rvic
es A
utor
ity
ii
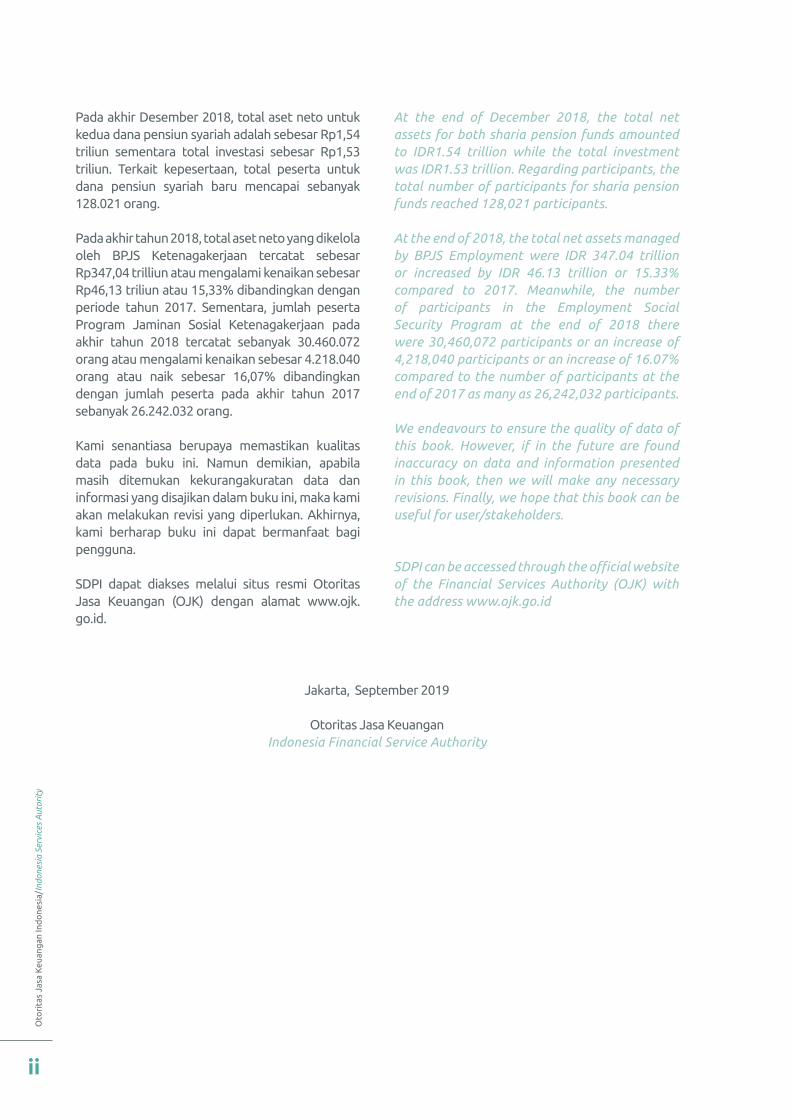
Pada akhir Desember 2018, total aset neto untuk kedua dana pensiun syariah adalah sebesar Rp1,54 triliun sementara total investasi sebesar Rp1,53 triliun. Terkait kepesertaan, total peserta untuk dana pensiun syariah baru mencapai sebanyak 128.021 orang.
Pada akhir tahun 2018, total aset neto yang dikelola oleh BPJS Ketenagakerjaan tercatat sebesar Rp347,04 trilliun atau mengalami kenaikan sebesar Rp46,13 triliun atau 15,33% dibandingkan dengan periode tahun 2017. Sementara, jumlah peserta Program Jaminan Sosial Ketenagakerjaan pada akhir tahun 2018 tercatat sebanyak 30.460.072 orang atau mengalami kenaikan sebesar 4.218.040 orang atau naik sebesar 16,07% dibandingkan dengan jumlah peserta pada akhir tahun 2017 sebanyak 26.242.032 orang.
Kami senantiasa berupaya memastikan kualitas data pada buku ini. Namun demikian, apabila masih ditemukan kekurangakuratan data dan informasi yang disajikan dalam buku ini, maka kami akan melakukan revisi yang diperlukan. Akhirnya, kami berharap buku ini dapat bermanfaat bagi pengguna.
SDPI dapat diakses melalui situs resmi Otoritas Jasa Keuangan (OJK) dengan alamat www.ojk.go.id.
At the end of December 2018, the total net assets for both sharia pension funds amounted to IDR1.54 trillion while the total investment was IDR1.53 trillion. Regarding participants, the total number of participants for sharia pension funds reached 128,021 participants.
At the end of 2018, the total net assets managed by BPJS Employment were IDR 347.04 trillion or increased by IDR 46.13 trillion or 15.33% compared to 2017. Meanwhile, the number of participants in the Employment Social Security Program at the end of 2018 there were 30,460,072 participants or an increase of 4,218,040 participants or an increase of 16.07% compared to the number of participants at the end of 2017 as many as 26,242,032 participants.
We endeavours to ensure the quality of data of this book. However, if in the future are found inaccuracy on data and information presented in this book, then we will make any necessary revisions. Finally, we hope that this book can be useful for user/stakeholders.
SDPI can be accessed through the official website of the Financial Services Authority (OJK) with the address www.ojk.go.id
Jakarta, September 2019
Otoritas Jasa KeuanganIndonesia Financial Service Authority
Stat
isti
k D
ana
Pen
siun
201
8/P
ensi
on F
und
Stat
isti
cs 2
018
iii
DAFTAR ISICONTENT
KATA PENGANTAR/FOREWORD i
DAFTAR ISI/CONTENT iii
DAFTAR GRAFIK/LIST OF GRAPH iv
DAFTAR TABEL/LIST OF TABLE vi
Ringkasan Pertumbuhan Industri Dana PensiunSummary Of Pension Fund Industry Growth
3
A Jumlah Dana PensiunNumber Of Pension Fund
4
B Program PensiunPension Plan
6
C Kepesertaan Dana PensiunPension Fund Participation
7
D Aset Bersih Dana PensiunPension Fund Net Assets
11
EPertumbuhan Aset Bersih Dana Pensiun Tahun 2014 - 2018Growth Of Pension Fund Net Assets Years 2014-2018
11
FDistribusi Jumlah Dana Pensiundan Aset Bersih Tahun 2018Distribution Of Pension Funds and Net Assets Of Pension Funds In 2018
13
G
Distribusi Jumlah Dana Pensiun dan Kepesertaan Dana Pensiun Berdasarkan KategoriDistribution Of Pension Fund Partici-pants Based On Category
15
H Investasi Dana PensiunPension Fund Investments
17
IPertumbuhan Investasi Dana Pensiun 2014-2018Pension Fund Investment Growth 2014-2018
18
J Portofolio Investasi Dana PensiunPension Fund Investment Portfolio
20
K Portofolio Investasi Bulanan Tahun 2018Monthly Investment Portfolio In 2018
21
L Kinerja Investasi Dana PensiunPension Fund Investment Performance
22
M Pendanaan Dana PensiunFunding Of Pension Funds
24
N Tingkat Pendanaan Dana PensiunFunding Of Pension Funds
25
O Rasio Pendanaan Dana PensiunFunding Ratio Of Pension Funds
26
P Rasio Solvabilitas Dana PensiunSolvency Ratio Of Pension Funds
27
Q Asumsi Tingkat BungaAssumption Of Interest Rate
28
R Metode Perhitungan AktuariaActuarial Calculation Method
29
S Asumsi Tingkat MortalitaAssumption Of Mortality Rate
30
T Dana Pensiun SyariahSharia Pension Fund
33
UKepesertaan Program Jaminan SosialKetenagakerjaanParticipants Of Employment Social Security Program
38
VAset Neto Jaminan SosialKetenagakerjaanNet Assets In Employment Social Security
39
WPortofolio Investasi Jaminan SosialKetenagakerjaanInvestment Portfolio Of Employment Social Security
40
Statistik Industri Dana Pensiun 2018Statistics Of Pension Fund Industry 2018
43
Daftar Nama Dana Pensiun 2018Pension Fund List Name 2018
65
Oto
rita
s Ja
sa K
euan
gan
Ind
one
sia/
Indo
nesi
a Se
rvic
es A
utor
ity
iv
DAFTAR GRAFIKLIST OF GRAPH
Grafik 01Graph 01
Pertumbuhan Jumlah Dana Pensiun Tahun 2014 s.d. 2018Growth of Total Pension Funds from 2014 to 2018
5
Grafik 02Graph 02
Persentase Program Pensiun Tahun 2018Percentage of Pension Plans in 2018
7
Grafik 03Graph 03
Pertumbuhan Jumlah Pemberi Kerja di DPLK Tahun 2014 s.d. 2018Growth of Employers in the FIPF from 2014 to 2018
7
Grafik 04Graph 04
Jumlah Peserta Dana Pensiun Menurut Jenis Dana Pensiun Tahun 2014 s.d. 2018The Number of Pension Fund Participants based on Types of Pension Fund from 2014 to 2018
9
Grafik 05Graph 05
Komposisi Penerima Manfaat PensiunTahun 2018The Composition of Pension Beneficiaries in 2018
9
Grafik 06Graph 06
Penetrasi Peserta Dana PensiunTerhadap Tenaga Kerja Nasional Tahun 2018The Penetration of Pension Fund Participants on Man Power in 2018
10
Grafik 07Graph 07
Distribusi Aset Bersih Dana Pensiun Tahun 2018Distribution of Pension Fund Net Assets 2018
11
Grafik 08Graph 08
Pertumbuhan Aset Bersih Dana Pensiun Tahun 2014 s.d. 2018 (Rp Triliun)Growth of Pension Fund Net Assets from 2014 to 2018 (IDR Trillion)
12
Grafik 09Graph 09
Pertumbuhan Aset Bersih Berdasarkan Program Pensiun Tahun 2014 s.d. 2018 (dalam Rp Triliun)Growth of Pension Fund Net Assets based on Pension Plan from 2014 to 2018 (IDR Trillion)
12
Grafik 10Graph 10
Jumlah Dana Pensiun Berdasarkan Grup Tahun 2018Number of Pension Funds Based on Group in 2018
13
Grafik 11Graph 11
Program Dana Pensiun Berdasarkan Grup Tahun 2018Pension Fund Programs Based on Group in 2018
14
Grafik 12Graph 12
Distribusi Jumlah Dana Pensiun dan Aset Bersih Berdasarkan Grup Tahun 2018Distribution of Pension Funds and Net Assets Based on Group in 2018
15
Grafik 13Graph 13
Jumlah Dana Pensiun Berdasarkan kategori Peserta tahun 2018Number of Pension Fund Programs Based on Participant Category in 2018
16
Grafik 14Graph 14
Penyebaran Peserta Berdasarkan Kategori & Program Pensiun Tahun 2018Distribution of Participants Based on Category & Pension Plans in 2018
17
Grafik 15Graph 15
Aset Bersih dan Jumlah Peserta dari 10 Dana Pensiun Terbesar Tahun 2018Distribution of Participants Based on Category & Pension Plans in 2018
17
Grafik 16Graph 16
Proporsi Investasi Dana Pensiun Tahun 2018Proportion of Pension Fund Investments in 2018
18
Grafik 17Graph 17
Pertumbuhan Investasi Dana Pensiun Tahun 2014 s.d. 2018Growth of Pension Fund Investments from 2014 to 2018
19
Grafik 18Graph 18
Pertumbuhan Investasi Dana Pensiun Berdasarkan Program Pensiun Tahun 2014 s.d. 2018Growth of Pension Fund Investments based on Pension Plan from 2014 to 2018
20
Grafik 19Graph 19
Portofolio Investasi Dana Pensiun Tahun 2014 s.d. 2018Pension Fund Investment Portfolio from 2014 to 2018
20
Grafik 20Graph 20
Investasi Dana Pensiun di Pasar Uang dan Pasar Modal Tahun 2014 s.d 2018Pension Fund Investment in Money Market and Capital Market from 2014 to 2018
21
Grafik 21Graph 21
Investasi Dana Pensiun Bulanan Tahun 2018Monthly Pension Fund Investment in 2018
22
Grafik 22Graph 22
Tingkat Pengembalian Investasi Dana Pensiun Tahun 2011 s.d. 2018Return on Investment of Pension Fund from 2011 to 2018
23
Grafik 23Graph 23
Tingkat Pengembalian Investasi Dana Pensiun Berdasarkan Jenis Dana Pensiun Tahun 2011 s.d. 2018Return on Investment of Pension Fund based on Pension Fund Type from 2011 until 2018
24
Stat
isti
k D
ana
Pen
siun
201
8/P
ensi
on F
und
Stat
isti
cs 2
018
v
Grafik 24Graph 24
Tahun Valuasi Laporan AktuarisYear Valuation Actuarial Report
25
Grafik 25Graph 25
Tingkat Pendanaan DPPK PPMPFunding Level of EPF-DBPPs
26
Grafik 26Graph 26
Rasio Pendanaan DPPK PPMPFunding Ratio of EPF-DBPPs
27
Grafik 27Graph 27
Rasio Solvabilitas DPPK PPMPSolvency Ratio of EPF-DBPPs
28
Grafik 28Graph 28
Asumsi Tingkat BungaAssumption of Interest Rate
29
Grafik 29Graph 29
Asumsi Metode Perhitungan AktuariaAssumption of Actuarial Calculation Method
29
Grafik 30Graph 30
Asumsi Metode Perhitungan AktuariaAssumption of Actuarial Calculation Method
30
Grafik 31Graph 31
Investasi Dana Pensiun Syariah Tahun 2018Sharia Pension Fund Investment in 2018
34
Grafik 32Graph 32
Persentase Aset Neto Badan Penyelenggara Jaminan Sosial (Bpjs) KetenagakerjaanPercentage of Net Assets In Labour Social Security Administration Agency
39
Grafik 33Graph 33
Portofolio Investasi Badan Penyelenggara Jaminan Sosial (BPJS) Ketenagakerjaan 2018 Labour Social Security Administration Agency Investment Portfolio In 2018
40
Statistik Industri Dana Pensiun 2018Statistics Of Pension Fund Industry 2018
Grafik 34Graph 34
Pertumbuhan Jumlah Dana Pensiun Tahun 1998 s.d. 2018Growth of Total Pension Funds In 1998 to 2018
57
Grafik 35Graph 35
Komposisi Dana Pensiun Berdasarkan Grup Tahun 2018Composition of Pension Funds Based on Group In 2018
58
Grafik 36Graph 36
Kepesertaan Dana Pensiun Berdasarkan Grup Tahun 2018Membership of Pension Funds Based on Group In 2018
58
Grafik 37Graph 37
Peserta DPPK dan DPLK Berdasarkan Grup Tahun 2018Participant EPF and FIPF Based on Group In 2018
58
Grafik 38Graph 38
Aset Bersih Dana Pensiun Berdasarkan Grup Tahun 2018 (triliun Rupiah)Pension Fund Net Assets Based on Group In 2018(IDR trillion)
59
Grafik 39Graph 39
Kepemilikan Aset Bersih dan Investasi Dana Pensiun Berdasarkan Grup Tahun 2018Ownership of Net Assets and Investment Based on Grup In 2018
59
Grafik 40Graph 40
Portofolio Investasi tahun 2005-2018 (triliiun Rupiah)Investments Portfolio In 2005-2018 (IDR trillion)
59
Grafik 41Graph 41
Perkembangan Tingkat Pengembalian Investasi Tahun 2005-2018Growth of Return on Investment In 2005 to 2018
60
Grafik 42Graph 42
Tingkat Pengembalian Investasi Dana Pensiun Tahun 2018Return on Investment Pension Fund In 2018
60
Grafik 43Graph 43
Tingkat Pengembalian Investasi Dana Pensiun Berdasarkan Grup Tahun 2018Pension Fund’s Return on Investment Based on Group In 2018
60
Grafik 44Graph 44
Pertumbuhan Investasi DPLK Tahun 2014 s.d. 2018 (triliun Rupiah)Growth of FIPF Investment in 2014 to 2018 (IDR trillion)
61
Grafik 45Graph 45
Portofolio Investasi DPLK Tahun 2014 s.d. 2018FIPF’s Investment Portfolio In 2014 to 2018
61
Grafik 46Graph 46
Portofolio Investasi Bulanan DPLK Tahun 2018 (triliun Rupiah)Monthly Portfolio Investment of FIPF In 2018 (IDR trillion)
61
Grafik 47Graph 47
Penempatan Investasi DPLK Tahun 2012 s.d. 2018Placement of FIPF’s Investment In 2012 to 2018
62
Grafik 48Graph 48
Tingkat Pengembalian Investasi DPLK Tahun 2014 s.d. 2018FPIF’s Return on Investment In 2014 to 2018
62
Oto
rita
s Ja
sa K
euan
gan
Ind
one
sia/
Indo
nesi
a Se
rvic
es A
utor
ity
vi
DAFTAR TABELLIST OF TABLE
Tabel 01Table 01
Jumlah Dana Pensiun Tahun 2014 s.d. 2018Growth of Total Pension Funds from 2014 to 2018
5
Tabel 02Table 02
Peserta Dana Pensiun Tahun 2017 dan 2018Pension Fund Participants in 2017 and 2018
8
Tabel 03Table 03
Penetrasi Peserta Dana Pensiun 2014 s.d. 2018The penetration of pension fund participant 2014 to 2018
10
Tabel 04Table 04
Kepesertaan Program Jaminan Sosial Ketenagakerjaan 2017-2018Employment Social Security Program Participant In 2017-2018
38
Tabel 05Table 05
Aset Neto Badan Penyelenggara Jaminan Sosial (BPJS) KetenagakerjaanNet Assets In Labour Social Security Administration Agency
39
Tabel 06Table 06
Investasi Badan Penyelenggara Jaminan Sosial (BPJS) Ketenagakerjaan 2018 (milliar rupiah)Investment of Labour Social Security Administration Agency In 2018 (billion IDR)\
40
Statistik Industri Dana Pensiun 2018Statistics Of Pension Fund Industry 2018
Tabel 07Table 07
Pertumbuhan Peserta Dana PensiunGrowth of Pension Fund Participant
43
Tabel 08Table 08
Aset Bersih dan Investasi Dana Pensiun Berdasarkan Jenis Dana Pensiun Tahun 2014 s.d. 2018 (triliun Rupiah)Net Assets and Investments Pension Fund Based on Type In 2014 to 2018 (trillion Rupiah)
43
Tabel 09Table 09
Portofolio Investasi Dana Pensiun Tahun 2014 s.d. 2018 (triliun Rupiah)Portfolio of Pension Fund Investment In 2014 to 2018 (trillion Rupiah)
44
Tabel 10Table 10
Ringkasan Umum Statistik Dana Pensiun Tahun 2018Genereal summary of Pension Fund Statistics Year 2018
44
Tabel 11Table 11
Tingkat Pengembalian Investasi Dana Pensiun Berdasarkan Grup Tahun 2018Return on Investment Pension Fund Based on Group Tahun 2018
45
Tabel 12Table 12
Rekapitulasi Dana Pensiun Berdasarkan Provinsi*Summary of Pension Funds Based on Province *
46
Tabel 13Table 13
Laporan Aset Bersih, Perhitungan Hasil Usaha dan Neraca Dana PensiunPension Fund’s Statements of Net Assets, Income Statements and Statements of Financial Position
47
Tabel 14Table 14
Ringkasan Laporan Keuangan DPLK (Rp Miliar)Summary of Financial Statement FIPF (IDR billion)
54
Stat
isti
k D
ana
Pen
siun
201
8/P
ensi
on F
und
Stat
isti
cs 2
018
01
Ringkasan Pertumbuhan Industri Dana PensiunSummary Of Pension Fund Industry Growth

Oto
rita
s Ja
sa K
euan
gan
Ind
one
sia/
Indo
nesi
a Se
rvic
es A
utor
ity
02
Stat
isti
k D
ana
Pen
siun
201
8/P
ensi
on F
und
Stat
isti
cs 2
018
03
Ringkasan Pertumbuhan Industri Dana PensiunSummary Of Pension Fund Industry Growth
Dalam kurun waktu 5 tahun, pelaku dana pensiun cenderung mengalami penurunan sebanyak 35 dana pensiun dari 267 dana pensiun di tahun 2014 menjadi 232 dana pensiun di tahun 2018. Pada akhir tahun 2018, pelaku Dana Pensiun berjumlah 232 Dana Pensiun, terdiri dari 164 DPPK-PPMP, 44 DPPK PPIP dan 24 DPLK.
Dari sisi kepesertaan, total peserta Dana Pensiun mengalami kenaikan dari 4.455.712 orang di tahun 2017 menjadi 4.635.074 orang di tahun 2018 atau naik sebesar 4.03%. Kenaikan tersebut disebabkan kenaikan pada kepesertaan di Dana Pensiun Lembaga Keuangan (DPLK) yang mengalami kenaikan sebanyak 184.150 orang atau 6,03%. Sebaliknya, kepesertaan untuk peserta Dana Pensiun Pemberi Kerja (DPPK) mengalami penurunan sebanyak 4.788 orang atau sebesar 0,34%.
Dalam kurun waktu 5 tahun, Total investasi Dana Pensiun masih mengalami pertumbuhan. Rata-rata pertumbuhan per tahun total investasi Dana Pensiun adalah sebesar 10,76%. Namun demikian, apabila dibandingkan tahun sebelumnya, total investasi Dana Pensiun hanya tumbuh sebesar 2,27% dari Rp255,28 triliun di tahun 2017 menjadi sebesar Rp261,07 Triliun di tahun 2018.
Investasi Dana Pensiun masih didominasi oleh instrumen pasar modal, yaitu oleh Surat Berharga Negara, Obligasi/Sukuk, Saham dan Reksadana dengan porsi masing-masing sebesar 22,94%, 22,22%, 11,89% dan 6,28% dari total investasi dana pensiun. Guna menjaga tingkat likuiditas dana pensiun menempatkan investasi di deposito sebesar Rp71,33 triliun atau 27,32% dari total investasi.
Sejalan dengan pertumbuhan investasi, total aset neto Dana Pensiun juga mengalami pertumbuhan. Rata-rata pertumbuhan per tahun aset neto Dana Pensiun selama kurun waktu 5 tahun adalah sebesar 10,67%. Namun demikian,
Within 5 years, pension funds tend to decrease by 35 pension funds from 267 pension funds in 2014 to 232 pension funds in 2018. At the end of 2018, pension funds were 232 pension funds, consisting of 164 EPF-DB, 44 EPF-DC and 24 FIPF.
In terms of membership, the total number of Pension Fund participants has increased from 4,455,712 people in 2017 to 4,635,074 people in 2018, up by 4.03%. The increase was due to an increase in membership in the Financial Institution Pension Fund (FIPF) which increased by 184,150 people or 6.03%. On the other hand, membership for Employer Pension Funds (EPF) decreased by 4,788 people or 0.34%.
Over the past 5 years, the total investment of the Pension Fund is still experiencing growth. The average annual growth over the past 5 years is 10.76%. However, compared to the previous year, the total investment only grew by 2.27% from IDR255.28 trillion in 2017 to IDR261.07 Trillion in 2018.
Pension Fund Investment is still dominated by capital market instruments, specifically Government Securities, Bonds / Sukuk, Shares and Mutual Funds with a portion of 22.94%, 22.22%, 11.89% and 6.28% of the total investment. In order to maintain the level of liquidity, pension funds place investments in deposits of Rp. 71.33 trillion or 27.32% of the total investment.
In line with investment growth, the total Pension Fund net assets also experienced growth. The average annual growth in net assets over a 5-year period is 10.67%. However, when compared to the previous
Oto
rita
s Ja
sa K
euan
gan
Ind
one
sia/
Indo
nesi
a Se
rvic
es A
utor
ity
04
apabila dibandingkan tahun sebelumnya, total aset neto Dana Pensiun hanya tumbuh sebesar 2,76% dari Rp260,82 Triliun di tahun 2017 menjadi sebesar Rp268,03 di tahun 2018.
Pada akhir tahun 2018, komposisi total aset neto berdasarkan program pensiun adalah sebagai berikut: Dana Pensiun Pemberi Kerja Program pensiun Manfaat Pasti sebesar Rp153,03 Triliun, Dana Pensiun Pemberi Kerja Program Pensiun Iuran Pasti sebesar Rp32,42 Triliun dan Dana Pensiun Lembaga Keuangan sebesar Rp82,58 Triliun.
Seiring peningkatan kebutuhan masyarakat terhadap produk dan layanan yang berbasis syariah, khususnya di industri Dana Pensiun, telah ditetapkan POJK nomor 33/POJK.05/2016 Tentang Penyelenggaraan Program Pensiun Berdasarkan Prinsip Syariah. Pada tahun 2018, terdapat 2 dana pensiun konvensional yang beralih menjadi program pensiun berdasarkan prinsip syariah, yaitu DPLK Bank Muamalat dan DPPK PPIP Dana Pensiun Rumah Sakit Islam Jakarta.
Pada akhir Desember 2018, total aset neto untuk kedua dana pensiun syariah adalah sebesar Rp1,54 triliun sementara total investasi sebesar Rp1,53 triliun. Terkait kepesertaan, total peserta untuk dana pensiun syariah baru mencapai sebanyak 128.021 orang.
Selanjutnya, data dan informasi lebih rinci terkait industri Dana Pensiun dapat dilihat lebih lanjut pada bagian ini.
Pada tahun 2018, terdapat 4 pengesahan dana pensiun yang baru, meliputi 1 DPPK- PPMP Mitsubishi Motors Krama Yudha Sales Indonesia, 1 DPPK-PPIP Duta Wacana dan 2 DPLK, yaitu DPLK Tokio Marine Life Indonesia dan DPLK Capital Life Indonesia. Adapun 6 DPPK-PPMP yang bubar terdiri dari DPPK Aventis Pharma Mp, DPPK Citra Lintas Indonesia, DPPK Karyawan Igasar, DPPK Garam, DPPK Indo Kordsa (d/h Branta Mulia), DPPK Multi Bintang Indonesia.
year, the Pension Fund’s total net assets grew by only 2.76% from Rp260.82 trillion in 2017 to Rp268.03 in 2018.
At the end of 2018, the total composition of net assets base on the pension plan is as follows: Defined Benefit Employer Pension Funds Rp153.03 Trillion, Defined Contribution Employer Pension Funds Rp32.42 Trillion and Financial Institution Pension Funds Rp82.58 Trillion .
In line with the increasing needs of the community for sharia-based products and services, particularly in the Pension Fund industry, POJK number 33 / POJK.05 / 2016 has been established concerning the Implementation of Pension Programs Based on Sharia Principles. In 2018, there were 2 conventional pension funds that were turned into a pension program based on sharia principles, namely the Bank Muamalat FIPF and the EPF-DC the Islamic Hospital in Jakarta.
At the end of December 2018, total net assets for both Islamic pension funds was Rp1.54 trillion while total investment was Rp1.53 trillion. Related to membership, the total participants for Islamic pension funds has only reached 128,021 people.
Furthermore, more detailed data and information related to the Pension Fund industry can be seen further in this section.
In 2018, there were 4 endorsements of new pension funds, namely EPF-DB Mitsubishi Motors Krama Yudha Indonesia Sales, EPF-DC Duta Wacana, FIPF Tokio Marine Life Indonesia and FIPF Capital Life Indonesia. Meanwhile, there were 6 EPF-DBs liquidated, namely EPF Aventis Pharma Mp, EPF Citra Lintas Indonesia, EPF Igasar, EPF Salt, EPF Indo Kordsa (formerly Branta Mulia), EPF Multi Bintang Indonesia. Furthermore, EPF-
A. Jumlah Dana Pensiun Number Of Pension Funds
Stat
isti
k D
ana
Pen
siun
201
8/P
ensi
on F
und
Stat
isti
cs 2
018
05
Selanjutnya, 1 DPPK-PPIP yang bubar terdiri dari DPPK Galva dan 1 DPLK yang dibubarkan adalah DPLK Bringin Jiwa Sejahtera.
Selain itu, terdapat 2 dana pensiun yang beralih ke dana pensiun yang menjalankan program pensiunnya berdasarkan prinsip syariah, yaitu DPLK Bank Muamalat dan DPPK PPIP Dana Pensiun Rumah Sakit Islam Jakarta.
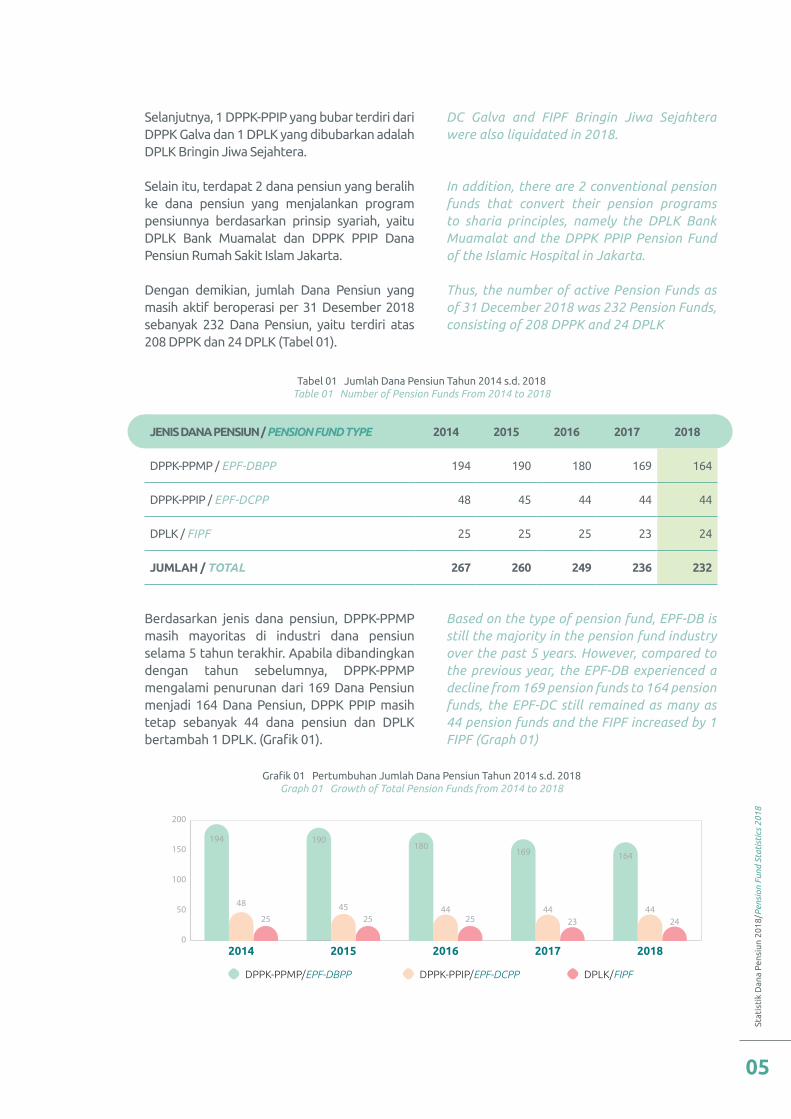
Dengan demikian, jumlah Dana Pensiun yang masih aktif beroperasi per 31 Desember 2018 sebanyak 232 Dana Pensiun, yaitu terdiri atas 208 DPPK dan 24 DPLK (Tabel 01).
Berdasarkan jenis dana pensiun, DPPK-PPMP masih mayoritas di industri dana pensiun selama 5 tahun terakhir. Apabila dibandingkan dengan tahun sebelumnya, DPPK-PPMP mengalami penurunan dari 169 Dana Pensiun menjadi 164 Dana Pensiun, DPPK PPIP masih tetap sebanyak 44 dana pensiun dan DPLK bertambah 1 DPLK. (Grafik 01).
DC Galva and FIPF Bringin Jiwa Sejahtera were also liquidated in 2018.
In addition, there are 2 conventional pension funds that convert their pension programs to sharia principles, namely the DPLK Bank Muamalat and the DPPK PPIP Pension Fund of the Islamic Hospital in Jakarta.
Thus, the number of active Pension Funds as of 31 December 2018 was 232 Pension Funds, consisting of 208 DPPK and 24 DPLK
Based on the type of pension fund, EPF-DB is still the majority in the pension fund industry over the past 5 years. However, compared to the previous year, the EPF-DB experienced a decline from 169 pension funds to 164 pension funds, the EPF-DC still remained as many as 44 pension funds and the FIPF increased by 1 FIPF (Graph 01)
JENIS DANA PENSIUN / PENSION FUND TYPE 2014 2015 2016 2017 2018
DPPK-PPMP / EPF-DBPP 194 190 180 169 164
DPPK-PPIP / EPF-DCPP 48 45 44 44 44
DPLK / FIPF 25 25 25 23 24
JUMLAH / TOTAL 267 260 249 236 232
Tabel 01 Jumlah Dana Pensiun Tahun 2014 s.d. 2018Table 01 Number of Pension Funds From 2014 to 2018
Grafik 01 Pertumbuhan Jumlah Dana Pensiun Tahun 2014 s.d. 2018Graph 01 Growth of Total Pension Funds from 2014 to 2018
0
50
100
150
200
48
25
190
4525
180
4425
169
4423
164
4424
194
2014 2015 2016 2017 2018
DPPK-PPMP/EPF-DBPP DPPK-PPIP/EPF-DCPP DPLK/FIPF
Oto
rita
s Ja
sa K
euan
gan
Ind
one
sia/
Indo
nesi
a Se
rvic
es A
utor
ity
06
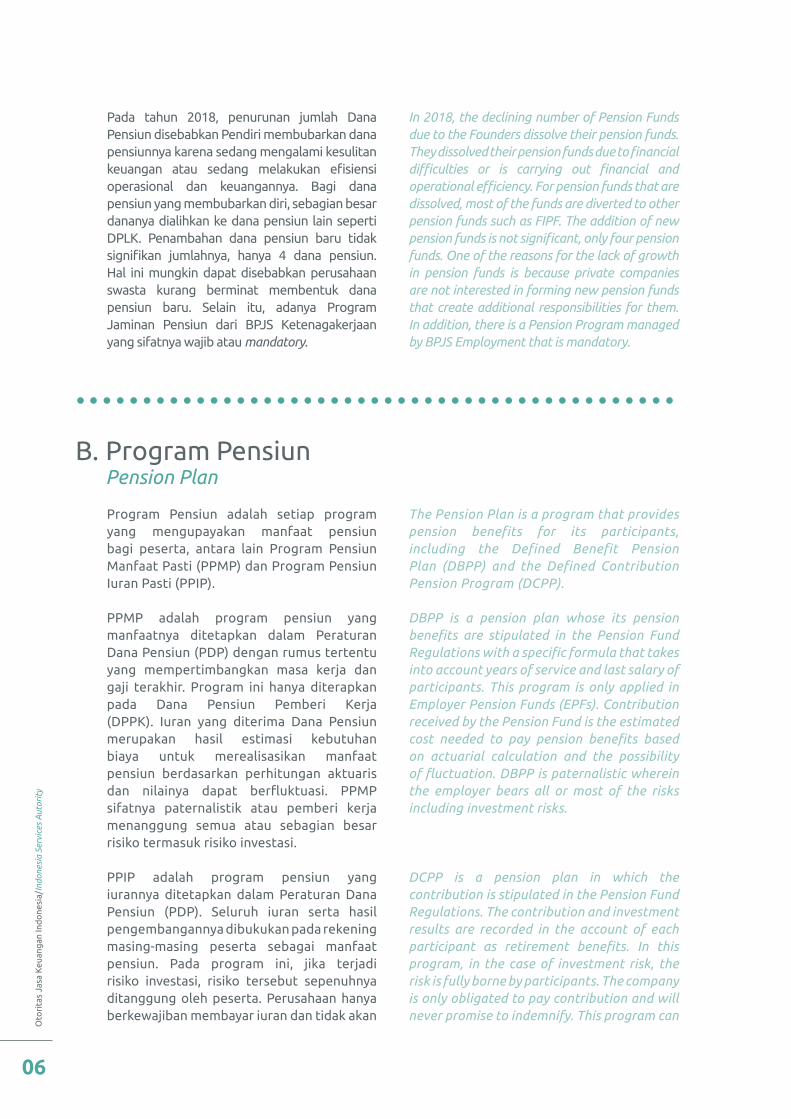
Pada tahun 2018, penurunan jumlah Dana Pensiun disebabkan Pendiri membubarkan dana pensiunnya karena sedang mengalami kesulitan keuangan atau sedang melakukan efisiensi operasional dan keuangannya. Bagi dana pensiun yang membubarkan diri, sebagian besar dananya dialihkan ke dana pensiun lain seperti DPLK. Penambahan dana pensiun baru tidak signifikan jumlahnya, hanya 4 dana pensiun. Hal ini mungkin dapat disebabkan perusahaan swasta kurang berminat membentuk dana pensiun baru. Selain itu, adanya Program Jaminan Pensiun dari BPJS Ketenagakerjaan yang sifatnya wajib atau mandatory.
Program Pensiun adalah setiap program yang mengupayakan manfaat pensiun bagi peserta, antara lain Program Pensiun Manfaat Pasti (PPMP) dan Program Pensiun Iuran Pasti (PPIP).
PPMP adalah program pensiun yang manfaatnya ditetapkan dalam Peraturan Dana Pensiun (PDP) dengan rumus tertentu yang mempertimbangkan masa kerja dan gaji terakhir. Program ini hanya diterapkan pada Dana Pensiun Pemberi Kerja (DPPK). Iuran yang diterima Dana Pensiun merupakan hasil estimasi kebutuhan biaya untuk merealisasikan manfaat pensiun berdasarkan perhitungan aktuaris dan nilainya dapat berfluktuasi. PPMP sifatnya paternalistik atau pemberi kerja menanggung semua atau sebagian besar risiko termasuk risiko investasi.
PPIP adalah program pensiun yang iurannya ditetapkan dalam Peraturan Dana Pensiun (PDP). Seluruh iuran serta hasil pengembangannya dibukukan pada rekening masing-masing peserta sebagai manfaat pensiun. Pada program ini, jika terjadi risiko investasi, risiko tersebut sepenuhnya ditanggung oleh peserta. Perusahaan hanya berkewajiban membayar iuran dan tidak akan
In 2018, the declining number of Pension Funds due to the Founders dissolve their pension funds. They dissolved their pension funds due to financial difficulties or is carrying out financial and operational efficiency. For pension funds that are dissolved, most of the funds are diverted to other pension funds such as FIPF. The addition of new pension funds is not significant, only four pension funds. One of the reasons for the lack of growth in pension funds is because private companies are not interested in forming new pension funds that create additional responsibilities for them. In addition, there is a Pension Program managed by BPJS Employment that is mandatory.
The Pension Plan is a program that provides pension benefits for its participants, including the Defined Benefit Pension Plan (DBPP) and the Defined Contribution Pension Program (DCPP).
DBPP is a pension plan whose its pension benefits are stipulated in the Pension Fund Regulations with a specific formula that takes into account years of service and last salary of participants. This program is only applied in Employer Pension Funds (EPFs). Contribution received by the Pension Fund is the estimated cost needed to pay pension benefits based on actuarial calculation and the possibility of fluctuation. DBPP is paternalistic wherein the employer bears all or most of the risks including investment risks.
DCPP is a pension plan in which the contribution is stipulated in the Pension Fund Regulations. The contribution and investment results are recorded in the account of each participant as retirement benefits. In this program, in the case of investment risk, the risk is fully borne by participants. The company is only obligated to pay contribution and will never promise to indemnify. This program can
B. Program Pensiun Pension Plan
Stat
isti
k D
ana
Pen
siun
201
8/P
ensi
on F
und
Stat
isti
cs 2
018
07
Dalam kurun 5 tahun, pertumbuhan kepesertaan Dana Pensiun masih menunjukan tren meningkat meskipun tidak dalam jumlah yang signifikan. Berdasarkan tabel 02 di bawah, apabila dibandingkan dengan tahun sebelumnya, jumlah peserta Dana Pensiun pada
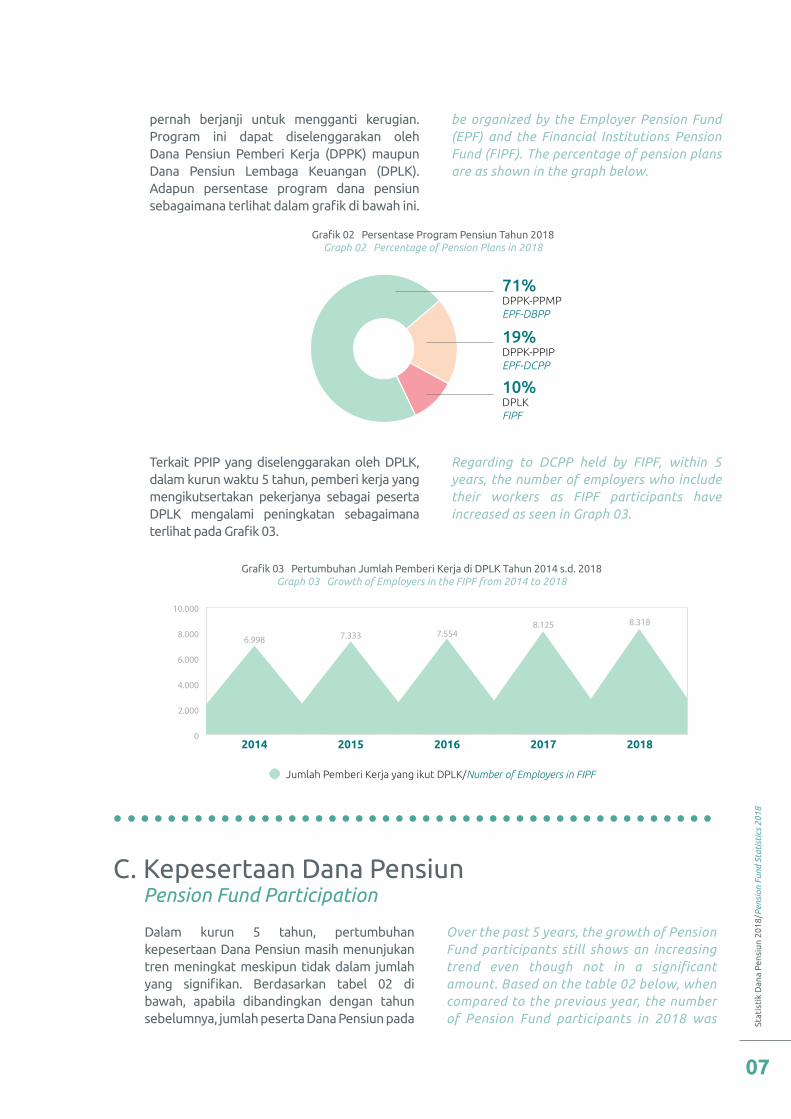
pernah berjanji untuk mengganti kerugian. Program ini dapat diselenggarakan oleh Dana Pensiun Pemberi Kerja (DPPK) maupun Dana Pensiun Lembaga Keuangan (DPLK). Adapun persentase program dana pensiun sebagaimana terlihat dalam grafik di bawah ini.
Terkait PPIP yang diselenggarakan oleh DPLK, dalam kurun waktu 5 tahun, pemberi kerja yang mengikutsertakan pekerjanya sebagai peserta DPLK mengalami peningkatan sebagaimana terlihat pada Grafik 03.
Over the past 5 years, the growth of Pension Fund participants still shows an increasing trend even though not in a significant amount. Based on the table 02 below, when compared to the previous year, the number of Pension Fund participants in 2018 was
be organized by the Employer Pension Fund (EPF) and the Financial Institutions Pension Fund (FIPF). The percentage of pension plans are as shown in the graph below.
Regarding to DCPP held by FIPF, within 5 years, the number of employers who include their workers as FIPF participants have increased as seen in Graph 03.
C. Kepesertaan Dana Pensiun Pension Fund Participation
Grafik 02 Persentase Program Pensiun Tahun 2018Graph 02 Percentage of Pension Plans in 2018
71%DPPK-PPMPEPF-DBPP
19%DPPK-PPIPEPF-DCPP
10%DPLKFIPF
Grafik 03 Pertumbuhan Jumlah Pemberi Kerja di DPLK Tahun 2014 s.d. 2018Graph 03 Growth of Employers in the FIPF from 2014 to 2018
2014 2015 2016 2017 20180
2.000
4.000
6.000
8.000
10.000
6.998 7.333 7.5548.125 8.318
Jumlah Pemberi Kerja yang ikut DPLK/Number of Employers in FIPF
Oto
rita
s Ja
sa K
euan
gan
Ind
one
sia/
Indo
nesi
a Se
rvic
es A
utor
ity
08
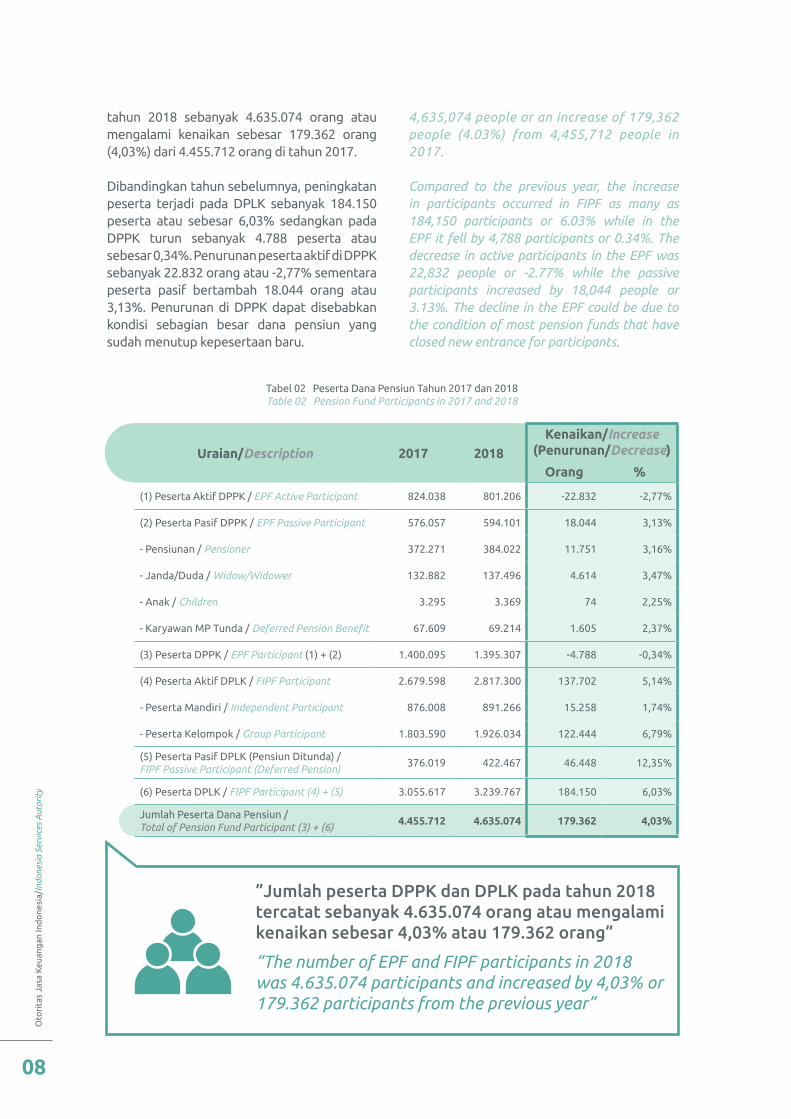
tahun 2018 sebanyak 4.635.074 orang atau mengalami kenaikan sebesar 179.362 orang (4,03%) dari 4.455.712 orang di tahun 2017.
Dibandingkan tahun sebelumnya, peningkatan peserta terjadi pada DPLK sebanyak 184.150 peserta atau sebesar 6,03% sedangkan pada DPPK turun sebanyak 4.788 peserta atau sebesar 0,34%. Penurunan peserta aktif di DPPK sebanyak 22.832 orang atau -2,77% sementara peserta pasif bertambah 18.044 orang atau 3,13%. Penurunan di DPPK dapat disebabkan kondisi sebagian besar dana pensiun yang sudah menutup kepesertaan baru.
4,635,074 people or an increase of 179,362 people (4.03%) from 4,455,712 people in 2017.
Compared to the previous year, the increase in participants occurred in FIPF as many as 184,150 participants or 6.03% while in the EPF it fell by 4,788 participants or 0.34%. The decrease in active participants in the EPF was 22,832 people or -2.77% while the passive participants increased by 18,044 people or 3.13%. The decline in the EPF could be due to the condition of most pension funds that have closed new entrance for participants.
Tabel 02 Peserta Dana Pensiun Tahun 2017 dan 2018Table 02 Pension Fund Participants in 2017 and 2018
Uraian/Description 2017 2018Kenaikan/Increase
(Penurunan/Decrease)
Orang %
(1) Peserta Aktif DPPK / EPF Active Participant 824.038 801.206 -22.832 -2,77%
(2) Peserta Pasif DPPK / EPF Passive Participant 576.057 594.101 18.044 3,13%
- Pensiunan / Pensioner 372.271 384.022 11.751 3,16%
- Janda/Duda / Widow/Widower 132.882 137.496 4.614 3,47%
- Anak / Children 3.295 3.369 74 2,25%
- Karyawan MP Tunda / Deferred Pension Benefit 67.609 69.214 1.605 2,37%
(3) Peserta DPPK / EPF Participant (1) + (2) 1.400.095 1.395.307 -4.788 -0,34%
(4) Peserta Aktif DPLK / FIPF Participant 2.679.598 2.817.300 137.702 5,14%
- Peserta Mandiri / Independent Participant 876.008 891.266 15.258 1,74%
- Peserta Kelompok / Group Participant 1.803.590 1.926.034 122.444 6,79%
(5) Peserta Pasif DPLK (Pensiun Ditunda) /FIPF Passive Participant (Deferred Pension)
376.019 422.467 46.448 12,35%
(6) Peserta DPLK / FIPF Participant (4) + (5) 3.055.617 3.239.767 184.150 6,03%
Jumlah Peserta Dana Pensiun /Total of Pension Fund Participant (3) + (6)
4.455.712 4.635.074 179.362 4,03%
”Jumlah peserta DPPK dan DPLK pada tahun 2018 tercatat sebanyak 4.635.074 orang atau mengalami kenaikan sebesar 4,03% atau 179.362 orang”
“The number of EPF and FIPF participants in 2018 was 4.635.074 participants and increased by 4,03% or 179.362 participants from the previous year”
Stat
isti
k D
ana
Pen
siun
201
8/P
ensi
on F
und
Stat
isti
cs 2
018
09
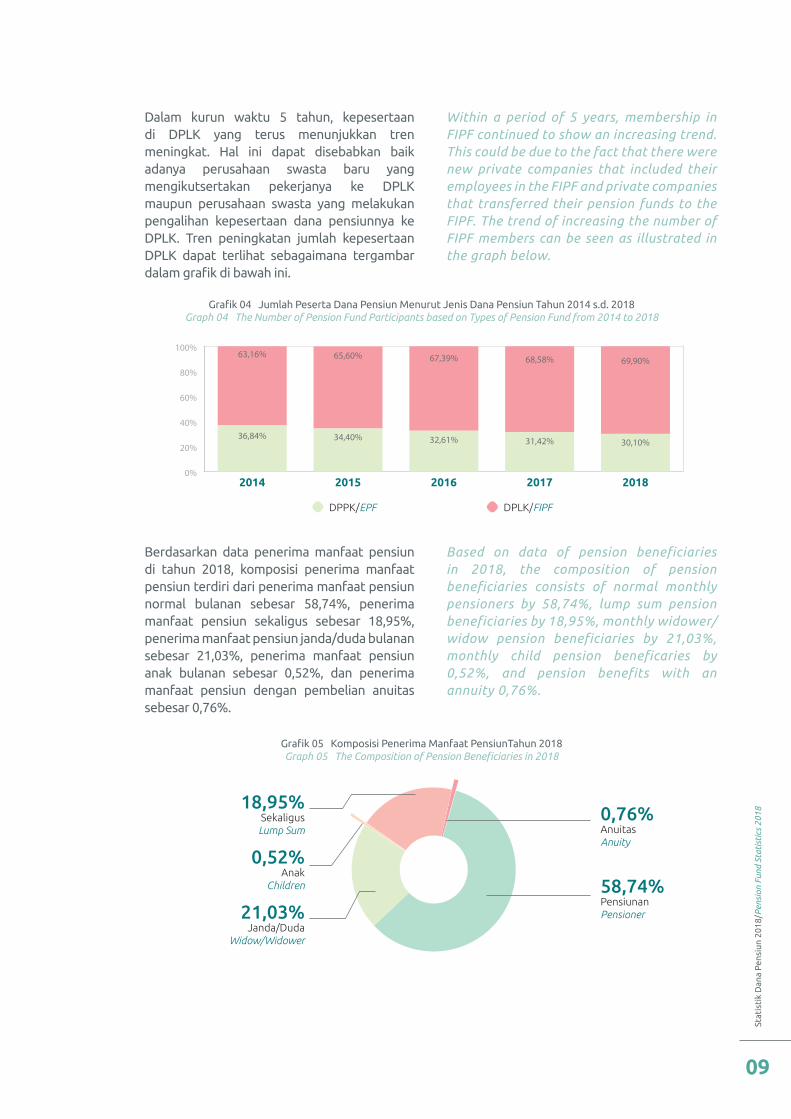
Dalam kurun waktu 5 tahun, kepesertaan di DPLK yang terus menunjukkan tren meningkat. Hal ini dapat disebabkan baik adanya perusahaan swasta baru yang mengikutsertakan pekerjanya ke DPLK maupun perusahaan swasta yang melakukan pengalihan kepesertaan dana pensiunnya ke DPLK. Tren peningkatan jumlah kepesertaan DPLK dapat terlihat sebagaimana tergambar dalam grafik di bawah ini.
Berdasarkan data penerima manfaat pensiun di tahun 2018, komposisi penerima manfaat pensiun terdiri dari penerima manfaat pensiun normal bulanan sebesar 58,74%, penerima manfaat pensiun sekaligus sebesar 18,95%, penerima manfaat pensiun janda/duda bulanan sebesar 21,03%, penerima manfaat pensiun anak bulanan sebesar 0,52%, dan penerima manfaat pensiun dengan pembelian anuitas sebesar 0,76%.
Within a period of 5 years, membership in FIPF continued to show an increasing trend. This could be due to the fact that there were new private companies that included their employees in the FIPF and private companies that transferred their pension funds to the FIPF. The trend of increasing the number of FIPF members can be seen as illustrated in the graph below.
Based on data of pension beneficiaries in 2018, the composition of pension beneficiaries consists of normal monthly pensioners by 58,74%, lump sum pension beneficiaries by 18,95%, monthly widower/widow pension beneficiaries by 21,03%, monthly child pension beneficaries by 0,52%, and pension benefits with an annuity 0,76%.
Grafik 04 Jumlah Peserta Dana Pensiun Menurut Jenis Dana Pensiun Tahun 2014 s.d. 2018Graph 04 The Number of Pension Fund Participants based on Types of Pension Fund from 2014 to 2018
Grafik 05 Komposisi Penerima Manfaat PensiunTahun 2018Graph 05 The Composition of Pension Beneficiaries in 2018
2014 2015 2016 2017 20180%
20%
40%
60%
80%
100%
36,84% 34,40% 32,61% 31,42% 30,10%
63,16% 65,60% 67,39% 68,58% 69,90%
DPPK/EPF DPLK/FIPF
0,76%AnuitasAnuity
58,74%PensiunanPensioner
18,95%Sekaligus
Lump Sum
0,52%Anak
Children
21,03%Janda/Duda
Widow/Widower
Oto
rita
s Ja
sa K
euan
gan
Ind
one
sia/
Indo
nesi
a Se
rvic
es A
utor
ity
10
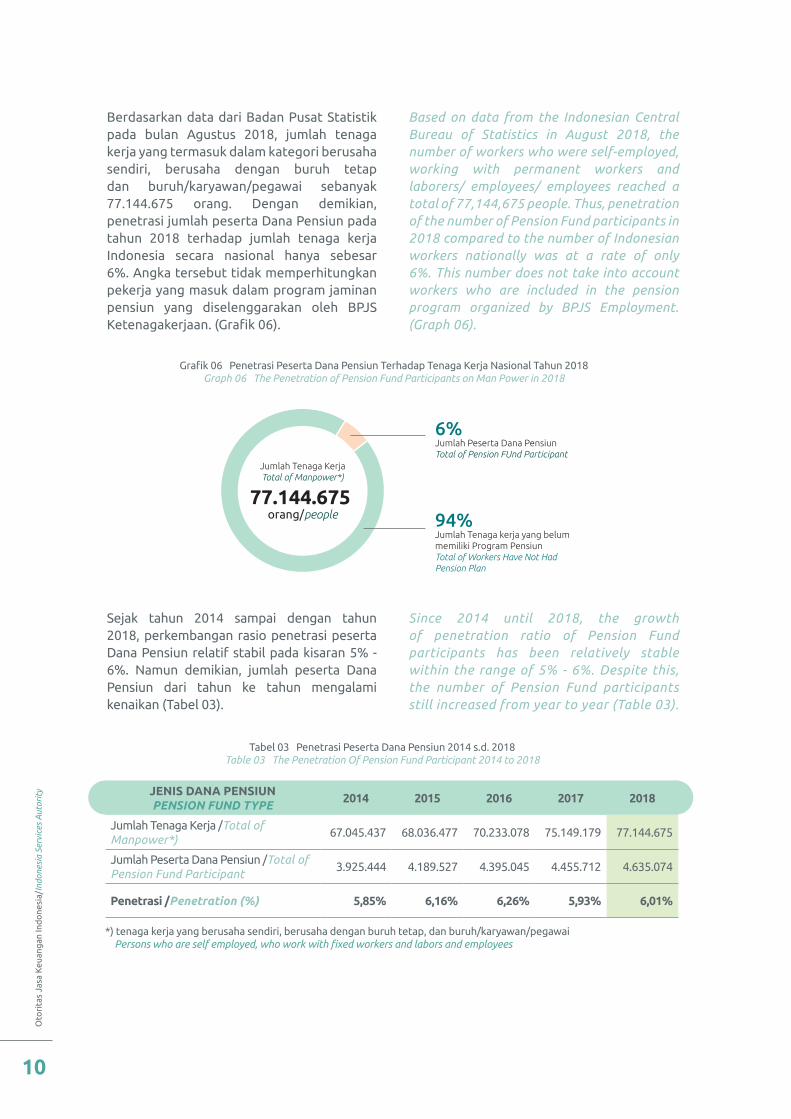
Berdasarkan data dari Badan Pusat Statistik pada bulan Agustus 2018, jumlah tenaga kerja yang termasuk dalam kategori berusaha sendiri, berusaha dengan buruh tetap dan buruh/karyawan/pegawai sebanyak 77.144.675 orang. Dengan demikian, penetrasi jumlah peserta Dana Pensiun pada tahun 2018 terhadap jumlah tenaga kerja Indonesia secara nasional hanya sebesar 6%. Angka tersebut tidak memperhitungkan pekerja yang masuk dalam program jaminan pensiun yang diselenggarakan oleh BPJS Ketenagakerjaan. (Grafik 06).
Sejak tahun 2014 sampai dengan tahun 2018, perkembangan rasio penetrasi peserta Dana Pensiun relatif stabil pada kisaran 5% - 6%. Namun demikian, jumlah peserta Dana Pensiun dari tahun ke tahun mengalami kenaikan (Tabel 03).
Based on data from the Indonesian Central Bureau of Statistics in August 2018, the number of workers who were self-employed, working with permanent workers and laborers/ employees/ employees reached a total of 77,144,675 people. Thus, penetration of the number of Pension Fund participants in 2018 compared to the number of Indonesian workers nationally was at a rate of only 6%. This number does not take into account workers who are included in the pension program organized by BPJS Employment. (Graph 06).
Since 2014 until 2018, the growth of penetration ratio of Pension Fund participants has been relatively stable within the range of 5% - 6%. Despite this, the number of Pension Fund participants still increased from year to year (Table 03).
Grafik 06 Penetrasi Peserta Dana Pensiun Terhadap Tenaga Kerja Nasional Tahun 2018Graph 06 The Penetration of Pension Fund Participants on Man Power in 2018
6%Jumlah Peserta Dana PensiunTotal of Pension FUnd Participant
94%Jumlah Tenaga kerja yang belummemiliki Program PensiunTotal of Workers Have Not HadPension Plan
77.144.675 orang/people
Jumlah Tenaga KerjaTotal of Manpower*)
JENIS DANA PENSIUNPENSION FUND TYPE
2014 2015 2016 2017 2018
Jumlah Tenaga Kerja /Total of Manpower*)
67.045.437 68.036.477 70.233.078 75.149.179 77.144.675
Jumlah Peserta Dana Pensiun /Total of Pension Fund Participant
3.925.444 4.189.527 4.395.045 4.455.712 4.635.074
Penetrasi /Penetration (%) 5,85% 6,16% 6,26% 5,93% 6,01%
*) tenaga kerja yang berusaha sendiri, berusaha dengan buruh tetap, dan buruh/karyawan/pegawai Persons who are self employed, who work with fixed workers and labors and employees
Tabel 03 Penetrasi Peserta Dana Pensiun 2014 s.d. 2018Table 03 The Penetration Of Pension Fund Participant 2014 to 2018
Stat
isti
k D
ana
Pen
siun
201
8/P
ensi
on F
und
Stat
isti
cs 2
018
11
Grafik 07 Distribusi Aset Bersih Dana Pensiun Tahun 2018 Graph 07 Distribution of Pension Fund Net Assets 2018
PPMP PPIP DPLK TOTAL0
50
100
150
200
250
300
154,66 153,03
30,81 32,42
75,36 82,58
260,82 268,03
2017 2018
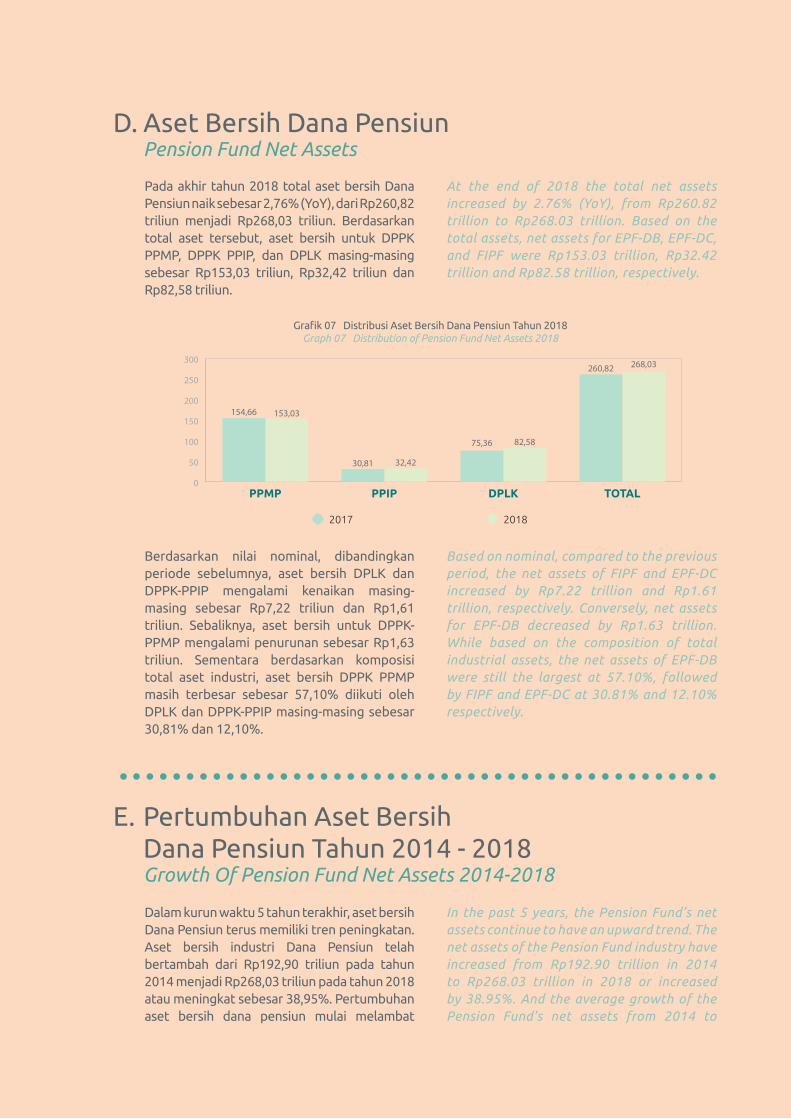
Pada akhir tahun 2018 total aset bersih Dana Pensiun naik sebesar 2,76% (YoY), dari Rp260,82 triliun menjadi Rp268,03 triliun. Berdasarkan total aset tersebut, aset bersih untuk DPPK PPMP, DPPK PPIP, dan DPLK masing-masing sebesar Rp153,03 triliun, Rp32,42 triliun dan Rp82,58 triliun.
Berdasarkan nilai nominal, dibandingkan periode sebelumnya, aset bersih DPLK dan DPPK-PPIP mengalami kenaikan masing-masing sebesar Rp7,22 triliun dan Rp1,61 triliun. Sebaliknya, aset bersih untuk DPPK-PPMP mengalami penurunan sebesar Rp1,63 triliun. Sementara berdasarkan komposisi total aset industri, aset bersih DPPK PPMP masih terbesar sebesar 57,10% diikuti oleh DPLK dan DPPK-PPIP masing-masing sebesar 30,81% dan 12,10%.
At the end of 2018 the total net assets increased by 2.76% (YoY), from Rp260.82 trillion to Rp268.03 trillion. Based on the total assets, net assets for EPF-DB, EPF-DC, and FIPF were Rp153.03 trillion, Rp32.42 trillion and Rp82.58 trillion, respectively.
Based on nominal, compared to the previous period, the net assets of FIPF and EPF-DC increased by Rp7.22 trillion and Rp1.61 trillion, respectively. Conversely, net assets for EPF-DB decreased by Rp1.63 trillion. While based on the composition of total industrial assets, the net assets of EPF-DB were still the largest at 57.10%, followed by FIPF and EPF-DC at 30.81% and 12.10% respectively.
D. Aset Bersih Dana Pensiun Pension Fund Net Assets
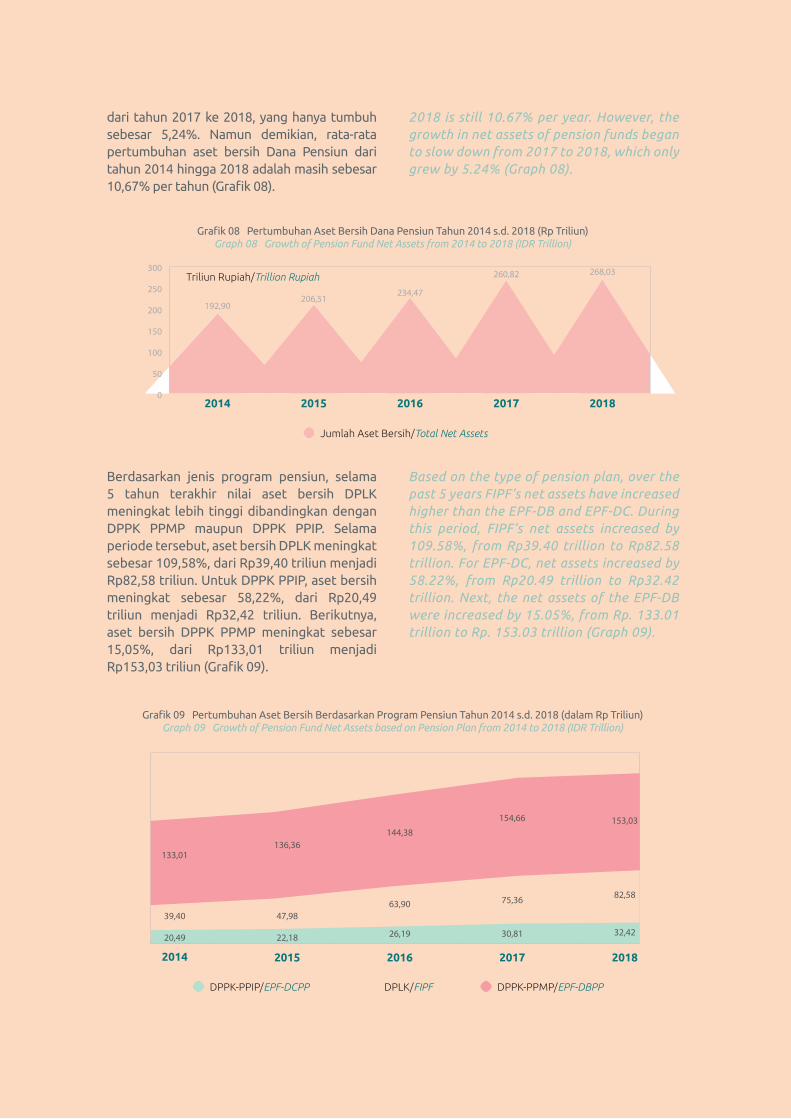
Dalam kurun waktu 5 tahun terakhir, aset bersih Dana Pensiun terus memiliki tren peningkatan. Aset bersih industri Dana Pensiun telah bertambah dari Rp192,90 triliun pada tahun 2014 menjadi Rp268,03 triliun pada tahun 2018 atau meningkat sebesar 38,95%. Pertumbuhan aset bersih dana pensiun mulai melambat
In the past 5 years, the Pension Fund’s net assets continue to have an upward trend. The net assets of the Pension Fund industry have increased from Rp192.90 trillion in 2014 to Rp268.03 trillion in 2018 or increased by 38.95%. And the average growth of the Pension Fund’s net assets from 2014 to
E. Pertumbuhan Aset Bersih Dana Pensiun Tahun 2014 - 2018 Growth Of Pension Fund Net Assets 2014-2018
Oto
rita
s Ja
sa K
euan
gan
Ind
one
sia/
Indo
nesi
a Se
rvic
es A
utor
ity
12
dari tahun 2017 ke 2018, yang hanya tumbuh sebesar 5,24%. Namun demikian, rata-rata pertumbuhan aset bersih Dana Pensiun dari tahun 2014 hingga 2018 adalah masih sebesar 10,67% per tahun (Grafik 08).
2018 is still 10.67% per year. However, the growth in net assets of pension funds began to slow down from 2017 to 2018, which only grew by 5.24% (Graph 08).
Grafik 08 Pertumbuhan Aset Bersih Dana Pensiun Tahun 2014 s.d. 2018 (Rp Triliun) Graph 08 Growth of Pension Fund Net Assets from 2014 to 2018 (IDR Trillion)
Grafik 09 Pertumbuhan Aset Bersih Berdasarkan Program Pensiun Tahun 2014 s.d. 2018 (dalam Rp Triliun) Graph 09 Growth of Pension Fund Net Assets based on Pension Plan from 2014 to 2018 (IDR Trillion)
2014 2015 2016 2017 20180
50
100
150
200
300
250
192,90206,51
234,47
260,82 268,03
Jumlah Aset Bersih/Total Net Assets
Triliun Rupiah/Trillion Rupiah
133,01
39,40
20,49
136,36
47,98
22,18
144,38
63,90
26,19
154,66
75,36
30,81
153,03
82,58
32,42
2014 2015 2016 2017 2018
DPPK-PPIP/EPF-DCPP DPLK/FIPF DPPK-PPMP/EPF-DBPP
Berdasarkan jenis program pensiun, selama 5 tahun terakhir nilai aset bersih DPLK meningkat lebih tinggi dibandingkan dengan DPPK PPMP maupun DPPK PPIP. Selama periode tersebut, aset bersih DPLK meningkat sebesar 109,58%, dari Rp39,40 triliun menjadi Rp82,58 triliun. Untuk DPPK PPIP, aset bersih meningkat sebesar 58,22%, dari Rp20,49 triliun menjadi Rp32,42 triliun. Berikutnya, aset bersih DPPK PPMP meningkat sebesar 15,05%, dari Rp133,01 triliun menjadi Rp153,03 triliun (Grafik 09).
Based on the type of pension plan, over the past 5 years FIPF’s net assets have increased higher than the EPF-DB and EPF-DC. During this period, FIPF’s net assets increased by 109.58%, from Rp39.40 trillion to Rp82.58 trillion. For EPF-DC, net assets increased by 58.22%, from Rp20.49 trillion to Rp32.42 trillion. Next, the net assets of the EPF-DB were increased by 15.05%, from Rp. 133.01 trillion to Rp. 153.03 trillion (Graph 09).
Stat
isti
k D
ana
Pen
siun
201
8/P
ensi
on F
und
Stat
isti
cs 2
018
13
Grafik 10 Jumlah Dana Pensiun Berdasarkan Grup Tahun 2018 Graph 10 Number of Pension Funds Based on Group in 2018
22,84% | 53Grup IGroup I
10,34% | 24Grup IIGroup II
29,31% | 68Grup IIIGroup III
37,50% | 87Grup IVGroup IV
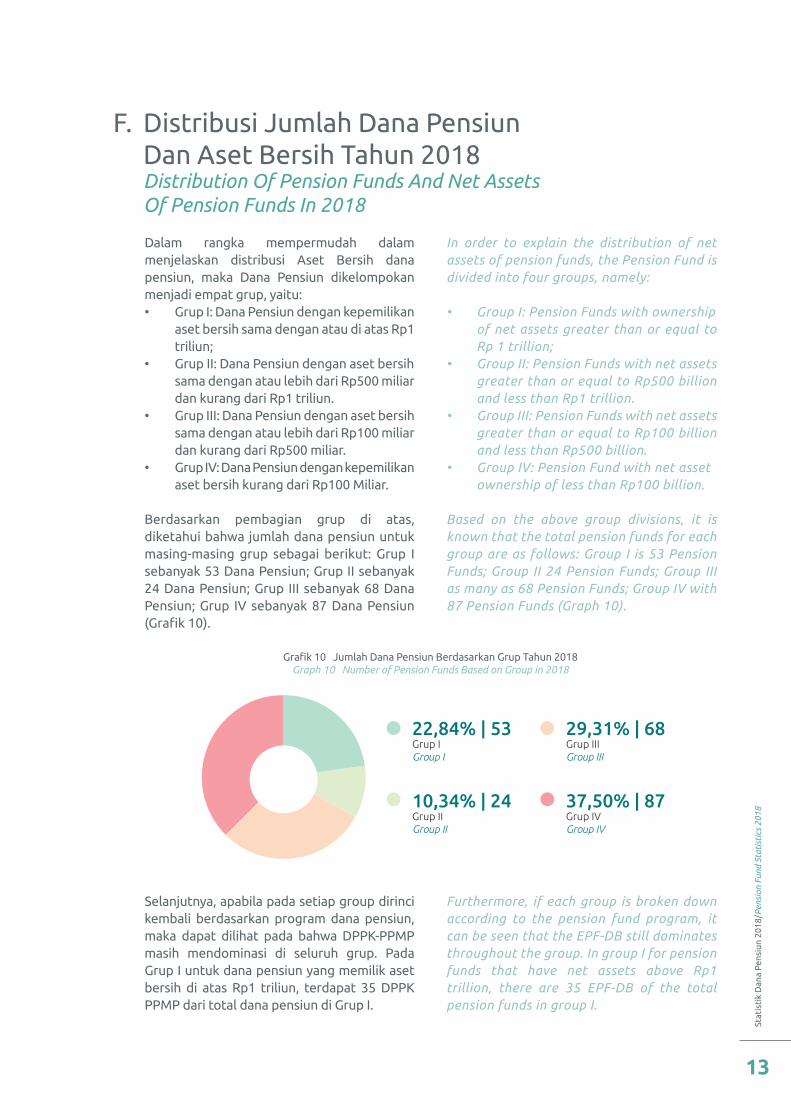
Dalam rangka mempermudah dalam menjelaskan distribusi Aset Bersih dana pensiun, maka Dana Pensiun dikelompokan menjadi empat grup, yaitu: • Grup I: Dana Pensiun dengan kepemilikan
aset bersih sama dengan atau di atas Rp1 triliun;
• Grup II: Dana Pensiun dengan aset bersih sama dengan atau lebih dari Rp500 miliar dan kurang dari Rp1 triliun.
• Grup III: Dana Pensiun dengan aset bersih sama dengan atau lebih dari Rp100 miliar dan kurang dari Rp500 miliar.
• Grup IV: Dana Pensiun dengan kepemilikan aset bersih kurang dari Rp100 Miliar.
Berdasarkan pembagian grup di atas, diketahui bahwa jumlah dana pensiun untuk masing-masing grup sebagai berikut: Grup I sebanyak 53 Dana Pensiun; Grup II sebanyak 24 Dana Pensiun; Grup III sebanyak 68 Dana Pensiun; Grup IV sebanyak 87 Dana Pensiun (Grafik 10).
Selanjutnya, apabila pada setiap group dirinci kembali berdasarkan program dana pensiun, maka dapat dilihat pada bahwa DPPK-PPMP masih mendominasi di seluruh grup. Pada Grup I untuk dana pensiun yang memilik aset bersih di atas Rp1 triliun, terdapat 35 DPPK PPMP dari total dana pensiun di Grup I.
In order to explain the distribution of net assets of pension funds, the Pension Fund is divided into four groups, namely:
• Group I: Pension Funds with ownership of net assets greater than or equal to Rp 1 trillion;
• Group II: Pension Funds with net assets greater than or equal to Rp500 billion and less than Rp1 trillion.
• Group III: Pension Funds with net assets greater than or equal to Rp100 billion and less than Rp500 billion.
• Group IV: Pension Fund with net asset ownership of less than Rp100 billion.
Based on the above group divisions, it is known that the total pension funds for each group are as follows: Group I is 53 Pension Funds; Group II 24 Pension Funds; Group III as many as 68 Pension Funds; Group IV with 87 Pension Funds (Graph 10).
Furthermore, if each group is broken down according to the pension fund program, it can be seen that the EPF-DB still dominates throughout the group. In group I for pension funds that have net assets above Rp1 trillion, there are 35 EPF-DB of the total pension funds in group I.
F. Distribusi Jumlah Dana Pensiun Dan Aset Bersih Tahun 2018 Distribution Of Pension Funds And Net Assets Of Pension Funds In 2018
Oto
rita
s Ja
sa K
euan
gan
Ind
one
sia/
Indo
nesi
a Se
rvic
es A
utor
ity
14
Grafik 11 Program Dana Pensiun Berdasarkan Grup Tahun 2018 Graph 11 Pension Fund Programs Based on Group in 2018
0
20
40
60
80
100
Grup I/Group I Grup II/Group II Grup III/Group III Grup IV/Group IV
DPLK/FIPF 11
7
35
4
3
17
2
16
50
7
18
62
PPIP/DCPP
PPMP/DBPP
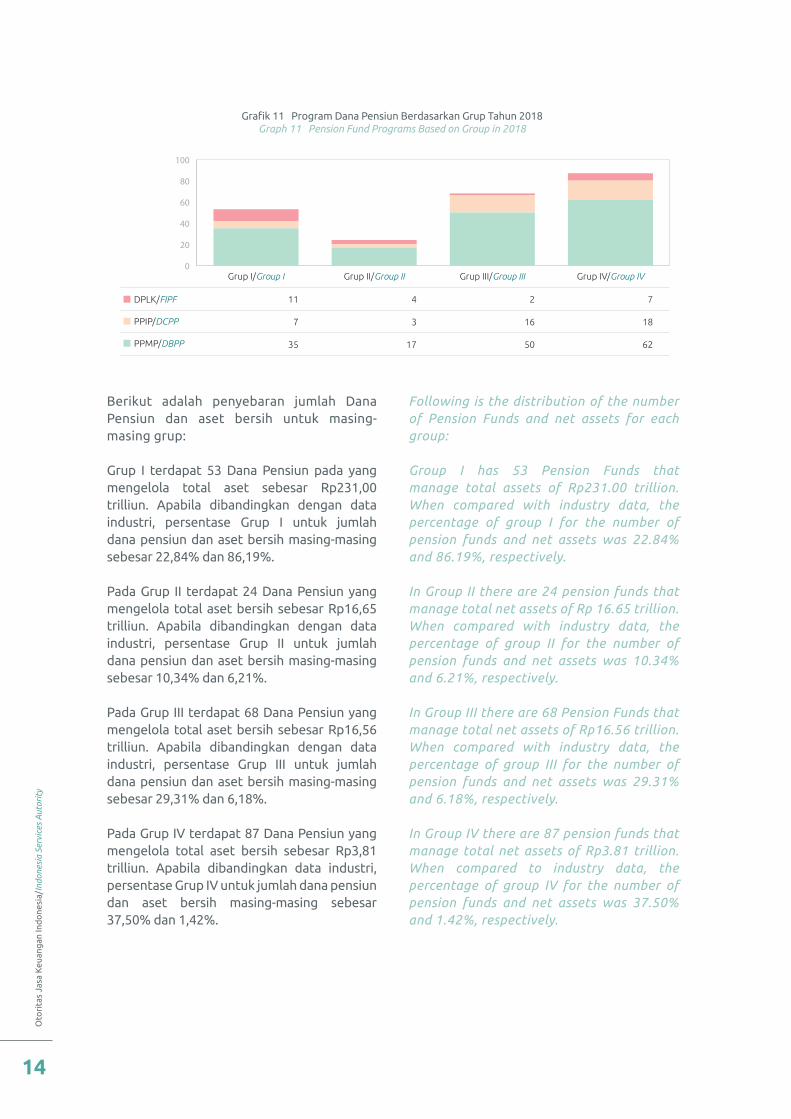
Berikut adalah penyebaran jumlah Dana Pensiun dan aset bersih untuk masing-masing grup:
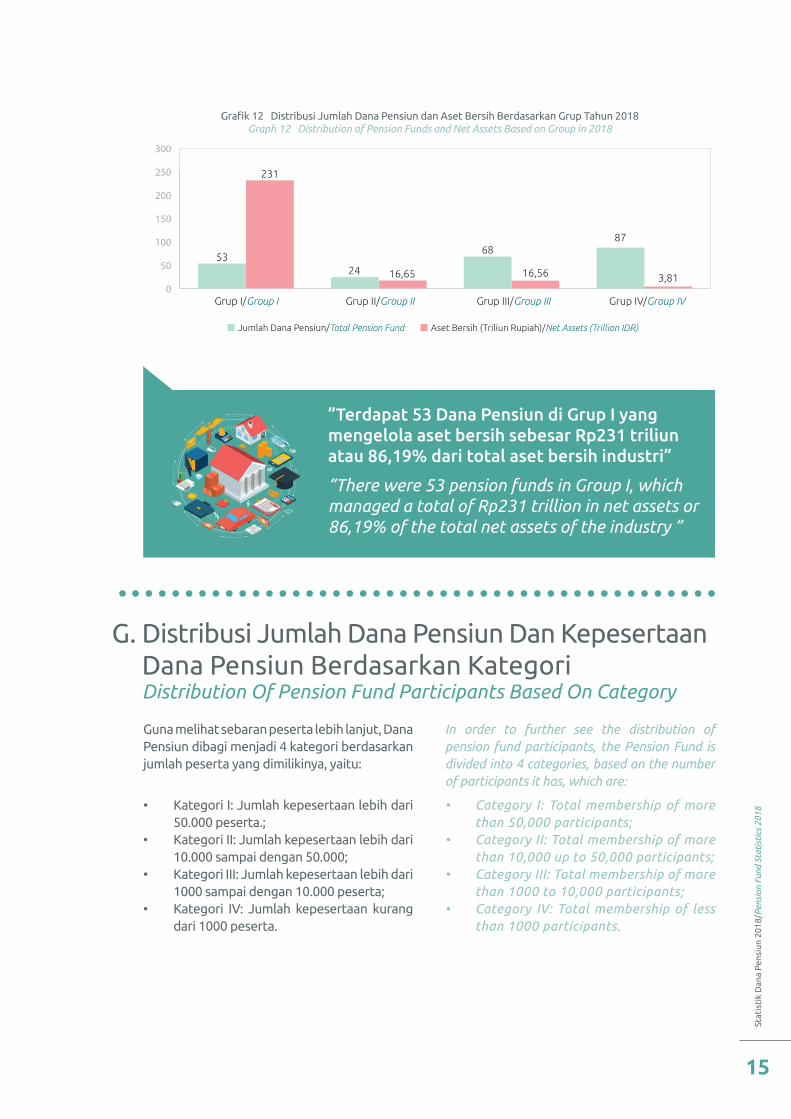
Grup I terdapat 53 Dana Pensiun pada yang mengelola total aset sebesar Rp231,00 trilliun. Apabila dibandingkan dengan data industri, persentase Grup I untuk jumlah dana pensiun dan aset bersih masing-masing sebesar 22,84% dan 86,19%.
Pada Grup II terdapat 24 Dana Pensiun yang mengelola total aset bersih sebesar Rp16,65 trilliun. Apabila dibandingkan dengan data industri, persentase Grup II untuk jumlah dana pensiun dan aset bersih masing-masing sebesar 10,34% dan 6,21%.
Pada Grup III terdapat 68 Dana Pensiun yang mengelola total aset bersih sebesar Rp16,56 trilliun. Apabila dibandingkan dengan data industri, persentase Grup III untuk jumlah dana pensiun dan aset bersih masing-masing sebesar 29,31% dan 6,18%.
Pada Grup IV terdapat 87 Dana Pensiun yang mengelola total aset bersih sebesar Rp3,81 trilliun. Apabila dibandingkan data industri, persentase Grup IV untuk jumlah dana pensiun dan aset bersih masing-masing sebesar 37,50% dan 1,42%.
Following is the distribution of the number of Pension Funds and net assets for each group:
Group I has 53 Pension Funds that manage total assets of Rp231.00 trillion. When compared with industry data, the percentage of group I for the number of pension funds and net assets was 22.84% and 86.19%, respectively.
In Group II there are 24 pension funds that manage total net assets of Rp 16.65 trillion. When compared with industry data, the percentage of group II for the number of pension funds and net assets was 10.34% and 6.21%, respectively.
In Group III there are 68 Pension Funds that manage total net assets of Rp16.56 trillion. When compared with industry data, the percentage of group III for the number of pension funds and net assets was 29.31% and 6.18%, respectively.
In Group IV there are 87 pension funds that manage total net assets of Rp3.81 trillion. When compared to industry data, the percentage of group IV for the number of pension funds and net assets was 37.50% and 1.42%, respectively.
Stat
isti
k D
ana
Pen
siun
201
8/P
ensi
on F
und
Stat
isti
cs 2
018
15
Grafik 12 Distribusi Jumlah Dana Pensiun dan Aset Bersih Berdasarkan Grup Tahun 2018 Graph 12 Distribution of Pension Funds and Net Assets Based on Group in 2018
Jumlah Dana Pensiun/Total Pension Fund Aset Bersih (Triliun Rupiah)/Net Assets (Trillion IDR)
Grup I/Group I Grup II/Group II Grup III/Group III Grup IV/Group IV0
50
100
150
200
250
300
53
231
24 16,65
68
16,56
87
3,81
”Terdapat 53 Dana Pensiun di Grup I yang mengelola aset bersih sebesar Rp231 triliun atau 86,19% dari total aset bersih industri”
“There were 53 pension funds in Group I, which managed a total of Rp231 trillion in net assets or 86,19% of the total net assets of the industry ”
Guna melihat sebaran peserta lebih lanjut, Dana Pensiun dibagi menjadi 4 kategori berdasarkan jumlah peserta yang dimilikinya, yaitu:
• Kategori I: Jumlah kepesertaan lebih dari 50.000 peserta.;
• Kategori II: Jumlah kepesertaan lebih dari 10.000 sampai dengan 50.000;
• Kategori III: Jumlah kepesertaan lebih dari 1000 sampai dengan 10.000 peserta;
• Kategori IV: Jumlah kepesertaan kurang dari 1000 peserta.
In order to further see the distribution of pension fund participants, the Pension Fund is divided into 4 categories, based on the number of participants it has, which are:
• Category I: Total membership of more than 50,000 participants;
• Category II: Total membership of more than 10,000 up to 50,000 participants;
• Category III: Total membership of more than 1000 to 10,000 participants;
• Category IV: Total membership of less than 1000 participants.
G. Distribusi Jumlah Dana Pensiun Dan Kepesertaan Dana Pensiun Berdasarkan Kategori Distribution Of Pension Fund Participants Based On Category
Oto
rita
s Ja
sa K
euan
gan
Ind
one
sia/
Indo
nesi
a Se
rvic
es A
utor
ity
16
Grafik 13 Jumlah Dana Pensiun Berdasarkan kategori Peserta tahun 2018 Graph 13 Number of Pension Fund Programs Based on Participant Category in 2018
Jumlah Dana Pensiun/Total Pension Fund Peserta Dana Pensiun (x10.000)/Pension Fund Participants (x10.000)
Kategori I/Category I Kategori II/Category II Kategori III/Category III Kategori IV/Category IV0
50
150
250
350400450
100
200
300
16
375,37
23 50,60
105
33,28
88
4,26
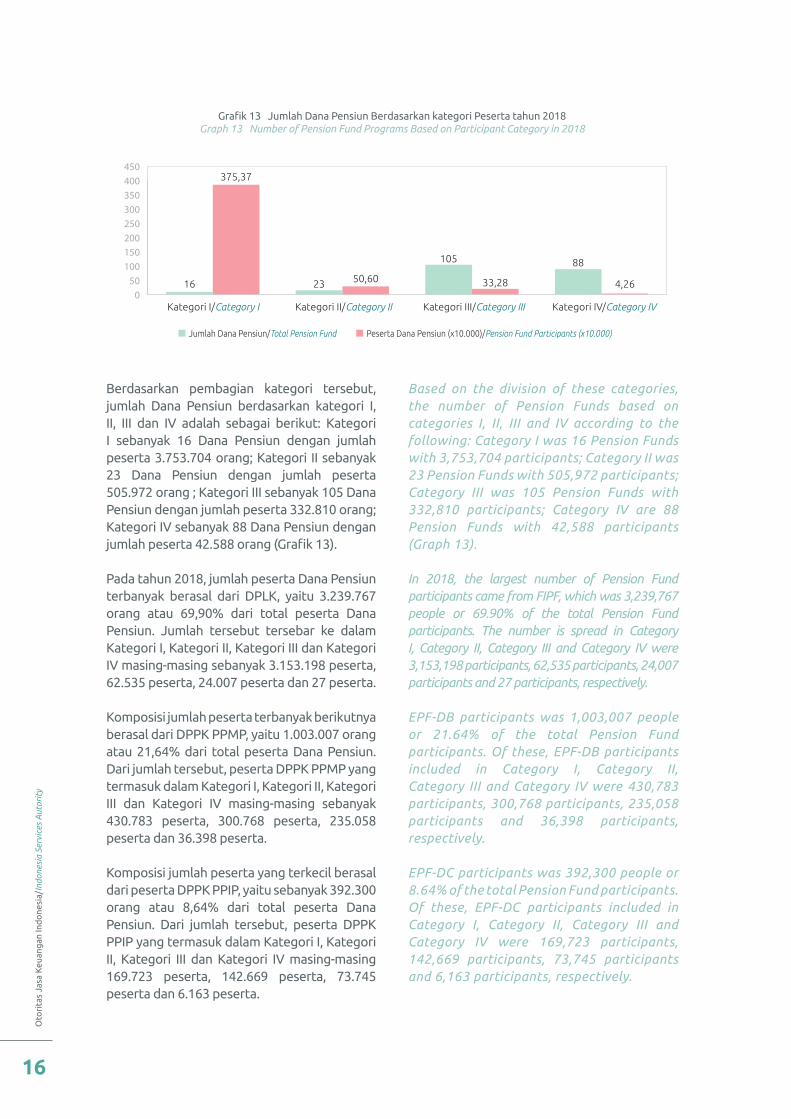
Berdasarkan pembagian kategori tersebut, jumlah Dana Pensiun berdasarkan kategori I, II, III dan IV adalah sebagai berikut: Kategori I sebanyak 16 Dana Pensiun dengan jumlah peserta 3.753.704 orang; Kategori II sebanyak 23 Dana Pensiun dengan jumlah peserta 505.972 orang ; Kategori III sebanyak 105 Dana Pensiun dengan jumlah peserta 332.810 orang; Kategori IV sebanyak 88 Dana Pensiun dengan jumlah peserta 42.588 orang (Grafik 13).
Pada tahun 2018, jumlah peserta Dana Pensiun terbanyak berasal dari DPLK, yaitu 3.239.767 orang atau 69,90% dari total peserta Dana Pensiun. Jumlah tersebut tersebar ke dalam Kategori I, Kategori II, Kategori III dan Kategori IV masing-masing sebanyak 3.153.198 peserta, 62.535 peserta, 24.007 peserta dan 27 peserta.
Komposisi jumlah peserta terbanyak berikutnya berasal dari DPPK PPMP, yaitu 1.003.007 orang atau 21,64% dari total peserta Dana Pensiun. Dari jumlah tersebut, peserta DPPK PPMP yang termasuk dalam Kategori I, Kategori II, Kategori III dan Kategori IV masing-masing sebanyak 430.783 peserta, 300.768 peserta, 235.058 peserta dan 36.398 peserta.
Komposisi jumlah peserta yang terkecil berasal dari peserta DPPK PPIP, yaitu sebanyak 392.300 orang atau 8,64% dari total peserta Dana Pensiun. Dari jumlah tersebut, peserta DPPK PPIP yang termasuk dalam Kategori I, Kategori II, Kategori III dan Kategori IV masing-masing 169.723 peserta, 142.669 peserta, 73.745 peserta dan 6.163 peserta.
Based on the division of these categories, the number of Pension Funds based on categories I, II, III and IV according to the following: Category I was 16 Pension Funds with 3,753,704 participants; Category II was 23 Pension Funds with 505,972 participants; Category III was 105 Pension Funds with 332,810 participants; Category IV are 88 Pension Funds with 42,588 participants (Graph 13).
In 2018, the largest number of Pension Fund participants came from FIPF, which was 3,239,767 people or 69.90% of the total Pension Fund participants. The number is spread in Category I, Category II, Category III and Category IV were 3,153,198 participants, 62,535 participants, 24,007 participants and 27 participants, respectively.
EPF-DB participants was 1,003,007 people or 21.64% of the total Pension Fund participants. Of these, EPF-DB participants included in Category I, Category II, Category III and Category IV were 430,783 participants, 300,768 participants, 235,058 participants and 36,398 participants, respectively.
EPF-DC participants was 392,300 people or 8.64% of the total Pension Fund participants. Of these, EPF-DC participants included in Category I, Category II, Category III and Category IV were 169,723 participants, 142,669 participants, 73,745 participants and 6,163 participants, respectively.
Stat
isti
k D
ana
Pen
siun
201
8/P
ensi
on F
und
Stat
isti
cs 2
018
17
Grafik 14 Penyebaran Peserta Berdasarkan Kategori & Program Pensiun Tahun 2018 Graph 14 Distribution of Participants Based on Category & Pension Plans in 2018
Grafik 15 Aset Bersih dan Jumlah Peserta dari 10 Dana Pensiun Terbesar Tahun 2018 Graph 15 Distribution of Participants Based on Category & Pension Plans in 2018
DPPK PPMP/EPF-DBPP DPPK PPIP/EPF-DCPP DPLK/FIPF
0
50
100
150
200
250
300
350
Kategori I/Category I Kategori II/Category II Kategori III/Category III Kategori IV/Category IV
*Jumlah Peserta x10.000Total Participants x10.000
43,0816,97
315,32
30,08 14,27 6,2523,51 7,37 2,40 3,64 0,62 0,00
0%
20%
40%
60%
80%
100%
Aset Bersih/Net Assets Jumlah Peserta/Total Participants
47,72%
52,28%
55,12%
44,88%
10 Dana Pensiun dengan Aset Bersih TerbesarThe 10 Largest Pension Funds Over The Total Net Assets
Dana Pensiun LainnyaOthersPension Fund
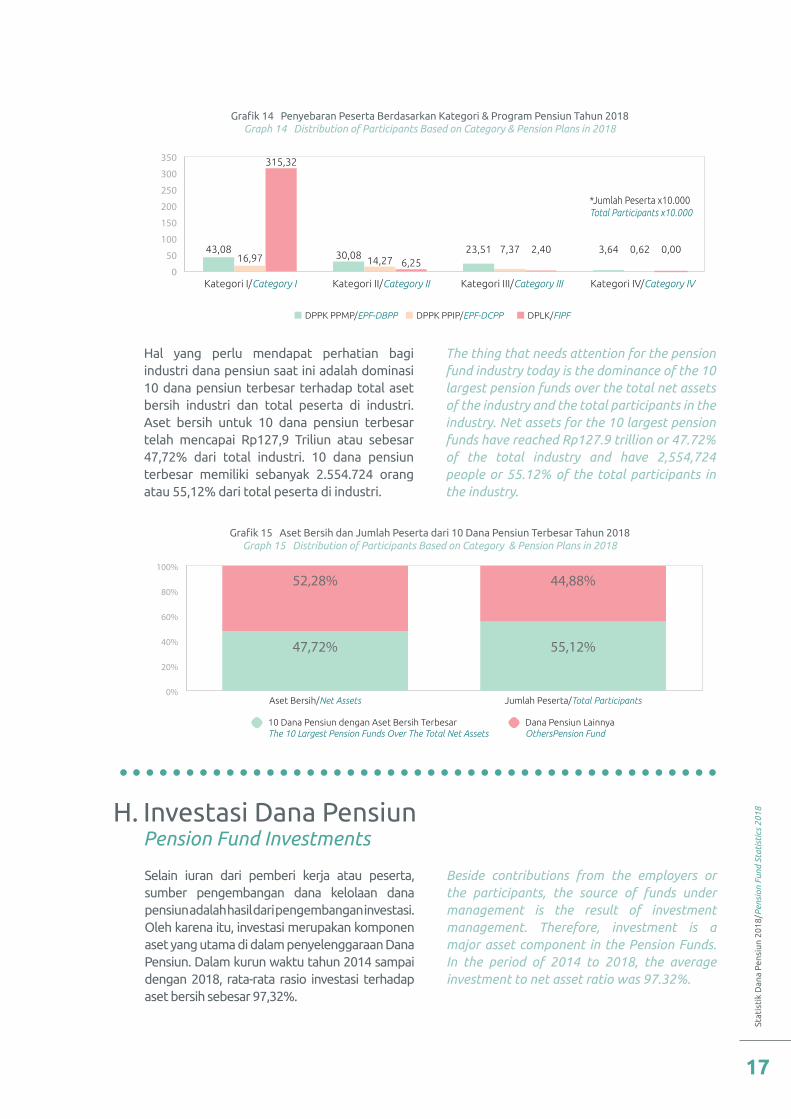
Hal yang perlu mendapat perhatian bagi industri dana pensiun saat ini adalah dominasi 10 dana pensiun terbesar terhadap total aset bersih industri dan total peserta di industri. Aset bersih untuk 10 dana pensiun terbesar telah mencapai Rp127,9 Triliun atau sebesar 47,72% dari total industri. 10 dana pensiun terbesar memiliki sebanyak 2.554.724 orang atau 55,12% dari total peserta di industri.
The thing that needs attention for the pension fund industry today is the dominance of the 10 largest pension funds over the total net assets of the industry and the total participants in the industry. Net assets for the 10 largest pension funds have reached Rp127.9 trillion or 47.72% of the total industry and have 2,554,724 people or 55.12% of the total participants in the industry.
Selain iuran dari pemberi kerja atau peserta, sumber pengembangan dana kelolaan dana pensiun adalah hasil dari pengembangan investasi. Oleh karena itu, investasi merupakan komponen aset yang utama di dalam penyelenggaraan Dana Pensiun. Dalam kurun waktu tahun 2014 sampai dengan 2018, rata-rata rasio investasi terhadap aset bersih sebesar 97,32%.
Beside contributions from the employers or the participants, the source of funds under management is the result of investment management. Therefore, investment is a major asset component in the Pension Funds. In the period of 2014 to 2018, the average investment to net asset ratio was 97.32%.
H. Investasi Dana Pensiun Pension Fund Investments
Oto
rita
s Ja
sa K
euan
gan
Ind
one
sia/
Indo
nesi
a Se
rvic
es A
utor
ity
18
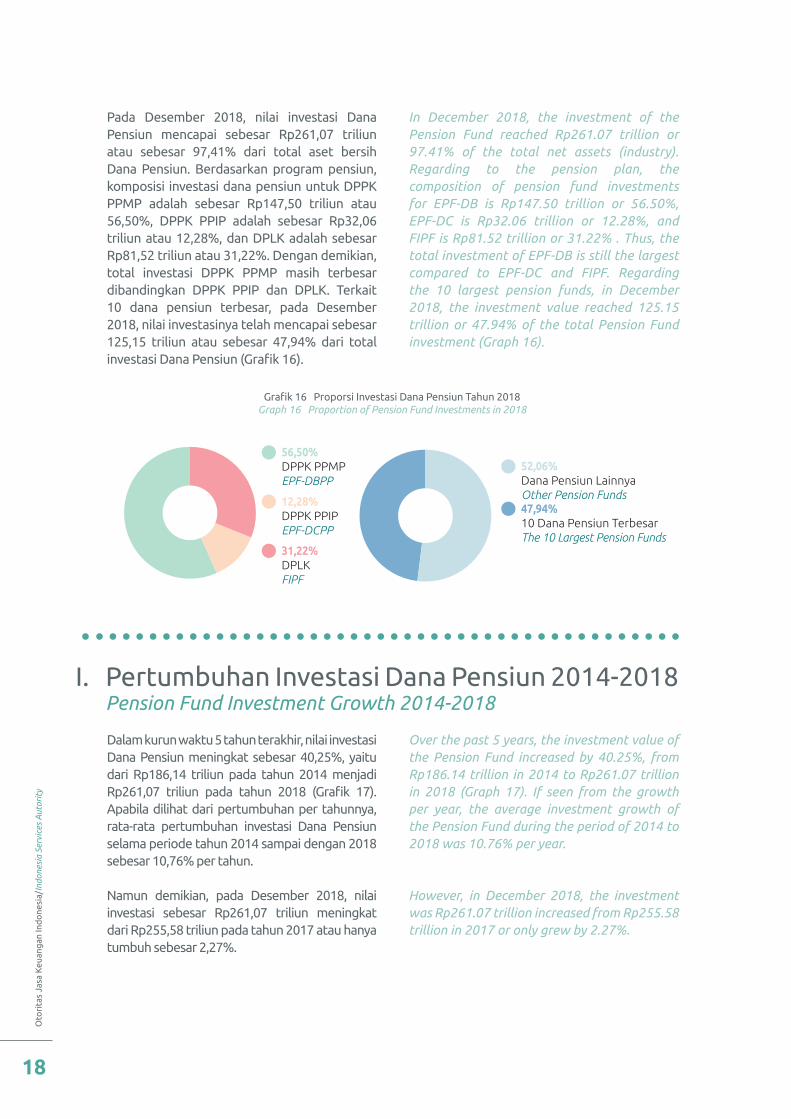
Pada Desember 2018, nilai investasi Dana Pensiun mencapai sebesar Rp261,07 triliun atau sebesar 97,41% dari total aset bersih Dana Pensiun. Berdasarkan program pensiun, komposisi investasi dana pensiun untuk DPPK PPMP adalah sebesar Rp147,50 triliun atau 56,50%, DPPK PPIP adalah sebesar Rp32,06 triliun atau 12,28%, dan DPLK adalah sebesar Rp81,52 triliun atau 31,22%. Dengan demikian, total investasi DPPK PPMP masih terbesar dibandingkan DPPK PPIP dan DPLK. Terkait 10 dana pensiun terbesar, pada Desember 2018, nilai investasinya telah mencapai sebesar 125,15 triliun atau sebesar 47,94% dari total investasi Dana Pensiun (Grafik 16).
In December 2018, the investment of the Pension Fund reached Rp261.07 trillion or 97.41% of the total net assets (industry). Regarding to the pension plan, the composition of pension fund investments for EPF-DB is Rp147.50 trillion or 56.50%, EPF-DC is Rp32.06 trillion or 12.28%, and FIPF is Rp81.52 trillion or 31.22% . Thus, the total investment of EPF-DB is still the largest compared to EPF-DC and FIPF. Regarding the 10 largest pension funds, in December 2018, the investment value reached 125.15 trillion or 47.94% of the total Pension Fund investment (Graph 16).
Grafik 16 Proporsi Investasi Dana Pensiun Tahun 2018 Graph 16 Proportion of Pension Fund Investments in 2018
56,50%DPPK PPMPEPF-DBPP
12,28%DPPK PPIPEPF-DCPP
31,22%DPLKFIPF
52,06%Dana Pensiun LainnyaOther Pension Funds47,94%10 Dana Pensiun TerbesarThe 10 Largest Pension Funds
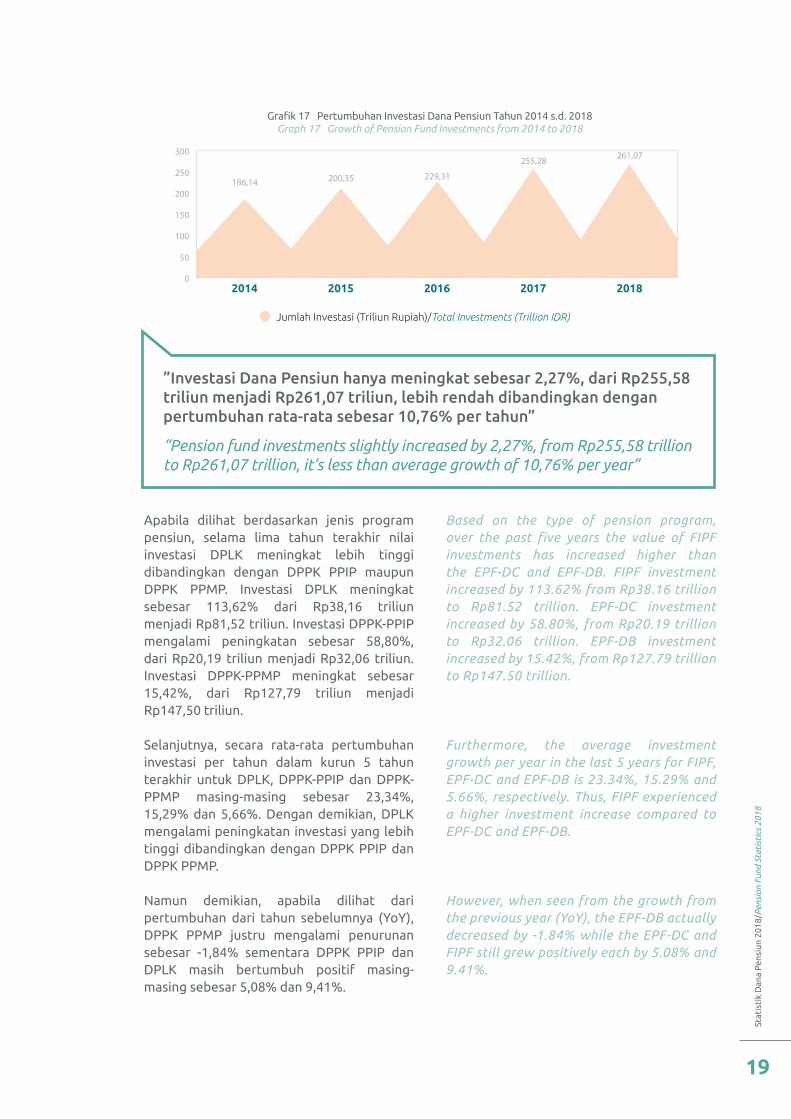
Dalam kurun waktu 5 tahun terakhir, nilai investasi Dana Pensiun meningkat sebesar 40,25%, yaitu dari Rp186,14 triliun pada tahun 2014 menjadi Rp261,07 triliun pada tahun 2018 (Grafik 17). Apabila dilihat dari pertumbuhan per tahunnya, rata-rata pertumbuhan investasi Dana Pensiun selama periode tahun 2014 sampai dengan 2018 sebesar 10,76% per tahun.
Namun demikian, pada Desember 2018, nilai investasi sebesar Rp261,07 triliun meningkat dari Rp255,58 triliun pada tahun 2017 atau hanya tumbuh sebesar 2,27%.
Over the past 5 years, the investment value of the Pension Fund increased by 40.25%, from Rp186.14 trillion in 2014 to Rp261.07 trillion in 2018 (Graph 17). If seen from the growth per year, the average investment growth of the Pension Fund during the period of 2014 to 2018 was 10.76% per year.
However, in December 2018, the investment was Rp261.07 trillion increased from Rp255.58 trillion in 2017 or only grew by 2.27%.
I. Pertumbuhan Investasi Dana Pensiun 2014-2018 Pension Fund Investment Growth 2014-2018
Stat
isti
k D
ana
Pen
siun
201
8/P
ensi
on F
und
Stat
isti
cs 2
018
19
Grafik 17 Pertumbuhan Investasi Dana Pensiun Tahun 2014 s.d. 2018 Graph 17 Growth of Pension Fund Investments from 2014 to 2018
0
100
50
150
200
250
300
186,14 200,35 229,31
255,28 261,07
Jumlah Investasi (Triliun Rupiah)/Total Investments (Trillion IDR)
2014 2015 2016 2017 2018
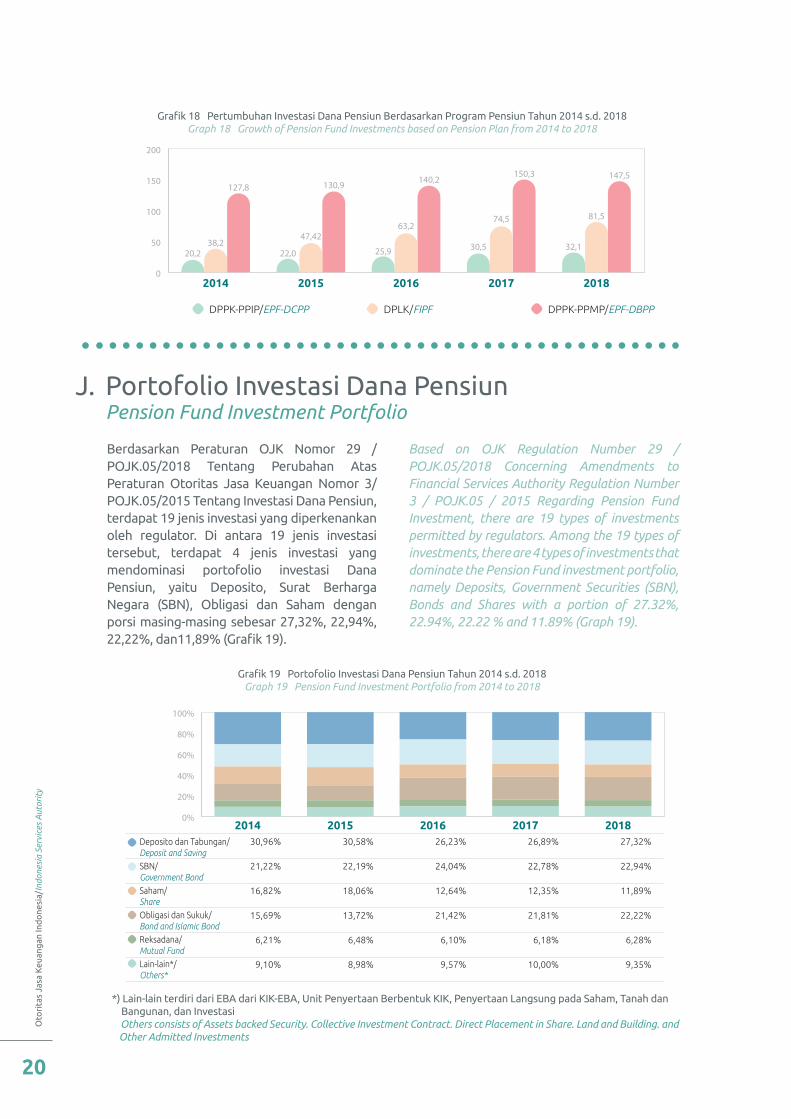
Apabila dilihat berdasarkan jenis program pensiun, selama lima tahun terakhir nilai investasi DPLK meningkat lebih tinggi dibandingkan dengan DPPK PPIP maupun DPPK PPMP. Investasi DPLK meningkat sebesar 113,62% dari Rp38,16 triliun menjadi Rp81,52 triliun. Investasi DPPK-PPIP mengalami peningkatan sebesar 58,80%, dari Rp20,19 triliun menjadi Rp32,06 triliun. Investasi DPPK-PPMP meningkat sebesar 15,42%, dari Rp127,79 triliun menjadi Rp147,50 triliun.
Selanjutnya, secara rata-rata pertumbuhan investasi per tahun dalam kurun 5 tahun terakhir untuk DPLK, DPPK-PPIP dan DPPK-PPMP masing-masing sebesar 23,34%, 15,29% dan 5,66%. Dengan demikian, DPLK mengalami peningkatan investasi yang lebih tinggi dibandingkan dengan DPPK PPIP dan DPPK PPMP.
Namun demikian, apabila dilihat dari pertumbuhan dari tahun sebelumnya (YoY), DPPK PPMP justru mengalami penurunan sebesar -1,84% sementara DPPK PPIP dan DPLK masih bertumbuh positif masing-masing sebesar 5,08% dan 9,41%.
Based on the type of pension program, over the past five years the value of FIPF investments has increased higher than the EPF-DC and EPF-DB. FIPF investment increased by 113.62% from Rp38.16 trillion to Rp81.52 trillion. EPF-DC investment increased by 58.80%, from Rp20.19 trillion to Rp32.06 trillion. EPF-DB investment increased by 15.42%, from Rp127.79 trillion to Rp147.50 trillion.
Furthermore, the average investment growth per year in the last 5 years for FIPF, EPF-DC and EPF-DB is 23.34%, 15.29% and 5.66%, respectively. Thus, FIPF experienced a higher investment increase compared to EPF-DC and EPF-DB.
However, when seen from the growth from the previous year (YoY), the EPF-DB actually decreased by -1.84% while the EPF-DC and FIPF still grew positively each by 5.08% and 9.41%.
”Investasi Dana Pensiun hanya meningkat sebesar 2,27%, dari Rp255,58 triliun menjadi Rp261,07 triliun, lebih rendah dibandingkan dengan pertumbuhan rata-rata sebesar 10,76% per tahun”
“Pension fund investments slightly increased by 2,27%, from Rp255,58 trillion to Rp261,07 trillion, it’s less than average growth of 10,76% per year”
Oto
rita
s Ja
sa K
euan
gan
Ind
one
sia/
Indo
nesi
a Se
rvic
es A
utor
ity
20
Grafik 18 Pertumbuhan Investasi Dana Pensiun Berdasarkan Program Pensiun Tahun 2014 s.d. 2018 Graph 18 Growth of Pension Fund Investments based on Pension Plan from 2014 to 2018
Grafik 19 Portofolio Investasi Dana Pensiun Tahun 2014 s.d. 2018 Graph 19 Pension Fund Investment Portfolio from 2014 to 2018
2014 2015 2016 2017 20180
50
100
150
200
20,238,2
127,8
22,0
47,42
130,9
25,9
63,2
140,2
30,5
74,5
150,3
32,1
81,5
147,5
DPPK-PPIP/EPF-DCPP DPLK/FIPF DPPK-PPMP/EPF-DBPP
0%
20%
40%
60%
80%
100%
2014 2015 2016 2017 2018Deposito dan Tabungan/Deposit and SavingSBN/Government BondSaham/ShareObligasi dan Sukuk/Bond and Islamic BondReksadana/Mutual FundLain-lain*/Others*
30,96%
21,22%
16,82%
15,69%
6,21%
9,10%
30,58%
22,19%
18,06%
13,72%
6,48%
8,98%
26,23%
24,04%
12,64%
21,42%
6,10%
9,57%
26,89%
22,78%
12,35%
21,81%
6,18%
10,00%
27,32%
22,94%
11,89%
22,22%
6,28%
9,35%
Berdasarkan Peraturan OJK Nomor 29 /POJK.05/2018 Tentang Perubahan Atas Peraturan Otoritas Jasa Keuangan Nomor 3/POJK.05/2015 Tentang Investasi Dana Pensiun, terdapat 19 jenis investasi yang diperkenankan oleh regulator. Di antara 19 jenis investasi tersebut, terdapat 4 jenis investasi yang mendominasi portofolio investasi Dana Pensiun, yaitu Deposito, Surat Berharga Negara (SBN), Obligasi dan Saham dengan porsi masing-masing sebesar 27,32%, 22,94%, 22,22%, dan11,89% (Grafik 19).
Based on OJK Regulation Number 29 /POJK.05/2018 Concerning Amendments to Financial Services Authority Regulation Number 3 / POJK.05 / 2015 Regarding Pension Fund Investment, there are 19 types of investments permitted by regulators. Among the 19 types of investments, there are 4 types of investments that dominate the Pension Fund investment portfolio, namely Deposits, Government Securities (SBN), Bonds and Shares with a portion of 27.32%, 22.94%, 22.22 % and 11.89% (Graph 19).
J. Portofolio Investasi Dana Pensiun Pension Fund Investment Portfolio
*) Lain-lain terdiri dari EBA dari KIK-EBA, Unit Penyertaan Berbentuk KIK, Penyertaan Langsung pada Saham, Tanah dan Bangunan, dan Investasi Others consists of Assets backed Security. Collective Investment Contract. Direct Placement in Share. Land and Building. and Other Admitted Investments
Stat
isti
k D
ana
Pen
siun
201
8/P
ensi
on F
und
Stat
isti
cs 2
018
21
Grafik 20 Investasi Dana Pensiun di Pasar Uang dan Pasar Modal Tahun 2014 s.d 2018 Graph 20 Pension Fund Investment in Money Market and Capital Market from 2014 to 2018
0%
20%
40%
60%
80%
100%
2014 2015 2016 2017 2018
59,94%
30,96%
60,62%
30,58%
64,54%
26,23%
63,11%
26,89%
63,84%
27,32%
Pasar Modal/Capital Market Pasar Uang/Money Market
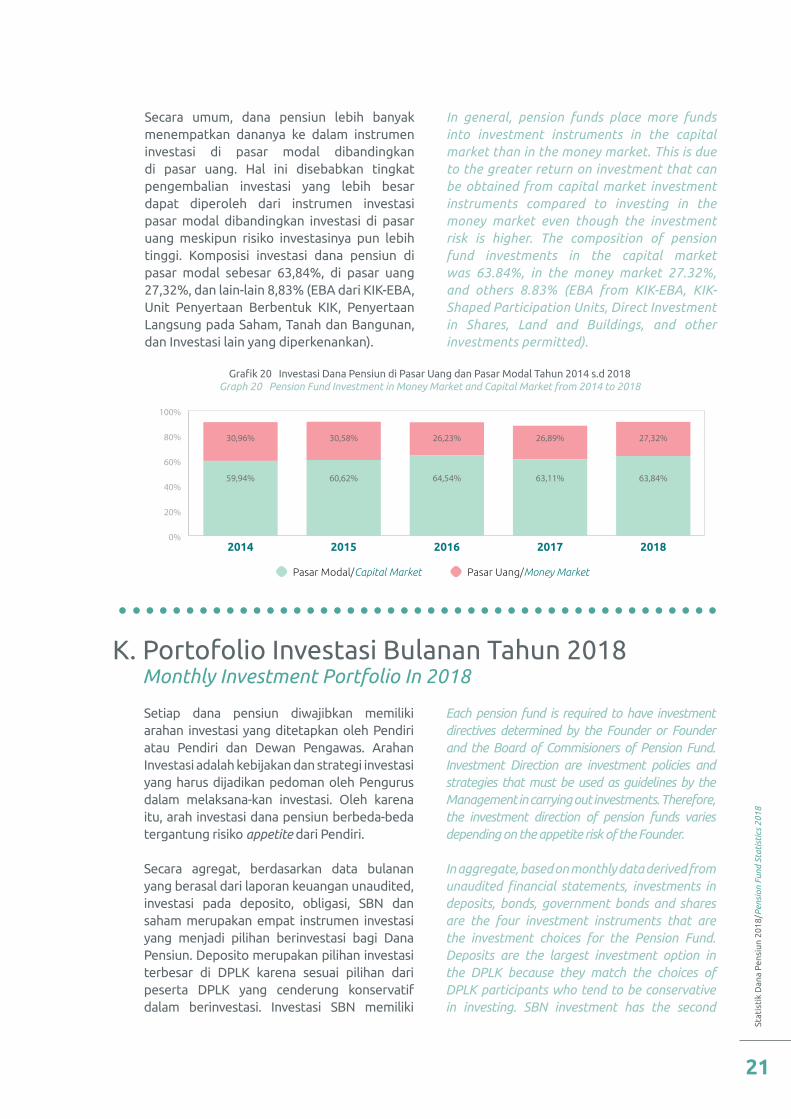
Setiap dana pensiun diwajibkan memiliki arahan investasi yang ditetapkan oleh Pendiri atau Pendiri dan Dewan Pengawas. Arahan Investasi adalah kebijakan dan strategi investasi yang harus dijadikan pedoman oleh Pengurus dalam melaksana-kan investasi. Oleh karena itu, arah investasi dana pensiun berbeda-beda tergantung risiko appetite dari Pendiri.
Secara agregat, berdasarkan data bulanan yang berasal dari laporan keuangan unaudited, investasi pada deposito, obligasi, SBN dan saham merupakan empat instrumen investasi yang menjadi pilihan berinvestasi bagi Dana Pensiun. Deposito merupakan pilihan investasi terbesar di DPLK karena sesuai pilihan dari peserta DPLK yang cenderung konservatif dalam berinvestasi. Investasi SBN memiliki
Secara umum, dana pensiun lebih banyak menempatkan dananya ke dalam instrumen investasi di pasar modal dibandingkan di pasar uang. Hal ini disebabkan tingkat pengembalian investasi yang lebih besar dapat diperoleh dari instrumen investasi pasar modal dibandingkan investasi di pasar uang meskipun risiko investasinya pun lebih tinggi. Komposisi investasi dana pensiun di pasar modal sebesar 63,84%, di pasar uang 27,32%, dan lain-lain 8,83% (EBA dari KIK-EBA, Unit Penyertaan Berbentuk KIK, Penyertaan Langsung pada Saham, Tanah dan Bangunan, dan Investasi lain yang diperkenankan).
Each pension fund is required to have investment directives determined by the Founder or Founder and the Board of Commisioners of Pension Fund. Investment Direction are investment policies and strategies that must be used as guidelines by the Management in carrying out investments. Therefore, the investment direction of pension funds varies depending on the appetite risk of the Founder.
In aggregate, based on monthly data derived from unaudited financial statements, investments in deposits, bonds, government bonds and shares are the four investment instruments that are the investment choices for the Pension Fund. Deposits are the largest investment option in the DPLK because they match the choices of DPLK participants who tend to be conservative in investing. SBN investment has the second
In general, pension funds place more funds into investment instruments in the capital market than in the money market. This is due to the greater return on investment that can be obtained from capital market investment instruments compared to investing in the money market even though the investment risk is higher. The composition of pension fund investments in the capital market was 63.84%, in the money market 27.32%, and others 8.83% (EBA from KIK-EBA, KIK-Shaped Participation Units, Direct Investment in Shares, Land and Buildings, and other investments permitted).
K. Portofolio Investasi Bulanan Tahun 2018 Monthly Investment Portfolio In 2018
Oto
rita
s Ja
sa K
euan
gan
Ind
one
sia/
Indo
nesi
a Se
rvic
es A
utor
ity
22
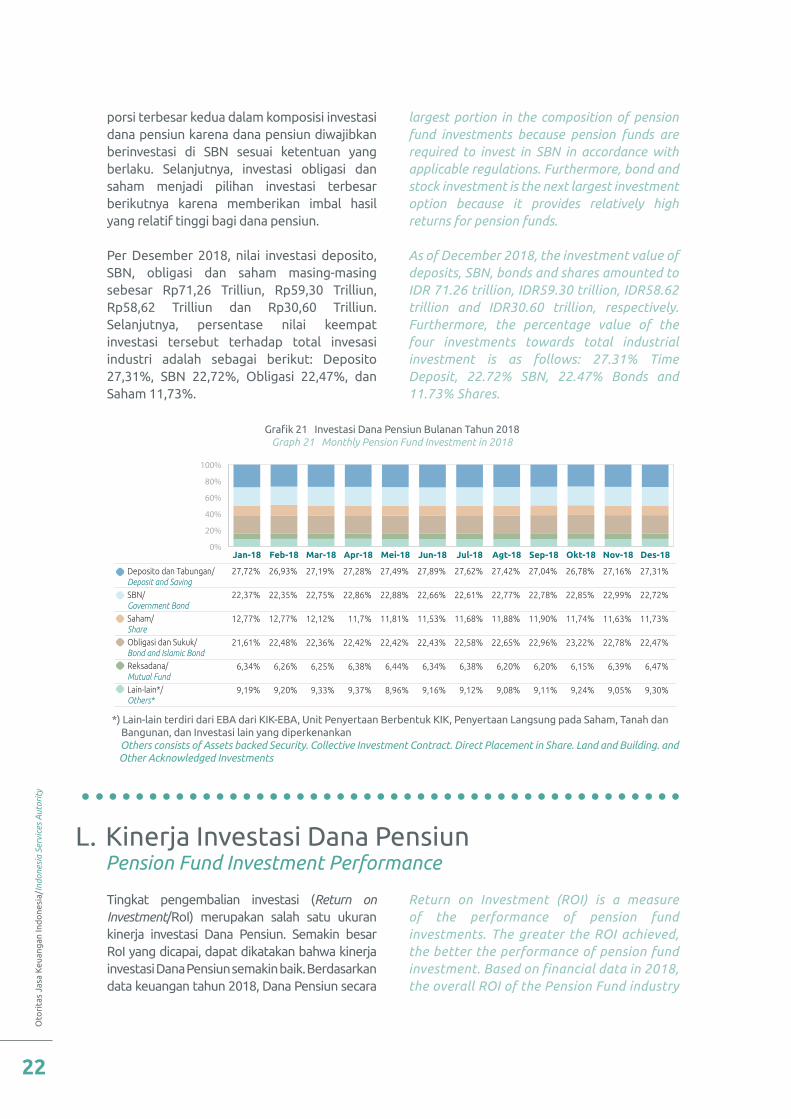
porsi terbesar kedua dalam komposisi investasi dana pensiun karena dana pensiun diwajibkan berinvestasi di SBN sesuai ketentuan yang berlaku. Selanjutnya, investasi obligasi dan saham menjadi pilihan investasi terbesar berikutnya karena memberikan imbal hasil yang relatif tinggi bagi dana pensiun.
Per Desember 2018, nilai investasi deposito, SBN, obligasi dan saham masing-masing sebesar Rp71,26 Trilliun, Rp59,30 Trilliun, Rp58,62 Trilliun dan Rp30,60 Trilliun. Selanjutnya, persentase nilai keempat investasi tersebut terhadap total invesasi industri adalah sebagai berikut: Deposito 27,31%, SBN 22,72%, Obligasi 22,47%, dan Saham 11,73%.
largest portion in the composition of pension fund investments because pension funds are required to invest in SBN in accordance with applicable regulations. Furthermore, bond and stock investment is the next largest investment option because it provides relatively high returns for pension funds.
As of December 2018, the investment value of deposits, SBN, bonds and shares amounted to IDR 71.26 trillion, IDR59.30 trillion, IDR58.62 trillion and IDR30.60 trillion, respectively. Furthermore, the percentage value of the four investments towards total industrial investment is as follows: 27.31% Time Deposit, 22.72% SBN, 22.47% Bonds and 11.73% Shares.
Grafik 21 Investasi Dana Pensiun Bulanan Tahun 2018 Graph 21 Monthly Pension Fund Investment in 2018
Jan-18 Des-18Nov-18Okt-18Sep-18Agt-18Jul-18Jun-18Mei-18Apr-18Mar-18Feb-18
Deposito dan Tabungan/Deposit and SavingSBN/Government BondSaham/ShareObligasi dan Sukuk/Bond and Islamic BondReksadana/Mutual FundLain-lain*/Others*
27,72%
22,37%
12,77%
21,61%
6,34%
9,19%
26,93%
22,35%
12,77%
22,48%
6,26%
9,20%
27,62%
22,61%
11,68%
22,58%
6,38%
9,12%
26,78%
22,85%
11,74%
23,22%
6,15%
9,24%
27,04%
22,78%
11,90%
22,96%
6,20%
9,11%
27,42%
22,77%
11,88%
22,65%
6,20%
9,08%
27,89%
22,66%
11,53%
22,43%
6,34%
9,16%
27,49%
22,88%
11,81%
22,42%
6,44%
8,96%
27,28%
22,86%
11,7%
22,42%
6,38%
9,37%
27,19%
22,75%
12,12%
22,36%
6,25%
9,33%
27,16%
22,99%
11,63%
22,78%
6,39%
9,05%
27,31%
22,72%
11,73%
22,47%
6,47%
9,30%
0%
20%
40%
60%
80%
100%
*) Lain-lain terdiri dari EBA dari KIK-EBA, Unit Penyertaan Berbentuk KIK, Penyertaan Langsung pada Saham, Tanah dan Bangunan, dan Investasi lain yang diperkenankan Others consists of Assets backed Security. Collective Investment Contract. Direct Placement in Share. Land and Building. and Other Acknowledged Investments
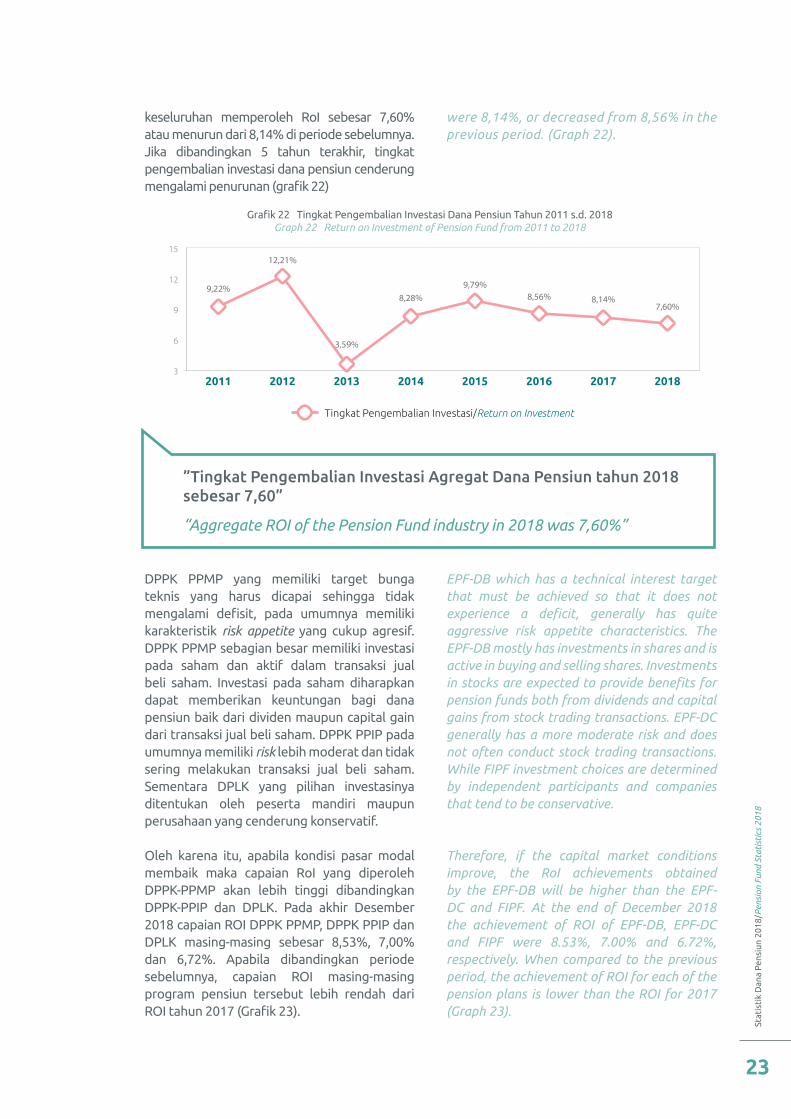
Tingkat pengembalian investasi (Return on Investment/RoI) merupakan salah satu ukuran kinerja investasi Dana Pensiun. Semakin besar RoI yang dicapai, dapat dikatakan bahwa kinerja investasi Dana Pensiun semakin baik. Berdasarkan data keuangan tahun 2018, Dana Pensiun secara
Return on Investment (ROI) is a measure of the performance of pension fund investments. The greater the ROI achieved, the better the performance of pension fund investment. Based on financial data in 2018, the overall ROI of the Pension Fund industry
L. Kinerja Investasi Dana Pensiun Pension Fund Investment Performance
Stat
isti
k D
ana
Pen
siun
201
8/P
ensi
on F
und
Stat
isti
cs 2
018
23
DPPK PPMP yang memiliki target bunga teknis yang harus dicapai sehingga tidak mengalami defisit, pada umumnya memiliki karakteristik risk appetite yang cukup agresif. DPPK PPMP sebagian besar memiliki investasi pada saham dan aktif dalam transaksi jual beli saham. Investasi pada saham diharapkan dapat memberikan keuntungan bagi dana pensiun baik dari dividen maupun capital gain dari transaksi jual beli saham. DPPK PPIP pada umumnya memiliki risk lebih moderat dan tidak sering melakukan transaksi jual beli saham. Sementara DPLK yang pilihan investasinya ditentukan oleh peserta mandiri maupun perusahaan yang cenderung konservatif.
Oleh karena itu, apabila kondisi pasar modal membaik maka capaian RoI yang diperoleh DPPK-PPMP akan lebih tinggi dibandingkan DPPK-PPIP dan DPLK. Pada akhir Desember 2018 capaian ROI DPPK PPMP, DPPK PPIP dan DPLK masing-masing sebesar 8,53%, 7,00% dan 6,72%. Apabila dibandingkan periode sebelumnya, capaian ROI masing-masing program pensiun tersebut lebih rendah dari ROI tahun 2017 (Grafik 23).
EPF-DB which has a technical interest target that must be achieved so that it does not experience a deficit, generally has quite aggressive risk appetite characteristics. The EPF-DB mostly has investments in shares and is active in buying and selling shares. Investments in stocks are expected to provide benefits for pension funds both from dividends and capital gains from stock trading transactions. EPF-DC generally has a more moderate risk and does not often conduct stock trading transactions. While FIPF investment choices are determined by independent participants and companies that tend to be conservative.
Therefore, if the capital market conditions improve, the RoI achievements obtained by the EPF-DB will be higher than the EPF-DC and FIPF. At the end of December 2018 the achievement of ROI of EPF-DB, EPF-DC and FIPF were 8.53%, 7.00% and 6.72%, respectively. When compared to the previous period, the achievement of ROI for each of the pension plans is lower than the ROI for 2017 (Graph 23).
keseluruhan memperoleh RoI sebesar 7,60% atau menurun dari 8,14% di periode sebelumnya. Jika dibandingkan 5 tahun terakhir, tingkat pengembalian investasi dana pensiun cenderung mengalami penurunan (grafik 22)
were 8,14%, or decreased from 8,56% in the previous period. (Graph 22).
Grafik 22 Tingkat Pengembalian Investasi Dana Pensiun Tahun 2011 s.d. 2018 Graph 22 Return on Investment of Pension Fund from 2011 to 2018
2011 20132012 2015 20172014 2016 20183
6
9
12
15
Tingkat Pengembalian Investasi/Return on Investment
9,22%
12,21%
3,59%
8,28%9,79%
8,56% 8,14%7,60%
”Tingkat Pengembalian Investasi Agregat Dana Pensiun tahun 2018 sebesar 7,60”
“Aggregate ROI of the Pension Fund industry in 2018 was 7,60%”
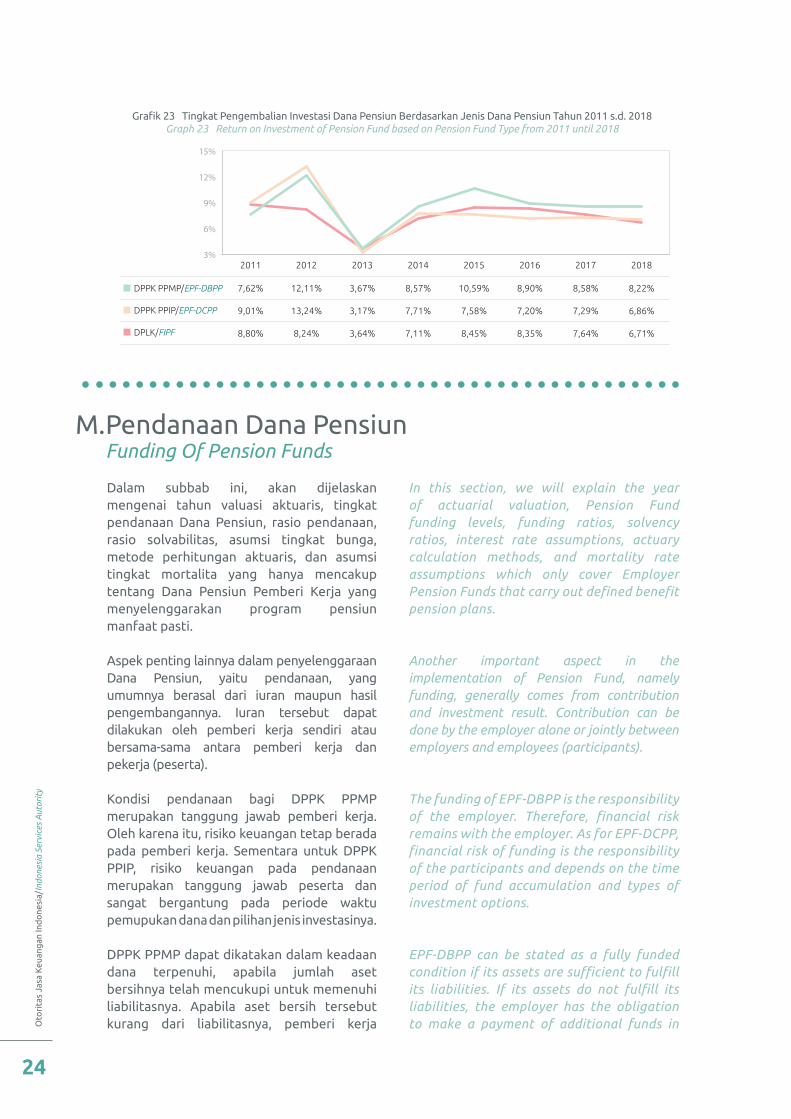
Oto
rita
s Ja
sa K
euan
gan
Ind
one
sia/
Indo
nesi
a Se
rvic
es A
utor
ity
24
Grafik 23 Tingkat Pengembalian Investasi Dana Pensiun Berdasarkan Jenis Dana Pensiun Tahun 2011 s.d. 2018 Graph 23 Return on Investment of Pension Fund based on Pension Fund Type from 2011 until 2018
2011 2012 2013 2014 2015 2016 2017 2018
DPPK PPMP/EPF-DBPP 7,62%
9,01%
8,80%
12,11%
13,24%
8,24%
3,67%
3,17%
3,64%
8,57%
7,71%
7,11%
10,59%
7,58%
8,45%
8,90%
7,20%
8,35%
8,58%
7,29%
7,64%
8,22%
6,86%
6,71%
DPPK PPIP/EPF-DCPP
DPLK/FIPF
3%
6%
9%
12%
15%
Dalam subbab ini, akan dijelaskan mengenai tahun valuasi aktuaris, tingkat pendanaan Dana Pensiun, rasio pendanaan, rasio solvabilitas, asumsi tingkat bunga, metode perhitungan aktuaris, dan asumsi tingkat mortalita yang hanya mencakup tentang Dana Pensiun Pemberi Kerja yang menyelenggarakan program pensiun manfaat pasti.
Aspek penting lainnya dalam penyelenggaraan Dana Pensiun, yaitu pendanaan, yang umumnya berasal dari iuran maupun hasil pengembangannya. Iuran tersebut dapat dilakukan oleh pemberi kerja sendiri atau bersama-sama antara pemberi kerja dan pekerja (peserta).
Kondisi pendanaan bagi DPPK PPMP merupakan tanggung jawab pemberi kerja. Oleh karena itu, risiko keuangan tetap berada pada pemberi kerja. Sementara untuk DPPK PPIP, risiko keuangan pada pendanaan merupakan tanggung jawab peserta dan sangat bergantung pada periode waktu pemupukan dana dan pilihan jenis investasinya.
DPPK PPMP dapat dikatakan dalam keadaan dana terpenuhi, apabila jumlah aset bersihnya telah mencukupi untuk memenuhi liabilitasnya. Apabila aset bersih tersebut kurang dari liabilitasnya, pemberi kerja
In this section, we will explain the year of actuarial valuation, Pension Fund funding levels, funding ratios, solvency ratios, interest rate assumptions, actuary calculation methods, and mortality rate assumptions which only cover Employer Pension Funds that carry out defined benefit pension plans.
Another important aspect in the implementation of Pension Fund, namely funding, generally comes from contribution and investment result. Contribution can be done by the employer alone or jointly between employers and employees (participants).
The funding of EPF-DBPP is the responsibility of the employer. Therefore, financial risk remains with the employer. As for EPF-DCPP, financial risk of funding is the responsibility of the participants and depends on the time period of fund accumulation and types of investment options.
EPF-DBPP can be stated as a fully funded condition if its assets are sufficient to fulfill its liabilities. If its assets do not fulfill its liabilities, the employer has the obligation to make a payment of additional funds in
M. Pendanaan Dana Pensiun Funding Of Pension Funds
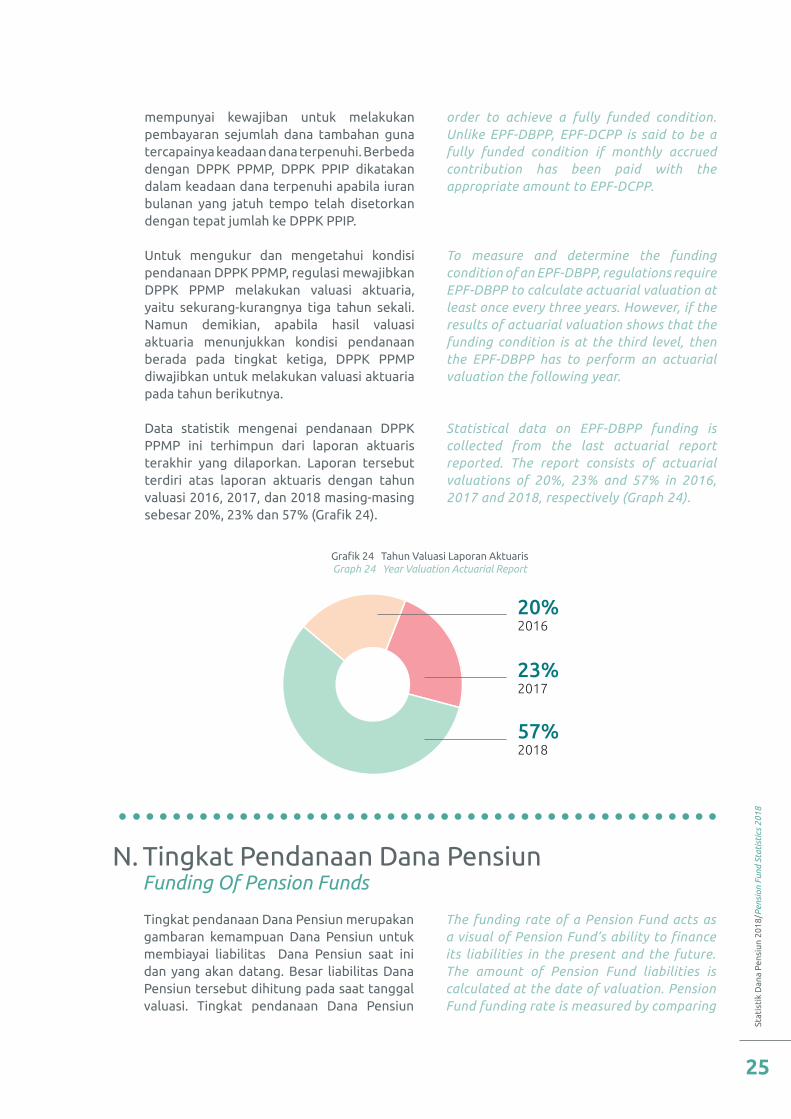
Stat
isti
k D
ana
Pen
siun
201
8/P
ensi
on F
und
Stat
isti
cs 2
018
25
Grafik 24 Tahun Valuasi Laporan Aktuaris Graph 24 Year Valuation Actuarial Report
20%2016
23%2017
57%2018
Tingkat pendanaan Dana Pensiun merupakan gambaran kemampuan Dana Pensiun untuk membiayai liabilitas Dana Pensiun saat ini dan yang akan datang. Besar liabilitas Dana Pensiun tersebut dihitung pada saat tanggal valuasi. Tingkat pendanaan Dana Pensiun
mempunyai kewajiban untuk melakukan pembayaran sejumlah dana tambahan guna tercapainya keadaan dana terpenuhi. Berbeda dengan DPPK PPMP, DPPK PPIP dikatakan dalam keadaan dana terpenuhi apabila iuran bulanan yang jatuh tempo telah disetorkan dengan tepat jumlah ke DPPK PPIP.
Untuk mengukur dan mengetahui kondisi pendanaan DPPK PPMP, regulasi mewajibkan DPPK PPMP melakukan valuasi aktuaria, yaitu sekurang-kurangnya tiga tahun sekali. Namun demikian, apabila hasil valuasi aktuaria menunjukkan kondisi pendanaan berada pada tingkat ketiga, DPPK PPMP diwajibkan untuk melakukan valuasi aktuaria pada tahun berikutnya.
Data statistik mengenai pendanaan DPPK PPMP ini terhimpun dari laporan aktuaris terakhir yang dilaporkan. Laporan tersebut terdiri atas laporan aktuaris dengan tahun valuasi 2016, 2017, dan 2018 masing-masing sebesar 20%, 23% dan 57% (Grafik 24).
The funding rate of a Pension Fund acts as a visual of Pension Fund’s ability to finance its liabilities in the present and the future. The amount of Pension Fund liabilities is calculated at the date of valuation. Pension Fund funding rate is measured by comparing
order to achieve a fully funded condition. Unlike EPF-DBPP, EPF-DCPP is said to be a fully funded condition if monthly accrued contribution has been paid with the appropriate amount to EPF-DCPP.
To measure and determine the funding condition of an EPF-DBPP, regulations require EPF-DBPP to calculate actuarial valuation at least once every three years. However, if the results of actuarial valuation shows that the funding condition is at the third level, then the EPF-DBPP has to perform an actuarial valuation the following year.
Statistical data on EPF-DBPP funding is collected from the last actuarial report reported. The report consists of actuarial valuations of 20%, 23% and 57% in 2016, 2017 and 2018, respectively (Graph 24).
N. Tingkat Pendanaan Dana Pensiun Funding Of Pension Funds
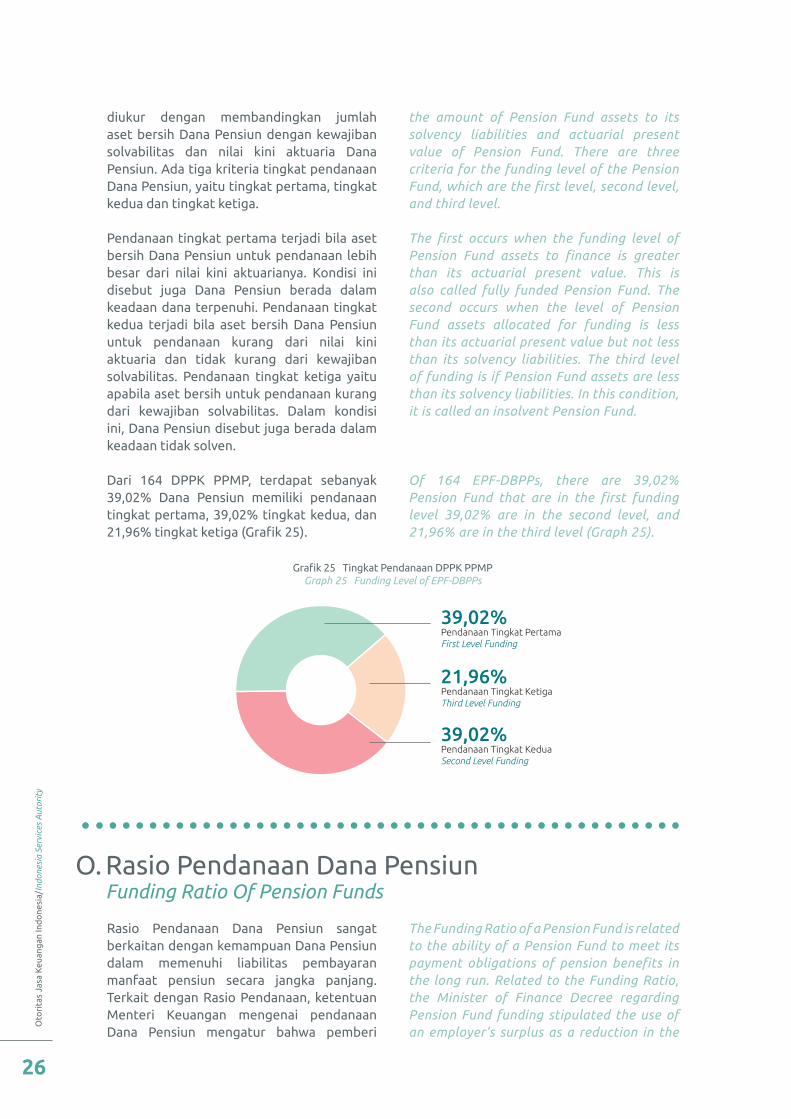
Oto
rita
s Ja
sa K
euan
gan
Ind
one
sia/
Indo
nesi
a Se
rvic
es A
utor
ity
26
diukur dengan membandingkan jumlah aset bersih Dana Pensiun dengan kewajiban solvabilitas dan nilai kini aktuaria Dana Pensiun. Ada tiga kriteria tingkat pendanaan Dana Pensiun, yaitu tingkat pertama, tingkat kedua dan tingkat ketiga.
Pendanaan tingkat pertama terjadi bila aset bersih Dana Pensiun untuk pendanaan lebih besar dari nilai kini aktuarianya. Kondisi ini disebut juga Dana Pensiun berada dalam keadaan dana terpenuhi. Pendanaan tingkat kedua terjadi bila aset bersih Dana Pensiun untuk pendanaan kurang dari nilai kini aktuaria dan tidak kurang dari kewajiban solvabilitas. Pendanaan tingkat ketiga yaitu apabila aset bersih untuk pendanaan kurang dari kewajiban solvabilitas. Dalam kondisi ini, Dana Pensiun disebut juga berada dalam keadaan tidak solven.
Dari 164 DPPK PPMP, terdapat sebanyak 39,02% Dana Pensiun memiliki pendanaan tingkat pertama, 39,02% tingkat kedua, dan 21,96% tingkat ketiga (Grafik 25).
the amount of Pension Fund assets to its solvency liabilities and actuarial present value of Pension Fund. There are three criteria for the funding level of the Pension Fund, which are the first level, second level, and third level.
The first occurs when the funding level of Pension Fund assets to finance is greater than its actuarial present value. This is also called fully funded Pension Fund. The second occurs when the level of Pension Fund assets allocated for funding is less than its actuarial present value but not less than its solvency liabilities. The third level of funding is if Pension Fund assets are less than its solvency liabilities. In this condition, it is called an insolvent Pension Fund.
Of 164 EPF-DBPPs, there are 39,02% Pension Fund that are in the first funding level 39,02% are in the second level, and 21,96% are in the third level (Graph 25).
Grafik 25 Tingkat Pendanaan DPPK PPMP Graph 25 Funding Level of EPF-DBPPs
39,02%Pendanaan Tingkat PertamaFirst Level Funding
21,96%Pendanaan Tingkat KetigaThird Level Funding
39,02%Pendanaan Tingkat KeduaSecond Level Funding
Rasio Pendanaan Dana Pensiun sangat berkaitan dengan kemampuan Dana Pensiun dalam memenuhi liabilitas pembayaran manfaat pensiun secara jangka panjang. Terkait dengan Rasio Pendanaan, ketentuan Menteri Keuangan mengenai pendanaan Dana Pensiun mengatur bahwa pemberi
The Funding Ratio of a Pension Fund is related to the ability of a Pension Fund to meet its payment obligations of pension benefits in the long run. Related to the Funding Ratio, the Minister of Finance Decree regarding Pension Fund funding stipulated the use of an employer’s surplus as a reduction in the
O. Rasio Pendanaan Dana Pensiun Funding Ratio Of Pension Funds
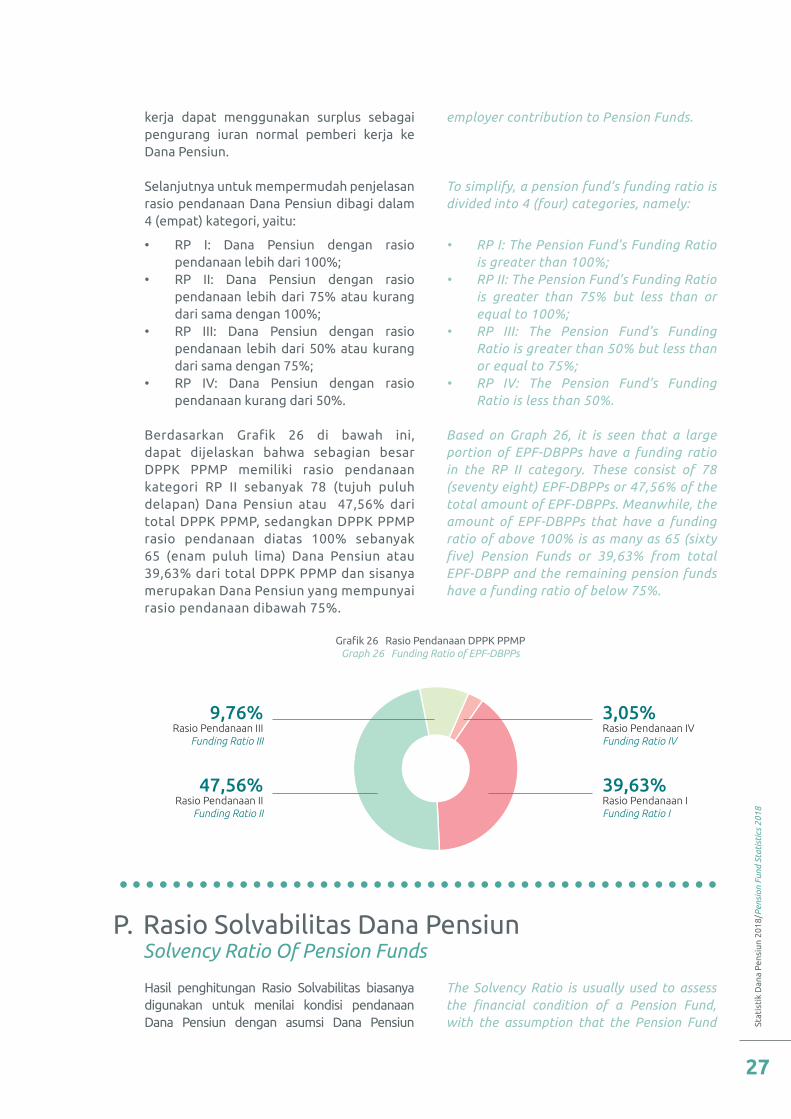
Stat
isti
k D
ana
Pen
siun
201
8/P
ensi
on F
und
Stat
isti
cs 2
018
27
Grafik 26 Rasio Pendanaan DPPK PPMP Graph 26 Funding Ratio of EPF-DBPPs
3,05%Rasio Pendanaan IVFunding Ratio IV
39,63%Rasio Pendanaan IFunding Ratio I
9,76%Rasio Pendanaan III
Funding Ratio III
47,56%Rasio Pendanaan II
Funding Ratio II
Hasil penghitungan Rasio Solvabilitas biasanya digunakan untuk menilai kondisi pendanaan Dana Pensiun dengan asumsi Dana Pensiun
kerja dapat menggunakan surplus sebagai pengurang iuran normal pemberi kerja ke Dana Pensiun.
Selanjutnya untuk mempermudah penjelasan rasio pendanaan Dana Pensiun dibagi dalam 4 (empat) kategori, yaitu:
• RP I: Dana Pensiun dengan rasio pendanaan lebih dari 100%;
• RP II: Dana Pensiun dengan rasio pendanaan lebih dari 75% atau kurang dari sama dengan 100%;
• RP III: Dana Pensiun dengan rasio pendanaan lebih dari 50% atau kurang dari sama dengan 75%;
• RP IV: Dana Pensiun dengan rasio pendanaan kurang dari 50%.
Berdasarkan Grafik 26 di bawah ini, dapat dijelaskan bahwa sebagian besar DPPK PPMP memiliki rasio pendanaan kategori RP II sebanyak 78 (tujuh puluh delapan) Dana Pensiun atau 47,56% dari total DPPK PPMP, sedangkan DPPK PPMP rasio pendanaan diatas 100% sebanyak 65 (enam puluh lima) Dana Pensiun atau 39,63% dari total DPPK PPMP dan sisanya merupakan Dana Pensiun yang mempunyai rasio pendanaan dibawah 75%.
The Solvency Ratio is usually used to assess the financial condition of a Pension Fund, with the assumption that the Pension Fund
employer contribution to Pension Funds.
To simplify, a pension fund’s funding ratio is divided into 4 (four) categories, namely:
• RP I: The Pension Fund’s Funding Ratio is greater than 100%;
• RP II: The Pension Fund’s Funding Ratio is greater than 75% but less than or equal to 100%;
• RP III: The Pension Fund’s Funding Ratio is greater than 50% but less than or equal to 75%;
• RP IV: The Pension Fund’s Funding Ratio is less than 50%.
Based on Graph 26, it is seen that a large portion of EPF-DBPPs have a funding ratio in the RP II category. These consist of 78 (seventy eight) EPF-DBPPs or 47,56% of the total amount of EPF-DBPPs. Meanwhile, the amount of EPF-DBPPs that have a funding ratio of above 100% is as many as 65 (sixty five) Pension Funds or 39,63% from total EPF-DBPP and the remaining pension funds have a funding ratio of below 75%.
P. Rasio Solvabilitas Dana Pensiun Solvency Ratio Of Pension Funds
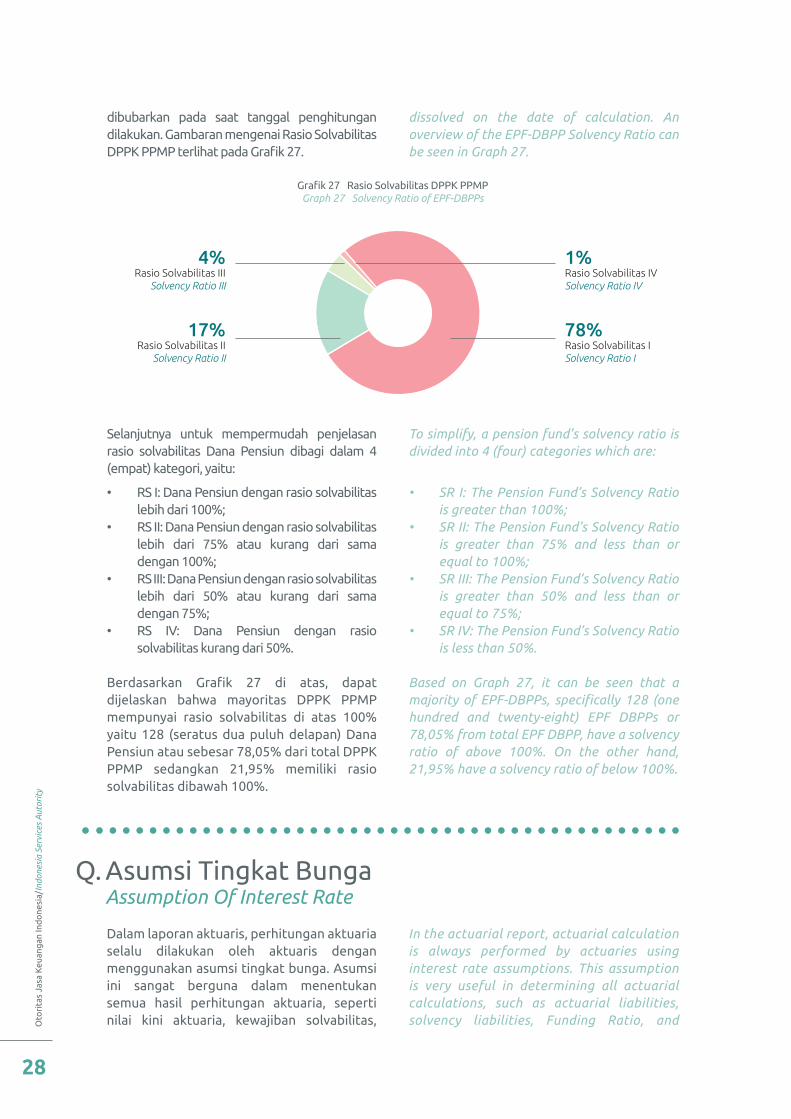
Oto
rita
s Ja
sa K
euan
gan
Ind
one
sia/
Indo
nesi
a Se
rvic
es A
utor
ity
28
dibubarkan pada saat tanggal penghitungan dilakukan. Gambaran mengenai Rasio Solvabilitas DPPK PPMP terlihat pada Grafik 27.
Selanjutnya untuk mempermudah penjelasan rasio solvabilitas Dana Pensiun dibagi dalam 4 (empat) kategori, yaitu:
• RS I: Dana Pensiun dengan rasio solvabilitas lebih dari 100%;
• RS II: Dana Pensiun dengan rasio solvabilitas lebih dari 75% atau kurang dari sama dengan 100%;
• RS III: Dana Pensiun dengan rasio solvabilitas lebih dari 50% atau kurang dari sama dengan 75%;
• RS IV: Dana Pensiun dengan rasio solvabilitas kurang dari 50%.
Berdasarkan Grafik 27 di atas, dapat dijelaskan bahwa mayoritas DPPK PPMP mempunyai rasio solvabilitas di atas 100% yaitu 128 (seratus dua puluh delapan) Dana Pensiun atau sebesar 78,05% dari total DPPK PPMP sedangkan 21,95% memiliki rasio solvabilitas dibawah 100%.
dissolved on the date of calculation. An overview of the EPF-DBPP Solvency Ratio can be seen in Graph 27.
To simplify, a pension fund’s solvency ratio is divided into 4 (four) categories which are:
• SR I: The Pension Fund’s Solvency Ratio is greater than 100%;
• SR II: The Pension Fund’s Solvency Ratio is greater than 75% and less than or equal to 100%;
• SR III: The Pension Fund’s Solvency Ratio is greater than 50% and less than or equal to 75%;
• SR IV: The Pension Fund’s Solvency Ratio is less than 50%.
Based on Graph 27, it can be seen that a majority of EPF-DBPPs, specifically 128 (one hundred and twenty-eight) EPF DBPPs or 78,05% from total EPF DBPP, have a solvency ratio of above 100%. On the other hand, 21,95% have a solvency ratio of below 100%.
Grafik 27 Rasio Solvabilitas DPPK PPMP Graph 27 Solvency Ratio of EPF-DBPPs
1%Rasio Solvabilitas IVSolvency Ratio IV
78%Rasio Solvabilitas ISolvency Ratio I
4%Rasio Solvabilitas III
Solvency Ratio III
17%Rasio Solvabilitas II
Solvency Ratio II
Dalam laporan aktuaris, perhitungan aktuaria selalu dilakukan oleh aktuaris dengan menggunakan asumsi tingkat bunga. Asumsi ini sangat berguna dalam menentukan semua hasil perhitungan aktuaria, seperti nilai kini aktuaria, kewajiban solvabilitas,
In the actuarial report, actuarial calculation is always performed by actuaries using interest rate assumptions. This assumption is very useful in determining all actuarial calculations, such as actuarial liabilities, solvency liabilities, Funding Ratio, and
Q. Asumsi Tingkat Bunga Assumption Of Interest Rate
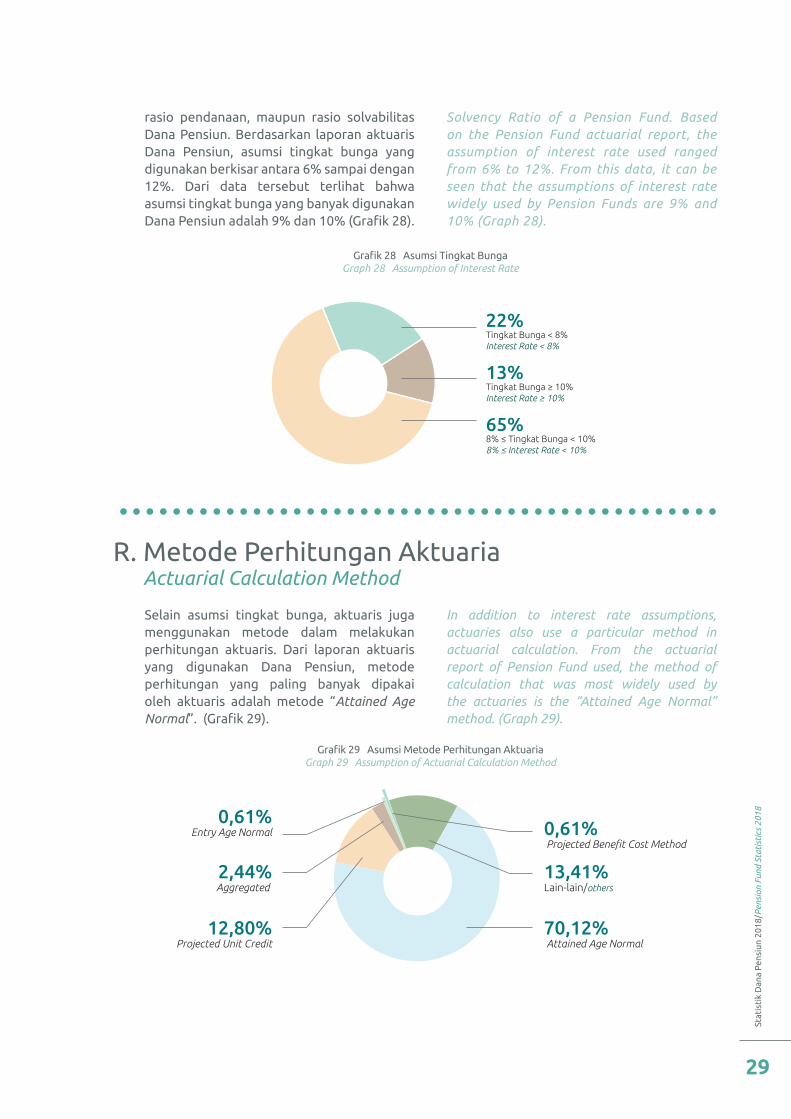
Stat
isti
k D
ana
Pen
siun
201
8/P
ensi
on F
und
Stat
isti
cs 2
018
29
Grafik 28 Asumsi Tingkat Bunga Graph 28 Assumption of Interest Rate
Grafik 29 Asumsi Metode Perhitungan Aktuaria Graph 29 Assumption of Actuarial Calculation Method
22%Tingkat Bunga < 8%Interest Rate < 8%
65%8% ≤ Tingkat Bunga < 10%8% ≤ Interest Rate < 10%
13%Tingkat Bunga ≥ 10%Interest Rate ≥ 10%
0,61% Projected Benefit Cost Method
13,41%Lain-lain/others
70,12% Attained Age Normal
0,61% Entry Age Normal
2,44% Aggregated
12,80% Projected Unit Credit
Selain asumsi tingkat bunga, aktuaris juga menggunakan metode dalam melakukan perhitungan aktuaris. Dari laporan aktuaris yang digunakan Dana Pensiun, metode perhitungan yang paling banyak dipakai oleh aktuaris adalah metode “Attained Age Normal”. (Grafik 29).
rasio pendanaan, maupun rasio solvabilitas Dana Pensiun. Berdasarkan laporan aktuaris Dana Pensiun, asumsi tingkat bunga yang digunakan berkisar antara 6% sampai dengan 12%. Dari data tersebut terlihat bahwa asumsi tingkat bunga yang banyak digunakan Dana Pensiun adalah 9% dan 10% (Grafik 28).
In addition to interest rate assumptions, actuaries also use a particular method in actuarial calculation. From the actuarial report of Pension Fund used, the method of calculation that was most widely used by the actuaries is the “Attained Age Normal” method. (Graph 29).
Solvency Ratio of a Pension Fund. Based on the Pension Fund actuarial report, the assumption of interest rate used ranged from 6% to 12%. From this data, it can be seen that the assumptions of interest rate widely used by Pension Funds are 9% and 10% (Graph 28).
R. Metode Perhitungan Aktuaria Actuarial Calculation Method
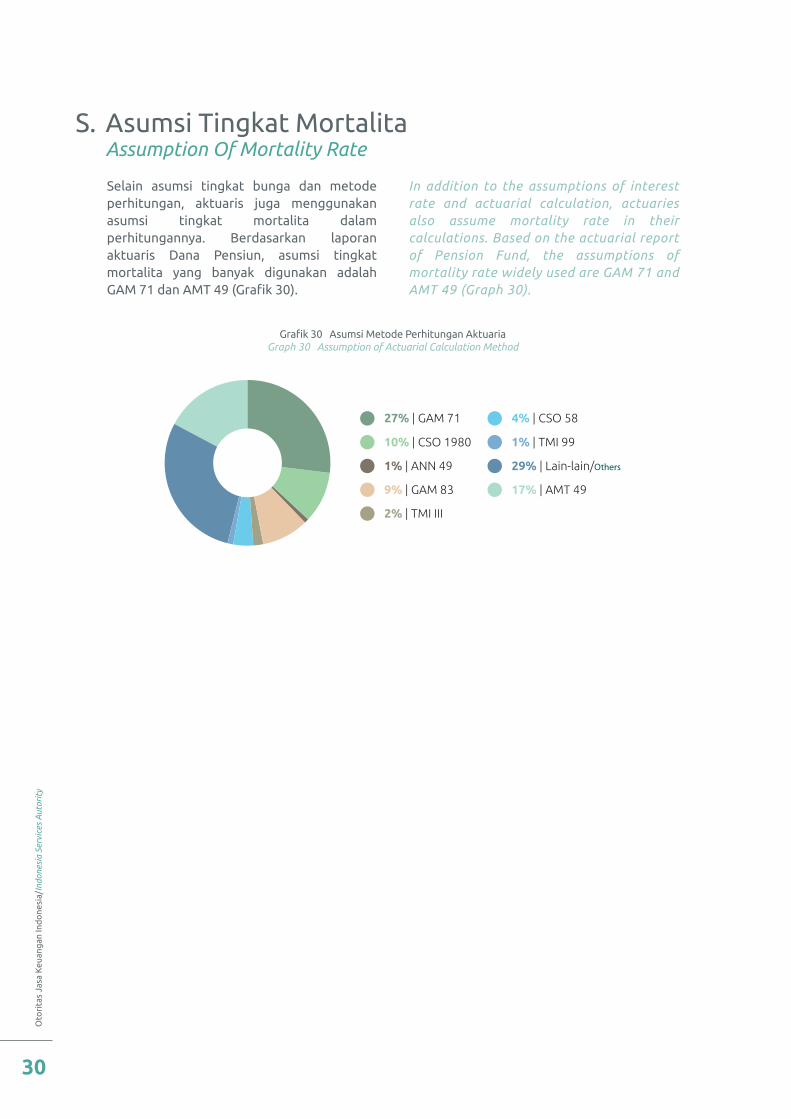
Oto
rita
s Ja
sa K
euan
gan
Ind
one
sia/
Indo
nesi
a Se
rvic
es A
utor
ity
30
Selain asumsi tingkat bunga dan metode perhitungan, aktuaris juga menggunakan asumsi tingkat mortalita dalam perhitungannya. Berdasarkan laporan aktuaris Dana Pensiun, asumsi tingkat mortalita yang banyak digunakan adalah GAM 71 dan AMT 49 (Grafik 30).
In addition to the assumptions of interest rate and actuarial calculation, actuaries also assume mortality rate in their calculations. Based on the actuarial report of Pension Fund, the assumptions of mortality rate widely used are GAM 71 and AMT 49 (Graph 30).
S. Asumsi Tingkat Mortalita Assumption Of Mortality Rate
Grafik 30 Asumsi Metode Perhitungan Aktuaria Graph 30 Assumption of Actuarial Calculation Method
27% | GAM 71
10% | CSO 1980
1% | ANN 49
9% | GAM 83
2% | TMI III
4% | CSO 58
1% | TMI 99
29% | Lain-lain/Others
17% | AMT 49
Stat
isti
k D
ana
Pen
siun
201
8/P
ensi
on F
und
Stat
isti
cs 2
018
31
Ringkasan PertumbuhanDana Pensiun SyariahSummary Of Sharia Pension Fund Growth

Oto
rita
s Ja
sa K
euan
gan
Ind
one
sia/
Indo
nesi
a Se
rvic
es A
utor
ity
32
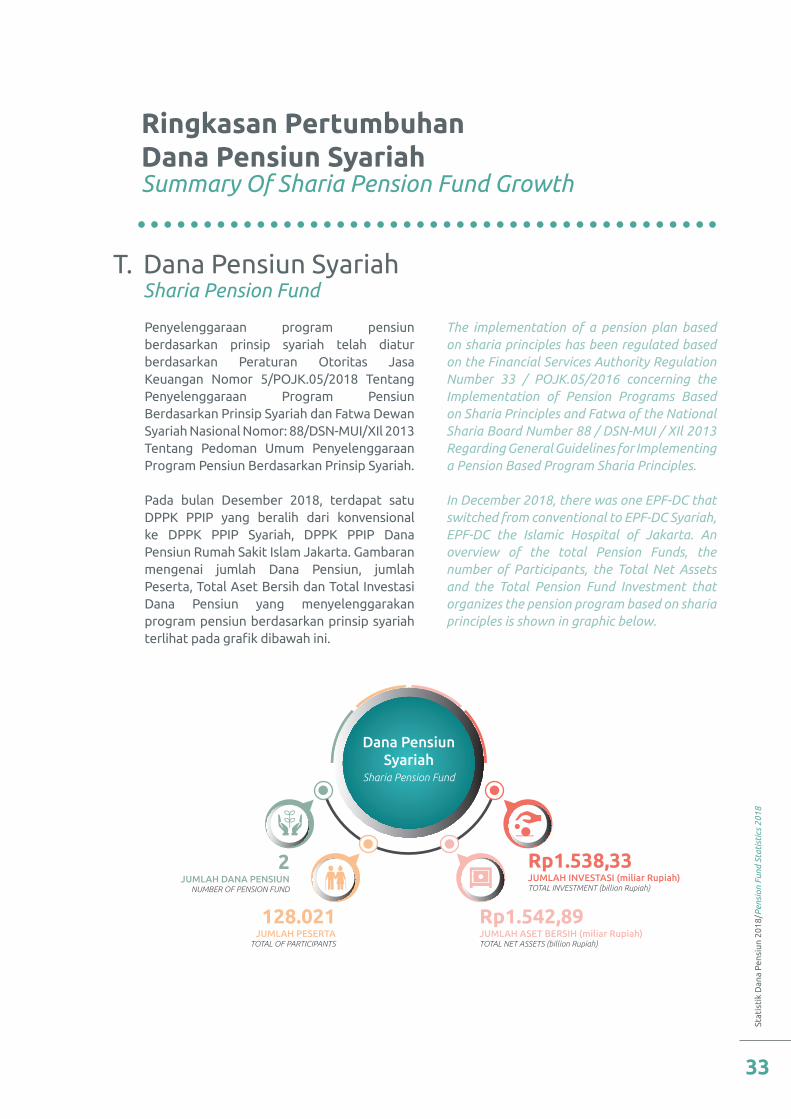
Stat
isti
k D
ana
Pen
siun
201
8/P
ensi
on F
und
Stat
isti
cs 2
018
33
Ringkasan PertumbuhanDana Pensiun SyariahSummary Of Sharia Pension Fund Growth
Penyelenggaraan program pensiun berdasarkan prinsip syariah telah diatur berdasarkan Peraturan Otoritas Jasa Keuangan Nomor 5/POJK.05/2018 Tentang Penyelenggaraan Program Pensiun Berdasarkan Prinsip Syariah dan Fatwa Dewan Syariah Nasional Nomor: 88/DSN-MUI/XIl 2013 Tentang Pedoman Umum Penyelenggaraan Program Pensiun Berdasarkan Prinsip Syariah.
Pada bulan Desember 2018, terdapat satu DPPK PPIP yang beralih dari konvensional ke DPPK PPIP Syariah, DPPK PPIP Dana Pensiun Rumah Sakit Islam Jakarta. Gambaran mengenai jumlah Dana Pensiun, jumlah Peserta, Total Aset Bersih dan Total Investasi Dana Pensiun yang menyelenggarakan program pensiun berdasarkan prinsip syariah terlihat pada grafik dibawah ini.
The implementation of a pension plan based on sharia principles has been regulated based on the Financial Services Authority Regulation Number 33 / POJK.05/2016 concerning the Implementation of Pension Programs Based on Sharia Principles and Fatwa of the National Sharia Board Number 88 / DSN-MUI / XIl 2013 Regarding General Guidelines for Implementing a Pension Based Program Sharia Principles.
In December 2018, there was one EPF-DC that switched from conventional to EPF-DC Syariah, EPF-DC the Islamic Hospital of Jakarta. An overview of the total Pension Funds, the number of Participants, the Total Net Assets and the Total Pension Fund Investment that organizes the pension program based on sharia principles is shown in graphic below.
T. Dana Pensiun Syariah Sharia Pension Fund
Dana PensiunSyariah
Sharia Pension Fund
2JUMLAH DANA PENSIUN
NUMBER OF PENSION FUND
128.021JUMLAH PESERTA
TOTAL OF PARTICIPANTS
Rp1.538,33 JUMLAH INVESTASI (miliar Rupiah)TOTAL INVESTMENT (billion Rupiah)
Rp1.542,89 JUMLAH ASET BERSIH (miliar Rupiah)TOTAL NET ASSETS (billion Rupiah)
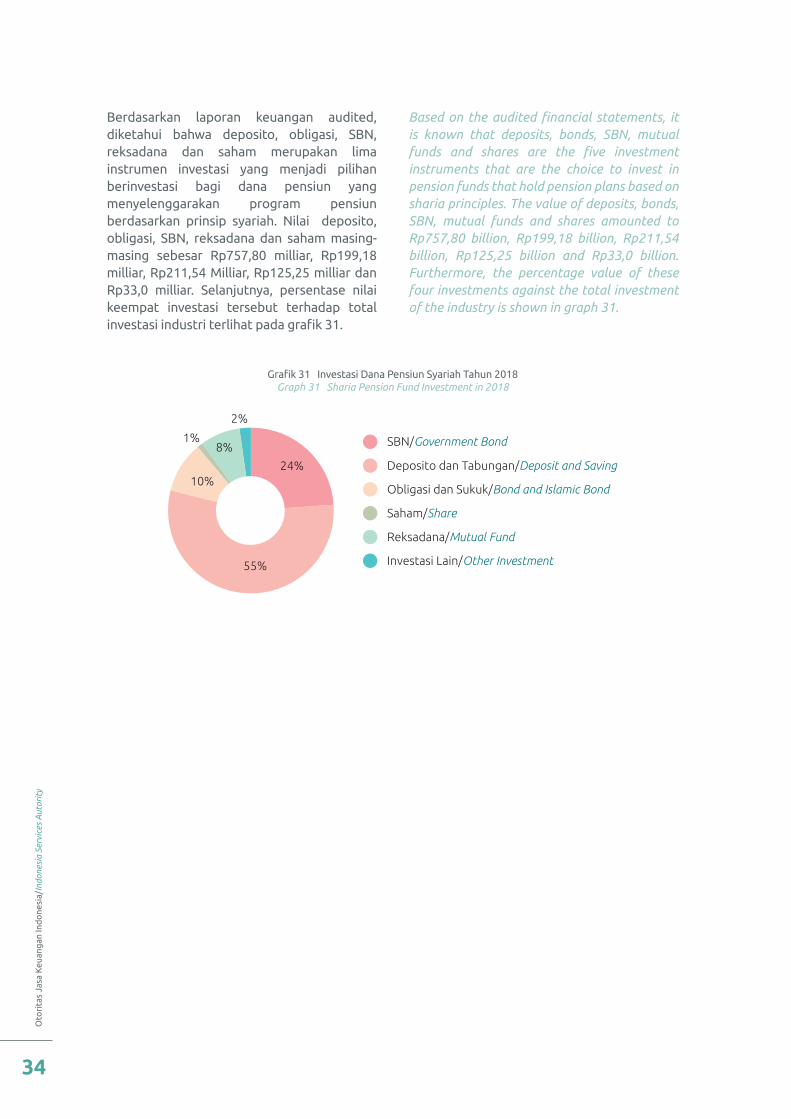
Oto
rita
s Ja
sa K
euan
gan
Ind
one
sia/
Indo
nesi
a Se
rvic
es A
utor
ity
34
Berdasarkan laporan keuangan audited, diketahui bahwa deposito, obligasi, SBN, reksadana dan saham merupakan lima instrumen investasi yang menjadi pilihan berinvestasi bagi dana pensiun yang menyelenggarakan program pensiun berdasarkan prinsip syariah. Nilai deposito, obligasi, SBN, reksadana dan saham masing-masing sebesar Rp757,80 milliar, Rp199,18 milliar, Rp211,54 Milliar, Rp125,25 milliar dan Rp33,0 milliar. Selanjutnya, persentase nilai keempat investasi tersebut terhadap total investasi industri terlihat pada grafik 31.
Based on the audited financial statements, it is known that deposits, bonds, SBN, mutual funds and shares are the five investment instruments that are the choice to invest in pension funds that hold pension plans based on sharia principles. The value of deposits, bonds, SBN, mutual funds and shares amounted to Rp757,80 billion, Rp199,18 billion, Rp211,54 billion, Rp125,25 billion and Rp33,0 billion. Furthermore, the percentage value of these four investments against the total investment of the industry is shown in graph 31.
Grafik 31 Investasi Dana Pensiun Syariah Tahun 2018 Graph 31 Sharia Pension Fund Investment in 2018
SBN/Government Bond
Deposito dan Tabungan/Deposit and Saving
Obligasi dan Sukuk/Bond and Islamic Bond
Saham/Share
Reksadana/Mutual Fund
Investasi Lain/Other Investment
24%
55%
10%
1%8%
2%

Stat
isti
k D
ana
Pen
siun
201
8/P
ensi
on F
und
Stat
isti
cs 2
018
35
Ringkasan Pertumbuhan Program Jaminan Sosial KetenagakerjaanSummary Of The Growth Of Employment
Social Security Program

Oto
rita
s Ja
sa K
euan
gan
Ind
one
sia/
Indo
nesi
a Se
rvic
es A
utor
ity
36
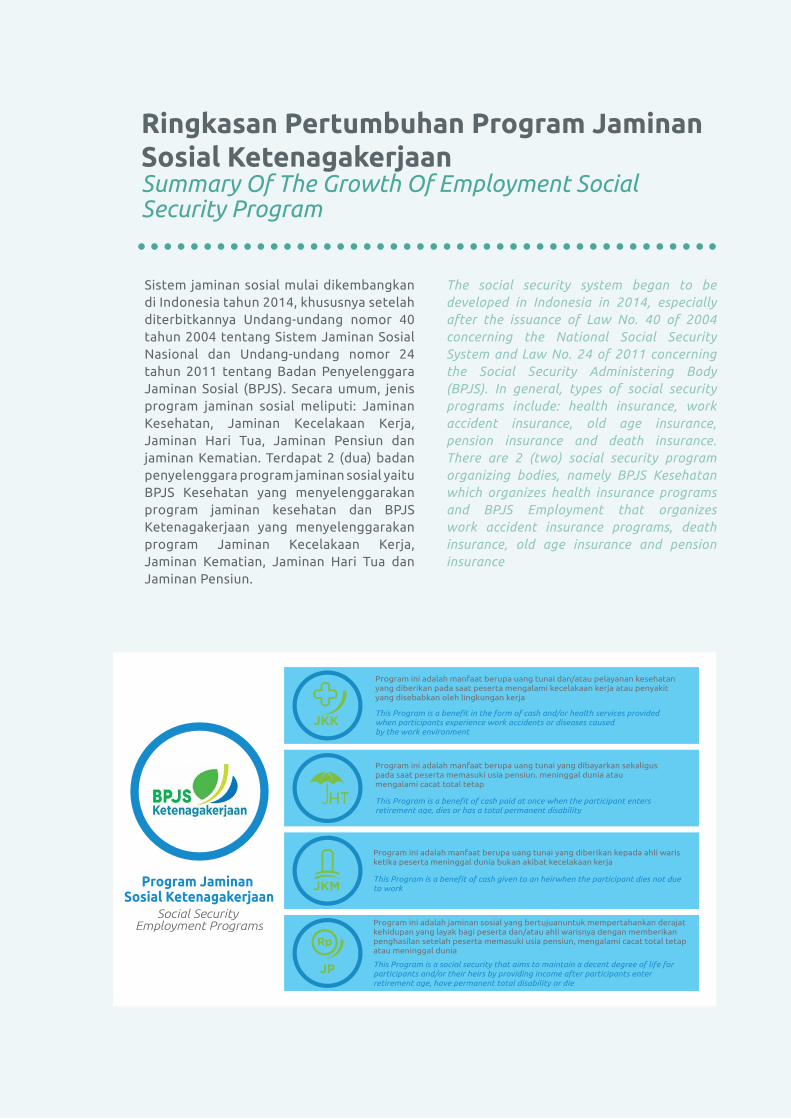
Stat
isti
k D
ana
Pen
siun
201
8/P
ensi
on F
und
Stat
isti
cs 2
018
37
Ringkasan Pertumbuhan Program Jaminan Sosial KetenagakerjaanSummary Of The Growth Of Employment Social Security Program
Sistem jaminan sosial mulai dikembangkan di Indonesia tahun 2014, khususnya setelah diterbitkannya Undang-undang nomor 40 tahun 2004 tentang Sistem Jaminan Sosial Nasional dan Undang-undang nomor 24 tahun 2011 tentang Badan Penyelenggara Jaminan Sosial (BPJS). Secara umum, jenis program jaminan sosial meliputi: Jaminan Kesehatan, Jaminan Kecelakaan Kerja, Jaminan Hari Tua, Jaminan Pensiun dan jaminan Kematian. Terdapat 2 (dua) badan penyelenggara program jaminan sosial yaitu BPJS Kesehatan yang menyelenggarakan program jaminan kesehatan dan BPJS Ketenagakerjaan yang menyelenggarakan program Jaminan Kecelakaan Kerja, Jaminan Kematian, Jaminan Hari Tua dan Jaminan Pensiun.
The social security system began to be developed in Indonesia in 2014, especially after the issuance of Law No. 40 of 2004 concerning the National Social Security System and Law No. 24 of 2011 concerning the Social Security Administering Body (BPJS). In general, types of social security programs include: health insurance, work accident insurance, old age insurance, pension insurance and death insurance. There are 2 (two) social security program organizing bodies, namely BPJS Kesehatan which organizes health insurance programs and BPJS Employment that organizes work accident insurance programs, death insurance, old age insurance and pension insurance
Program Jaminan Sosial Ketenagakerjaan
Social Security Employment Programs
Program ini adalah manfaat berupa uang tunai yang dibayarkan sekaligus pada saat peserta memasuki usia pensiun. meninggal dunia ataumengalami cacat total tetap
This Program is a benefit of cash paid at once when the participant enters retirement age, dies or has a total permanent disability
Program ini adalah manfaat berupa uang tunai dan/atau pelayanan kesehatan yang diberikan pada saat peserta mengalami kecelakaan kerja atau penyakit yang disebabkan oleh lingkungan kerja
This Program is a benefit in the form of cash and/or health services provided when participants experience work accidents or diseases caused by the work environment
Program ini adalah manfaat berupa uang tunai yang diberikan kepada ahli warisketika peserta meninggal dunia bukan akibat kecelakaan kerja
This Program is a benefit of cash given to an heirwhen the participant dies not due to work
Program ini adalah jaminan sosial yang bertujuanuntuk mempertahankan derajat kehidupan yang layak bagi peserta dan/atau ahli warisnya dengan memberikan penghasilan setelah peserta memasuki usia pensiun, mengalami cacat total tetap atau meninggal dunia
This Program is a social security that aims to maintain a decent degree of life for participants and/or their heirs by providing income after participants enter retirement age, have permanent total disability or die
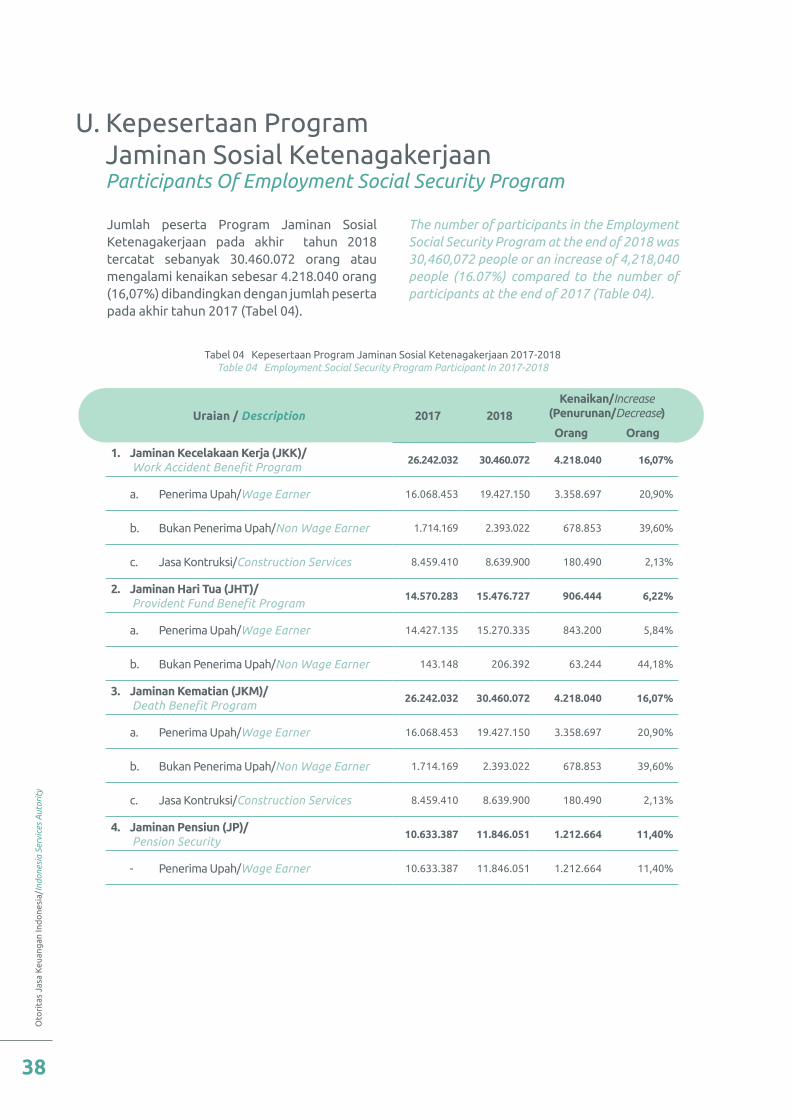
Oto
rita
s Ja
sa K
euan
gan
Ind
one
sia/
Indo
nesi
a Se
rvic
es A
utor
ity
38
Jumlah peserta Program Jaminan Sosial Ketenagakerjaan pada akhir tahun 2018 tercatat sebanyak 30.460.072 orang atau mengalami kenaikan sebesar 4.218.040 orang (16,07%) dibandingkan dengan jumlah peserta pada akhir tahun 2017 (Tabel 04).
The number of participants in the Employment Social Security Program at the end of 2018 was 30,460,072 people or an increase of 4,218,040 people (16.07%) compared to the number of participants at the end of 2017 (Table 04).
U. Kepesertaan Program Jaminan Sosial Ketenagakerjaan Participants Of Employment Social Security Program
Uraian / Description 2017 2018Kenaikan/Increase
(Penurunan/Decrease)
Orang Orang
1. Jaminan Kecelakaan Kerja (JKK)/ Work Accident Benefit Program
26.242.032 30.460.072 4.218.040 16,07%
a. Penerima Upah/Wage Earner 16.068.453 19.427.150 3.358.697 20,90%
b. Bukan Penerima Upah/Non Wage Earner 1.714.169 2.393.022 678.853 39,60%
c. Jasa Kontruksi/Construction Services 8.459.410 8.639.900 180.490 2,13%
2. Jaminan Hari Tua (JHT)/ Provident Fund Benefit Program
14.570.283 15.476.727 906.444 6,22%
a. Penerima Upah/Wage Earner 14.427.135 15.270.335 843.200 5,84%
b. Bukan Penerima Upah/Non Wage Earner 143.148 206.392 63.244 44,18%
3. Jaminan Kematian (JKM)/ Death Benefit Program
26.242.032 30.460.072 4.218.040 16,07%
a. Penerima Upah/Wage Earner 16.068.453 19.427.150 3.358.697 20,90%
b. Bukan Penerima Upah/Non Wage Earner 1.714.169 2.393.022 678.853 39,60%
c. Jasa Kontruksi/Construction Services 8.459.410 8.639.900 180.490 2,13%
4. Jaminan Pensiun (JP)/ Pension Security
10.633.387 11.846.051 1.212.664 11,40%
- Penerima Upah/Wage Earner 10.633.387 11.846.051 1.212.664 11,40%
Tabel 04 Kepesertaan Program Jaminan Sosial Ketenagakerjaan 2017-2018Table 04 Employment Social Security Program Participant In 2017-2018
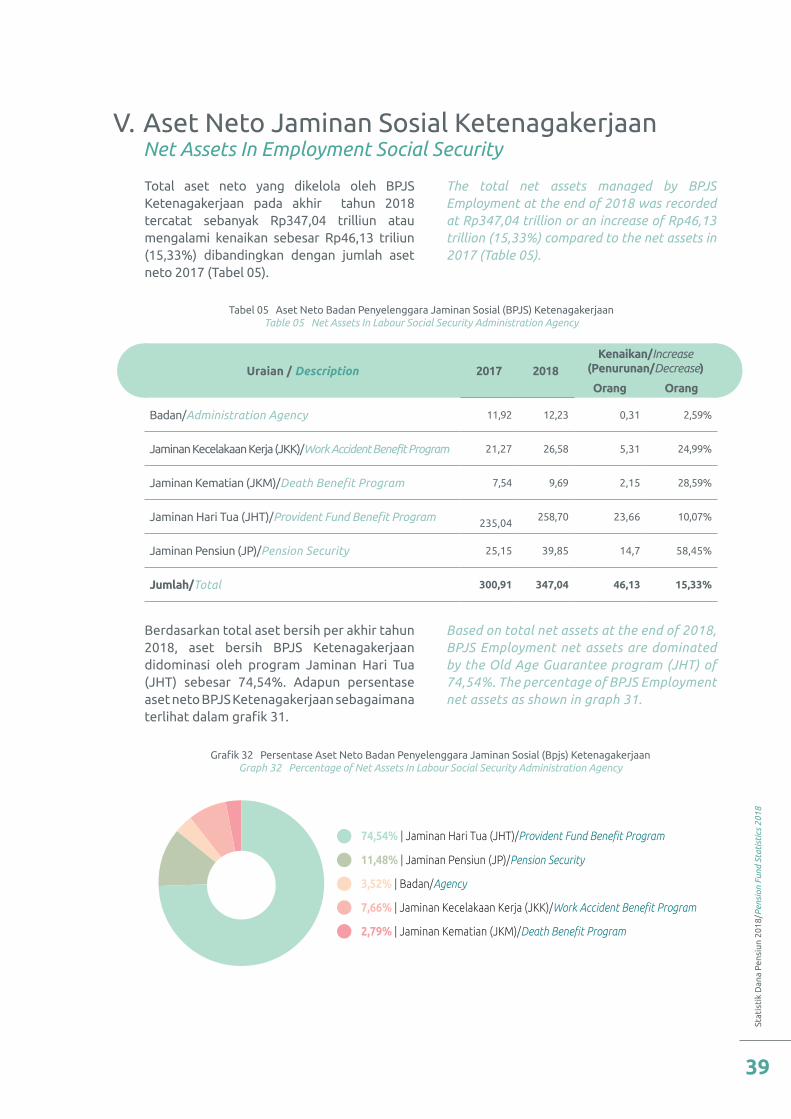
Stat
isti
k D
ana
Pen
siun
201
8/P
ensi
on F
und
Stat
isti
cs 2
018
39
Uraian / Description 2017 2018Kenaikan/Increase
(Penurunan/Decrease)
Orang Orang
Badan/Administration Agency 11,92 12,23 0,31 2,59%
Jaminan Kecelakaan Kerja (JKK)/Work Accident Benefit Program 21,27 26,58 5,31 24,99%
Jaminan Kematian (JKM)/Death Benefit Program 7,54 9,69 2,15 28,59%
Jaminan Hari Tua (JHT)/Provident Fund Benefit Program
235,04 258,70 23,66 10,07%
Jaminan Pensiun (JP)/Pension Security 25,15 39,85 14,7 58,45%
Jumlah/Total 300,91 347,04 46,13 15,33%
Tabel 05 Aset Neto Badan Penyelenggara Jaminan Sosial (BPJS) KetenagakerjaanTable 05 Net Assets In Labour Social Security Administration Agency
Total aset neto yang dikelola oleh BPJS Ketenagakerjaan pada akhir tahun 2018 tercatat sebanyak Rp347,04 trilliun atau mengalami kenaikan sebesar Rp46,13 triliun (15,33%) dibandingkan dengan jumlah aset neto 2017 (Tabel 05).
Berdasarkan total aset bersih per akhir tahun 2018, aset bersih BPJS Ketenagakerjaan didominasi oleh program Jaminan Hari Tua (JHT) sebesar 74,54%. Adapun persentase aset neto BPJS Ketenagakerjaan sebagaimana terlihat dalam grafik 31.
The total net assets managed by BPJS Employment at the end of 2018 was recorded at Rp347,04 trillion or an increase of Rp46,13 trillion (15,33%) compared to the net assets in 2017 (Table 05).
Based on total net assets at the end of 2018, BPJS Employment net assets are dominated by the Old Age Guarantee program (JHT) of 74,54%. The percentage of BPJS Employment net assets as shown in graph 31.
V. Aset Neto Jaminan Sosial Ketenagakerjaan Net Assets In Employment Social Security
Grafik 32 Persentase Aset Neto Badan Penyelenggara Jaminan Sosial (Bpjs) Ketenagakerjaan Graph 32 Percentage of Net Assets In Labour Social Security Administration Agency
74,54% | Jaminan Hari Tua (JHT)/Provident Fund Benefit Program
11,48% | Jaminan Pensiun (JP)/Pension Security
3,52% | Badan/Agency
7,66% | Jaminan Kecelakaan Kerja (JKK)/Work Accident Benefit Program
2,79% | Jaminan Kematian (JKM)/Death Benefit Program
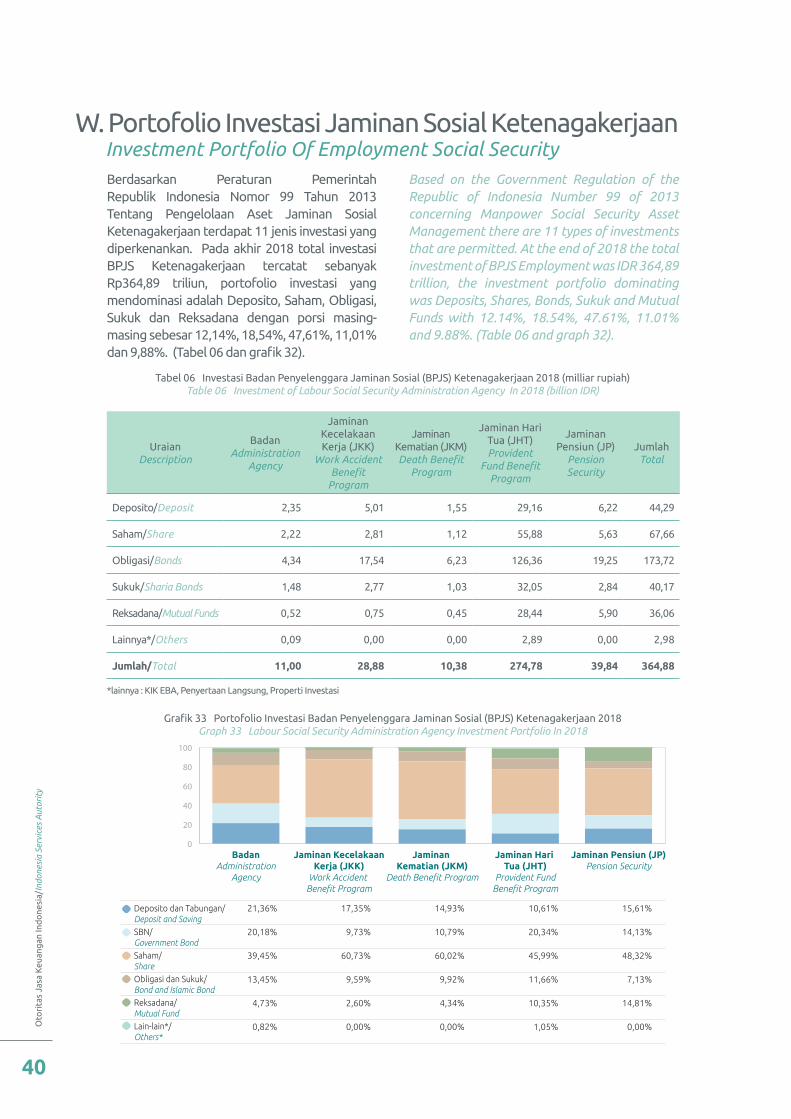
Oto
rita
s Ja
sa K
euan
gan
Ind
one
sia/
Indo
nesi
a Se
rvic
es A
utor
ity
40
Berdasarkan Peraturan Pemerintah Republik Indonesia Nomor 99 Tahun 2013 Tentang Pengelolaan Aset Jaminan Sosial Ketenagakerjaan terdapat 11 jenis investasi yang diperkenankan. Pada akhir 2018 total investasi BPJS Ketenagakerjaan tercatat sebanyak Rp364,89 triliun, portofolio investasi yang mendominasi adalah Deposito, Saham, Obligasi, Sukuk dan Reksadana dengan porsi masing-masing sebesar 12,14%, 18,54%, 47,61%, 11,01% dan 9,88%. (Tabel 06 dan grafik 32).
Based on the Government Regulation of the Republic of Indonesia Number 99 of 2013 concerning Manpower Social Security Asset Management there are 11 types of investments that are permitted. At the end of 2018 the total investment of BPJS Employment was IDR 364,89 trillion, the investment portfolio dominating was Deposits, Shares, Bonds, Sukuk and Mutual Funds with 12.14%, 18.54%, 47.61%, 11.01% and 9.88%. (Table 06 and graph 32).
W. Portofolio Investasi Jaminan Sosial Ketenagakerjaan Investment Portfolio Of Employment Social Security
UraianDescription
BadanAdministration
Agency
Jaminan Kecelakaan Kerja (JKK)
Work Accident Benefit
Program
Jaminan Kematian (JKM)Death Benefit
Program
Jaminan Hari Tua (JHT)Provident
Fund Benefit Program
Jaminan Pensiun (JP)
Pension Security
JumlahTotal
Deposito/Deposit 2,35 5,01 1,55 29,16 6,22 44,29
Saham/Share 2,22 2,81 1,12 55,88 5,63 67,66
Obligasi/Bonds 4,34 17,54 6,23 126,36 19,25 173,72
Sukuk/Sharia Bonds 1,48 2,77 1,03 32,05 2,84 40,17
Reksadana/Mutual Funds 0,52 0,75 0,45 28,44 5,90 36,06
Lainnya*/Others 0,09 0,00 0,00 2,89 0,00 2,98
Jumlah/Total 11,00 28,88 10,38 274,78 39,84 364,88
*lainnya : KIK EBA, Penyertaan Langsung, Properti Investasi
Tabel 06 Investasi Badan Penyelenggara Jaminan Sosial (BPJS) Ketenagakerjaan 2018 (milliar rupiah)Table 06 Investment of Labour Social Security Administration Agency In 2018 (billion IDR)
Grafik 33 Portofolio Investasi Badan Penyelenggara Jaminan Sosial (BPJS) Ketenagakerjaan 2018 Graph 33 Labour Social Security Administration Agency Investment Portfolio In 2018
0
20
40
60
80
100
BadanAdministration
Agency
Jaminan KecelakaanKerja (JKK)
Work Accident Benefit Program
Jaminan Kematian (JKM)
Death Benefit Program
Jaminan Hari Tua (JHT)
Provident FundBenefit Program
Jaminan Pensiun (JP)Pension Security
Deposito dan Tabungan/Deposit and SavingSBN/Government BondSaham/ShareObligasi dan Sukuk/Bond and Islamic BondReksadana/Mutual FundLain-lain*/Others*
21,36%
20,18%
39,45%
13,45%
4,73%
0,82%
17,35%
9,73%
60,73%
9,59%
2,60%
0,00%
14,93%
10,79%
60,02%
9,92%
4,34%
0,00%
10,61%
20,34%
45,99%
11,66%
10,35%
1,05%
15,61%
14,13%
48,32%
7,13%
14,81%
0,00%
Stat
isti
k D
ana
Pen
siun
201
8/P
ensi
on F
und
Stat
isti
cs 2
018
41
Statistik IndustriDana Pensiun 2018Statistics Of Pension Fund Industry 2018

Oto
rita
s Ja
sa K
euan
gan
Ind
one
sia/
Indo
nesi
a Se
rvic
es A
utor
ity
42
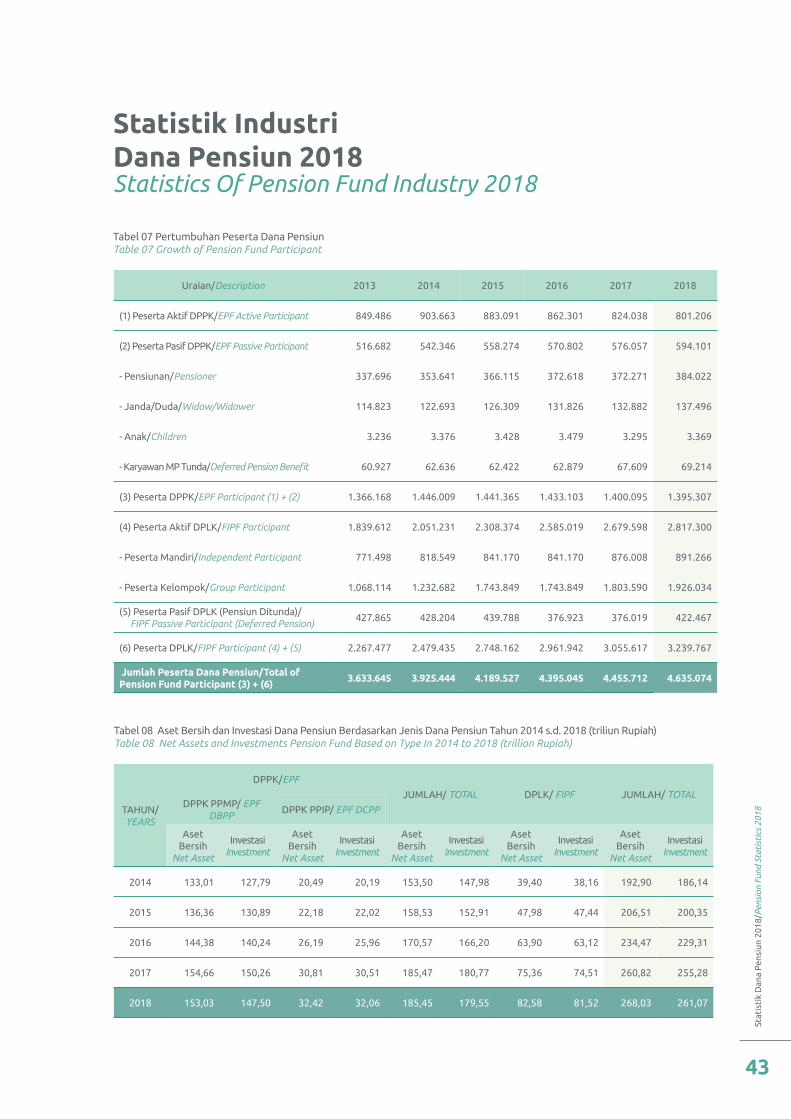
Stat
isti
k D
ana
Pen
siun
201
8/P
ensi
on F
und
Stat
isti
cs 2
018
43
Statistik IndustriDana Pensiun 2018Statistics Of Pension Fund Industry 2018
Tabel 07 Pertumbuhan Peserta Dana PensiunTable 07 Growth of Pension Fund Participant
Uraian/Description 2013 2014 2015 2016 2017 2018
(1) Peserta Aktif DPPK/EPF Active Participant 849.486 903.663 883.091 862.301 824.038 801.206
(2) Peserta Pasif DPPK/EPF Passive Participant 516.682 542.346 558.274 570.802 576.057 594.101
- Pensiunan/Pensioner 337.696 353.641 366.115 372.618 372.271 384.022
- Janda/Duda/Widow/Widower 114.823 122.693 126.309 131.826 132.882 137.496
- Anak/Children 3.236 3.376 3.428 3.479 3.295 3.369
- Karyawan MP Tunda/Deferred Pension Benefit 60.927 62.636 62.422 62.879 67.609 69.214
(3) Peserta DPPK/EPF Participant (1) + (2) 1.366.168 1.446.009 1.441.365 1.433.103 1.400.095 1.395.307
(4) Peserta Aktif DPLK/FIPF Participant 1.839.612 2.051.231 2.308.374 2.585.019 2.679.598 2.817.300
- Peserta Mandiri/Independent Participant 771.498 818.549 841.170 841.170 876.008 891.266
- Peserta Kelompok/Group Participant 1.068.114 1.232.682 1.743.849 1.743.849 1.803.590 1.926.034
(5) Peserta Pasif DPLK (Pensiun Ditunda)/ FIPF Passive Participant (Deferred Pension)
427.865 428.204 439.788 376.923 376.019 422.467
(6) Peserta DPLK/FIPF Participant (4) + (5) 2.267.477 2.479.435 2.748.162 2.961.942 3.055.617 3.239.767
Jumlah Peserta Dana Pensiun/Total of Pension Fund Participant (3) + (6)
3.633.645 3.925.444 4.189.527 4.395.045 4.455.712 4.635.074
Tabel 08 Aset Bersih dan Investasi Dana Pensiun Berdasarkan Jenis Dana Pensiun Tahun 2014 s.d. 2018 (triliun Rupiah)Table 08 Net Assets and Investments Pension Fund Based on Type In 2014 to 2018 (trillion Rupiah)
TAHUN/YEARS
DPPK/EPF
JUMLAH/ TOTAL DPLK/ FIPF JUMLAH/ TOTALDPPK PPMP/ EPF
DBPPDPPK PPIP/ EPF DCPP
Aset Bersih
Net Asset
InvestasiInvestment
Aset Bersih
Net Asset
InvestasiInvestment
Aset Bersih
Net Asset
InvestasiInvestment
Aset Bersih
Net Asset
InvestasiInvestment
Aset Bersih
Net Asset
InvestasiInvestment
2014 133,01 127,79 20,49 20,19 153,50 147,98 39,40 38,16 192,90 186,14
2015 136,36 130,89 22,18 22,02 158,53 152,91 47,98 47,44 206,51 200,35
2016 144,38 140,24 26,19 25,96 170,57 166,20 63,90 63,12 234,47 229,31
2017 154,66 150,26 30,81 30,51 185,47 180,77 75,36 74,51 260,82 255,28
2018 153,03 147,50 32,42 32,06 185,45 179,55 82,58 81,52 268,03 261,07
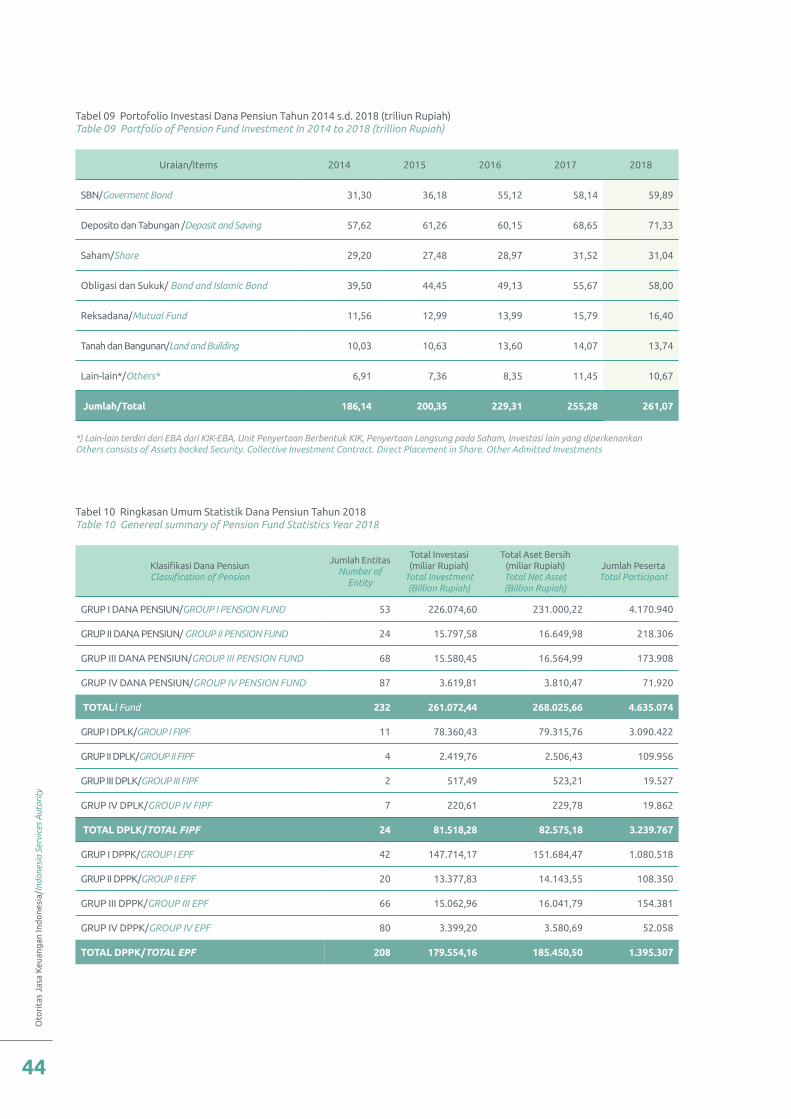
Oto
rita
s Ja
sa K
euan
gan
Ind
one
sia/
Indo
nesi
a Se
rvic
es A
utor
ity
44
Tabel 09 Portofolio Investasi Dana Pensiun Tahun 2014 s.d. 2018 (triliun Rupiah)Table 09 Portfolio of Pension Fund Investment In 2014 to 2018 (trillion Rupiah)
Tabel 10 Ringkasan Umum Statistik Dana Pensiun Tahun 2018Table 10 Genereal summary of Pension Fund Statistics Year 2018
Uraian/Items 2014 2015 2016 2017 2018
SBN/Goverment Bond 31,30 36,18 55,12 58,14 59,89
Deposito dan Tabungan /Deposit and Saving 57,62 61,26 60,15 68,65 71,33
Saham/Share 29,20 27,48 28,97 31,52 31,04
Obligasi dan Sukuk/ Bond and Islamic Bond 39,50 44,45 49,13 55,67 58,00
Reksadana/Mutual Fund 11,56 12,99 13,99 15,79 16,40
Tanah dan Bangunan/Land and Building 10,03 10,63 13,60 14,07 13,74
Lain-lain*/Others* 6,91 7,36 8,35 11,45 10,67
Jumlah/Total 186,14 200,35 229,31 255,28 261,07
Klasifikasi Dana PensiunClassification of Pension
Jumlah EntitasNumber of
Entity
Total Investasi (miliar Rupiah)
Total Investment (Billion Rupiah)
Total Aset Bersih (miliar Rupiah)Total Net Asset (Billion Rupiah)
Jumlah PesertaTotal Participant
GRUP I DANA PENSIUN/GROUP I PENSION FUND 53 226.074,60 231.000,22 4.170.940
GRUP II DANA PENSIUN/ GROUP II PENSION FUND 24 15.797,58 16.649,98 218.306
GRUP III DANA PENSIUN/GROUP III PENSION FUND 68 15.580,45 16.564,99 173.908
GRUP IV DANA PENSIUN/GROUP IV PENSION FUND 87 3.619,81 3.810,47 71.920
TOTALl Fund 232 261.072,44 268.025,66 4.635.074
GRUP I DPLK/GROUP I FIPF 11 78.360,43 79.315,76 3.090.422
GRUP II DPLK/GROUP II FIPF 4 2.419,76 2.506,43 109.956
GRUP III DPLK/GROUP III FIPF 2 517,49 523,21 19.527
GRUP IV DPLK/GROUP IV FIPF 7 220,61 229,78 19.862
TOTAL DPLK/TOTAL FIPF 24 81.518,28 82.575,18 3.239.767
GRUP I DPPK/GROUP I EPF 42 147.714,17 151.684,47 1.080.518
GRUP II DPPK/GROUP II EPF 20 13.377,83 14.143,55 108.350
GRUP III DPPK/GROUP III EPF 66 15.062,96 16.041,79 154.381
GRUP IV DPPK/GROUP IV EPF 80 3.399,20 3.580,69 52.058
TOTAL DPPK/TOTAL EPF 208 179.554,16 185.450,50 1.395.307
*) Lain-lain terdiri dari EBA dari KIK-EBA, Unit Penyertaan Berbentuk KIK, Penyertaan Langsung pada Saham, Investasi lain yang diperkenankanOthers consists of Assets backed Security. Collective Investment Contract. Direct Placement in Share. Other Admitted Investments
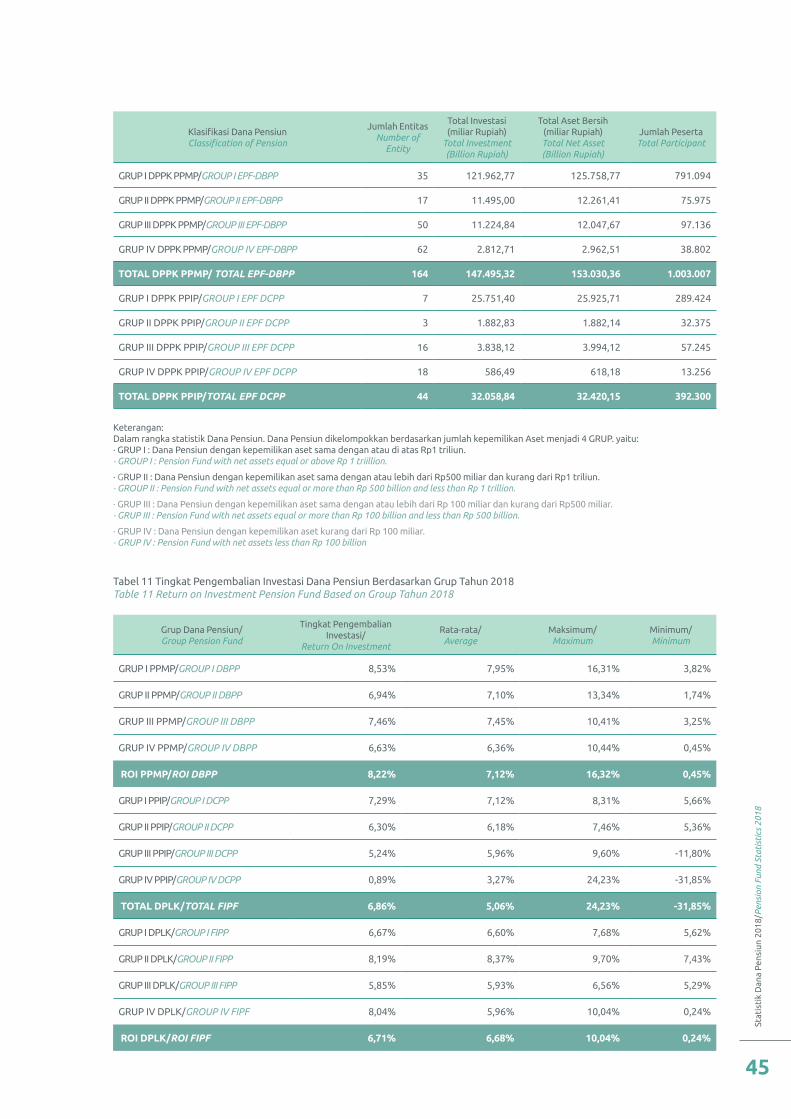
Stat
isti
k D
ana
Pen
siun
201
8/P
ensi
on F
und
Stat
isti
cs 2
018
45
Klasifikasi Dana PensiunClassification of Pension
Jumlah EntitasNumber of
Entity
Total Investasi (miliar Rupiah)
Total Investment (Billion Rupiah)
Total Aset Bersih (miliar Rupiah)Total Net Asset (Billion Rupiah)
Jumlah PesertaTotal Participant
GRUP I DPPK PPMP/GROUP I EPF-DBPP 35 121.962,77 125.758,77 791.094
GRUP II DPPK PPMP/GROUP II EPF-DBPP 17 11.495,00 12.261,41 75.975
GRUP III DPPK PPMP/GROUP III EPF-DBPP 50 11.224,84 12.047,67 97.136
GRUP IV DPPK PPMP/GROUP IV EPF-DBPP 62 2.812,71 2.962,51 38.802
TOTAL DPPK PPMP/ TOTAL EPF-DBPP 164 147.495,32 153.030,36 1.003.007
GRUP I DPPK PPIP/GROUP I EPF DCPP 7 25.751,40 25.925,71 289.424
GRUP II DPPK PPIP/GROUP II EPF DCPP 3 1.882,83 1.882,14 32.375
GRUP III DPPK PPIP/GROUP III EPF DCPP 16 3.838,12 3.994,12 57.245
GRUP IV DPPK PPIP/GROUP IV EPF DCPP 18 586,49 618,18 13.256
TOTAL DPPK PPIP/TOTAL EPF DCPP 44 32.058,84 32.420,15 392.300
Keterangan:Dalam rangka statistik Dana Pensiun. Dana Pensiun dikelompokkan berdasarkan jumlah kepemilikan Aset menjadi 4 GRUP. yaitu:· GRUP I : Dana Pensiun dengan kepemilikan aset sama dengan atau di atas Rp1 triliun.· GROUP I : Pension Fund with net assets equal or above Rp 1 triillion.
· GRUP II : Dana Pensiun dengan kepemilikan aset sama dengan atau lebih dari Rp500 miliar dan kurang dari Rp1 triliun.· GROUP II : Pension Fund with net assets equal or more than Rp 500 billion and less than Rp 1 trillion.
· GRUP III : Dana Pensiun dengan kepemilikan aset sama dengan atau lebih dari Rp 100 miliar dan kurang dari Rp500 miliar.· GRUP III : Pension Fund with net assets equal or more than Rp 100 billion and less than Rp 500 billion.
· GRUP IV : Dana Pensiun dengan kepemilikan aset kurang dari Rp 100 miliar.· GRUP IV : Pension Fund with net assets less than Rp 100 billion
Tabel 11 Tingkat Pengembalian Investasi Dana Pensiun Berdasarkan Grup Tahun 2018Table 11 Return on Investment Pension Fund Based on Group Tahun 2018
Grup Dana Pensiun/ Group Pension Fund
Tingkat Pengembalian Investasi/
Return On Investment
Rata-rata/ Average
Maksimum/Maximum
Minimum/Minimum
GRUP I PPMP/GROUP I DBPP 8,53% 7,95% 16,31% 3,82%
GRUP II PPMP/GROUP II DBPP 6,94% 7,10% 13,34% 1,74%
GRUP III PPMP/GROUP III DBPP 7,46% 7,45% 10,41% 3,25%
GRUP IV PPMP/GROUP IV DBPP 6,63% 6,36% 10,44% 0,45%
ROI PPMP/ROI DBPP 8,22% 7,12% 16,32% 0,45%
GRUP I PPIP/GROUP I DCPP 7,29% 7,12% 8,31% 5,66%
GRUP II PPIP/GROUP II DCPP 6,30% 6,18% 7,46% 5,36%
GRUP III PPIP/GROUP III DCPP 5,24% 5,96% 9,60% -11,80%
GRUP IV PPIP/GROUP IV DCPP 0,89% 3,27% 24,23% -31,85%
TOTAL DPLK/TOTAL FIPF 6,86% 5,06% 24,23% -31,85%
GRUP I DPLK/GROUP I FIPP 6,67% 6,60% 7,68% 5,62%
GRUP II DPLK/GROUP II FIPP 8,19% 8,37% 9,70% 7,43%
GRUP III DPLK/GROUP III FIPP 5,85% 5,93% 6,56% 5,29%
GRUP IV DPLK/GROUP IV FIPF 8,04% 5,96% 10,04% 0,24%
ROI DPLK/ROI FIPF 6,71% 6,68% 10,04% 0,24%
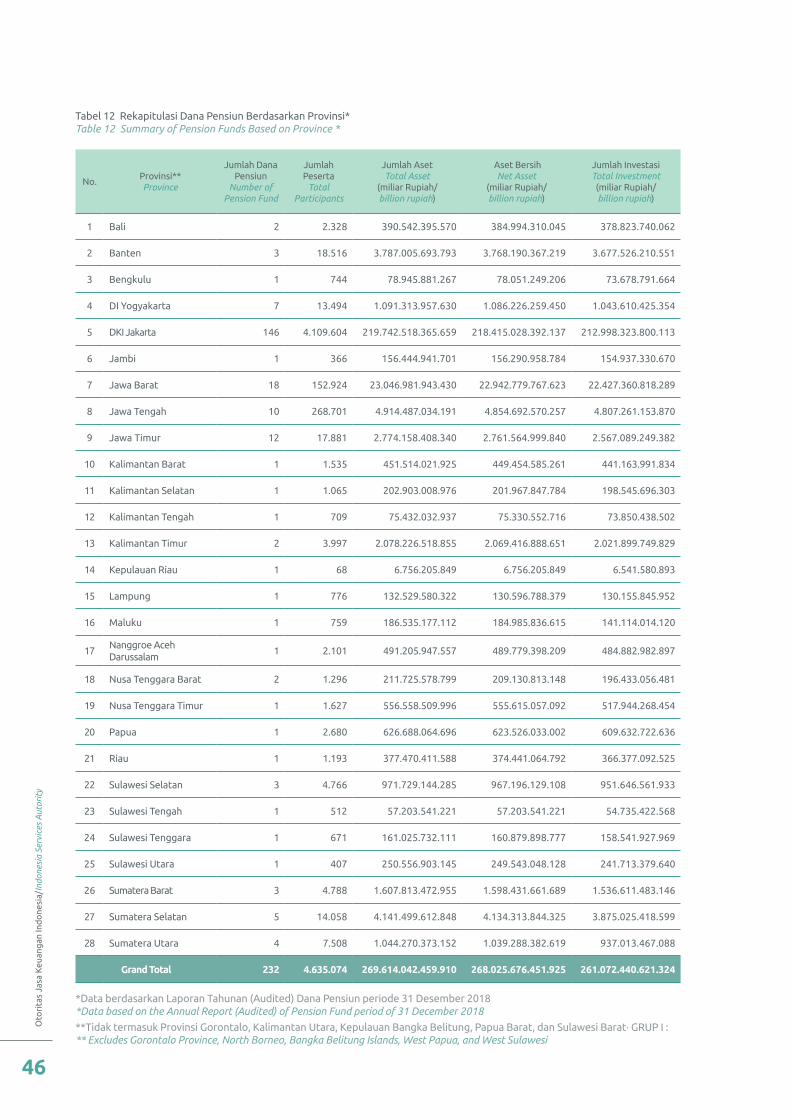
Oto
rita
s Ja
sa K
euan
gan
Ind
one
sia/
Indo
nesi
a Se
rvic
es A
utor
ity
46
Tabel 12 Rekapitulasi Dana Pensiun Berdasarkan Provinsi*Table 12 Summary of Pension Funds Based on Province *
No.Provinsi**Province
Jumlah Dana Pensiun
Number of Pension Fund
Jumlah Peserta
TotalParticipants
Jumlah AsetTotal Asset
(miliar Rupiah/billion rupiah)
Aset BersihNet Asset
(miliar Rupiah/billion rupiah)
Jumlah InvestasiTotal Investment(miliar Rupiah/billion rupiah)
1 Bali 2 2.328 390.542.395.570 384.994.310.045 378.823.740.062
2 Banten 3 18.516 3.787.005.693.793 3.768.190.367.219 3.677.526.210.551
3 Bengkulu 1 744 78.945.881.267 78.051.249.206 73.678.791.664
4 DI Yogyakarta 7 13.494 1.091.313.957.630 1.086.226.259.450 1.043.610.425.354
5 DKI Jakarta 146 4.109.604 219.742.518.365.659 218.415.028.392.137 212.998.323.800.113
6 Jambi 1 366 156.444.941.701 156.290.958.784 154.937.330.670
7 Jawa Barat 18 152.924 23.046.981.943.430 22.942.779.767.623 22.427.360.818.289
8 Jawa Tengah 10 268.701 4.914.487.034.191 4.854.692.570.257 4.807.261.153.870
9 Jawa Timur 12 17.881 2.774.158.408.340 2.761.564.999.840 2.567.089.249.382
10 Kalimantan Barat 1 1.535 451.514.021.925 449.454.585.261 441.163.991.834
11 Kalimantan Selatan 1 1.065 202.903.008.976 201.967.847.784 198.545.696.303
12 Kalimantan Tengah 1 709 75.432.032.937 75.330.552.716 73.850.438.502
13 Kalimantan Timur 2 3.997 2.078.226.518.855 2.069.416.888.651 2.021.899.749.829
14 Kepulauan Riau 1 68 6.756.205.849 6.756.205.849 6.541.580.893
15 Lampung 1 776 132.529.580.322 130.596.788.379 130.155.845.952
16 Maluku 1 759 186.535.177.112 184.985.836.615 141.114.014.120
17Nanggroe Aceh Darussalam
1 2.101 491.205.947.557 489.779.398.209 484.882.982.897
18 Nusa Tenggara Barat 2 1.296 211.725.578.799 209.130.813.148 196.433.056.481
19 Nusa Tenggara Timur 1 1.627 556.558.509.996 555.615.057.092 517.944.268.454
20 Papua 1 2.680 626.688.064.696 623.526.033.002 609.632.722.636
21 Riau 1 1.193 377.470.411.588 374.441.064.792 366.377.092.525
22 Sulawesi Selatan 3 4.766 971.729.144.285 967.196.129.108 951.646.561.933
23 Sulawesi Tengah 1 512 57.203.541.221 57.203.541.221 54.735.422.568
24 Sulawesi Tenggara 1 671 161.025.732.111 160.879.898.777 158.541.927.969
25 Sulawesi Utara 1 407 250.556.903.145 249.543.048.128 241.713.379.640
26 Sumatera Barat 3 4.788 1.607.813.472.955 1.598.431.661.689 1.536.611.483.146
27 Sumatera Selatan 5 14.058 4.141.499.612.848 4.134.313.844.325 3.875.025.418.599
28 Sumatera Utara 4 7.508 1.044.270.373.152 1.039.288.382.619 937.013.467.088
Grand Total 232 4.635.074 269.614.042.459.910 268.025.676.451.925 261.072.440.621.324
*Data berdasarkan Laporan Tahunan (Audited) Dana Pensiun periode 31 Desember 2018*Data based on the Annual Report (Audited) of Pension Fund period of 31 December 2018
**Tidak termasuk Provinsi Gorontalo, Kalimantan Utara, Kepulauan Bangka Belitung, Papua Barat, dan Sulawesi Barat· GRUP I : ** Excludes Gorontalo Province, North Borneo, Bangka Belitung Islands, West Papua, and West Sulawesi
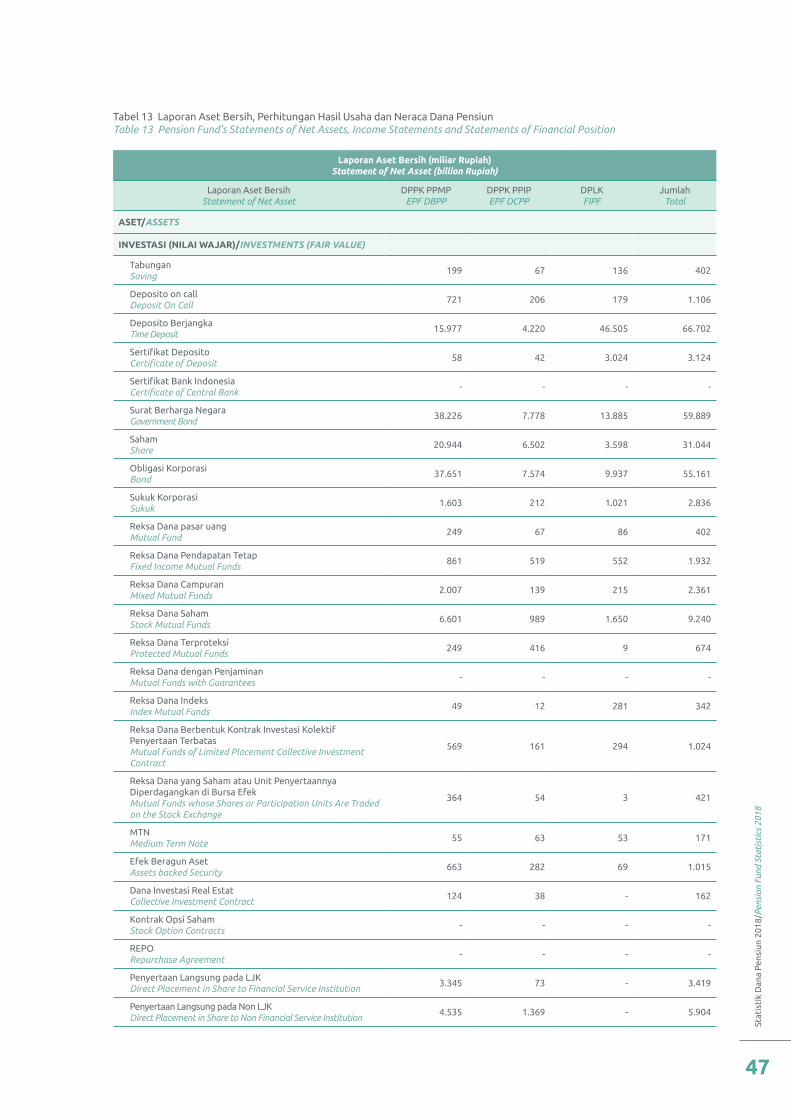
Stat
isti
k D
ana
Pen
siun
201
8/P
ensi
on F
und
Stat
isti
cs 2
018
47
Tabel 13 Laporan Aset Bersih, Perhitungan Hasil Usaha dan Neraca Dana PensiunTable 13 Pension Fund’s Statements of Net Assets, Income Statements and Statements of Financial Position
Laporan Aset Bersih (miliar Rupiah) Statement of Net Asset (billion Rupiah)
Laporan Aset BersihStatement of Net Asset
DPPK PPMPEPF DBPP
DPPK PPIPEPF DCPP
DPLKFIPF
JumlahTotal
ASET/ASSETS
INVESTASI (NILAI WAJAR)/INVESTMENTS (FAIR VALUE)
Tabungan Saving
199 67 136 402
Deposito on call Deposit On Call
721 206 179 1.106
Deposito Berjangka Time Deposit
15.977 4.220 46.505 66.702
Sertifikat Deposito Certificate of Deposit
58 42 3.024 3.124
Sertifikat Bank Indonesia Certificate of Central Bank
- - - -
Surat Berharga Negara Government Bond
38.226 7.778 13.885 59.889
Saham Share
20.944 6.502 3.598 31.044
Obligasi Korporasi Bond
37.651 7.574 9.937 55.161
Sukuk Korporasi Sukuk
1.603 212 1.021 2.836
Reksa Dana pasar uang Mutual Fund
249 67 86 402
Reksa Dana Pendapatan Tetap Fixed Income Mutual Funds
861 519 552 1.932
Reksa Dana Campuran Mixed Mutual Funds
2.007 139 215 2.361
Reksa Dana Saham Stock Mutual Funds
6.601 989 1.650 9.240
Reksa Dana Terproteksi Protected Mutual Funds
249 416 9 674
Reksa Dana dengan Penjaminan Mutual Funds with Guarantees
- - - -
Reksa Dana Indeks Index Mutual Funds
49 12 281 342
Reksa Dana Berbentuk Kontrak Investasi Kolektif Penyertaan Terbatas Mutual Funds of Limited Placement Collective Investment Contract
569 161 294 1.024
Reksa Dana yang Saham atau Unit Penyertaannya Diperdagangkan di Bursa Efek Mutual Funds whose Shares or Participation Units Are Traded on the Stock Exchange
364 54 3 421
MTN Medium Term Note
55 63 53 171
Efek Beragun AsetAssets backed Security
663 282 69 1.015
Dana Investasi Real EstatCollective Investment Contract
124 38 - 162
Kontrak Opsi SahamStock Option Contracts
- - - -
REPORepurchase Agreement
- - - -
Penyertaan Langsung pada LJK Direct Placement in Share to Financial Service Institution
3.345 73 - 3.419
Penyertaan Langsung pada Non LJK Direct Placement in Share to Non Financial Service Institution
4.535 1.369 - 5.904
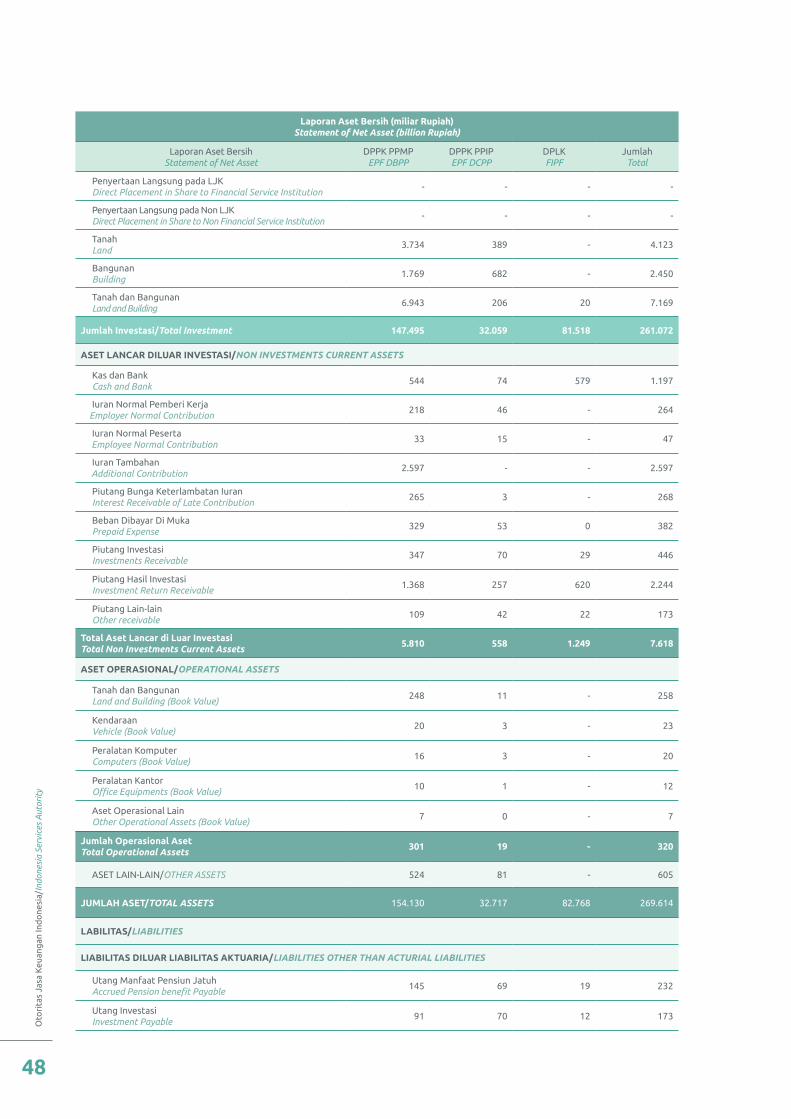
Oto
rita
s Ja
sa K
euan
gan
Ind
one
sia/
Indo
nesi
a Se
rvic
es A
utor
ity
48
Laporan Aset Bersih (miliar Rupiah) Statement of Net Asset (billion Rupiah)
Laporan Aset BersihStatement of Net Asset
DPPK PPMPEPF DBPP
DPPK PPIPEPF DCPP
DPLKFIPF
JumlahTotal
Penyertaan Langsung pada LJK Direct Placement in Share to Financial Service Institution
- - - -
Penyertaan Langsung pada Non LJK Direct Placement in Share to Non Financial Service Institution
- - - -
TanahLand
3.734 389 - 4.123
BangunanBuilding
1.769 682 - 2.450
Tanah dan BangunanLand and Building
6.943 206 20 7.169
Jumlah Investasi/Total Investment 147.495 32.059 81.518 261.072
ASET LANCAR DILUAR INVESTASI/NON INVESTMENTS CURRENT ASSETS
Kas dan BankCash and Bank
544 74 579 1.197
Iuran Normal Pemberi Kerja Employer Normal Contribution
218 46 - 264
Iuran Normal Peserta Employee Normal Contribution
33 15 - 47
Iuran Tambahan Additional Contribution
2.597 - - 2.597
Piutang Bunga Keterlambatan IuranInterest Receivable of Late Contribution
265 3 - 268
Beban Dibayar Di MukaPrepaid Expense
329 53 0 382
Piutang Investasi Investments Receivable
347 70 29 446
Piutang Hasil Investasi Investment Return Receivable
1.368 257 620 2.244
Piutang Lain-lain Other receivable
109 42 22 173
Total Aset Lancar di Luar InvestasiTotal Non Investments Current Assets
5.810 558 1.249 7.618
ASET OPERASIONAL/OPERATIONAL ASSETS
Tanah dan BangunanLand and Building (Book Value)
248 11 - 258
Kendaraan Vehicle (Book Value)
20 3 - 23
Peralatan Komputer Computers (Book Value)
16 3 - 20
Peralatan Kantor Office Equipments (Book Value)
10 1 - 12
Aset Operasional Lain Other Operational Assets (Book Value)
7 0 - 7
Jumlah Operasional AsetTotal Operational Assets
301 19 - 320
ASET LAIN-LAIN/OTHER ASSETS 524 81 - 605
JUMLAH ASET/TOTAL ASSETS 154.130 32.717 82.768 269.614
LABILITAS/LIABILITIES
LIABILITAS DILUAR LIABILITAS AKTUARIA/LIABILITIES OTHER THAN ACTURIAL LIABILITIES
Utang Manfaat Pensiun JatuhAccrued Pension benefit Payable
145 69 19 232
Utang Investasi Investment Payable
91 70 12 173
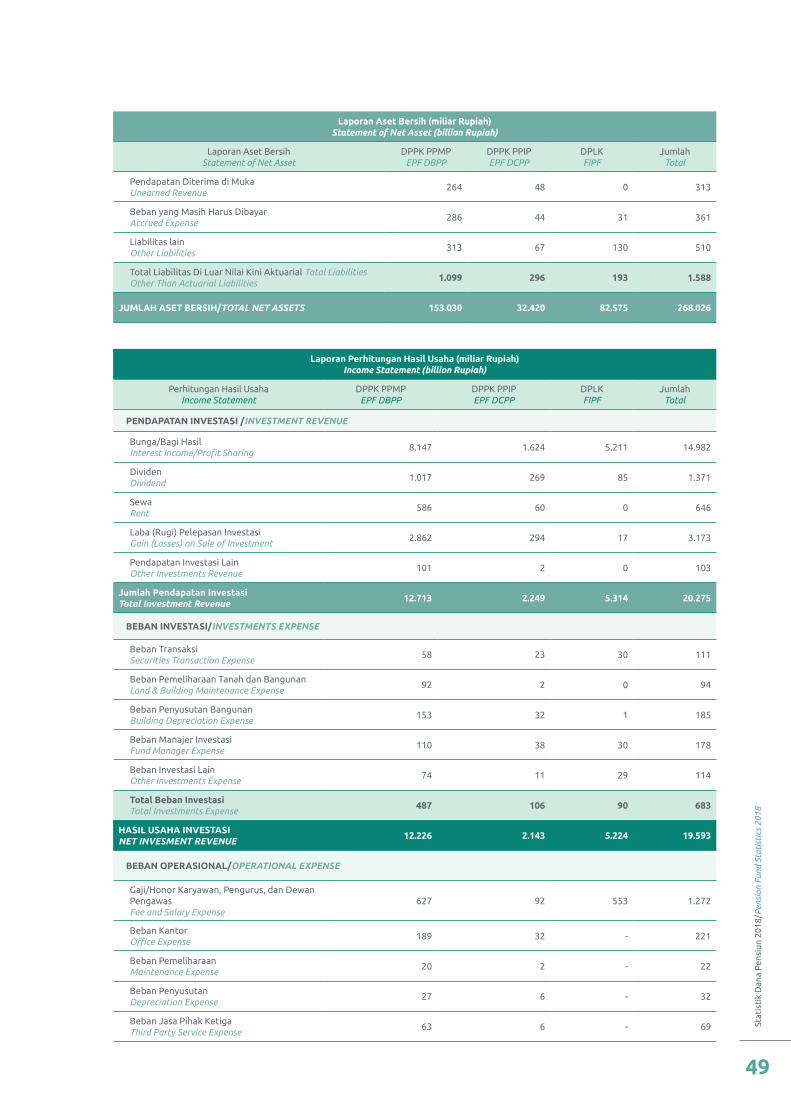
Stat
isti
k D
ana
Pen
siun
201
8/P
ensi
on F
und
Stat
isti
cs 2
018
49
Laporan Aset Bersih (miliar Rupiah) Statement of Net Asset (billion Rupiah)
Laporan Aset BersihStatement of Net Asset
DPPK PPMPEPF DBPP
DPPK PPIPEPF DCPP
DPLKFIPF
JumlahTotal
Pendapatan Diterima di Muka Unearned Revenue
264 48 0 313
Beban yang Masih Harus Dibayar Accrued Expense
286 44 31 361
Liabilitas lain Other Liabilities
313 67 130 510
Total Liabilitas Di Luar Nilai Kini Aktuarial Total Liabilities Other Than Actuarial Liabilities
1.099 296 193 1.588
JUMLAH ASET BERSIH/TOTAL NET ASSETS 153.030 32.420 82.575 268.026
Laporan Perhitungan Hasil Usaha (miliar Rupiah) Income Statement (billion Rupiah)
Perhitungan Hasil UsahaIncome Statement
DPPK PPMPEPF DBPP
DPPK PPIPEPF DCPP
DPLKFIPF
JumlahTotal
PENDAPATAN INVESTASI /INVESTMENT REVENUE
Bunga/Bagi Hasil Interest Income/Profit Sharing
8.147 1.624 5.211 14.982
Dividen Dividend
1.017 269 85 1.371
Sewa Rent
586 60 0 646
Laba (Rugi) Pelepasan Investasi Gain (Losses) on Sale of Investment
2.862 294 17 3.173
Pendapatan Investasi Lain Other Investments Revenue
101 2 0 103
Jumlah Pendapatan InvestasiTotal Investment Revenue
12.713 2.249 5.314 20.275
BEBAN INVESTASI/INVESTMENTS EXPENSE
Beban TransaksiSecurities Transaction Expense
58 23 30 111
Beban Pemeliharaan Tanah dan Bangunan Land & Building Maintenance Expense
92 2 0 94
Beban Penyusutan Bangunan Building Depreciation Expense
153 32 1 185
Beban Manajer Investasi Fund Manager Expense
110 38 30 178
Beban Investasi Lain Other Investments Expense
74 11 29 114
Total Beban InvestasiTotal Investments Expense
487 106 90 683
HASIL USAHA INVESTASINET INVESMENT REVENUE
12.226 2.143 5.224 19.593
BEBAN OPERASIONAL/OPERATIONAL EXPENSE
Gaji/Honor Karyawan, Pengurus, dan Dewan Pengawas Fee and Salary Expense
627 92 553 1.272
Beban KantorOffice Expense
189 32 - 221
Beban PemeliharaanMaintenance Expense
20 2 - 22
Beban PenyusutanDepreciation Expense
27 6 - 32
Beban Jasa Pihak KetigaThird Party Service Expense
63 6 - 69
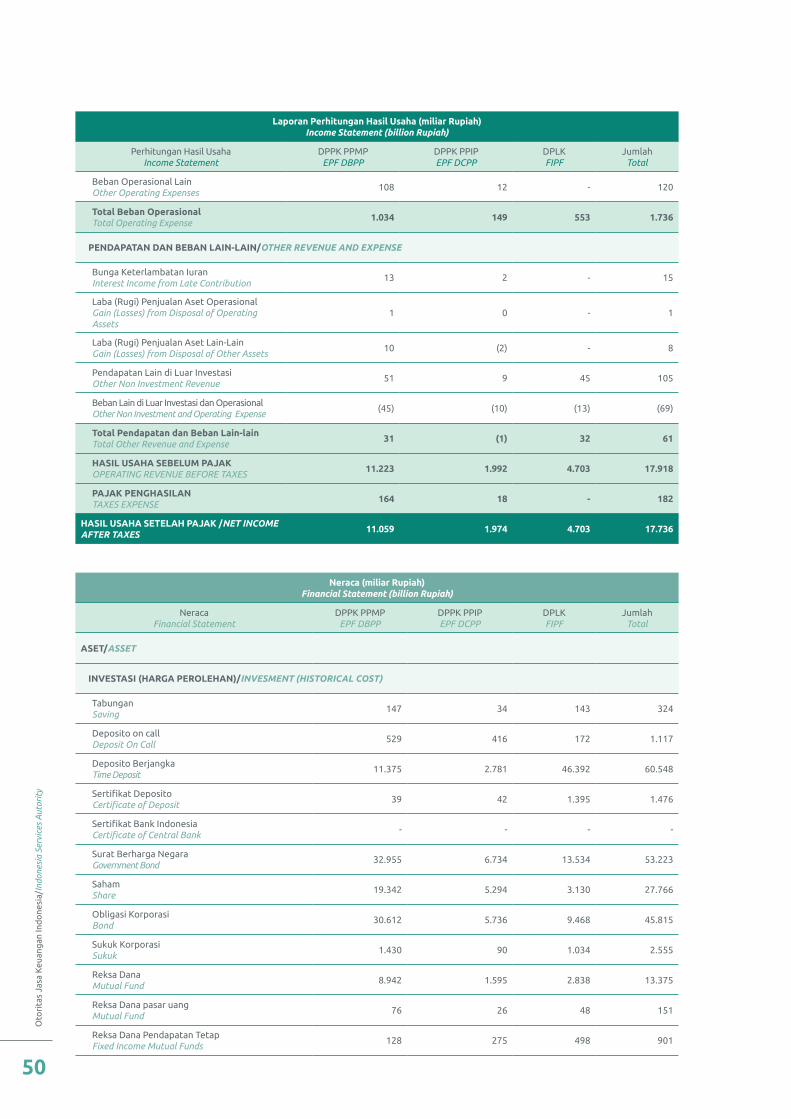
Oto
rita
s Ja
sa K
euan
gan
Ind
one
sia/
Indo
nesi
a Se
rvic
es A
utor
ity
50
Laporan Perhitungan Hasil Usaha (miliar Rupiah) Income Statement (billion Rupiah)
Perhitungan Hasil UsahaIncome Statement
DPPK PPMPEPF DBPP
DPPK PPIPEPF DCPP
DPLKFIPF
JumlahTotal
Beban Operasional LainOther Operating Expenses
108 12 - 120
Total Beban Operasional Total Operating Expense
1.034 149 553 1.736
PENDAPATAN DAN BEBAN LAIN-LAIN/OTHER REVENUE AND EXPENSE
Bunga Keterlambatan IuranInterest Income from Late Contribution
13 2 - 15
Laba (Rugi) Penjualan Aset OperasionalGain (Losses) from Disposal of Operating Assets
1 0 - 1
Laba (Rugi) Penjualan Aset Lain-LainGain (Losses) from Disposal of Other Assets
10 (2) - 8
Pendapatan Lain di Luar InvestasiOther Non Investment Revenue
51 9 45 105
Beban Lain di Luar Investasi dan OperasionalOther Non Investment and Operating Expense
(45) (10) (13) (69)
Total Pendapatan dan Beban Lain-lain Total Other Revenue and Expense
31 (1) 32 61
HASIL USAHA SEBELUM PAJAK OPERATING REVENUE BEFORE TAXES
11.223 1.992 4.703 17.918
PAJAK PENGHASILANTAXES EXPENSE
164 18 - 182
HASIL USAHA SETELAH PAJAK /NET INCOME AFTER TAXES
11.059 1.974 4.703 17.736
Neraca (miliar Rupiah) Financial Statement (billion Rupiah)
NeracaFinancial Statement
DPPK PPMPEPF DBPP
DPPK PPIPEPF DCPP
DPLKFIPF
JumlahTotal
ASET/ASSET
INVESTASI (HARGA PEROLEHAN)/INVESMENT (HISTORICAL COST)
Tabungan Saving
147 34 143 324
Deposito on call Deposit On Call
529 416 172 1.117
Deposito Berjangka Time Deposit
11.375 2.781 46.392 60.548
Sertifikat Deposito Certificate of Deposit
39 42 1.395 1.476
Sertifikat Bank Indonesia Certificate of Central Bank
- - - -
Surat Berharga Negara Government Bond
32.955 6.734 13.534 53.223
Saham Share
19.342 5.294 3.130 27.766
Obligasi Korporasi Bond
30.612 5.736 9.468 45.815
Sukuk Korporasi Sukuk
1.430 90 1.034 2.555
Reksa Dana Mutual Fund
8.942 1.595 2.838 13.375
Reksa Dana pasar uang Mutual Fund
76 26 48 151
Reksa Dana Pendapatan Tetap Fixed Income Mutual Funds
128 275 498 901
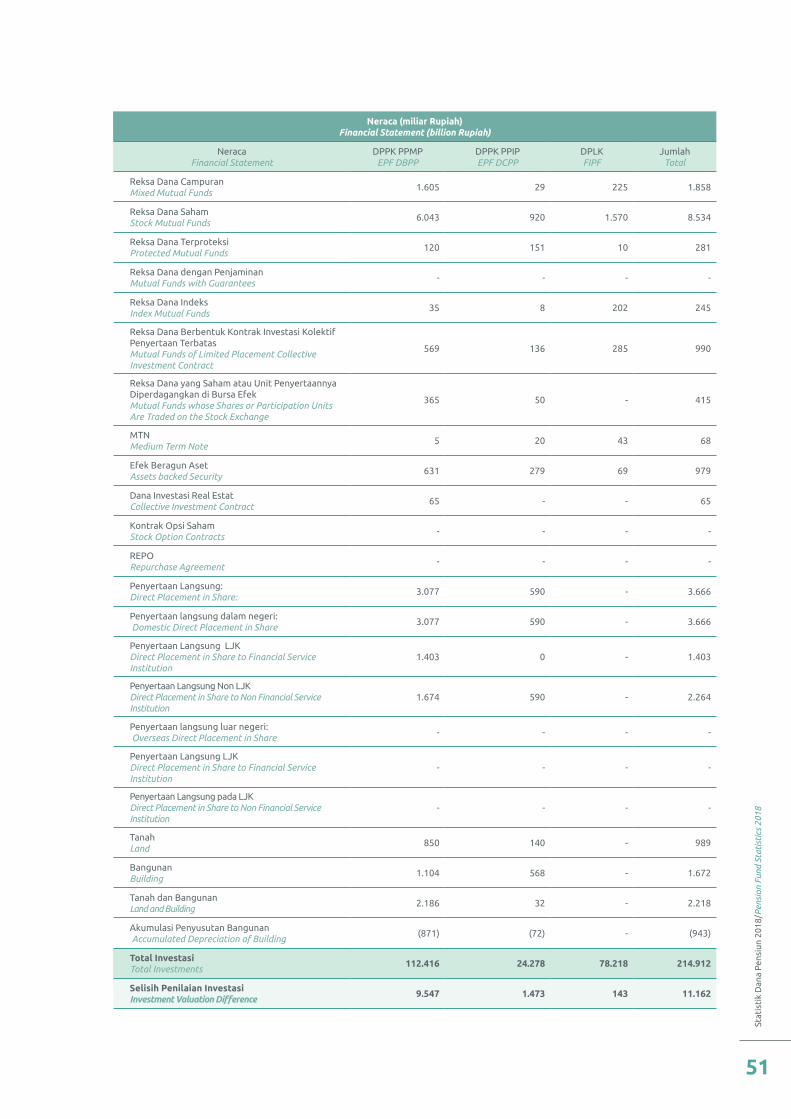
Stat
isti
k D
ana
Pen
siun
201
8/P
ensi
on F
und
Stat
isti
cs 2
018
51
Neraca (miliar Rupiah) Financial Statement (billion Rupiah)
NeracaFinancial Statement
DPPK PPMPEPF DBPP
DPPK PPIPEPF DCPP
DPLKFIPF
JumlahTotal
Reksa Dana Campuran Mixed Mutual Funds
1.605 29 225 1.858
Reksa Dana Saham Stock Mutual Funds
6.043 920 1.570 8.534
Reksa Dana Terproteksi Protected Mutual Funds
120 151 10 281
Reksa Dana dengan Penjaminan Mutual Funds with Guarantees
- - - -
Reksa Dana Indeks Index Mutual Funds
35 8 202 245
Reksa Dana Berbentuk Kontrak Investasi Kolektif Penyertaan Terbatas Mutual Funds of Limited Placement Collective Investment Contract
569 136 285 990
Reksa Dana yang Saham atau Unit Penyertaannya Diperdagangkan di Bursa Efek Mutual Funds whose Shares or Participation Units Are Traded on the Stock Exchange
365 50 - 415
MTN Medium Term Note
5 20 43 68
Efek Beragun AsetAssets backed Security
631 279 69 979
Dana Investasi Real EstatCollective Investment Contract
65 - - 65
Kontrak Opsi SahamStock Option Contracts
- - - -
REPORepurchase Agreement
- - - -
Penyertaan Langsung:Direct Placement in Share:
3.077 590 - 3.666
Penyertaan langsung dalam negeri: Domestic Direct Placement in Share
3.077 590 - 3.666
Penyertaan Langsung LJK Direct Placement in Share to Financial Service Institution
1.403 0 - 1.403
Penyertaan Langsung Non LJK Direct Placement in Share to Non Financial Service Institution
1.674 590 - 2.264
Penyertaan langsung luar negeri: Overseas Direct Placement in Share
- - - -
Penyertaan Langsung LJK Direct Placement in Share to Financial Service Institution
- - - -
Penyertaan Langsung pada LJK Direct Placement in Share to Non Financial Service Institution
- - - -
TanahLand
850 140 - 989
BangunanBuilding
1.104 568 - 1.672
Tanah dan BangunanLand and Building
2.186 32 - 2.218
Akumulasi Penyusutan Bangunan Accumulated Depreciation of Building
(871) (72) - (943)
Total InvestasiTotal Investments
112.416 24.278 78.218 214.912
Selisih Penilaian Investasi Investment Valuation Difference
9.547 1.473 143 11.162
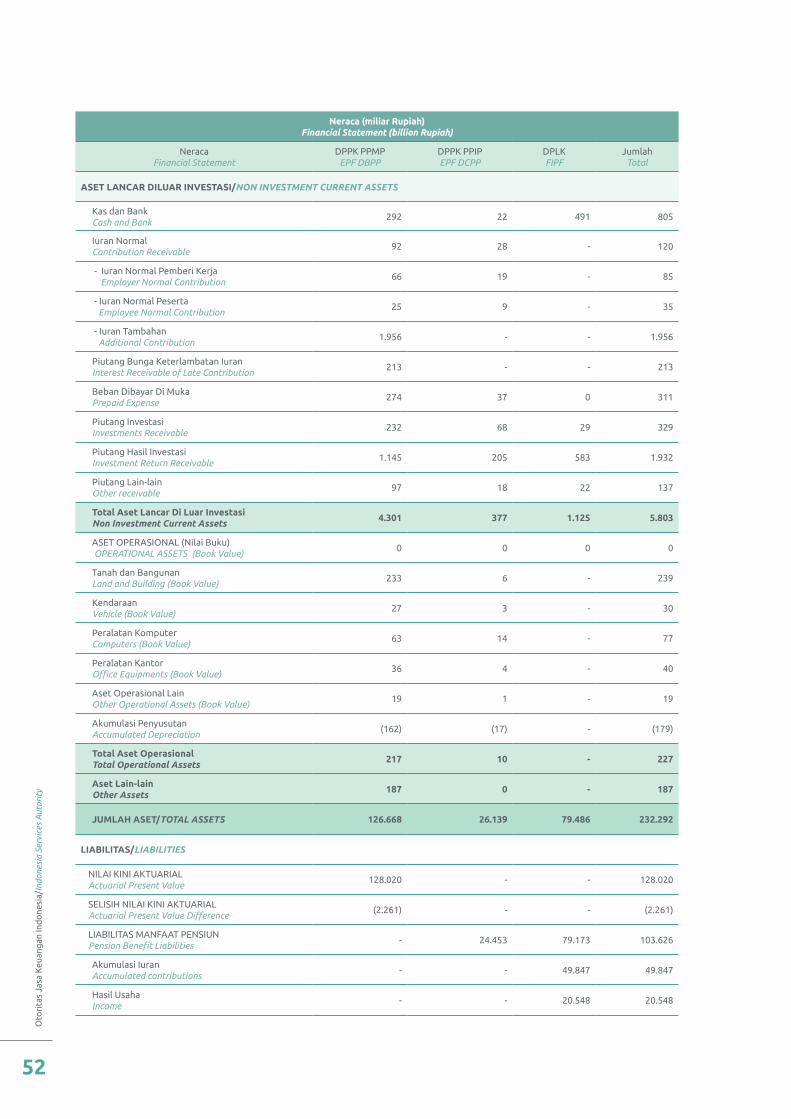
Oto
rita
s Ja
sa K
euan
gan
Ind
one
sia/
Indo
nesi
a Se
rvic
es A
utor
ity
52
Neraca (miliar Rupiah) Financial Statement (billion Rupiah)
NeracaFinancial Statement
DPPK PPMPEPF DBPP
DPPK PPIPEPF DCPP
DPLKFIPF
JumlahTotal
ASET LANCAR DILUAR INVESTASI/NON INVESTMENT CURRENT ASSETS
Kas dan BankCash and Bank
292 22 491 805
Iuran NormalContribution Receivable
92 28 - 120
- Iuran Normal Pemberi Kerja Employer Normal Contribution
66 19 - 85
- Iuran Normal Peserta Employee Normal Contribution
25 9 - 35
- Iuran Tambahan Additional Contribution
1.956 - - 1.956
Piutang Bunga Keterlambatan IuranInterest Receivable of Late Contribution
213 - - 213
Beban Dibayar Di MukaPrepaid Expense
274 37 0 311
Piutang Investasi Investments Receivable
232 68 29 329
Piutang Hasil Investasi Investment Return Receivable
1.145 205 583 1.932
Piutang Lain-lain Other receivable
97 18 22 137
Total Aset Lancar Di Luar Investasi Non Investment Current Assets
4.301 377 1.125 5.803
ASET OPERASIONAL (Nilai Buku) OPERATIONAL ASSETS (Book Value)
0 0 0 0
Tanah dan BangunanLand and Building (Book Value)
233 6 - 239
Kendaraan Vehicle (Book Value)
27 3 - 30
Peralatan Komputer Computers (Book Value)
63 14 - 77
Peralatan Kantor Office Equipments (Book Value)
36 4 - 40
Aset Operasional Lain Other Operational Assets (Book Value)
19 1 - 19
Akumulasi Penyusutan Accumulated Depreciation
(162) (17) - (179)
Total Aset OperasionalTotal Operational Assets
217 10 - 227
Aset Lain-lain Other Assets
187 0 - 187
JUMLAH ASET/TOTAL ASSETS 126.668 26.139 79.486 232.292
LIABILITAS/LIABILITIES
NILAI KINI AKTUARIAL Actuarial Present Value
128.020 - - 128.020
SELISIH NILAI KINI AKTUARIAL Actuarial Present Value Difference
(2.261) - - (2.261)
LIABILITAS MANFAAT PENSIUN Pension Benefit Liabilities
- 24.453 79.173 103.626
Akumulasi Iuran Accumulated contributions
- - 49.847 49.847
Hasil Usaha Income
- - 20.548 20.548
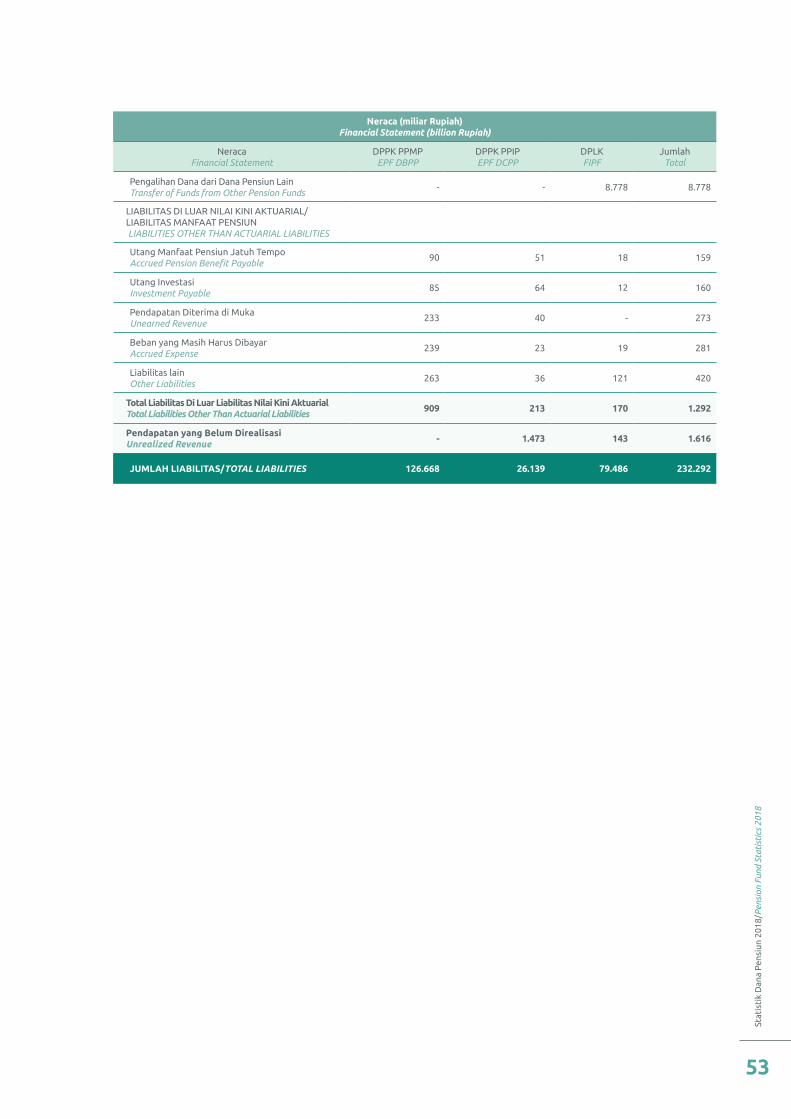
Stat
isti
k D
ana
Pen
siun
201
8/P
ensi
on F
und
Stat
isti
cs 2
018
53
Neraca (miliar Rupiah) Financial Statement (billion Rupiah)
NeracaFinancial Statement
DPPK PPMPEPF DBPP
DPPK PPIPEPF DCPP
DPLKFIPF
JumlahTotal
Pengalihan Dana dari Dana Pensiun Lain Transfer of Funds from Other Pension Funds
- - 8.778 8.778
LIABILITAS DI LUAR NILAI KINI AKTUARIAL/LIABILITAS MANFAAT PENSIUN LIABILITIES OTHER THAN ACTUARIAL LIABILITIES
Utang Manfaat Pensiun Jatuh TempoAccrued Pension Benefit Payable
90 51 18 159
Utang Investasi Investment Payable
85 64 12 160
Pendapatan Diterima di Muka Unearned Revenue
233 40 - 273
Beban yang Masih Harus Dibayar Accrued Expense
239 23 19 281
Liabilitas lain Other Liabilities
263 36 121 420
Total Liabilitas Di Luar Liabilitas Nilai Kini AktuarialTotal Liabilities Other Than Actuarial Liabilities
909 213 170 1.292
Pendapatan yang Belum Direalisasi Unrealized Revenue
- 1.473 143 1.616
JUMLAH LIABILITAS/TOTAL LIABILITIES 126.668 26.139 79.486 232.292
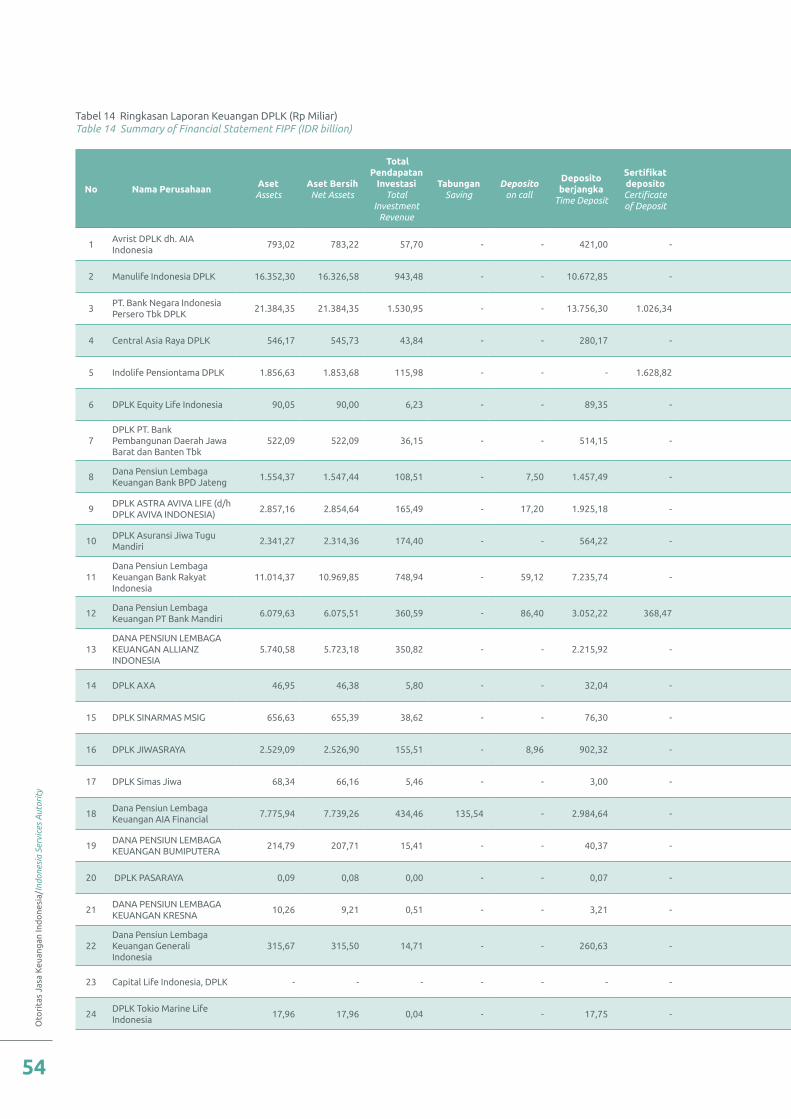
Oto
rita
s Ja
sa K
euan
gan
Ind
one
sia/
Indo
nesi
a Se
rvic
es A
utor
ity
54
No Nama PerusahaanAset
Assets Aset BersihNet Assets
Total Pendapatan
InvestasiTotal
Investment Revenue
TabunganSaving
Deposito on call
Deposito berjangka
Time Deposit
Sertifikat depositoCertificate of Deposit
Sertifikat Bank
IndonesiaCertificate of Central
Bank
Surat Berharga Negara
Government Bond
Saham Share
Obligasi korporasi
Bond
Sukuk Korporasi
Sukuk
Reksa Dana
Mutual Fund
MTNMedium
Term Note
Efek beragun
asetAssets backed Security
DIRE berbetuk
KIK
Kontrak opsi dan kontrak berjangka
efekStock Option
Contracts
1Avrist DPLK dh. AIA Indonesia
793,02 783,22 57,70 - - 421,00 - - 204,80 - 145,46 - - - - - -
2 Manulife Indonesia DPLK 16.352,30 16.326,58 943,48 - - 10.672,85 - - 2.828,04 2.075,52 471,63 18,30 - - - - -
3PT. Bank Negara Indonesia Persero Tbk DPLK
21.384,35 21.384,35 1.530,95 - - 13.756,30 1.026,34 - 2.471,14 - 3.511,94 269,72 162,46 - - - -
4 Central Asia Raya DPLK 546,17 545,73 43,84 - - 280,17 - - 18,84 - 243,60 - - - - - -
5 Indolife Pensiontama DPLK 1.856,63 1.853,68 115,98 - - - 1.628,82 - 14,22 - 202,11 - - - - - -
6 DPLK Equity Life Indonesia 90,05 90,00 6,23 - - 89,35 - - - - - - - - - - -
7DPLK PT. Bank Pembangunan Daerah Jawa Barat dan Banten Tbk
522,09 522,09 36,15 - - 514,15 - - - - - - 0,14 - - - -
8Dana Pensiun Lembaga Keuangan Bank BPD Jateng
1.554,37 1.547,44 108,51 - 7,50 1.457,49 - - - - 44,49 - - - - - -
9DPLK ASTRA AVIVA LIFE (d/h DPLK AVIVA INDONESIA)
2.857,16 2.854,64 165,49 - 17,20 1.925,18 - - 538,76 33,34 189,06 - 116,08 - - - -
10DPLK Asuransi Jiwa Tugu Mandiri
2.341,27 2.314,36 174,40 - - 564,22 - - 477,49 100,86 926,28 27,72 198,73 - - - -
11Dana Pensiun Lembaga Keuangan Bank Rakyat Indonesia
11.014,37 10.969,85 748,94 - 59,12 7.235,74 - - 149,34 462,93 2.681,94 117,61 82,02 - 63,25 - -
12Dana Pensiun Lembaga Keuangan PT Bank Mandiri
6.079,63 6.075,51 360,59 - 86,40 3.052,22 368,47 - 987,41 52,44 546,57 361,14 536,44 - - - -
13DANA PENSIUN LEMBAGA KEUANGAN ALLIANZ INDONESIA
5.740,58 5.723,18 350,82 - - 2.215,92 - - 2.132,38 463,70 60,80 190,85 541,73 - - - -
14 DPLK AXA 46,95 46,38 5,80 - - 32,04 - - - 12,54 - - - - - - -
15 DPLK SINARMAS MSIG 656,63 655,39 38,62 - - 76,30 - - 464,93 - 15,37 - 35,01 - - - -
16 DPLK JIWASRAYA 2.529,09 2.526,90 155,51 - 8,96 902,32 - - 100,62 79,95 547,45 19,58 853,58 - 6,21 - -
17 DPLK Simas Jiwa 68,34 66,16 5,46 - - 3,00 - - 19,59 10,17 21,70 6,55 - - - - -
18Dana Pensiun Lembaga Keuangan AIA Financial
7.775,94 7.739,26 434,46 135,54 - 2.984,64 - - 3.476,31 291,30 238,03 8,00 482,69 43,04 - - -
19DANA PENSIUN LEMBAGA KEUANGAN BUMIPUTERA
214,79 207,71 15,41 - - 40,37 - - - 14,92 90,60 1,88 26,16 10,00 - - -
20 DPLK PASARAYA 0,09 0,08 0,00 - - 0,07 - - - - - - - - - - -
21DANA PENSIUN LEMBAGA KEUANGAN KRESNA
10,26 9,21 0,51 - - 3,21 - - 1,48 - - - 3,17 - - - -
22Dana Pensiun Lembaga Keuangan Generali Indonesia
315,67 315,50 14,71 - - 260,63 - - - - - - 52,50 - - - -
23 Capital Life Indonesia, DPLK - - - - - - - - - - - - - - - - -
24DPLK Tokio Marine Life Indonesia
17,96 17,96 0,04 - - 17,75 - - - - - - - - - - -
Tabel 14 Ringkasan Laporan Keuangan DPLK (Rp Miliar)Table 14 Summary of Financial Statement FIPF (IDR billion)
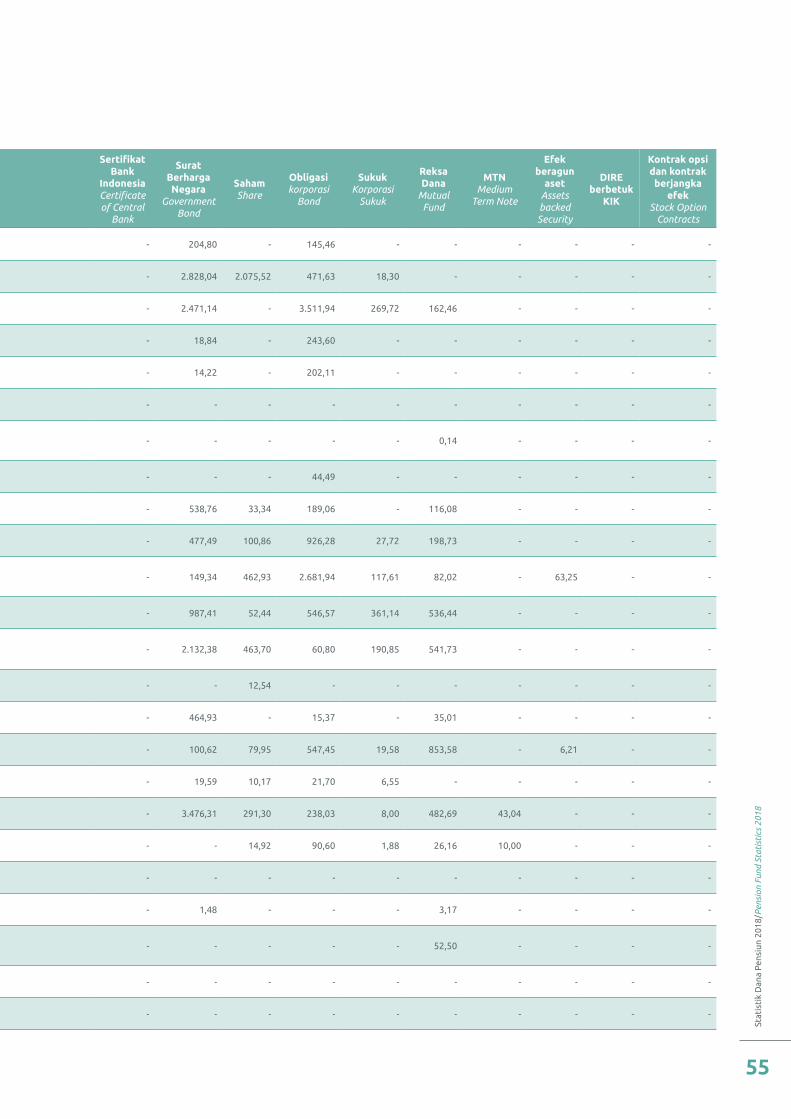
Stat
isti
k D
ana
Pen
siun
201
8/P
ensi
on F
und
Stat
isti
cs 2
018
55
No Nama PerusahaanAset
Assets Aset BersihNet Assets
Total Pendapatan
InvestasiTotal
Investment Revenue
TabunganSaving
Deposito on call
Deposito berjangka
Time Deposit
Sertifikat depositoCertificate of Deposit
Sertifikat Bank
IndonesiaCertificate of Central
Bank
Surat Berharga Negara
Government Bond
Saham Share
Obligasi korporasi
Bond
Sukuk Korporasi
Sukuk
Reksa Dana
Mutual Fund
MTNMedium
Term Note
Efek beragun
asetAssets backed Security
DIRE berbetuk
KIK
Kontrak opsi dan kontrak berjangka
efekStock Option
Contracts
1Avrist DPLK dh. AIA Indonesia
793,02 783,22 57,70 - - 421,00 - - 204,80 - 145,46 - - - - - -
2 Manulife Indonesia DPLK 16.352,30 16.326,58 943,48 - - 10.672,85 - - 2.828,04 2.075,52 471,63 18,30 - - - - -
3PT. Bank Negara Indonesia Persero Tbk DPLK
21.384,35 21.384,35 1.530,95 - - 13.756,30 1.026,34 - 2.471,14 - 3.511,94 269,72 162,46 - - - -
4 Central Asia Raya DPLK 546,17 545,73 43,84 - - 280,17 - - 18,84 - 243,60 - - - - - -
5 Indolife Pensiontama DPLK 1.856,63 1.853,68 115,98 - - - 1.628,82 - 14,22 - 202,11 - - - - - -
6 DPLK Equity Life Indonesia 90,05 90,00 6,23 - - 89,35 - - - - - - - - - - -
7DPLK PT. Bank Pembangunan Daerah Jawa Barat dan Banten Tbk
522,09 522,09 36,15 - - 514,15 - - - - - - 0,14 - - - -
8Dana Pensiun Lembaga Keuangan Bank BPD Jateng
1.554,37 1.547,44 108,51 - 7,50 1.457,49 - - - - 44,49 - - - - - -
9DPLK ASTRA AVIVA LIFE (d/h DPLK AVIVA INDONESIA)
2.857,16 2.854,64 165,49 - 17,20 1.925,18 - - 538,76 33,34 189,06 - 116,08 - - - -
10DPLK Asuransi Jiwa Tugu Mandiri
2.341,27 2.314,36 174,40 - - 564,22 - - 477,49 100,86 926,28 27,72 198,73 - - - -
11Dana Pensiun Lembaga Keuangan Bank Rakyat Indonesia
11.014,37 10.969,85 748,94 - 59,12 7.235,74 - - 149,34 462,93 2.681,94 117,61 82,02 - 63,25 - -
12Dana Pensiun Lembaga Keuangan PT Bank Mandiri
6.079,63 6.075,51 360,59 - 86,40 3.052,22 368,47 - 987,41 52,44 546,57 361,14 536,44 - - - -
13DANA PENSIUN LEMBAGA KEUANGAN ALLIANZ INDONESIA
5.740,58 5.723,18 350,82 - - 2.215,92 - - 2.132,38 463,70 60,80 190,85 541,73 - - - -
14 DPLK AXA 46,95 46,38 5,80 - - 32,04 - - - 12,54 - - - - - - -
15 DPLK SINARMAS MSIG 656,63 655,39 38,62 - - 76,30 - - 464,93 - 15,37 - 35,01 - - - -
16 DPLK JIWASRAYA 2.529,09 2.526,90 155,51 - 8,96 902,32 - - 100,62 79,95 547,45 19,58 853,58 - 6,21 - -
17 DPLK Simas Jiwa 68,34 66,16 5,46 - - 3,00 - - 19,59 10,17 21,70 6,55 - - - - -
18Dana Pensiun Lembaga Keuangan AIA Financial
7.775,94 7.739,26 434,46 135,54 - 2.984,64 - - 3.476,31 291,30 238,03 8,00 482,69 43,04 - - -
19DANA PENSIUN LEMBAGA KEUANGAN BUMIPUTERA
214,79 207,71 15,41 - - 40,37 - - - 14,92 90,60 1,88 26,16 10,00 - - -
20 DPLK PASARAYA 0,09 0,08 0,00 - - 0,07 - - - - - - - - - - -
21DANA PENSIUN LEMBAGA KEUANGAN KRESNA
10,26 9,21 0,51 - - 3,21 - - 1,48 - - - 3,17 - - - -
22Dana Pensiun Lembaga Keuangan Generali Indonesia
315,67 315,50 14,71 - - 260,63 - - - - - - 52,50 - - - -
23 Capital Life Indonesia, DPLK - - - - - - - - - - - - - - - - -
24DPLK Tokio Marine Life Indonesia
17,96 17,96 0,04 - - 17,75 - - - - - - - - - - -
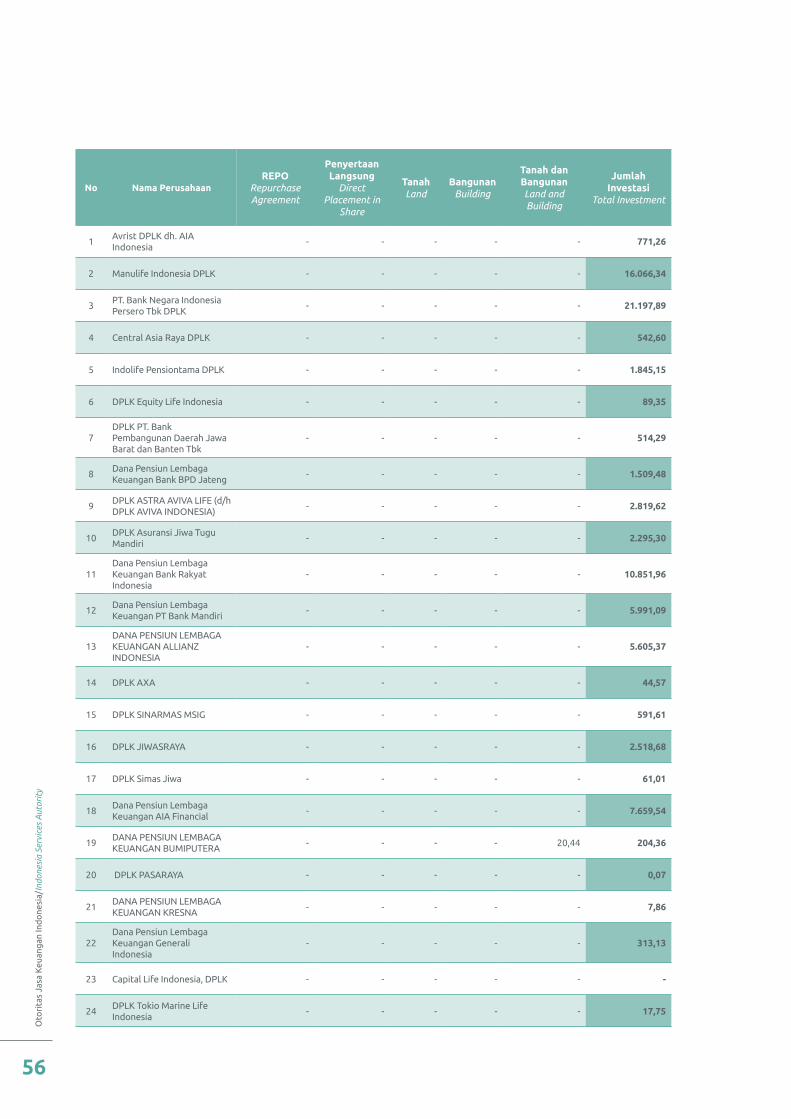
Oto
rita
s Ja
sa K
euan
gan
Ind
one
sia/
Indo
nesi
a Se
rvic
es A
utor
ity
56
No Nama PerusahaanREPO
Repurchase Agreement
Penyertaan Langsung
Direct Placement in
Share
TanahLand
BangunanBuilding
Tanah dan BangunanLand and Building
Jumlah Investasi
Total Investment
1Avrist DPLK dh. AIA Indonesia
- - - - - 771,26
2 Manulife Indonesia DPLK - - - - - 16.066,34
3PT. Bank Negara Indonesia Persero Tbk DPLK
- - - - - 21.197,89
4 Central Asia Raya DPLK - - - - - 542,60
5 Indolife Pensiontama DPLK - - - - - 1.845,15
6 DPLK Equity Life Indonesia - - - - - 89,35
7DPLK PT. Bank Pembangunan Daerah Jawa Barat dan Banten Tbk
- - - - - 514,29
8Dana Pensiun Lembaga Keuangan Bank BPD Jateng
- - - - - 1.509,48
9DPLK ASTRA AVIVA LIFE (d/h DPLK AVIVA INDONESIA)
- - - - - 2.819,62
10DPLK Asuransi Jiwa Tugu Mandiri
- - - - - 2.295,30
11Dana Pensiun Lembaga Keuangan Bank Rakyat Indonesia
- - - - - 10.851,96
12Dana Pensiun Lembaga Keuangan PT Bank Mandiri
- - - - - 5.991,09
13DANA PENSIUN LEMBAGA KEUANGAN ALLIANZ INDONESIA
- - - - - 5.605,37
14 DPLK AXA - - - - - 44,57
15 DPLK SINARMAS MSIG - - - - - 591,61
16 DPLK JIWASRAYA - - - - - 2.518,68
17 DPLK Simas Jiwa - - - - - 61,01
18Dana Pensiun Lembaga Keuangan AIA Financial
- - - - - 7.659,54
19DANA PENSIUN LEMBAGA KEUANGAN BUMIPUTERA
- - - - 20,44 204,36
20 DPLK PASARAYA - - - - - 0,07
21DANA PENSIUN LEMBAGA KEUANGAN KRESNA
- - - - - 7,86
22Dana Pensiun Lembaga Keuangan Generali Indonesia
- - - - - 313,13
23 Capital Life Indonesia, DPLK - - - - - -
24DPLK Tokio Marine Life Indonesia
- - - - - 17,75
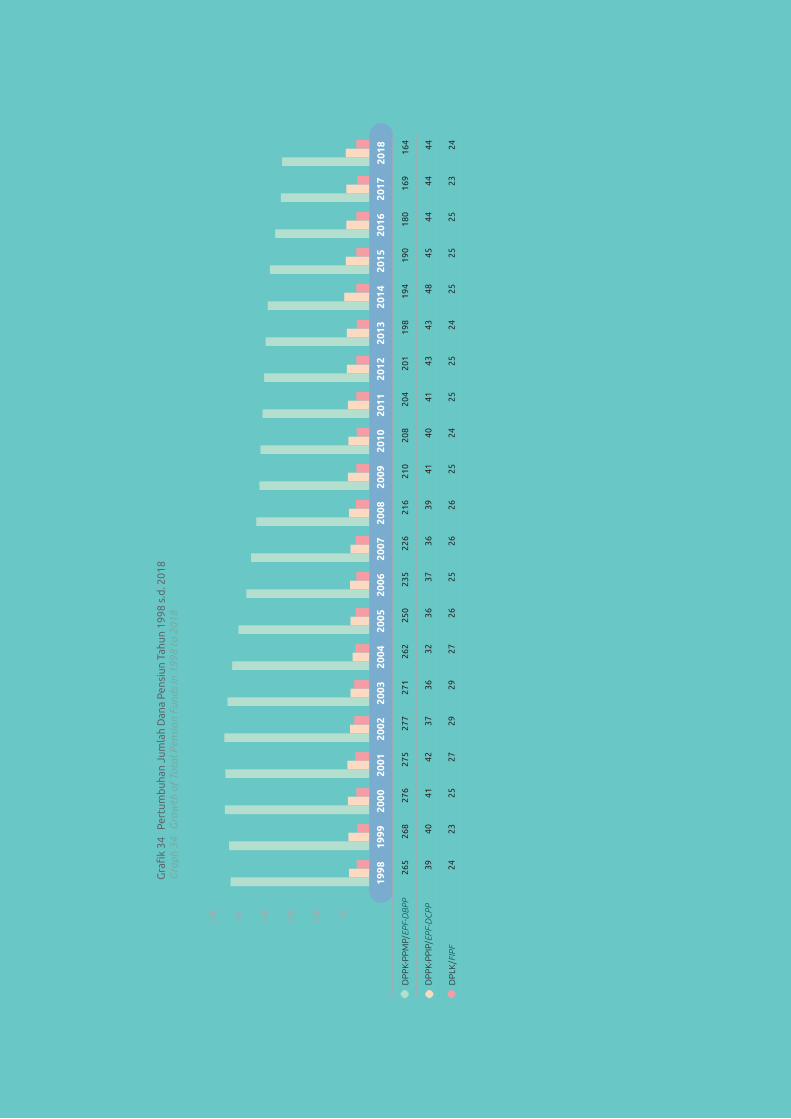
Stat
isti
k D
ana
Pen
siun
201
8/P
ensi
on F
und
Stat
isti
cs 2
018
57
Gra
fik
34
Pert
umb
uhan
Jum
lah
Dan
a Pe
nsiu
n Ta
hun
1998
s.d
. 201
8G
raph
34
Gro
wth
of
Tota
l Pen
sion
Fun
ds In
199
8 to
201
8
1998
1999
2000
2001
2002
2003
2004
2005
2006
2007
2008
2009
2010
2011
2012
2013
2014
2015
2016
2017
265 39 24
268 40 23
276 41 25
275 42 27
277 37 29
271 36 29
262 32 27
250 36 26
235 37 25
226 36 26
216 39 26
210 41 25
208 40 24
204 41 25
201 43 25
198 43 24
194 48 25
190 45 25
180 44 25
169 44 23
DP
PK-
PP
MP/
EPF-
DB
PP
DP
PK-
PP
IP/E
PF-D
CPP
DP
LK/F
IPF
300
250
200
150
100 50
2018 16
4 44 24

Otoritas Jasa Keuangan Indonesia/Indonesia Services Autority
58
Grafik 35 Komposisi Dana Pensiun Berdasarkan Grup Tahun 2018 Graph 35 Composition of Pension Funds Based on Group In 2018
Grafik 36 Kepesertaan Dana Pensiun Berdasarkan Grup Tahun 2018 Graph 36 Membership of Pension Funds Based on Group In 2018
Grafik 37 Peserta DPPK dan DPLK Berdasarkan Grup Tahun 2018 Graph 37 Participant EPF and FIPF Based on Group In 2018
Grup I/Group I Grup II/Group II Grup III/Group III Grup IV/Group IV
DPPK PPMP/EPF-DBPP 35
7
11
17
3
4
50
16
2
62
18
7
DPPK PPIP/EPF-DCPP
DPLK/FIPF
01020304050607080
Grup I/Group I Grup II/Group II Grup III/Group III Grup IV/Group IV
DPPK PPMP/EPF-DBPP 791.094
289.424
3.090.422
75.975
32.375
109.956
97.136
57.245
19.527
38.802
13.256
19.862
DPPK PPIP/EPF-DCPP
DPLK/FIPF
0
500.000
1.000.000
1.500.000
2.000.000
2.500.000
3.000.000
3.500.000
0
500.000
1.000.000
1.500.000
2.000.000
2.500.000
3.000.000
3.500.000
Grup I/Group I Grup II/Group II Grup III/Group III Grup IV/Group IV
DPPK/EPF 1.080.518
3.090.422
108.350
109.956
154.381
19.527
52.058
19.862 DPLK/FIPF
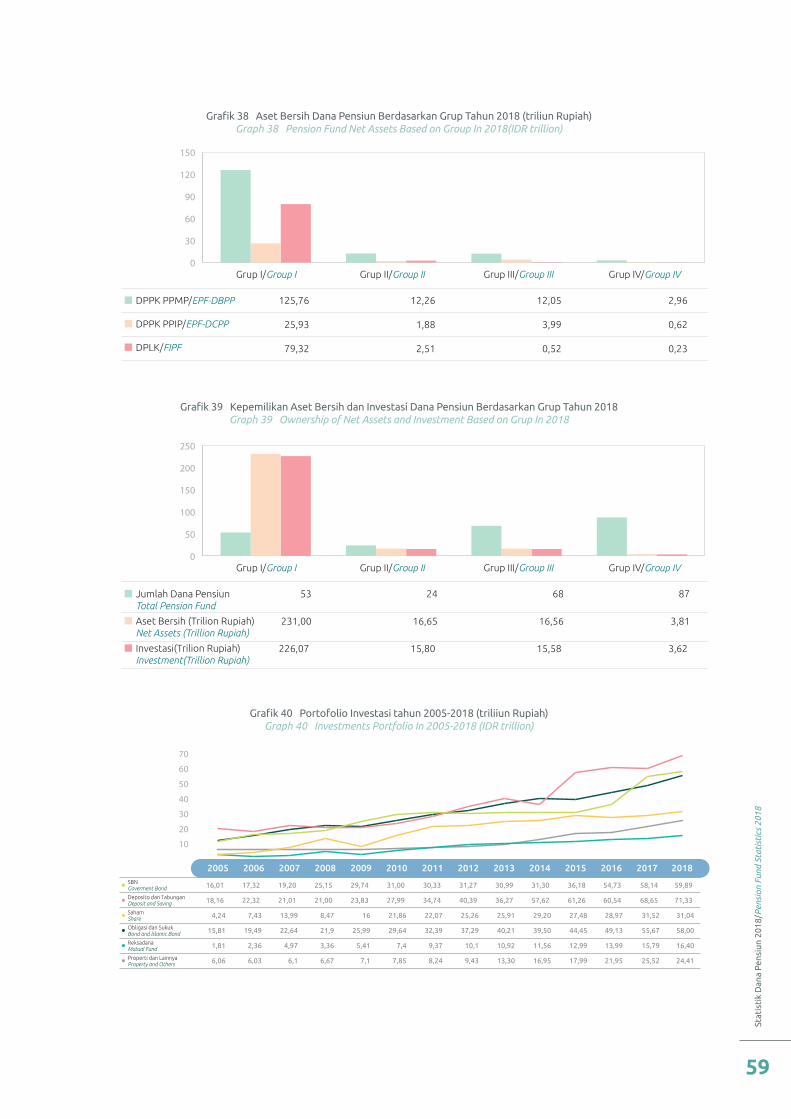
Stat
isti
k D
ana
Pen
siun
201
8/P
ensi
on F
und
Stat
isti
cs 2
018
59
Grafik 38 Aset Bersih Dana Pensiun Berdasarkan Grup Tahun 2018 (triliun Rupiah) Graph 38 Pension Fund Net Assets Based on Group In 2018(IDR trillion)
Grafik 39 Kepemilikan Aset Bersih dan Investasi Dana Pensiun Berdasarkan Grup Tahun 2018 Graph 39 Ownership of Net Assets and Investment Based on Grup In 2018
Grafik 40 Portofolio Investasi tahun 2005-2018 (triliiun Rupiah) Graph 40 Investments Portfolio In 2005-2018 (IDR trillion)
Grup I/Group I Grup II/Group II Grup III/Group III Grup IV/Group IV
DPPK PPMP/EPF-DBPP 125,76
25,93
79,32
12,26
1,88
2,51
12,05
3,99
0,52
2,96
0,62
0,23
DPPK PPIP/EPF-DCPP
DPLK/FIPF
0
30
60
90
120
150
Grup I/Group I Grup II/Group II Grup III/Group III Grup IV/Group IV
Jumlah Dana PensiunTotal Pension Fund
53
231,00
226,07
24
16,65
15,80
68
16,56
15,58
87
3,81
3,62
Aset Bersih (Trilion Rupiah)Net Assets (Trillion Rupiah)
Investasi(Trilion Rupiah)Investment(Trillion Rupiah)
0
50
100
150
200
250
70
60
50
40
30
20
10
2005 2006 2007 2008 2009 2010 2011 2012 2013 2014 2015 2016 2017SBNGoverment Bond
Deposito dan TabunganDeposit and Saving
SahamShare
Obligasi dan SukukBond and Islamic Bond
ReksadanaMutual Fund
Properti dan LainnyaProperty and Others
2018
54,73
60,54
28,97
49,13
13,99
21,95
16,01
18,16
4,24
15,81
1,81
6,06
17,32
22,32
7,43
19,49
2,36
6,03
19,20
21,01
13,99
22,64
4,97
6,1
25,15
21,00
8,47
21,9
3,36
6,67
29,74
23,83
16
25,99
5,41
7,1
31,00
27,99
21,86
29,64
7,4
7,85
30,33
34,74
22,07
32,39
9,37
8,24
31,27
40,39
25,26
37,29
10,1
9,43
30,99
36,27
25,91
40,21
10,92
13,30
31,30
57,62
29,20
39,50
11,56
16,95
36,18
61,26
27,48
44,45
12,99
17,99
59,89
71,33
31,04
58,00
16,40
24,41
58,14
68,65
31,52
55,67
15,79
25,52
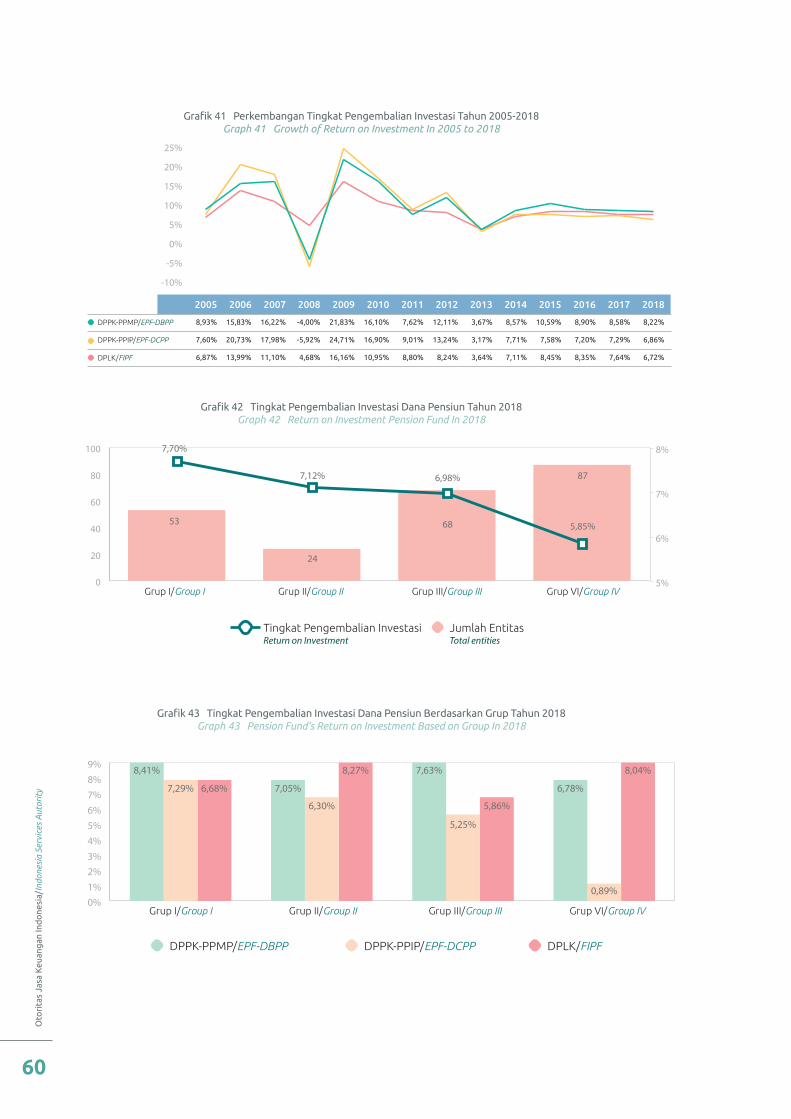
Oto
rita
s Ja
sa K
euan
gan
Ind
one
sia/
Indo
nesi
a Se
rvic
es A
utor
ity
60
Grafik 41 Perkembangan Tingkat Pengembalian Investasi Tahun 2005-2018Graph 41 Growth of Return on Investment In 2005 to 2018
Grafik 42 Tingkat Pengembalian Investasi Dana Pensiun Tahun 2018 Graph 42 Return on Investment Pension Fund In 2018
Grafik 43 Tingkat Pengembalian Investasi Dana Pensiun Berdasarkan Grup Tahun 2018 Graph 43 Pension Fund’s Return on Investment Based on Group In 2018
20182005 2006 2007 2008 2009 2010 2011 2012 2013 2014 2015 2016 2017
25%
20%
15%
10%
5%
0%
-5%
-10%
8,22%
6,86%
6,72%
8,93%
7,60%
6,87%
15,83%
20,73%
13,99%
16,22%
17,98%
11,10%
-4,00%
-5,92%
4,68%
21,83%
24,71%
16,16%
16,10%
16,90%
10,95%
7,62%
9,01%
8,80%
12,11%
13,24%
8,24%
3,67%
3,17%
3,64%
8,57%
7,71%
7,11%
10,59%
7,58%
8,45%
8,90%
7,20%
8,35%
8,58%
7,29%
7,64%
DPPK-PPMP/EPF-DBPP
DPPK-PPIP/EPF-DCPP
DPLK/FIPF
Grup I/Group I Grup II/Group II Grup III/Group III Grup VI/Group IV0
20
40
60
80
100
5%
6%
7%
8%
53
7,70%
24
7,12% 6,98%
68
87
5,85%
Tingkat Pengembalian InvestasiReturn on Investment
Jumlah EntitasTotal entities
Grup I/Group I Grup II/Group II Grup III/Group III Grup VI/Group IV0%
2%1%
3%4%5%6%7%8%9% 8,41%
7,29% 6,68% 7,05%
6,30%
8,27% 7,63%
5,25%
5,86%
6,78%
0,89%
8,04%
DPPK-PPMP/EPF-DBPP DPPK-PPIP/EPF-DCPP DPLK/FIPF
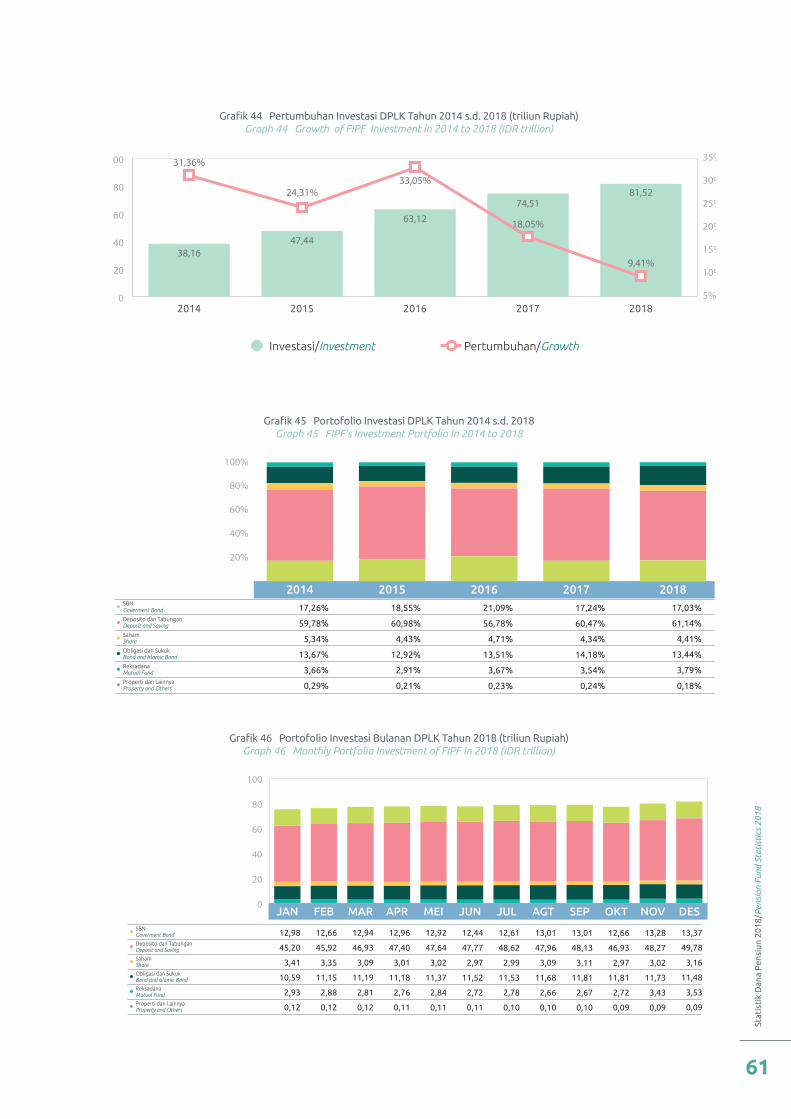
Stat
isti
k D
ana
Pen
siun
201
8/P
ensi
on F
und
Stat
isti
cs 2
018
61
Grafik 44 Pertumbuhan Investasi DPLK Tahun 2014 s.d. 2018 (triliun Rupiah) Graph 44 Growth of FIPF Investment in 2014 to 2018 (IDR trillion)
Grafik 45 Portofolio Investasi DPLK Tahun 2014 s.d. 2018 Graph 45 FIPF’s Investment Portfolio In 2014 to 2018
Grafik 46 Portofolio Investasi Bulanan DPLK Tahun 2018 (triliun Rupiah) Graph 46 Monthly Portfolio Investment of FIPF In 2018 (IDR trillion)
Investasi/Investment Pertumbuhan/Growth
0
20
40
60
80
100
5%
10%
15%
20%
25%
30%
35%
2014 2015 2016 2017 2018
38,16
31,36%
47,44
24,31%
63,12
33,05%
74,51
18,05%
81,52
9,41%
SBNGoverment Bond
Deposito dan TabunganDeposit and Saving
SahamShare
Obligasi dan SukukBond and Islamic Bond
ReksadanaMutual Fund
Properti dan LainnyaProperty and Others
20182014 2015 2016 2017
100%
80%
60%
40%
20%
17,03%
61,14%
4,41%
13,44%
3,79%
0,18%
17,26%
59,78%
5,34%
13,67%
3,66%
0,29%
18,55%
60,98%
4,43%
12,92%
2,91%
0,21%
21,09%
56,78%
4,71%
13,51%
3,67%
0,23%
17,24%
60,47%
4,34%
14,18%
3,54%
0,24%
0
20
40
60
80
100
SBNGoverment Bond
Deposito dan TabunganDeposit and Saving
SahamShare
Obligasi dan SukukBond and Islamic Bond
ReksadanaMutual Fund
Properti dan LainnyaProperty and Others
13,37
49,78
3,16
11,48
3,53
0,09
12,98
45,20
3,41
10,59
2,93
0,12
12,66
45,92
3,35
11,15
2,88
0,12
12,94
46,93
3,09
11,19
2,81
0,12
12,96
47,40
3,01
11,18
2,76
0,11
12,92
47,64
3,02
11,37
2,84
0,11
12,44
47,77
2,97
11,52
2,72
0,11
12,61
48,62
2,99
11,53
2,78
0,10
13,01
47,96
3,09
11,68
2,66
0,10
13,01
48,13
3,11
11,81
2,67
0,10
12,66
46,93
2,97
11,81
2,72
0,09
13,28
48,27
3,02
11,73
3,43
0,09
JAN FEB MAR APR MEI JUN JUL AGT SEP OKT NOV DES
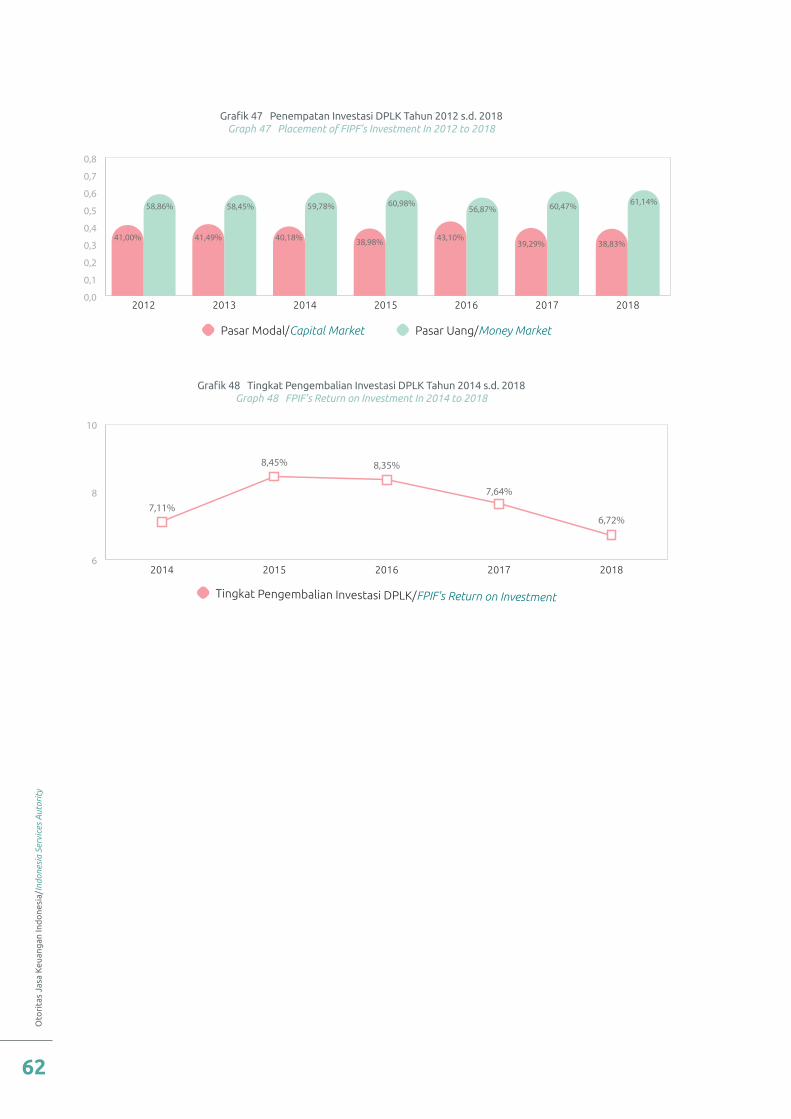
Oto
rita
s Ja
sa K
euan
gan
Ind
one
sia/
Indo
nesi
a Se
rvic
es A
utor
ity
62
Grafik 47 Penempatan Investasi DPLK Tahun 2012 s.d. 2018 Graph 47 Placement of FIPF’s Investment In 2012 to 2018
Grafik 48 Tingkat Pengembalian Investasi DPLK Tahun 2014 s.d. 2018 Graph 48 FPIF’s Return on Investment In 2014 to 2018
0,0
0,1
0,2
0,3
0,4
0,5
0,6
0,7
0,8
2012 2013 2014 2015 2016 2017 2018
Pasar Modal/Capital Market Pasar Uang/Money Market
41,00%
58,86%
41,49%
58,45%
40,18%
59,78%
38,98%
60,98%
43,10%
56,87%
39,29%
60,47%
38,83%
61,14%
6
8
10
7,11%
8,45% 8,35%
7,64%
6,72%
2014 2015 2016 2017 2018
Tingkat Pengembalian Investasi DPLK/FPIF's Return on Investment
Stat
isti
k D
ana
Pen
siun
201
8/P
ensi
on F
und
Stat
isti
cs 2
018
63
Daftar NamaDana Pensiun 2018Pension Fund List Name 2018

Oto
rita
s Ja
sa K
euan
gan
Ind
one
sia/
Indo
nesi
a Se
rvic
es A
utor
ity
64
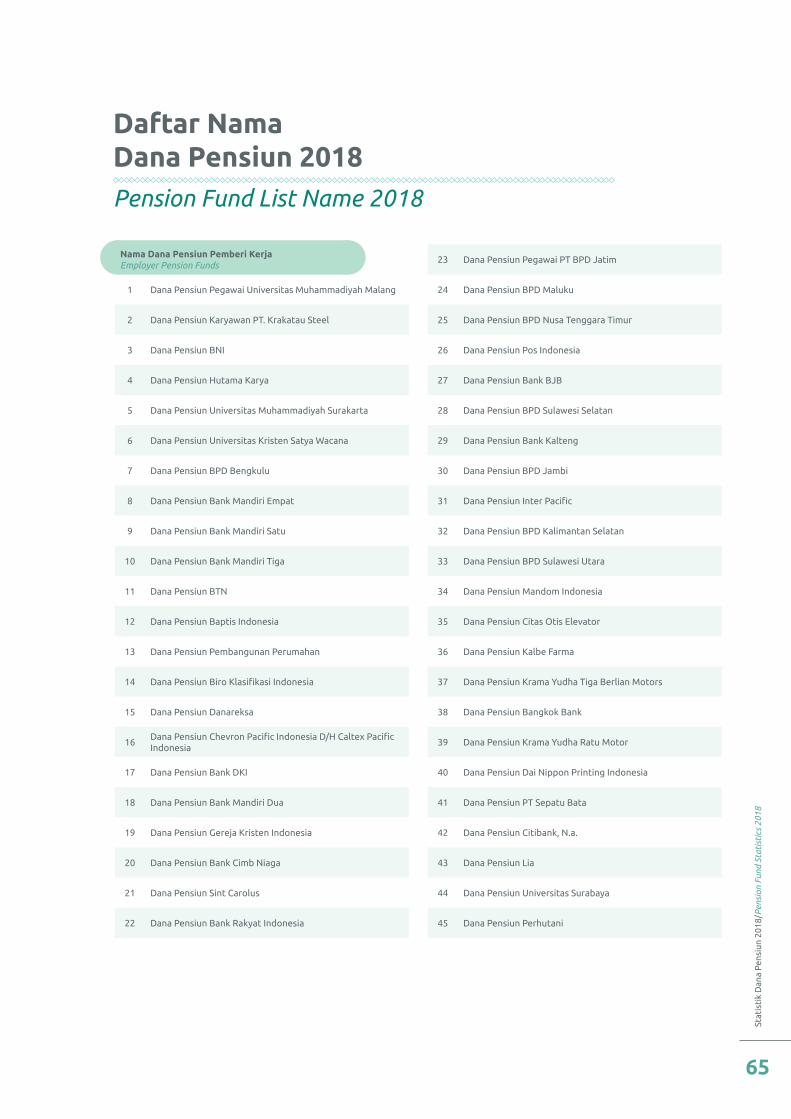
Stat
isti
k D
ana
Pen
siun
201
8/P
ensi
on F
und
Stat
isti
cs 2
018
65
Daftar NamaDana Pensiun 2018Pension Fund List Name 2018
Nama Dana Pensiun Pemberi KerjaEmployer Pension Funds
23 Dana Pensiun Pegawai PT BPD Jatim
1 Dana Pensiun Pegawai Universitas Muhammadiyah Malang 24 Dana Pensiun BPD Maluku
2 Dana Pensiun Karyawan PT. Krakatau Steel 25 Dana Pensiun BPD Nusa Tenggara Timur
3 Dana Pensiun BNI 26 Dana Pensiun Pos Indonesia
4 Dana Pensiun Hutama Karya 27 Dana Pensiun Bank BJB
5 Dana Pensiun Universitas Muhammadiyah Surakarta 28 Dana Pensiun BPD Sulawesi Selatan
6 Dana Pensiun Universitas Kristen Satya Wacana 29 Dana Pensiun Bank Kalteng
7 Dana Pensiun BPD Bengkulu 30 Dana Pensiun BPD Jambi
8 Dana Pensiun Bank Mandiri Empat 31 Dana Pensiun Inter Pacific
9 Dana Pensiun Bank Mandiri Satu 32 Dana Pensiun BPD Kalimantan Selatan
10 Dana Pensiun Bank Mandiri Tiga 33 Dana Pensiun BPD Sulawesi Utara
11 Dana Pensiun BTN 34 Dana Pensiun Mandom Indonesia
12 Dana Pensiun Baptis Indonesia 35 Dana Pensiun Citas Otis Elevator
13 Dana Pensiun Pembangunan Perumahan 36 Dana Pensiun Kalbe Farma
14 Dana Pensiun Biro Klasifikasi Indonesia 37 Dana Pensiun Krama Yudha Tiga Berlian Motors
15 Dana Pensiun Danareksa 38 Dana Pensiun Bangkok Bank
16Dana Pensiun Chevron Pacific Indonesia D/H Caltex Pacific Indonesia
39 Dana Pensiun Krama Yudha Ratu Motor
17 Dana Pensiun Bank DKI 40 Dana Pensiun Dai Nippon Printing Indonesia
18 Dana Pensiun Bank Mandiri Dua 41 Dana Pensiun PT Sepatu Bata
19 Dana Pensiun Gereja Kristen Indonesia 42 Dana Pensiun Citibank, N.a.
20 Dana Pensiun Bank Cimb Niaga 43 Dana Pensiun Lia
21 Dana Pensiun Sint Carolus 44 Dana Pensiun Universitas Surabaya
22 Dana Pensiun Bank Rakyat Indonesia 45 Dana Pensiun Perhutani
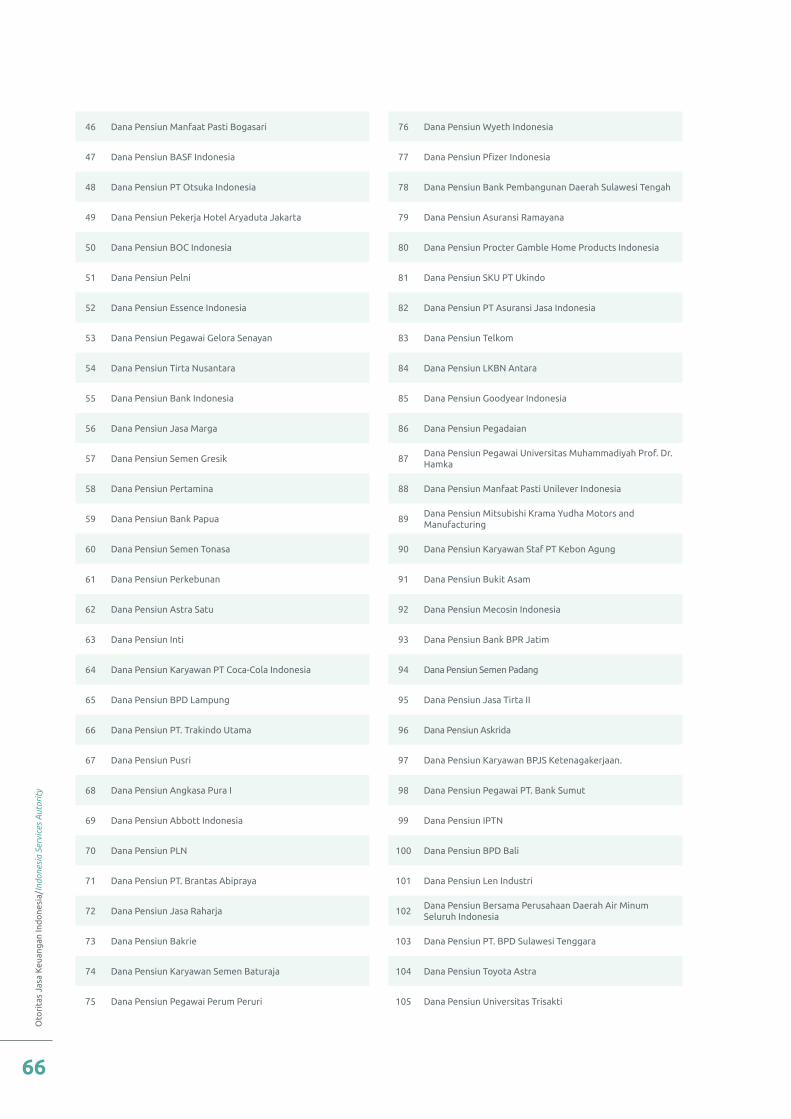
Oto
rita
s Ja
sa K
euan
gan
Ind
one
sia/
Indo
nesi
a Se
rvic
es A
utor
ity
66
46 Dana Pensiun Manfaat Pasti Bogasari 76 Dana Pensiun Wyeth Indonesia
47 Dana Pensiun BASF Indonesia 77 Dana Pensiun Pfizer Indonesia
48 Dana Pensiun PT Otsuka Indonesia 78 Dana Pensiun Bank Pembangunan Daerah Sulawesi Tengah
49 Dana Pensiun Pekerja Hotel Aryaduta Jakarta 79 Dana Pensiun Asuransi Ramayana
50 Dana Pensiun BOC Indonesia 80 Dana Pensiun Procter Gamble Home Products Indonesia
51 Dana Pensiun Pelni 81 Dana Pensiun SKU PT Ukindo
52 Dana Pensiun Essence Indonesia 82 Dana Pensiun PT Asuransi Jasa Indonesia
53 Dana Pensiun Pegawai Gelora Senayan 83 Dana Pensiun Telkom
54 Dana Pensiun Tirta Nusantara 84 Dana Pensiun LKBN Antara
55 Dana Pensiun Bank Indonesia 85 Dana Pensiun Goodyear Indonesia
56 Dana Pensiun Jasa Marga 86 Dana Pensiun Pegadaian
57 Dana Pensiun Semen Gresik 87Dana Pensiun Pegawai Universitas Muhammadiyah Prof. Dr. Hamka
58 Dana Pensiun Pertamina 88 Dana Pensiun Manfaat Pasti Unilever Indonesia
59 Dana Pensiun Bank Papua 89Dana Pensiun Mitsubishi Krama Yudha Motors and Manufacturing
60 Dana Pensiun Semen Tonasa 90 Dana Pensiun Karyawan Staf PT Kebon Agung
61 Dana Pensiun Perkebunan 91 Dana Pensiun Bukit Asam
62 Dana Pensiun Astra Satu 92 Dana Pensiun Mecosin Indonesia
63 Dana Pensiun Inti 93 Dana Pensiun Bank BPR Jatim
64 Dana Pensiun Karyawan PT Coca-Cola Indonesia 94 Dana Pensiun Semen Padang
65 Dana Pensiun BPD Lampung 95 Dana Pensiun Jasa Tirta II
66 Dana Pensiun PT. Trakindo Utama 96 Dana Pensiun Askrida
67 Dana Pensiun Pusri 97 Dana Pensiun Karyawan BPJS Ketenagakerjaan.
68 Dana Pensiun Angkasa Pura I 98 Dana Pensiun Pegawai PT. Bank Sumut
69 Dana Pensiun Abbott Indonesia 99 Dana Pensiun IPTN
70 Dana Pensiun PLN 100 Dana Pensiun BPD Bali
71 Dana Pensiun PT. Brantas Abipraya 101 Dana Pensiun Len Industri
72 Dana Pensiun Jasa Raharja 102Dana Pensiun Bersama Perusahaan Daerah Air Minum Seluruh Indonesia
73 Dana Pensiun Bakrie 103 Dana Pensiun PT. BPD Sulawesi Tenggara
74 Dana Pensiun Karyawan Semen Baturaja 104 Dana Pensiun Toyota Astra
75 Dana Pensiun Pegawai Perum Peruri 105 Dana Pensiun Universitas Trisakti
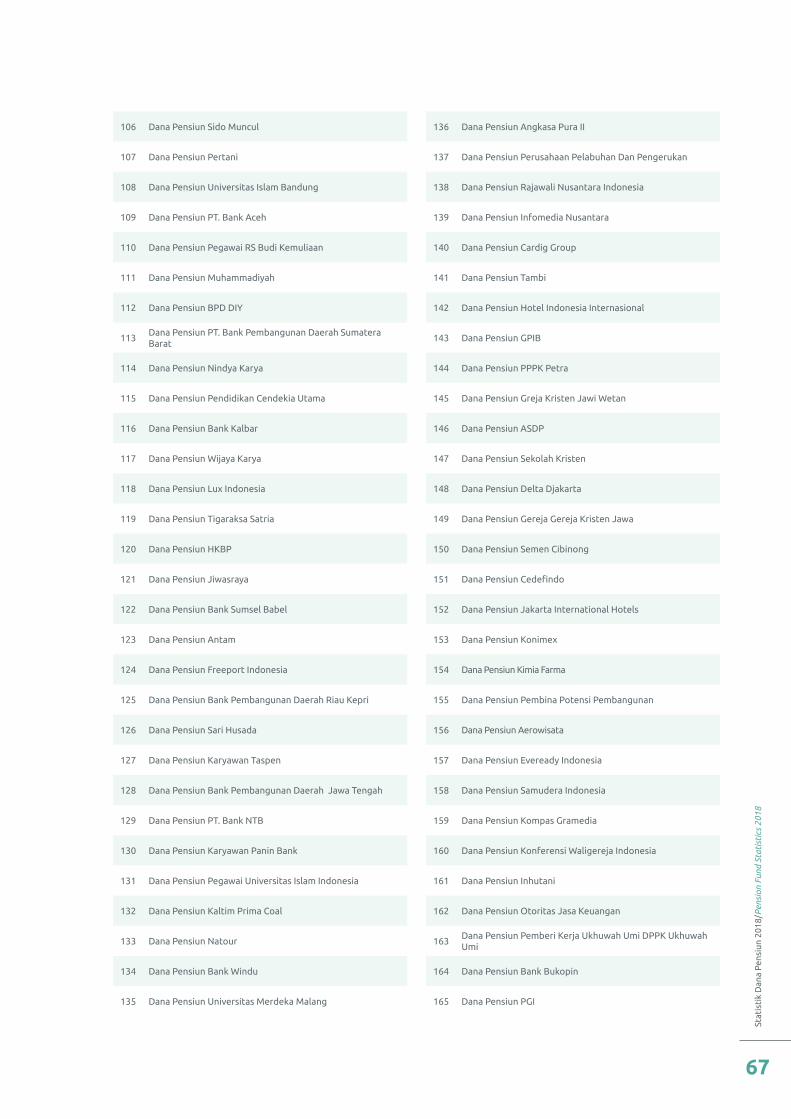
Stat
isti
k D
ana
Pen
siun
201
8/P
ensi
on F
und
Stat
isti
cs 2
018
67
106 Dana Pensiun Sido Muncul 136 Dana Pensiun Angkasa Pura II
107 Dana Pensiun Pertani 137 Dana Pensiun Perusahaan Pelabuhan Dan Pengerukan
108 Dana Pensiun Universitas Islam Bandung 138 Dana Pensiun Rajawali Nusantara Indonesia
109 Dana Pensiun PT. Bank Aceh 139 Dana Pensiun Infomedia Nusantara
110 Dana Pensiun Pegawai RS Budi Kemuliaan 140 Dana Pensiun Cardig Group
111 Dana Pensiun Muhammadiyah 141 Dana Pensiun Tambi
112 Dana Pensiun BPD DIY 142 Dana Pensiun Hotel Indonesia Internasional
113Dana Pensiun PT. Bank Pembangunan Daerah Sumatera Barat
143 Dana Pensiun GPIB
114 Dana Pensiun Nindya Karya 144 Dana Pensiun PPPK Petra
115 Dana Pensiun Pendidikan Cendekia Utama 145 Dana Pensiun Greja Kristen Jawi Wetan
116 Dana Pensiun Bank Kalbar 146 Dana Pensiun ASDP
117 Dana Pensiun Wijaya Karya 147 Dana Pensiun Sekolah Kristen
118 Dana Pensiun Lux Indonesia 148 Dana Pensiun Delta Djakarta
119 Dana Pensiun Tigaraksa Satria 149 Dana Pensiun Gereja Gereja Kristen Jawa
120 Dana Pensiun HKBP 150 Dana Pensiun Semen Cibinong
121 Dana Pensiun Jiwasraya 151 Dana Pensiun Cedefindo
122 Dana Pensiun Bank Sumsel Babel 152 Dana Pensiun Jakarta International Hotels
123 Dana Pensiun Antam 153 Dana Pensiun Konimex
124 Dana Pensiun Freeport Indonesia 154 Dana Pensiun Kimia Farma
125 Dana Pensiun Bank Pembangunan Daerah Riau Kepri 155 Dana Pensiun Pembina Potensi Pembangunan
126 Dana Pensiun Sari Husada 156 Dana Pensiun Aerowisata
127 Dana Pensiun Karyawan Taspen 157 Dana Pensiun Eveready Indonesia
128 Dana Pensiun Bank Pembangunan Daerah Jawa Tengah 158 Dana Pensiun Samudera Indonesia
129 Dana Pensiun PT. Bank NTB 159 Dana Pensiun Kompas Gramedia
130 Dana Pensiun Karyawan Panin Bank 160 Dana Pensiun Konferensi Waligereja Indonesia
131 Dana Pensiun Pegawai Universitas Islam Indonesia 161 Dana Pensiun Inhutani
132 Dana Pensiun Kaltim Prima Coal 162 Dana Pensiun Otoritas Jasa Keuangan
133 Dana Pensiun Natour 163Dana Pensiun Pemberi Kerja Ukhuwah Umi DPPK Ukhuwah Umi
134 Dana Pensiun Bank Windu 164 Dana Pensiun Bank Bukopin
135 Dana Pensiun Universitas Merdeka Malang 165 Dana Pensiun PGI
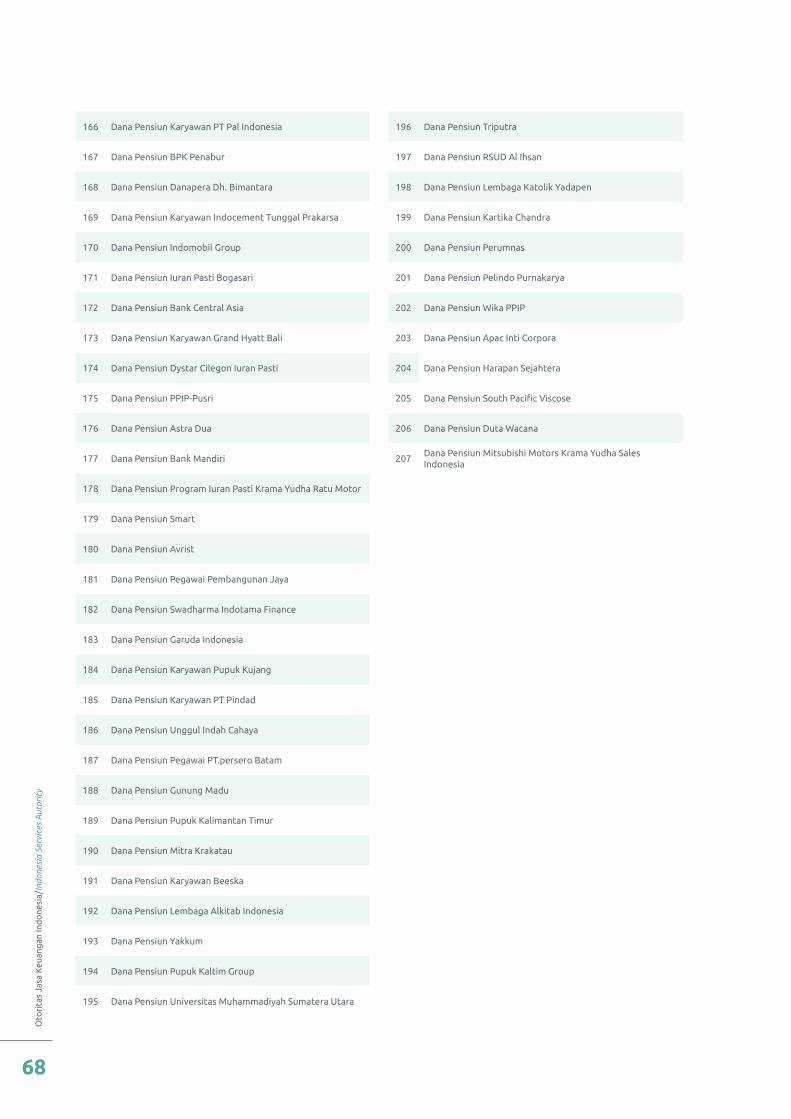
Oto
rita
s Ja
sa K
euan
gan
Ind
one
sia/
Indo
nesi
a Se
rvic
es A
utor
ity
68
166 Dana Pensiun Karyawan PT Pal Indonesia 196 Dana Pensiun Triputra
167 Dana Pensiun BPK Penabur 197 Dana Pensiun RSUD Al Ihsan
168 Dana Pensiun Danapera Dh. Bimantara 198 Dana Pensiun Lembaga Katolik Yadapen
169 Dana Pensiun Karyawan Indocement Tunggal Prakarsa 199 Dana Pensiun Kartika Chandra
170 Dana Pensiun Indomobil Group 200 Dana Pensiun Perumnas
171 Dana Pensiun Iuran Pasti Bogasari 201 Dana Pensiun Pelindo Purnakarya
172 Dana Pensiun Bank Central Asia 202 Dana Pensiun Wika PPIP
173 Dana Pensiun Karyawan Grand Hyatt Bali 203 Dana Pensiun Apac Inti Corpora
174 Dana Pensiun Dystar Cilegon Iuran Pasti 204 Dana Pensiun Harapan Sejahtera
175 Dana Pensiun PPIP-Pusri 205 Dana Pensiun South Pacific Viscose
176 Dana Pensiun Astra Dua 206 Dana Pensiun Duta Wacana
177 Dana Pensiun Bank Mandiri 207Dana Pensiun Mitsubishi Motors Krama Yudha Sales Indonesia
178 Dana Pensiun Program Iuran Pasti Krama Yudha Ratu Motor
179 Dana Pensiun Smart
180 Dana Pensiun Avrist
181 Dana Pensiun Pegawai Pembangunan Jaya
182 Dana Pensiun Swadharma Indotama Finance
183 Dana Pensiun Garuda Indonesia
184 Dana Pensiun Karyawan Pupuk Kujang
185 Dana Pensiun Karyawan PT Pindad
186 Dana Pensiun Unggul Indah Cahaya
187 Dana Pensiun Pegawai PT.persero Batam
188 Dana Pensiun Gunung Madu
189 Dana Pensiun Pupuk Kalimantan Timur
190 Dana Pensiun Mitra Krakatau
191 Dana Pensiun Karyawan Beeska
192 Dana Pensiun Lembaga Alkitab Indonesia
193 Dana Pensiun Yakkum
194 Dana Pensiun Pupuk Kaltim Group
195 Dana Pensiun Universitas Muhammadiyah Sumatera Utara
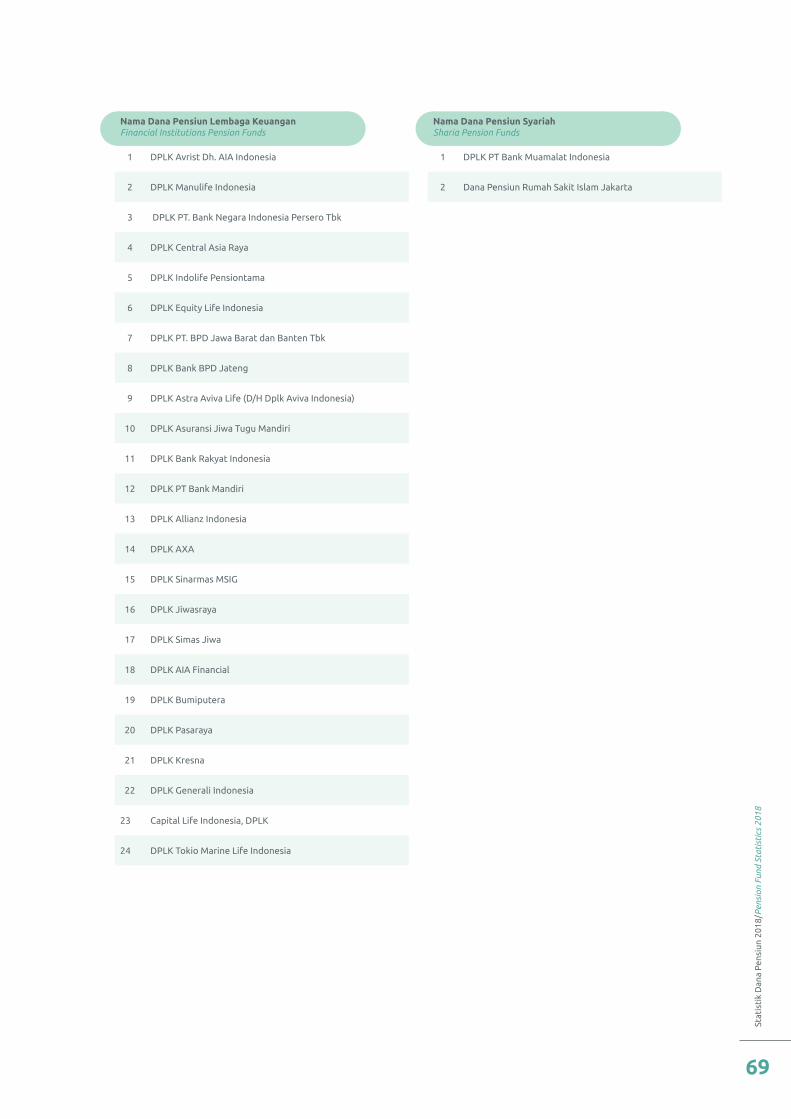
Stat
isti
k D
ana
Pen
siun
201
8/P
ensi
on F
und
Stat
isti
cs 2
018
69
Nama Dana Pensiun Lembaga KeuanganFinancial Institutions Pension Funds
Nama Dana Pensiun SyariahSharia Pension Funds
1 DPLK Avrist Dh. AIA Indonesia 1 DPLK PT Bank Muamalat Indonesia
2 DPLK Manulife Indonesia 2 Dana Pensiun Rumah Sakit Islam Jakarta
3 DPLK PT. Bank Negara Indonesia Persero Tbk
4 DPLK Central Asia Raya
5 DPLK Indolife Pensiontama
6 DPLK Equity Life Indonesia
7 DPLK PT. BPD Jawa Barat dan Banten Tbk
8 DPLK Bank BPD Jateng
9 DPLK Astra Aviva Life (D/H Dplk Aviva Indonesia)
10 DPLK Asuransi Jiwa Tugu Mandiri
11 DPLK Bank Rakyat Indonesia
12 DPLK PT Bank Mandiri
13 DPLK Allianz Indonesia
14 DPLK AXA
15 DPLK Sinarmas MSIG
16 DPLK Jiwasraya
17 DPLK Simas Jiwa
18 DPLK AIA Financial
19 DPLK Bumiputera
20 DPLK Pasaraya
21 DPLK Kresna
22 DPLK Generali Indonesia
23 Capital Life Indonesia, DPLK
24 DPLK Tokio Marine Life Indonesia
Oto
rita
s Ja
sa K
euan
gan
Ind
one
sia/
Indo
nesi
a Se
rvic
es A
utor
ity
70
Disclaimer/Disclaimer
OJK telah berupaya memastikan kualitas data pada publikasi ini. Namun demikian, OJK tidak bertanggung jawab dalam hal terdapat ketidakakuratan atau ketidaklengkapan dalam penyajian data pada publikasi ini dan OJK tidak akan bertanggung jawab atas kerugian yang ditimbulkan dari
penggunaan data pada publikasi ini.
While Indonesia FSA endeavours to ensure the quality of this publication, Indonesia FSA does not accept any responsibility for the inaccuracy or incompleteness of material included in this publication, and will not be liable for any loss or damage
arising out of any use of, or reliance on this publication.

Stat
isti
k D
ana
Pen
siun
201
8/P
ensi
on F
und
Stat
isti
cs 2
018
71
Informasi/Information
Kritik dan saran dapat disampaikan kepada/Critics and suggestion can be submitted to:
Direktorat Statistik dan Informasi Industri Keuangan Non Bank
Wisma Mulia 2 Lantai 11Jalan Jenderal Gatot Subroto Kav. 42Jakarta Selatan 12710
email: [email protected]

Oto
rita
s Ja
sa K
euan
gan
Ind
one
sia/
Indo
nesi
a Se
rvic
es A
utor
ity
72
Otoritas Jasa KeuanganDirektorat Statistik & Informasi IKNB
Wisma Mulia 2 Lantai 11Jalan Jenderal Gatot Subroto Kav. 42
Jakarta Selatan 12710