produksi dan penjadualan proyek - gunadarma...
TRANSCRIPT

Produksi dan PenjadualanProyekProyek
DR. Mohammad Abdul Mukhyi, SE., MMA
1

Project OrganizationWorks Best When
• Pekerjaan dapat digambarkan denganPekerjaan dapat digambarkan dengansuatu batas waktu dan tujuan spesifik
• Pekerjaan adalah unik atau sedikit• Pekerjaan adalah unik atau sedikitbanyaknya tidak familier pada organisasiP k j b i i t li b h b• Pekerjaan berisi tugas saling berhubungankompleks yang menuntut ketrampilankhkhusus
• Proyek adalah temporer tetapi kritiskepada organisasi
2

Project Planning, Scheduling,d C t lliand Controlling
Project Planning1. Setting goals Time/cost estimates
Budgetsg g2. Defining the project3. Tying needs into timed project
activities4. Organizing the team
BudgetsEngineering diagramsCash flow chartsMaterial availability details
Project Scheduling1. Tying resources to specific
activities2 R l ti ti iti t h th
CPM/PERTGantt charts
2. Relating activities to each other3. Updating and revising on a regular
basis
Project Controlling
Milestone chartsCash flow schedules
Project Controlling1. Monitoring resources, costs,
quality, and budgets2. Revising and changing plans3 Shifting resources to meet demands
Reports• budgets• delayed activities
3
3. Shifting resources to meet demands
During projectBefore project

Project PlanningProject Planning• Penetapan sasaran hasilPenetapan sasaran hasil• Penjelasan proyek• Menciptakan strukturMenciptakan struktur
uraian pekerjaan• Menentukan sumber dayaMenentukan sumber daya• Pembentukan organisasi
4

Work Breakdown StructureWork Breakdown Structure1. Project1. Project2. Major tasks in the
projectp j3. Subtasks in the major
tasks4. Activities (or work
packages) tobecompleted
5

Project SchedulingProject Scheduling• MengidentifikasiMengidentifikasi
hubungan yang lebihtinggi
• Aktivitas yang berkaitan• Menentukan aktivitas
waktu& biaya-biaya• Penaksiran kebutuhan
material dan pekerja• Menentukan aktivitas kritis
6

Project Management TechniquesProject Management Techniques
• Gantt chartGantt chart• Critical Path
Method (CPM)Method (CPM)• Program Evaluation
& R i& Review Technique (PERT)
7

Gantt ChartGantt Chart
8

PERT and CPMPERT and CPM• Teknik jaringanj g• Dikembangkan tahun 1950• CPM dengan Dupont untuk bahan kimia (1957)• PERT oleh Booz, Allen& Hamilton dengan angkatan laut,
U.S. untuk Polaris proyektil (1958)Mempertimbangkan hubungan yang lebih tinggi dan• Mempertimbangkan hubungan yang lebih tinggi daninterdependencies
• .. Masing-Masing penggunaan [adalah] suatu perkiraan g g p gg [ ] pwaktu aktivitas [yang] berbeda
9

Milwaukee General Hospital’s Activities andP dPredecessors
Activity Description ImmediatePredecessors
A Build internal componentsB Modify roof and floorC Construct collection stack AD Pour concrete and install frame A,BE Build high temperature burner CE Build high-temperature burner CF Install pollution control system CG Install air pollution device D, EH Inspect and test F. G
A

11

A C F
START E H
B D GB D G
12
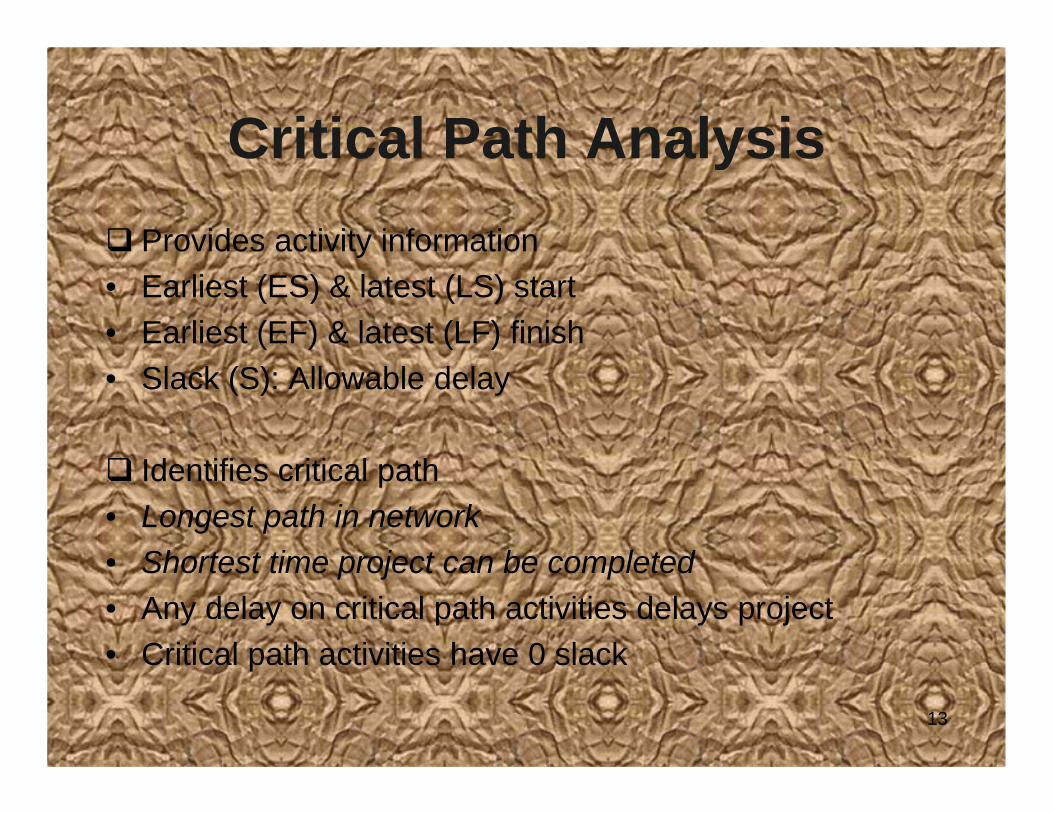
Critical Path AnalysisCritical Path AnalysisProvides activity informationy
• Earliest (ES) & latest (LS) start• Earliest (EF) & latest (LF) finish• Slack (S): Allowable delay
fIdentifies critical path• Longest path in network• Shortest time project can be completed• Shortest time project can be completed• Any delay on critical path activities delays project• Critical path activities have 0 slackCritical path activities have 0 slack
13

Latest Start and Finish StepsLatest Start and Finish Steps
• Begin at ending event and work backwardBegin at ending event and work backward• LF = Maximum EF for ending activities
LF i l t t fi i h EF i li t fi i h– LF is latest finish; EF is earliest finish• LS = LF - Activity time
– LS is latest start• LF = Minimum LS of all successors for
non-ending activities
14

PERT Activity TimesPERT Activity Times• 3 time estimates
Optimistic times (a)– Optimistic times (a)– Most-likely time (m)
P i i ti ti (b)– Pessimistic time (b)• Follow beta distribution• Expected time: t = (a + 4m + b)/6• Variance of times: v = (b - a)2/6Variance of times: v (b a)2/6
15

PERT Probability ExamplePERT Probability Example• suatu perencana proyek umumsuatu perencana proyek umum• Dinamika. Suatu proyek kapal selam
mempunyai waktu penyelesaian yang p y p y y gdiharapkan 40 minggu, dengan suatusimpangan baku 5 minggu.
• Apa mungkin dapat menyelesaikan dalamwaktu 50 minggu atau lebih sedikit?
16

Converting to Standardized VariableConverting to Standardized Variable
17

Obtaining the ProbabilityObtaining the Probability
18
Variability of Completion Time for NoncriticalP thPaths
• Variabilitas aktivitas pada noncritical alur harusVariabilitas aktivitas pada noncritical alur harusdipertimbangkan manakala menemukankemungkinan penyelesaian di dalam suatuwaktu yang ditetapkan.
• Variasi dalam noncritical aktivitas bisamenyebabkan perubahan dalam alur kritis
19
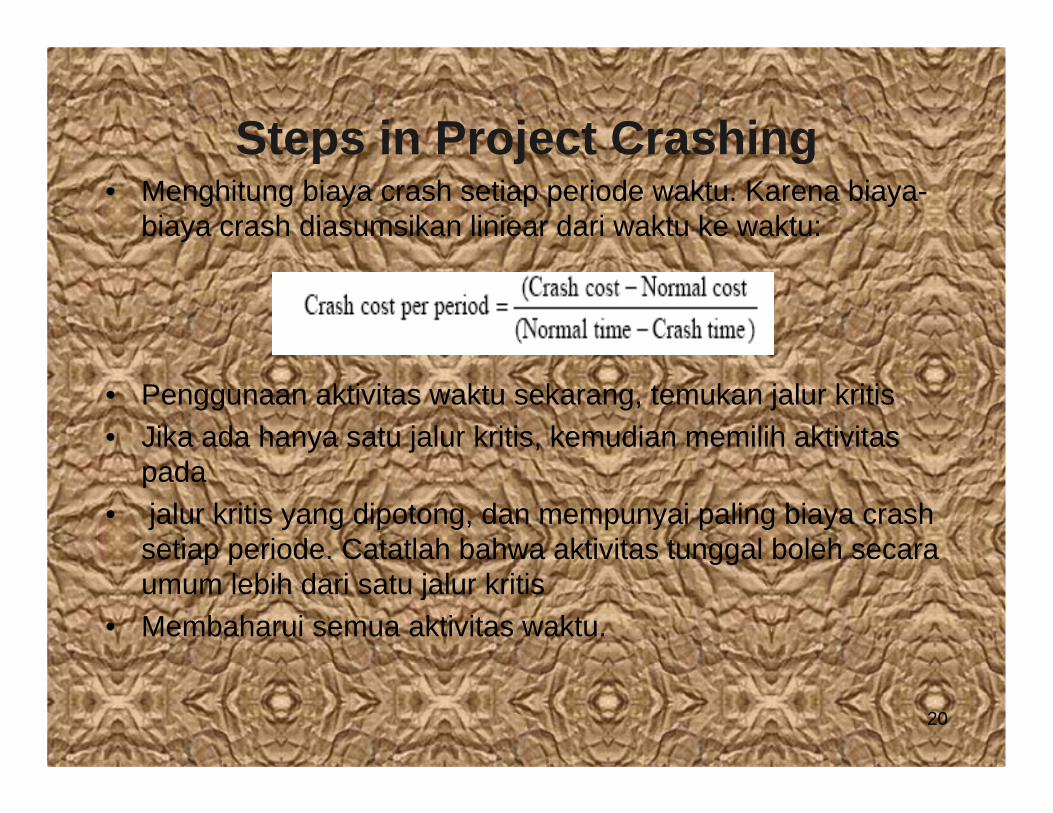
Steps in Project CrashingSteps in Project Crashing• Menghitung biaya crash setiap periode waktu. Karena biaya-
biaya crash diasumsikan liniear dari waktu ke waktu:
• Penggunaan aktivitas waktu sekarang, temukan jalur kritis• Jika ada hanya satu jalur kritis, kemudian memilih aktivitas
pada• jalur kritis yang dipotong, dan mempunyai paling biaya crash
setiap periode. Catatlah bahwa aktivitas tunggal boleh secarap p ggumum lebih dari satu jalur kritis
• Membaharui semua aktivitas waktu.
20

P d /S iProduct/ServiceDevelopment and Design
21

Stages of a Product’s Life CycleStages of a Product s Life Cycle
AutomobileAutomobileVideo RecorderVideo RecorderVideo RecorderVideo Recorder
Compact Disc PlayerCompact Disc Player
Fax MachineFax Machine
Cell PhoneCell Phone
Color Laser PrinterColor Laser Printer
B&W TVB&W TVFax MachineFax Machine
Color CopierColor Copier
Introduction Growth Maturity DeclineIntroduction Growth Maturity Decline
22

Product Life Cycle & Sales, Cost, and
Net Revenues
rofit
SalesRevenue
Cos
t & P
r NetRevenueLoss
1 2 3 4 5Sale
s, C
Introduction Growth M aturity DeclineTimeTime

Operations Emphasis in Product Life Cycle
Stage Operations Emphasis
Introductory Research Product development Process modification & enhancementSupplier development
Growth Capacity determination/enhancement Maturity High volume production with innovation
Cost control Reduction in optionsReduction in options Paring down of product line
Decline Termination of production if necessary
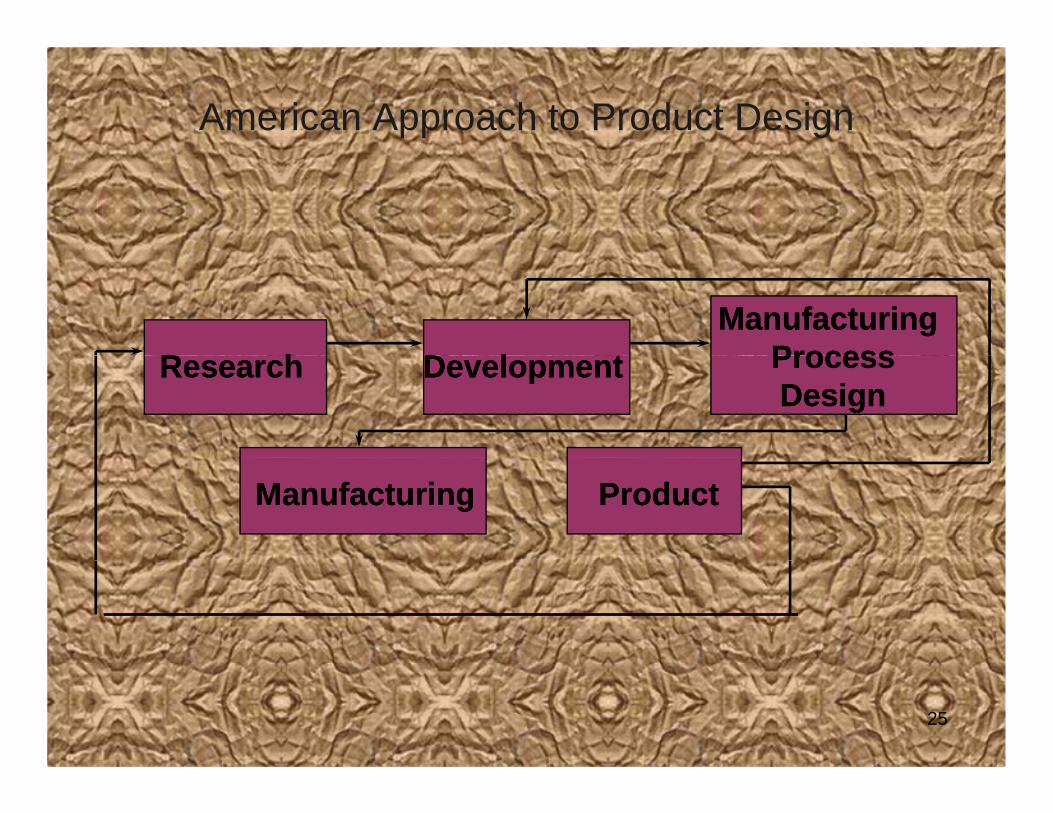
American Approach to Product Design
R hR h D l tD l tManufacturingManufacturing
ProcessProcessResearchResearch DevelopmentDevelopment ProcessProcessDesignDesign
ManufacturingManufacturing ProductProduct
25

Japanese Approach to Product Design
Research, Development, and Research, Development, and Manufacturing Process Design Manufacturing Process Design
ManufacturingManufacturing ProductProduct
26

Product/Service Design
• Manakala suatu produk dirancang:
Product/Service Design
Manakala suatu produk dirancang:• Karakteristik terperinci produk yang dibentuk.• Karakteristik produk secara langsungKarakteristik produk secara langsung
mempengaruhi bagaimana produk dapatdiproduksi atau dikirimkan.p
• Bagaimana produk diproduksi atau disalurkanakan menentukan disain dari produksi atausistem saluran.
27

Product/Service DesignProduct/Service Design
Desai produk atau jasa secara langsungDesai produk atau jasa secara langsungmempengaruhi:• Mutu produk atau jasa• Mutu produk atau jasa• Biaya produksi atau penyaluran• Kepuasan pelanggan
28

Product/Service Design and DevelopmentProduct/Service Design and Development
• Sumber daya produksiSumber daya produksi• Mengembangkan produk atau jasa baru• Menjadikan menjualnya lebih cepatMenjadikan menjualnya lebih cepat• Menginprofe produk atau jasa sekarang• Perancangan untuk mempermudah produksi• Perancangan untuk mempermudah produksi• Perancangan mutu• Merancang dan mengembangkan jasa baru• Merancang dan mengembangkan jasa baru
29

Sources of Product/Service InnovationSources of Product/Service Innovation
• PelangganPelanggan• Para manajer• PemasaranPemasaran• Operasional• Rancang Bangun• Rancang-Bangun• Riset dan pengembangan ( R&D)
Riset dasar– Riset dasar– Riset terapan
30
Steps in Designing and DevelopingN P d tNew Products
1. studi kelayakan ekonomi dan teknisy2. Disain prototipe3. Test kemampuan prototipe4. Mengevaluasi pasar dan evaluasi ekonomi prototipe5. Perancangan model produksi6. Menguji pasar, pencapaian dan dan proses serta
evaluasi produksi model ekonomi7 Melanjutkan modifikasi model produksi7. Melanjutkan modifikasi model produksi
31

Getting New Products to Market FasterGetting New Products to Market Faster
• Kecepatan menciptakan manfaat kompetisiKecepatan menciptakan manfaat kompetisi• Kecepatan menyelamatkan uang• Meningkatkan kecepatan alat:Meningkatkan kecepatan alat:
– Otonomi pengembangan dan disain team– Computer-aided design/computer-aided p g p
manufacturing (CAD/CAM)– Rancang-bangun bersama
32

Improving the Designf E i ti P d t /S iof Existing Products/Services
• Fokus dalam meningkatkan pencapaian, mutu, danFokus dalam meningkatkan pencapaian, mutu, danbiaya
• Tujuan adalah memelihara atau meningkatkanpenguasaan pasar kedewasaan produk atau jasa
• Perubahan sedikit dapat menjadi penting• Kecil, peningkatan yang berlanjutan dapat
menambah sampai pada peningkatan jangkapanjang yang besarpanjang yang besar
• Analisis nilai yang diharapkan, corak disain berarti menguji keterkaitan dengan cost / benefit mereka g j g
33
Designing for Ease of ProductionDesigning for Ease of Production
Mempermudah Produksip• Spesifikasi informasi tepat tentang karakteristik dari
produk• Toleransi Minimum dan batas maksimum atas suatu
dimensi yang mengijinkan item untuk merancang fungsi• Standardisasi mengurangi variasi antar suatu kelompok• Standardisasi mengurangi variasi antar suatu kelompok
komponen atau produk• Penyederhanaan mengurangi atau menghapuskan
kompleksitas dari suatu produk atau bagian
34

Designing for QualityDesigning for Quality
• Unsur kerumitan disain produk dampaknya pada mutup p y p• Mutu ditentukan oleh persepsi konsumen dari derajat
tingkat keunggulan karakteristik produk atau jasa• Prinsip perancangan mutu produk atau jasa
Tiga dimensi disain umum adalah:Tiga dimensi disain umum adalah:• Derajat tingkat standardisasi menyangkut layanan• Derajat kontak pelanggan di dalam mengirimkan jasaDerajat kontak pelanggan di dalam mengirimkan jasa• Campuran barang-barang phisik dan jasa tak terukur
35

Process Planningand Design
36

Process Planning and DesignInputs:Inputs:
P d /S i I f iP d /S i I f i
Process Planning and Design
•• Product/Service InformationProduct/Service Information•• Production System InformationProduction System Information•• Operations StrategyOperations Strategyp gyp gy
Process Planning & Design:Process Planning & Design:Process Planning & Design:Process Planning & Design:•• Select process typeSelect process type•• Vertical integration studiesVertical integration studies•• Process/Product studiesProcess/Product studies
Outputs:Outputs:•• Process Technology Process Technology
F ili iF ili i•• Process/Product studiesProcess/Product studies•• Equipment studiesEquipment studies•• Production procedures studiesProduction procedures studies
•• FacilitiesFacilities•• Personnel EstimatesPersonnel Estimates
•• Facilities studiesFacilities studies37

Major Factors Affecting Process D iDesigns
• Nature of product/service demandNature of product/service demand• Degree of vertical integration
P d ti fl ibilit• Production flexibility• Degree of automation• Product/Service quality
38

Degree of Vertical IntegrationDegree of Vertical Integration• Vertical integration is the amount of the production
and distribution chain that is brought under theand distribution chain that is brought under the ownership of a company.
• This determines how many production processes need to be planned and designed.
• Decision of integration is based on cost, availability f it l lit t h l i l bilit dof capital, quality, technological capability, and
more.• Strategic outsourcing (lower degree of integration) is• Strategic outsourcing (lower degree of integration) is
the outsourcing of processes in order to react quicker to changes in customer needs, competitor actions, and technology.
39

Production FlexibilityProduction Flexibility
• Product flexibility -- ability of theProduct flexibility ability of the production (or delivery) system to quickly change from producing (delivering) onechange from producing (delivering) one product (or service) to another.
• Volume flexibility ability to quickly• Volume flexibility -- ability to quickly increase or reduce the volume of product( or service) produced (or delivered)or service) produced (or delivered).
40

Degree of AutomationDegree of Automation
• Advantages of automationAdvantages of automation– Improves product quality
Improves product flexibility– Improves product flexibility– Reduces labor and related costs
Di d t f t ti• Disadvantages of automation– Equipment can be very expensive– Integration into existing operations can be
difficult
41

Types of Process DesignsTypes of Process Designs
• Product-FocusedProduct Focused• Process-Focused
G T h l /C ll l M f t i• Group Technology/Cellular Manufacturing
42
Product-Focused (Production Line)Product Focused (Production Line)• Processes (conversions) are arranged based on
the sequence of operations required to producethe sequence of operations required to produce a product or provide a service
• Two general forms• Two general forms– Discrete unit– Process (Continuous)Process (Continuous)
• Examples– Automobiles– Vacuum cleaners
43

Product-Focused ProductionProduct Focused Production22 44
Raw MaterialRaw Material ComponentsComponents22
AssembliesAssemblies Fin. GoodsFin. Goods3311 7755
ComponentsComponents SubassemSubassem..Raw MaterialRaw Material
PurchasedPurchased
Components,Components,1
66
Product/Material FlowProduct/Material Flow SubassembliesSubassemblies1Product/Material FlowProduct/Material Flow
Production OperationProduction Operation
44

Process-Focused (Job Shop)Process Focused (Job Shop)• Processes (conversions) are arranged based on
the type of process, i.e., like processes arethe type of process, i.e., like processes are grouped together
• Products/services (jobs) move from department (j ) p(process group) to department based on that particular job’s processing requirements
• Examples– Auto body repair– Custom woodworking shop
45

Process-Focused ProductionProcess Focused ProductionCustom Woodworking ShopCustom Woodworking Shop
CuttingCutting AssemblyAssembly SandingSanding FinishingFinishingPlaningPlaning ShapingShaping
11 55 7722 66
33
33
44
22Job AJob A
J b BJ b B
D illiD illi T iT i
33
11 66
44Job BJob B
44 55
DrillingDrilling TurningTurning
46

Group Technology/Cellular Manufacturing
• Group technology forms parts with similarGroup technology forms parts with similar processing requirements into part families or groups.
• A manufacturing cell is an arrangement of the processes required to make the parts that make up the group.
47

Group Technology/CellsGroup Technology/Cells• Advantages (relative to a job shop)
Process changeovers simplified– Process changeovers simplified– Variability of tasks reduced
M di t t th h th t– More direct routes through the system– Quality control is improved
P d ti l i d t l i l– Production planning and control simpler– Automation simpler
48

Group Technology/CellsGroup Technology/Cells• Disadvantages
– Duplication of equipment– Under-utilization of facilities– Processing of items that do not fit into a family
may be inefficient
49
Product/Process Design & I P liInventory Policy
• Standard Products and Produce to StockStandard Products and Produce to Stock– Forecast/orders drive production schedule
Maintain pre determined finished goods levels– Maintain pre-determined finished-goods levels– MRP forecast drives material ordering
C t P d t d P d t O d• Custom Products and Produce to Order– Orders set production schedule and drive
t i l d li imaterial deliveries– Design time may be required before
production can be scheduledproduction can be scheduled 50

Process Design in ServicesProcess Design in Services• Quasi manufacturing -- production of
goods takes place along a production linegoods takes place along a production line with almost no customer interactionC t ti i t hi h d f• Customer-as-participant -- high degree of customer involvement in the process of
ti th igenerating the service• Customer-as-product -- service is provided
through personal attention to the customer
51

Deciding Among Processing Al iAlternatives
• Batch Size and Product/Service VarietyBatch Size and Product/Service Variety• Capital Requirements• Economic AnalysisEconomic Analysis
– Cost functions of alternativesOperating leverage relationship between a– Operating leverage - relationship between a firm’s annual costs and its annual sales
– Break-even analysis– Break-even analysis– Financial analysis
52

Process Design Depends onP d t Di it d B t h SiProduct Diversity and Batch Size
ProductProductF dF dFocused,Focused,DedicatedDedicatedSystemsSystems
ch S
ize ProductProduct
Focused,Focused,BatchBatch
Bat
c BatchBatchSystemSystem
CellularCellularM f t iM f t i
ProcessProcess--Focused,Focused,Job ShopJob Shop
ManufacturingManufacturing
Number of Product Designs 53

Flexible Manufacturing System
GeneralGeneral
ProductsProducts
10001000
GeneralGeneralpurposepurpose
Work cellsWork cellsCIMCIM
100100
CIMCIM
FlexibleFlexibleManufacturingManufacturing
SystemSystemFocusedFocused
1010SystemSystem automationautomation
Dedicated Dedicated automationautomation
1111 1010 100100 10001000 1000010000 100000100000 10000001000000
automationautomation
VolumeVolumeVolumeVolume

Economic AnalysisC t F ti f P i Alt ti• Cost Function of Processing Alternatives– If capital is not a factor, the process design
f d d d d t lpreferred depends upon product volume• Operating Leverage
– Relationship between firm’s annual costs and annual sales
– If high % firm’s costs fixed, then high degree of operating leverageS % %– Small % change in sales drives large % change in operating income
• . . . more55

Economic AnalysisEconomic Analysis• Break Even Analysis
F l f i– Formulas for comparing processes– Cannot incorporate uncertainty, costs
assumed over entire range of values andassumed over entire range of values, and does not take into account time value of moneymoney
• Financial AnalysisIncorporate time value of money net– Incorporate time value of money .... net present value, internal rate of return, etc.
56

Cost Functions of Processing AlternativesAlternatives
Annual Cost of Production ($000)Annual Cost of Production ($000)
AutomatedAutomatedAssembly LineAssembly Line
2,0002,000
1,5001,500
CellularCellularManufacturingManufacturing
PreferredPreferred
yyPreferredPreferred
JobJob1,0001,000
1,5001,500
Units Units ProducedProducedPer YearPer Year
PreferredPreferredShopShopPreferredPreferred
500500
100,000100,000 250,000250,00057

Example: Cost Functionsf P i Alt tiof Processing Alternatives
Three production processes - A B and C - have theThree production processes - A, B, and C - have the following cost structure:
Fixed Cost Variable CostProcess Per Year Per Unit
A $120,000 $3.00B 90 000 4 00B 90,000 4.00C 80,000 4.50
What is the most economical process for a volume of 8,000 units per year?
58

Example: Cost Functionsf P i Alt tiof Processing Alternatives
• Most Economical Process at 8,000 Units,
TC = FC + v(Q)
A: TC = 120,000 + 3.00(8,000) = $144,000 per yearC ( ) $B: TC = 90,000 + 4.00(8,000) = $122,000 per year
C: TC = 80,000 + 4.50(8,000) = $116,000 per year
Process C has the lowest annual cost.
59

Example: Cost Functionsf P i Alt tiof Processing Alternatives
• Break-Even Points of Processes
Q = FC / (p-v)
A i $6 95 lli i itAssuming a $6.95 selling price per unit:A: Q = 120,000 / (6.95 - 3.00) = 30,380 unitsB: Q = 90 000 / (6 95 - 4 00) = 30 509 unitsB: Q = 90,000 / (6.95 - 4.00) = 30,509 unitsC: Q = 80,000 / (6.95 - 4.50) = 32,654 units
60

Deciding Among Processing Al iAlternatives
• Assembly Charts (Gozinto Charts)Assembly Charts (Gozinto Charts)– Macro-view of how materials are united– Starting point to understand factory layout needs, g p y y
equipment needs, training needs• Process Charts
– Details of how to build product at each process– Includes materials needed, types of processes
product flows through time it takes to process productproduct flows through, time it takes to process product through each step of flow
61

Wrap-Up: World Class PracticeWrap Up: World Class Practice
• Fast new product introductionFast new product introduction • Design products for ease of production• Refine forecastingg• Focus on core competencies ... less vertical
integration• Lean production• Flexible automation• Job shops move toward cellular manufacturing• Manage information flow ..... automate and simplify!
62