pt bank permata tbk
TRANSCRIPT

Analyst Presentation
Prepared by Investor Relations
PT BANK PERMATA Tbk September 2020 Financial Result
as of 02 November 2020
Disclaimer Laporan ini disusun oleh PT Bank Permata Tbk secara independen dan diedarkan hanya untuk tujuan informasi
umum. Hal ini tidak dimaksudkan untuk orang tertentu yang mungkin menerima laporan ini. Informasi dalam laporan
ini telah diperoleh dari sumber-sumber yang kami anggap dapat dipercaya. Tidak ada jaminan (tersurat maupun
tersirat) yang dibuat untuk keakuratan atau kelengkapan informasi. Semua pendapat dan perkiraan yang termasuk
dalam laporan ini merupakan penilaian kami pada tanggal ini dan dapat berubah tanpa pemberitahuan sebelumnya.
Kami tidak bertanggung jawab atau memiliki kewajiban apa pun tanpa pemberitahuan sebelumnya dari PT Bank
Permata Tbk dan / atau karyawan dan / atau agen mereka masing-masing yang timbul yang dapat dibawa atau
diderita oleh orang lain sebagai akibat bertindak atas dasar seluruh atau sebagian dari isi laporan ini. Baik PT Bank
Permata Tbk dan / atau perusahaan afiliasinya dan / atau karyawan dan / atau agennya masing-masing tidak
bertanggung jawab atas kesalahan, kelalaian dalam laporan ini dan setiap ketidakakuratan atau kelalaian yang
mungkin timbul.
This report has been prepared by PT Bank Permata Tbk independently and is circulated for the purpose of general
information only. It is not intended to the specific person who may receive this report. The information in this report
has been obtained from sources which we deem reliable. No warranty (expressed or implied) is made to the
accuracy or completeness of the information. All opinions and estimations included in this report constitute our
judgment as of this date and are subject to change without prior notice.
We disclaim any responsibility or liability without prior notice of PT Bank Permata Tbk and/or their respective
employees and/or agents whatsoever arising which may be brought against or suffered by any person as a result of
acting in reliance upon the whole or any part of the contents of this report and neither PT Bank Permata Tbk and/or
its affiliated companies and/or their respective employees and/or agents accepts liability for any errors, omissions,
negligent or otherwise, in this report and any inaccuracy herein or omission here from which might otherwise arise.
Presentation Content
3
PERMATA BANK IN BRIEF 2
MACRO ECONOMY UPDATES 1
BUSINESS UPDATE 4
FINANCIAL PERFORMANCE HIGHLIGHTS 3
OTHER INFORMATION 5

14,245 13,700
16,825
15,669
14,231
14,780 14,543
14,554 14,951
30
-Se
p-1
9
31
-Oct
-19
30
-No
v-1
9
31
-De
c-1
9
31
-Jan
-20
29
-Fe
b-2
0
31
-Ma
r-2
0
30
-Ap
r-2
0
31
-Ma
y-2
0
30
-Ju
n-2
0
31
-Ju
l-2
0
31
-Au
g-2
0
30
-Se
p-2
0
USD/IDR
3.39%
3.00% 2.98%
1.54%1.32% 1.42%
2.0%
4.0%
Sep
-19
Oct
-19
No
v-1
9
Dec
-19
Jan-
20
Feb
-20
Mar
-20
Ap
r-20
May
-20
Jun
-20
Jul-
20
Au
g-20
Sep
-20
Inflation (yoy)
Macro Economy Decreasing interest rate to boost domestic growth
Rupiah is weakened since Feb-20, due to Covid-19 outbreak
Deflation trend and already below BI target
GDP Growth is starting rebound
low range target
high range target
5.25%5.00%
4.75%4.50%
4.50%4.00% 4.00%
Sep
-19
Oct
-19
Nov
-19
De
c-1
9
Jan
-20
Feb
-20
Mar
-20
Ap
r-2
0
May
-20
Jun
-20
Jul-2
0
Jul-2
0
Au
g-2
0
Sep
-20
7 Days Reverse Repo rate
5.17% 5.18% 5.07% 5.05% 5.02% 4.97%
2.97%
-5.32%
-3.0% est.
Q3-18 Q4-18 Q1-19 Q2-19 Q3-19 Q4-19 Q1-20 Q2-20 Q3-20
4
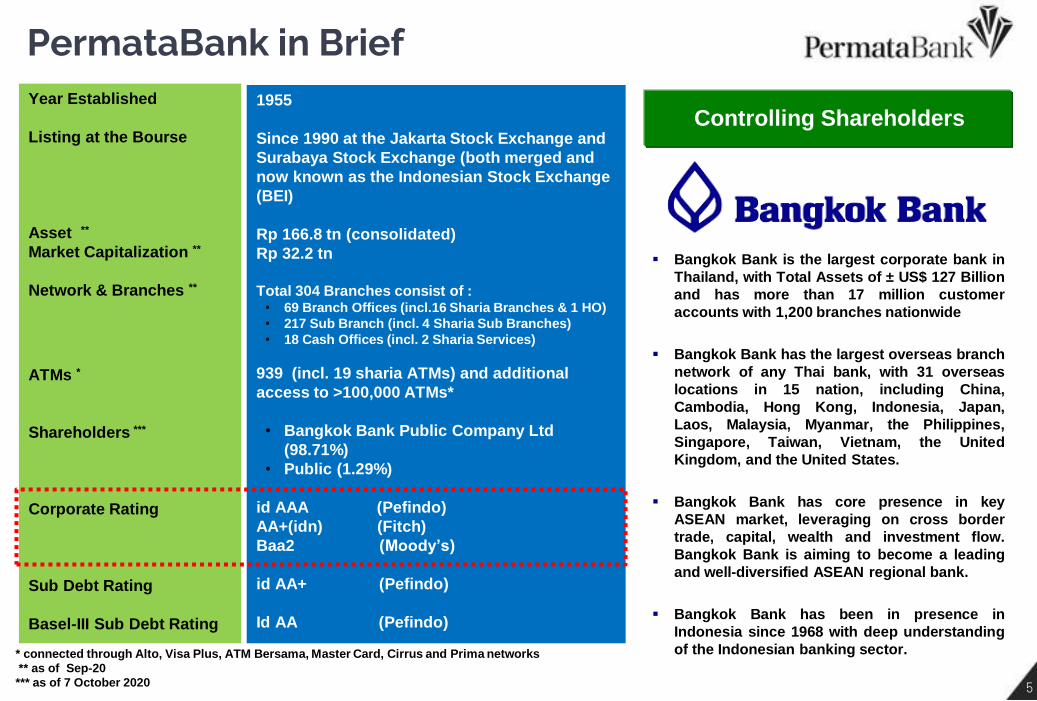
PermataBank in Brief Year Established
Listing at the Bourse
Asset **
Market Capitalization **
Network & Branches **
ATMs *
Shareholders ***
Corporate Rating
Sub Debt Rating
Basel-III Sub Debt Rating
1955
Since 1990 at the Jakarta Stock Exchange and
Surabaya Stock Exchange (both merged and
now known as the Indonesian Stock Exchange
(BEI)
Rp 166.8 tn (consolidated)
Rp 32.2 tn
Total 304 Branches consist of :
• 69 Branch Offices (incl.16 Sharia Branches & 1 HO)
• 217 Sub Branch (incl. 4 Sharia Sub Branches)
• 18 Cash Offices (incl. 2 Sharia Services)
939 (incl. 19 sharia ATMs) and additional
access to >100,000 ATMs*
• Bangkok Bank Public Company Ltd
(98.71%)
• Public (1.29%)
id AAA (Pefindo)
AA+(idn) (Fitch)
Baa2 (Moody’s)
id AA+ (Pefindo)
Id AA (Pefindo)
Bangkok Bank is the largest corporate bank in
Thailand, with Total Assets of ± US$ 127 Billion
and has more than 17 million customer
accounts with 1,200 branches nationwide
Bangkok Bank has the largest overseas branch
network of any Thai bank, with 31 overseas
locations in 15 nation, including China,
Cambodia, Hong Kong, Indonesia, Japan,
Laos, Malaysia, Myanmar, the Philippines,
Singapore, Taiwan, Vietnam, the United
Kingdom, and the United States.
Bangkok Bank has core presence in key
ASEAN market, leveraging on cross border
trade, capital, wealth and investment flow.
Bangkok Bank is aiming to become a leading
and well-diversified ASEAN regional bank.
Bangkok Bank has been in presence in
Indonesia since 1968 with deep understanding
of the Indonesian banking sector. * connected through Alto, Visa Plus, ATM Bersama, Master Card, Cirrus and Prima networks
** as of Sep-20
*** as of 7 October 2020
Controlling Shareholders
5
6
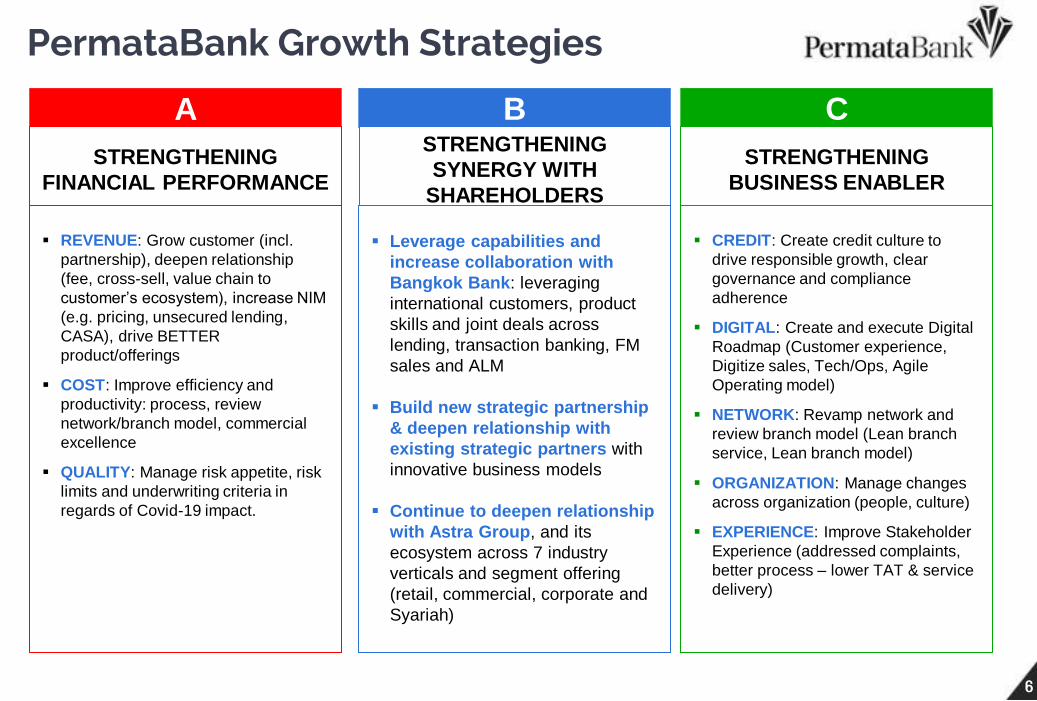
PermataBank Growth Strategies
6
REVENUE: Grow customer (incl.
partnership), deepen relationship
(fee, cross-sell, value chain to
customer’s ecosystem), increase NIM
(e.g. pricing, unsecured lending,
CASA), drive BETTER
product/offerings
COST: Improve efficiency and
productivity: process, review
network/branch model, commercial
excellence
QUALITY: Manage risk appetite, risk
limits and underwriting criteria in
regards of Covid-19 impact.
A
Leverage capabilities and
increase collaboration with
Bangkok Bank: leveraging
international customers, product
skills and joint deals across
lending, transaction banking, FM
sales and ALM
Build new strategic partnership
& deepen relationship with
existing strategic partners with
innovative business models
Continue to deepen relationship
with Astra Group, and its
ecosystem across 7 industry
verticals and segment offering
(retail, commercial, corporate and
Syariah)
B
CREDIT: Create credit culture to
drive responsible growth, clear
governance and compliance
adherence
DIGITAL: Create and execute Digital
Roadmap (Customer experience,
Digitize sales, Tech/Ops, Agile
Operating model)
NETWORK: Revamp network and
review branch model (Lean branch
service, Lean branch model)
ORGANIZATION: Manage changes
across organization (people, culture)
EXPERIENCE: Improve Stakeholder
Experience (addressed complaints,
better process – lower TAT & service
delivery)
C
STRENGTHENING
FINANCIAL PERFORMANCE
STRENGTHENING
SYNERGY WITH
SHAREHOLDERS
STRENGTHENING
BUSINESS ENABLER
Financial Performance
Financial Performance Highlights
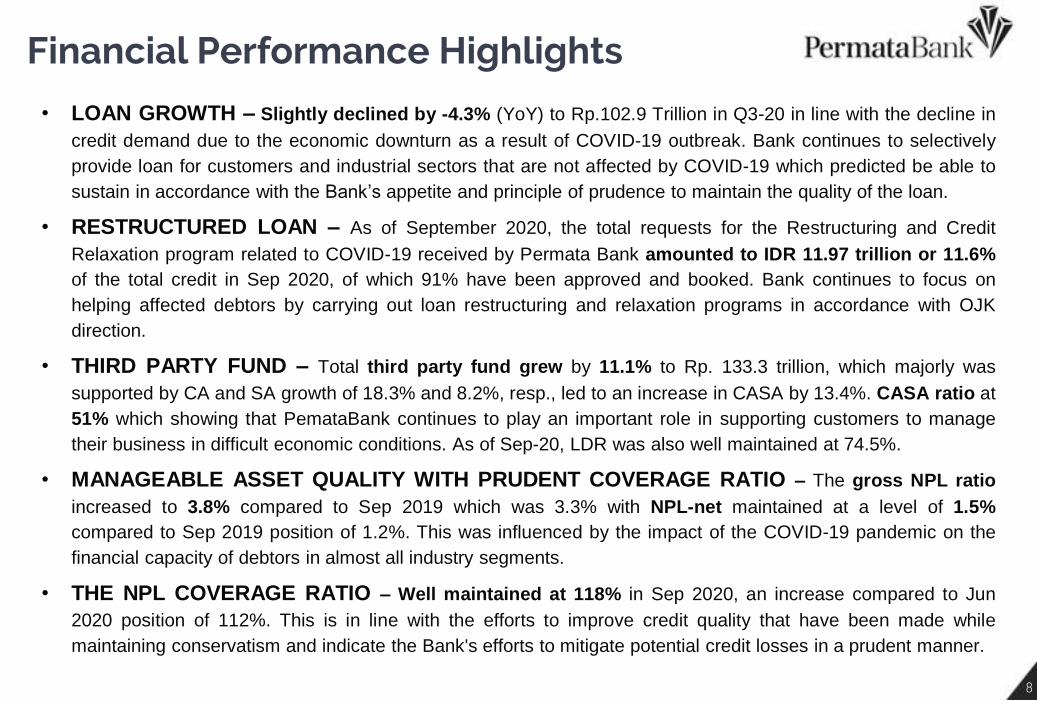
• LOAN GROWTH – Slightly declined by -4.3% (YoY) to Rp.102.9 Trillion in Q3-20 in line with the decline in
credit demand due to the economic downturn as a result of COVID-19 outbreak. Bank continues to selectively
provide loan for customers and industrial sectors that are not affected by COVID-19 which predicted be able to
sustain in accordance with the Bank’s appetite and principle of prudence to maintain the quality of the loan.
• RESTRUCTURED LOAN – As of September 2020, the total requests for the Restructuring and Credit
Relaxation program related to COVID-19 received by Permata Bank amounted to IDR 11.97 trillion or 11.6%
of the total credit in Sep 2020, of which 91% have been approved and booked. Bank continues to focus on
helping affected debtors by carrying out loan restructuring and relaxation programs in accordance with OJK
direction.
• THIRD PARTY FUND – Total third party fund grew by 11.1% to Rp. 133.3 trillion, which majorly was
supported by CA and SA growth of 18.3% and 8.2%, resp., led to an increase in CASA by 13.4%. CASA ratio at
51% which showing that PemataBank continues to play an important role in supporting customers to manage
their business in difficult economic conditions. As of Sep-20, LDR was also well maintained at 74.5%.
• MANAGEABLE ASSET QUALITY WITH PRUDENT COVERAGE RATIO – The gross NPL ratio
increased to 3.8% compared to Sep 2019 which was 3.3% with NPL-net maintained at a level of 1.5%
compared to Sep 2019 position of 1.2%. This was influenced by the impact of the COVID-19 pandemic on the
financial capacity of debtors in almost all industry segments.
• THE NPL COVERAGE RATIO – Well maintained at 118% in Sep 2020, an increase compared to Jun
2020 position of 112%. This is in line with the efforts to improve credit quality that have been made while
maintaining conservatism and indicate the Bank's efforts to mitigate potential credit losses in a prudent manner.
8

Financial Performance Highlights
• REVENUE GROWTH – Pre Provision Operating Profit (PPOP) was recorded at IDR 2.6 Trillion or grew by
20.4% (YoY) compared to the same period last year, which was mainly contributed by an increase in Net
Interest Income of 8.6% (YoY) to IDR 4.7 Trillion by end Q3-20 and also the Operating Income other than
Interest (Fee Based Income) increased by 9.0% to IDR 1.6 Trillion. This led to the achievement of the NIM ratio
to 4.4% or an increase of 19bps compared to the position in Sep 2019 of 4.2%. Meanwhile the Fee Income to
Income (FIR) ratio was maintained at the level of 25.1%, increasing by 11bps compared to the position in Sep
2019 of 25.0%.
• OPERATIONAL COST – Business efficiency has continuously improved with the achievement of the Cost to
Income Ratio (CIR) of 59.8%, a significant improvement compared to last year position of 63.6%. This is
achieved through effective cost management efforts combined with the use of technology and digitized
transaction in enabling the Bank to be more adaptive during COVID-19 pandemic and continuously serving
potential customers effectively.
• NET INCOME - The increase in credit provision expenses and the effect of changing in Corporate Income Tax
rates has significantly affected the Bank's profits, however, up to Q3-20 the Bank still booked Profit After Tax of
Rp.430 billion, downed by 60.7% compared to last year's achievement. Normalized Profit After Tax (exclude LI
impact of COVID-19 and changing in CIT from 25% to 22%) will be approx. Rp.806 billion.
• STRONG LIQUIDTY - Common Equity Tier 1 (CET-1) and Capital Adequacy Ratio (CAR) were
maintained firmly in the position of Sep 2020 at 20.5% and 21.6%, respectively, an increase compared to 18.6%
and 19.8% in the period same year ago - much higher than the applicable minimum capital requirement. The
capital ratio even remained strong after incorporating the impact of the first implementation of PSAK 71
regarding the provision for losses of financial instruments effective from Jan 1, 2020.
9

Key Financial Highlights
Sep 2019 Sep 2020 ∆ (%)
Loans (Rp Tn) 107,6 → 102.9 -4.3%
Gross NPL Ratio
Net NPL Ratio
NPL Coverage Ratio
3.3%
1.2%
164%
→
→
→
3.8%
1.5%
118%
0.5%
0.3%
-46%
CASA Ratio
[CASA (Rp Tn)]*
50%
59.7
→
→ 51%
68
0.8%
13.4%
LDR 88% → 74.5% -13.5%
NIM 4.2% → 4.4% 0.2%
BOPO 87.2% → 92% 4.8%
CIR 62% → 60% -3.8%
Profit Before Tax (Rp Bn) 1,463 → 833 -43%
Profit After Tax (Rp Bn)
Profit After Tax (Rp Bn)**
1,093
1,093
→
→
430
806
-61%
-26%
Notes : * Including Sharia deposits
** Excluding the COVID-19 impact on the increasing allowance for impairment asset and the effect of decreasing CIT – PPh from 25% to 22%
Source : Published Report (Consolidated) 10
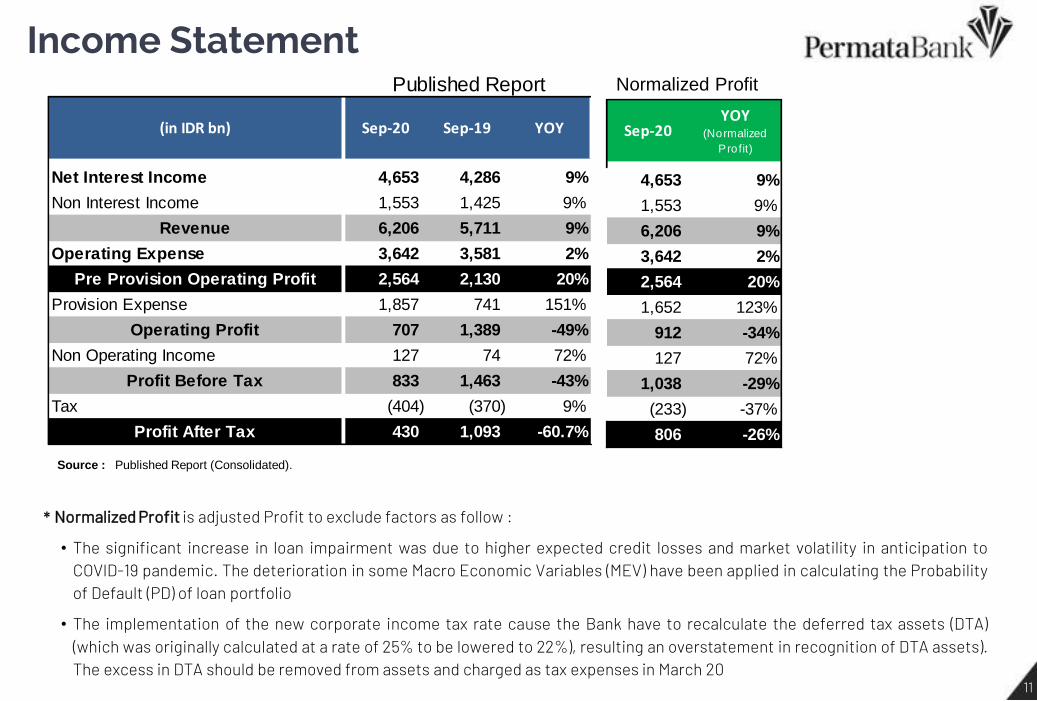
Income Statement
Source : Published Report (Consolidated).
* Normalized Profit is adjusted Profit to exclude factors as follow :
• The significant increase in loan impairment was due to higher expected credit losses and market volatility in anticipation to COVID-19 pandemic. The deterioration in some Macro Economic Variables (MEV) have been applied in calculating the Probability of Default (PD) of loan portfolio
• The implementation of the new corporate income tax rate cause the Bank have to recalculate the deferred tax assets (DTA) (which was originally calculated at a rate of 25% to be lowered to 22%), resulting an overstatement in recognition of DTA assets). The excess in DTA should be removed from assets and charged as tax expenses in March 20
Normalized Profit
Net Interest Income 4,653 4,286 9%
Non Interest Income 1,553 1,425 9%
Revenue 6,206 5,711 9%
Operating Expense 3,642 3,581 2%
Pre Provision Operating Profit 2,564 2,130 20%
Provision Expense 1,857 741 151%
Operating Profit 707 1,389 -49%
Non Operating Income 127 74 72%
Profit Before Tax 833 1,463 -43%
Tax (404) (370) 9%
Profit After Tax 430 1,093 -60.7%
(in IDR bn)
Published Report
YOYSep-20 Sep-19
4,653 9%
1,553 9%
6,206 9%
3,642 2%
2,564 20%
1,652 123%
912 -34%
127 72%
1,038 -29%
(233) -37%
806 -26%
Sep-20YOY
(Normalized
Profit)
11

Balance Sheet
Source : Published Report (Consolidated) Notes : * Including Reverse repo
** Including Sharia deposits
Cash 1.6 1.8 -11.9% 2.3 -31%
Placement with Bank Indonesia 16.5 14.8 11.5% 16.3 1%
Placement with Other Banks 4.0 7.3 -45.2% 9.6 -58%
Marketable Securities * 34.4 16.8 104.7% 11.9 190%
Loans (gross) 102.9 107.6 -4.3% 108.2 -5%
Allowance for Loan Impairment Losses (4.5) (5.8) -22.7% (3.9) 14%
Other Assets 12.0 12.7 -5.9% 17.2 -31%
Total Assets 166.8 155.1 7.5% 161.5 3%
Deposits ** 133.3 120.0 11.1% 122.9 8%
- Current Accounts 36.4 30.7 18.3% 32.4 12%
- Saving Accounts 31.3 29.0 8.2% 29.8 5%
- Time Deposits 65.7 60.3 8.9% 60.7 8%
Subordinated Debt 1.6 4.2 -62.5% 2.3 -31%
Others Liabilities 7.8 7.3 7.6% 12.3 -36%
Total Liabilities 142.7 131.4 8.6% 137.5 4%
Shareholders' Equity 24.1 23.7 1.5% 24.0 0%
Total Liabilities & Shareholders' Equity 166.8 155.1 7.5% 161.5 3%
(in IDR tn) Sep-20 Sep-19 YoY Dec-19 YTD
12

Financial Ratios
Source: Published and Management Report (Bank only)
Note: CASA Ratio includes Sharia deposits
CET-1 ratio 20.5 18.7 18.6 2.0
Total CAR 21.6 19.9 19.8 1.8
Loan to Deposit Ratio (LDR) 75 86 88 -13
CASA Ratio 51 51 50 1
ROA 0.7 1.3 1.3 -0.6
ROE 2.7 7.2 7.1 -4.5
BOPO 92 87 87 5
CIR 60 62 64 -4
NIM 4.4 4.4 4.2 0.2
NPL Gross 3.8 2.8 3.3 0.4
NPL Net 1.5 1.3 1.2 0.3
NPL Coverage ratio 118 133 164 -45
∆(in %) Sep-20 Dec-19 Sep-19
13
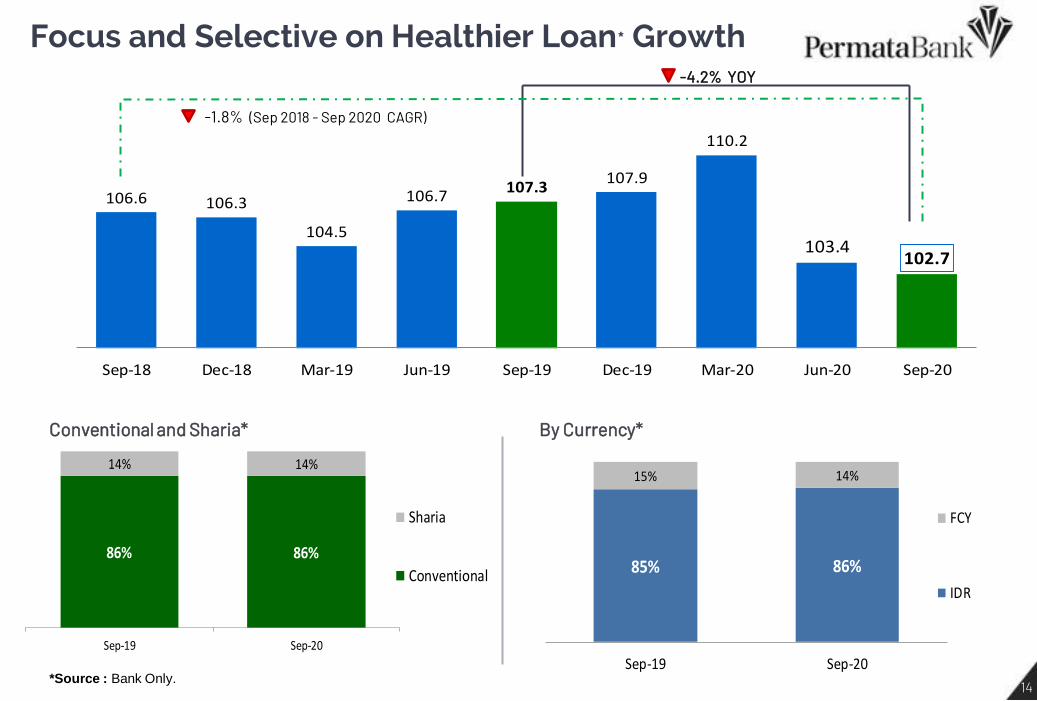
86% 86%
14% 14%
Sep-19 Sep-20
Sharia
Conventional
106.6 106.3
104.5
106.7107.3
107.9
110.2
103.4102.7
Sep-18 Dec-18 Mar-19 Jun-19 Sep-19 Dec-19 Mar-20 Jun-20 Sep-20
Focus and Selective on Healthier Loan* Growth
By Currency* Conventional and Sharia*
-4.2% YOY
-1.8% (Sep 2018 - Sep 2020 CAGR)
*Source : Bank Only.
85% 86%
15% 14%
Sep-19 Sep-20
FCY
IDR
14

164%
133%118%
168%
146% 145%
3.3%2.8%
3.8%
1.2% 1.3% 1.5%0.0%
2.0%
4.0%
6.0%
8.0%
10.0%
12.0%
14.0%
16.0%
18.0%
20.0%
0%
30%
60%
90%
120%
150%
180%
210%
240%
Sep-19 Des-19 Sep-20
NPL Coverage Ratio Regulatory Coverage Ratio
Gross NPL ratio Net NPL
4.6% 4.6%4.3%
4.8%4.4%
3.8% 3.6%3.3%
2.8%3.2%
3.7% 3.8%
1.7% 1.7% 1.5% 1.7% 1.7% 1.6%1.3% 1.2% 1.3% 1.2%
1.8%1.5%
0.0%
1.0%
2.0%
3.0%
4.0%
5.0%
6.0%
Dec-17 Mar-18 Jun-18 Sep-18 Dec-18 Mar-19 Jun-19 Sep-19 Dec-19 Mar-20 Jun-20 Sep-20
Gross NPL
Net NPL
Loan Quality Weakened due to COVID-19
Loan by Collectability (% to total Loan) NPL Coverage Ratio (%)
Source : Published and Management Report (Bank Only)
+48 bps YOY
89.4% 91.2% 90.8%
7.3% 6.0% 5.5%
3.3% 2.7% 3.8%
Sep-19 Des-19 Sep-20
NPL
Coll.2
Coll.1
15

Restructured Loan Progress due to COVID-19
As per Sep 2020, total incoming requests (exclude cancel request) is at IDR 11.9tn, of which 90% is already
approved, 3% still in process and 7% rejected.
11.6%
88.4%
Loan Restructured & Relaxation
Non-Restructured & Non-Relaxed Loan
47%
33%
20%
Wholesale Banking
Retail Banking (excl. SME)
SME
90%
3% 7%
Approved On Progress Rejected
Loan Affected by Covid-19
IDR 11.9 Trillion Request for Restructuring & Relaxation
or 11.6% of Total Loan – Sep 2020
Restructuring Progress
90% Approved, 7% Rejected, 3% On progress
Restructuring by Segment
47% WB, 33% RB, 20% SME
16

Growth Deposit, focus on CASA Deposit Composition (IDR Trillion)
By Currencies CASA Ratio (%)
1.3 % (YTD)
11.1% YOY
Source : Published and Management Report
0.10 bps (YOY)
• The third party funds balances increased
by 11.1% from Sep-19 to Sep-20, mainly
driven by the increase in CASA by 13.4%
YoY.
• PB’s deposit strategy is continuously
focusing on low cost and sustainable funds
(CASA).
• The CASA percentage is maintained stable
at 51% in Sep-20 in line with PB’s deposit
strategy and in order to contribute a stable
NIM%.
+13%
YOY Growth %
+9%
59.7 62.3 67.7
60.3 60.7 65.7
120.0 122.9 133.3
Sep-19 Dec-19 Sep-20
CASA Time Deposits
50
51 51
Sep-19 Dec-19 Sep-20
84% 85% 83%
16% 15% 17%
Sep-19 Dec-19 Sep-20
IDR Non IDR
17

Increasing NIM and Overall Yield
• NIM ratio is 4.4% or increased by 28bps compared to the position of Sep-19 which is at 4.2%. Despite the uncertain
economy condition due to COVID-19, the Bank still continuously improving its NIM.
• The increase in NIM was mostly due contributed by decrease in the interest expense due to Bank’s subordinated
bond (Tier-2 Capital) and increase in CASA composition during the year. Both caused the cost of funds decrease
faster while the loan interest yield is slower to adjust following by its repricing period due to the decrease of BI rate
Source : Published and Management Report (Bank Only)
7.9% 8.0% 8.3% 8.4% 8.4% 8.4%8.1% 7.9% 7.6%
4.3% 4.3%4.8% 4.7% 4.6% 4.6%
4.0% 3.9%
3.8%4.0% 4.1% 4.0% 4.2% 4.2% 4.4% 4.6% 4.5%
4.4%
0.0%
1.0%
2.0%
3.0%
4.0%
5.0%
6.0%
7.0%
8.0%
9.0%
10.0%
Sep-18 Dec-18 Mar-19 Jun-19 Sep-19 Dec-19 Mar-20 Jun-20 Sep-20
Yield of Interest Earning Assets Cost of Interest Bearing Liabilities NIM
18
541 291
97 180 87 155 74
1,425
686
278 106 152 94 102 136
1,553
-
400
800
1,200
1,600
2,000
Net Gain andincr. value on
Mktbl Securitiestrx, Spot and
Derivative trx.
Loan RelatedFees
Trade Finance Bancassurance Security AgencyServices &Investment
Services
Credit Card & E-Channel
Others Total NonInterest Income
Sep-19 Sep-20
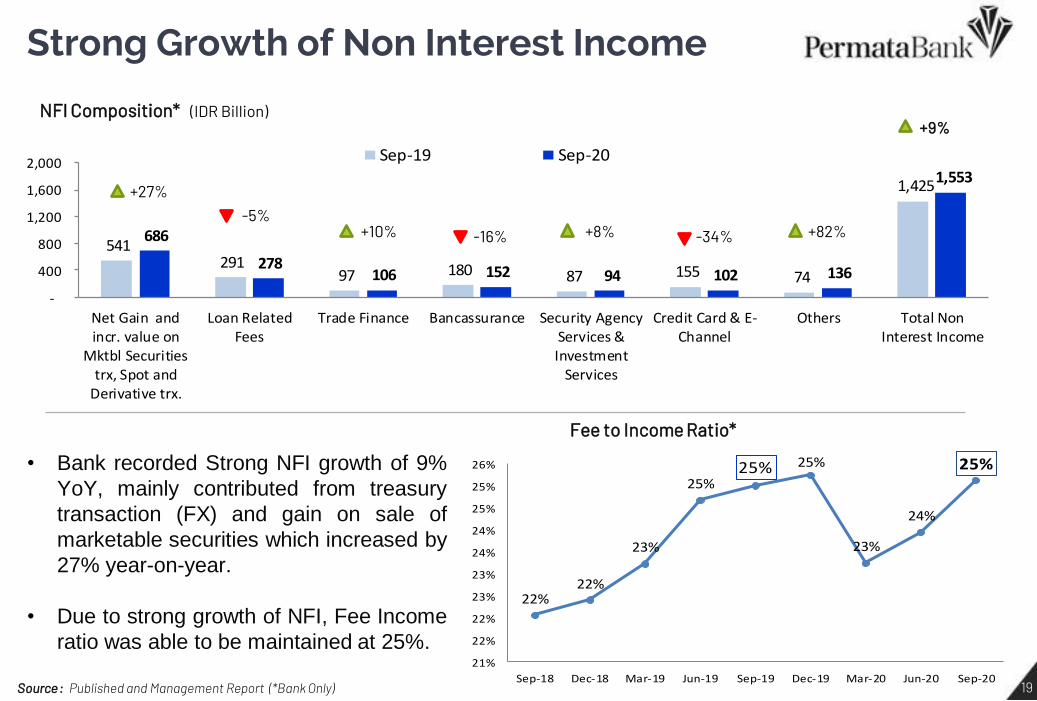
Strong Growth of Non Interest Income
NFI Composition* (IDR Billion)
Fee to Income Ratio*
+27% -5%
+10% -16% +82% -34%
+9%
+8%
Source : Published and Management Report (*Bank Only)
22%22%
23%
25%25% 25%
23%
24%
25%
21%
22%
22%
23%
23%
24%
24%
25%
25%
26%
Sep-18 Dec-18 Mar-19 Jun-19 Sep-19 Dec-19 Mar-20 Jun-20 Sep-20
• Bank recorded Strong NFI growth of 9%
YoY, mainly contributed from treasury
transaction (FX) and gain on sale of
marketable securities which increased by
27% year-on-year.
• Due to strong growth of NFI, Fee Income
ratio was able to be maintained at 25%.
19
1,764
114 260 163
1,279
3,581
1,953
56 238 309
1,086
3,642
Staff Cost Marketing &Promotion
InformationTechnology
Depreciation andamortization
Others Total OperatingExpenses
Sep-19 Sep-20
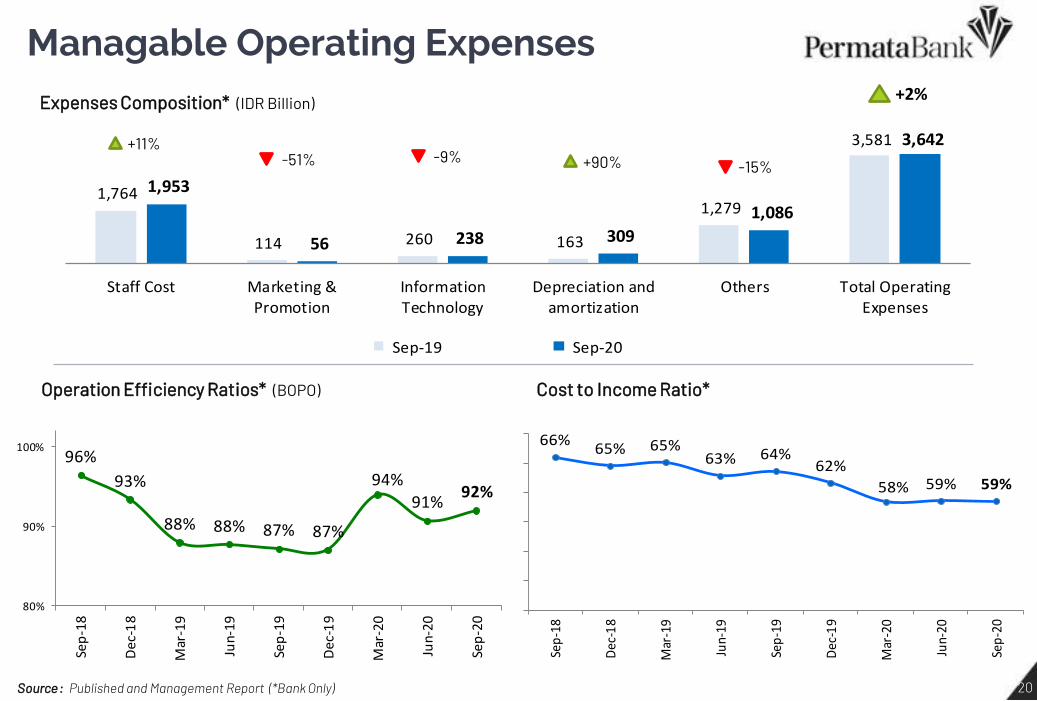
Managable Operating Expenses
Expenses Composition* (IDR Billion)
Operation Efficiency Ratios* (BOPO)
+11% -51% -15% +90% -9%
+2%
Cost to Income Ratio*
Source : Published and Management Report (*Bank Only)
96%
93%
88% 88% 87% 87%
94%
91%92%
80%
90%
100%
Sep
-18
De
c-1
8
Mar
-19
Jun
-19
Sep
-19
Dec
-19
Mar
-20
Jun
-20
Sep
-20
66%65% 65%
63% 64%62%
58% 59% 59%
40%
45%
50%
55%
60%
65%
70%
Sep
-18
Dec
-18
Mar
-19
Jun-
19
Sep
-19
Dec
-19
Mar
-20
Jun-
20
Sep
-20
20

20.5
18.6
20.2
1.30.0 0.3 0.2 0.0 0.1
Sep-19 RWA Profit DTA MTM AFS Fixed AssetReval
Others Sep-20
Capital Position Remain Strong
Risk Weighted Asset (IDR Billion)
-4,7 % YOY +1.9% YOY
CET-1 Ratio (%)
19.8 19.9 19.6 21.3 21.6
18.6 18.7 18.4 20.2
20.5
12.5 12.5 12.5
10.0 10.0
Sep-19 Dec-19 Mar-20 Jun-20 Sep-20
Total CAR CET1 Minimum Requirement (incl. Buffer)
(3,249)(1,561) (341)
115,361 110,211
-
-
Sep-19 Credit Risk Market Risk OperationalRisk
Sep-2021

Business Updates

Retail Banking Business Strategy In 2020, PermataBank will focus on development of Consumer Loan products
FOCUS ON THE GROWTH OF PUBLIC AND CONSUMER FINANCING
INCREASING NON-INTEREST INCOME (FEE BASED)
IMPROVE RETAIL BUSINESS SCALE THROUGH COLLABORATING WITH NEW BUSINESS PARTNERS
MAINTAIN GOOD GOVERNANCE AND BUILD STRONG RISK MANAGEMENT
DOING DIGITALIZATION OF THE PROCESS FOR EFFICIENCY AND PRODUCTIVITY
CONTINUALLY DEVELOPING DIGITAL SOLUTIONS FOR CONSUMER AND SME NEEDS
The retail business strategy will focus on growing the number of customers, increasing third party funds, financing MSMEs / SMEs, digital transformation positioned to increase market share.
23
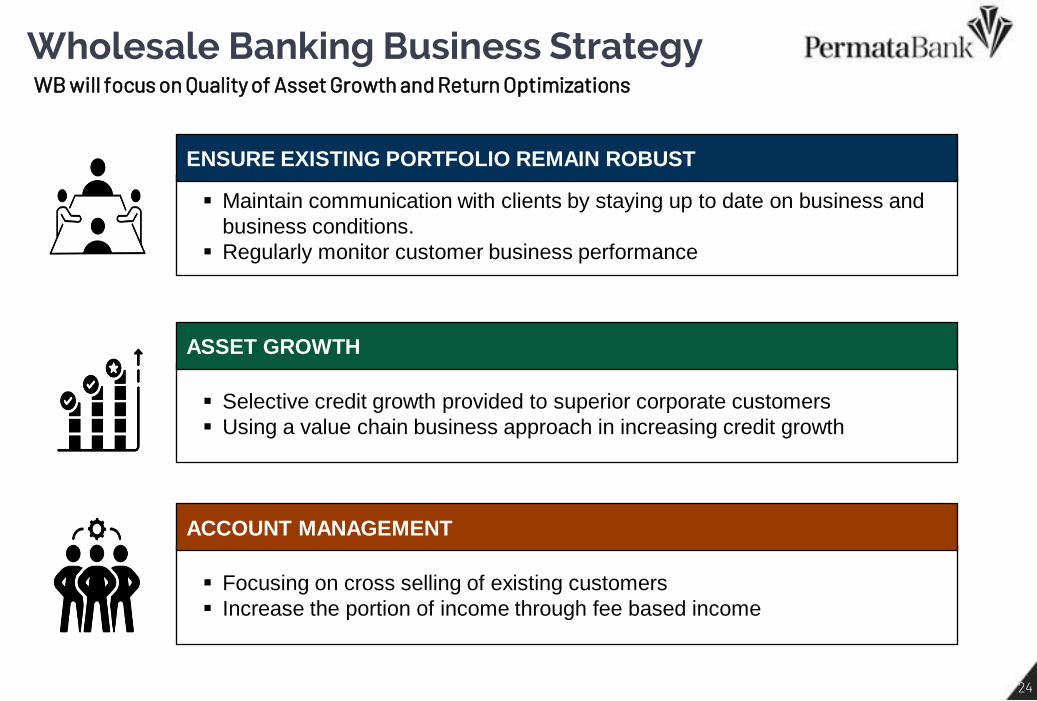
Wholesale Banking Business Strategy WB will focus on Quality of Asset Growth and Return Optimizations
Maintain communication with clients by staying up to date on business and
business conditions.
Regularly monitor customer business performance
ENSURE EXISTING PORTFOLIO REMAIN ROBUST
Selective credit growth provided to superior corporate customers
Using a value chain business approach in increasing credit growth
ASSET GROWTH
Focusing on cross selling of existing customers
Increase the portion of income through fee based income
ACCOUNT MANAGEMENT
24

Shariah Banking Business Strategy Key Achievements in 2020
25

We will continue to look at our data, draw insights,
identify area for improvement – experience,
stability, performance, new features, etc.
200+ FEATURES
PermataMobile X
LAUNCHED IN 2018
Permatabank.com
Designed to deliver experience that is consistent across all our digital platforms
LAUNCHED IN 2020
Permata Digital Branch
Version 1.23.1
Digital Banking Innovation Keep innovate and continuously improve to our customers
LAUNCHED IN 2019 26

PermataMobile X Powerful Digital Banking Platform
27
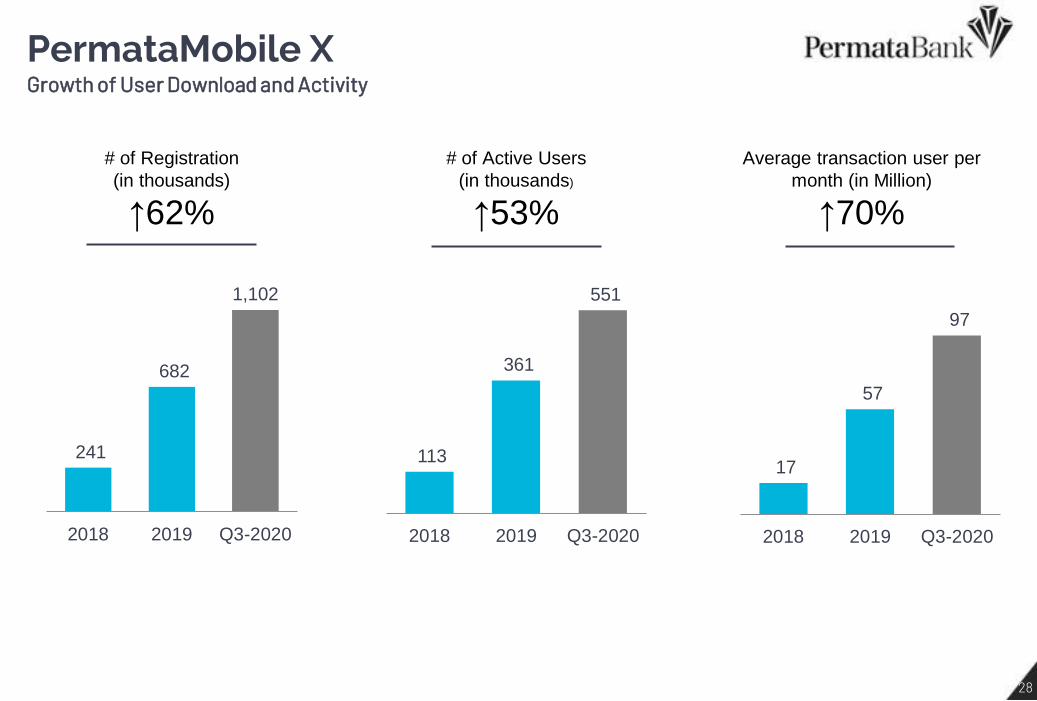
PermataMobile X Growth of User Download and Activity
Average transaction user per
month (in Million)
↑70%
# of Active Users
(in thousands)
↑53%
# of Registration
(in thousands)
↑62%
241
682
1,102
2018 2019 Q3-2020
113
361
551
2018 2019 Q3-2020
17
57
97
2018 2019 Q3-2020
28

Other Information

Board of Commissioner
Chartsiri Sophonpanich
President Commissioner
Chalit Tayjasanant
Commissioner
Chong Toh
Commissioner
Niramarn Laisathit
Commissioner
Haryanto Sahari
Independent Commissioner
Rahmat Waluyanto
Independent Commissioner
Goei Siauw Hong
Independent Commissioner
Yap Tjay Soen
Independent Commissioner
30

Board of Director
Ridha DM Wirakusumah
President Director
Dhien Tjahajani
Director
Lea Kusumawijaya
Director
Abdy Salimin
Director
Djumariah Tenteram
Director
Darwin Wibowo
Director
Herwin Bustaman
Director
Dayan sadikin
Director
31
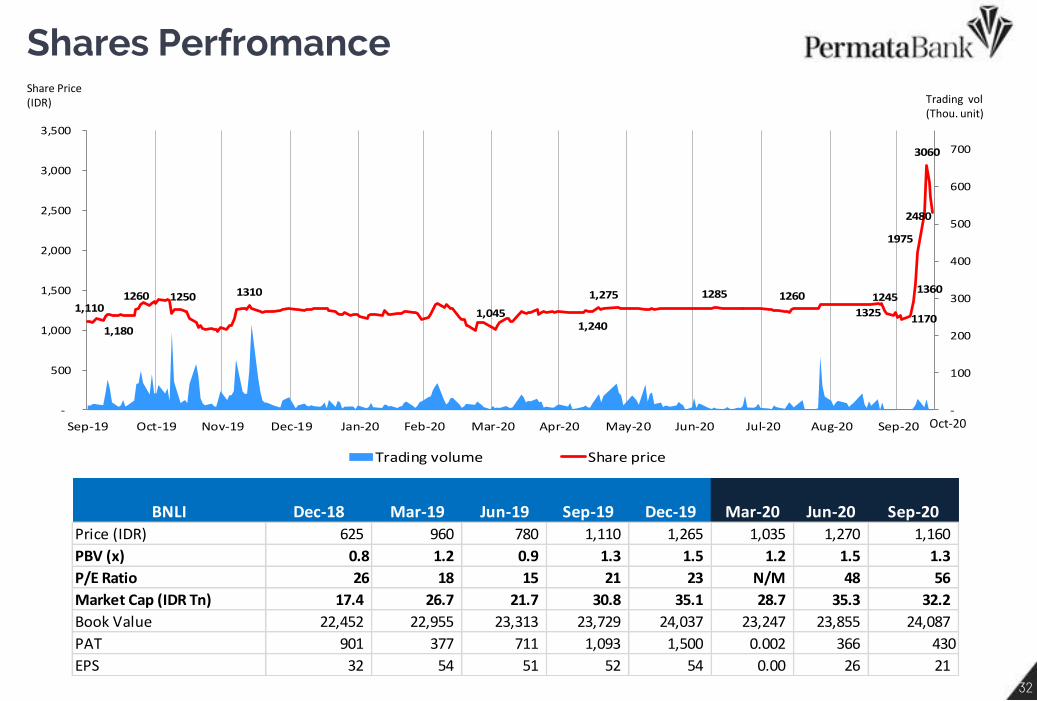
Shares Perfromance
1,110
1,180
1260 1250 1310
1,0451,240
1,275 1285 1260
1325
1245
1170
1360
1975
3060
2480
-
100
200
300
400
500
600
700
-
500
1,000
1,500
2,000
2,500
3,000
3,500
Sep-19 Oct-19 Nov-19 Dec-19 Jan-20 Feb-20 Mar-20 Apr-20 May-20 Jun-20 Jul-20 Aug-20 Sep-20
Trading volume Share price
Oct-20
Share Price (IDR) Trading vol
(Thou. unit)
BNLI Dec-18 Mar-19 Jun-19 Sep-19 Dec-19 Mar-20 Jun-20 Sep-20Price (IDR) 625 960 780 1,110 1,265 1,035 1,270 1,160
PBV (x) 0.8 1.2 0.9 1.3 1.5 1.2 1.5 1.3
P/E Ratio 26 18 15 21 23 N/M 48 56
Market Cap (IDR Tn) 17.4 26.7 21.7 30.8 35.1 28.7 35.3 32.2
Book Value 22,452 22,955 23,313 23,729 24,037 23,247 23,855 24,087
PAT 901 377 711 1,093 1,500 0.002 366 430
EPS 32 54 51 52 54 0.00 26 21
32
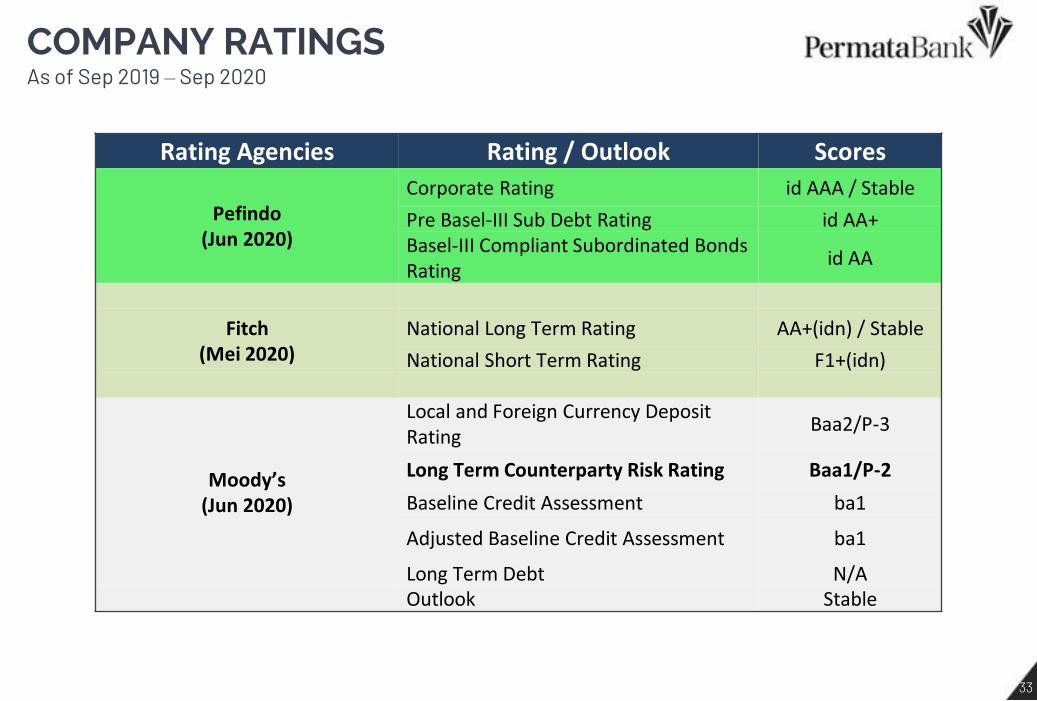
COMPANY RATINGS As of Sep 2019 – Sep 2020
Rating Agencies Rating / Outlook Scores
Pefindo (Jun 2020)
Corporate Rating id AAA / Stable
Pre Basel-III Sub Debt Rating id AA+ Basel-III Compliant Subordinated Bonds Rating
id AA
Fitch (Mei 2020)
National Long Term Rating AA+(idn) / Stable
National Short Term Rating F1+(idn)
Moody’s (Jun 2020)
Local and Foreign Currency Deposit Rating
Baa2/P-3
Long Term Counterparty Risk Rating Baa1/P-2
Baseline Credit Assessment ba1
Adjusted Baseline Credit Assessment ba1
Long Term Debt N/A Outlook Stable
33

Thank You! Investor Relations Unit World Trade Center II Jl. Jend. Sudirman Kav. 29-31 Jakarta 12920 - Indonesia Phone : (62-21) 523 - 7899 / 7999 Website : www.permatabank.com Email : [email protected]
Disclaimer: This report has been prepared by PT Bank Permata Tbk independently and is circulated for the purpose of general information only. It is not intended to the specific person who may
receive this report. The information in this report has been obtained from sources which we deem reliable. No warranty (expressed or implied) is made to the accuracy or completeness of the
information. All opinions and estimations included in this report constitute our judgment as of this date and are subject to change without prior notice.
We disclaim any responsibility or liability without prior notice of PT Bank Permata Tbk and/or their respective employees and/or agents whatsoever arising which may be brought against or suffered
by any person as a result of acting in reliance upon the whole or any part of the contents of this report and neither PT Bank Permata Tbk and/or its affiliated companies and/or their respective
employees and/or agents accepts liability for any errors, omissions, negligent or otherwise, in this report and any inaccuracy herein or omission here from which might otherwise arise.