july 24, 2017 - miraeasset.co.id · to subscribe to our daily focus, ... namun ini masih dalam...
TRANSCRIPT

Franky Rivan +62-21-515-1140 [email protected]
To subscribe to our Daily Focus, please contact us at [email protected]
Mirae Asset Sekuritas Indonesia
ASII’s 17F P/E range
Source: Mirae Asset Sekuritas Indonesia Research
Embun Pagi
July 24, 2017
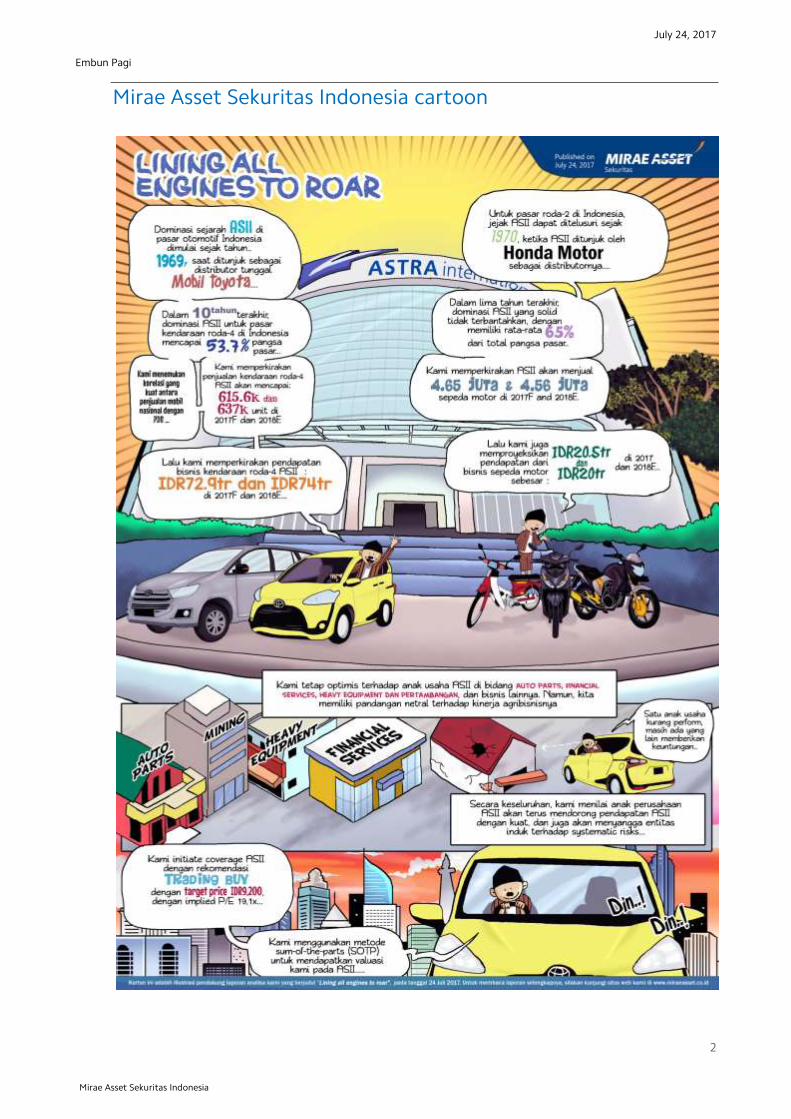
Astra International (ASII) Initiation: Lining all engines to roar
Steering dominance, irrefutable throne
Dalam sepuluh tahun terakhir, dominasi ASII di pasar 4W (mobil) Indonesia sangat
luar biasa, dengan rata-rata 53.7% pangsa pasar. Mengkorelasikan penjualan 4W
ASII dengan GDP, kami menemukan korelasi yang kuat sebesar 0.85, membuktikan
hubungan simetris antara penjualan 4W dengan GDP. Dengan menggunakan
metode regresi, kami memperkirakan penjualan 4W ASII akan mencapai 615.6k dan
637k unit pada 2017F dan 2018F. Karena itu, kami memperkirakan pendapatan
usaha bisnis 4W ASII masing-masing sebesar IDR72.9tr dan IDR74tr pada 2017F
dan 2018F.
Dalam lima tahun terakhir, dominasi ASII yang solid di pasar 2W (sepeda motor)
juga sangat luar biasa, dengan rata-rata 65% pangsa pasar. Dengan
mengkorelasikan penjualan 2W nasional dengan asumsi pangsa pasar ASII yang
terus kuat, kami memperkirakan ASII akan menjual 4.65 juta dan 4.56 juta unit 2W
pada 2017F dan 2018F. Dengan ini, kami juga memproyeksikan pendapatan usaha
bisnis 2W ASII masing-masing sebesar IDR20.5tr dan IDR20tr pada 2017 dan 2018F.
All engines ready to roar; Initiate with Trading Buy and TP of IDR9,200
Kami initiate coverage ASII dengan rekomendasi Trading Buy dan target harga 12
bulan ke depan sebesar IDR9,200, dengan implied forward P/E 19.7x. Kami
menggunakan metode sum-of-the-parts (SOTP) untuk menentukan valuasi ASII.
Kami percaya bahwa valuasi kami yang tinggi terhadap ASII dapat justified dengan
argumentasi sebagai berikut: 1) prospek penjualan 4W, 2W, dan alat berat di
Indonesia yang cerah, 2) posisi ASII sebagai pemimpin pasar di 4W, 2W, dan alat
berat yang tak terbantahkan dan tak tergantikan, 3) lini bisnis ASII yang
terdiversifikasi dengan baik akan buffer konglomerasi terhadap risiko sistematis,
dan 4) anak perusahaannya berkinerja baik, dan mereka akan terus mendorong
profitabilitas entitas induk.
Market Index
Last Trade Chg (%) MoM YoY
JCI 5,765.4 -1.0 -0.1 12.1
MSCI Indonesia 26.6 -1.9 -0.5 6.9
MSCI EM 1,060.2 0.1 4.7 21.9
HANG SENG 26,706.1 -0.1 4.2 21.7
KOSPI 2,450.1 -0.1 3.0 21.9
FTSE 7,452.9 -0.5 0.9 11.3
DJIA 21,580.1 -0.1 1.0 16.4
NASDAQ 6,387.8 0.0 2.0 25.3
Valuation
2017F P/E (x) P/B (x) ROE (%)
JCI 16.5 2.6 18.9
Key Rates
Last Trade Chg (bps) MoM YoY
BI 7-Day RR 4.75 0 0 -50*
3yr 6.73 -1 5 -10
10yr 6.93 -2 10 -14 *since introduced in Aug 2016
FX
Last Trade Chg (%) MoM YoY
USD/IDR 13,313.00 -0.2 0.1 1.8
USD/KRW 1,118.35 -0.6 -1.7 -1.6
USD/JPY 111.13 -0.7 -0.7 5.0
USD/CNY 6.77 0.1 -1.0 1.3
Commodities
Last Trade Chg (%) MoM YoY
WTI 45.8 -2.5 5.8 -7.7
Gold 1,255.0 0.8 0.8 -4.6
Coal 86.5 3.0 7.1 41.8
Palm Oil 2,612.0 0.1 -0.2 7.9
Rubber 137.8 0.0 -0.6 -12.4
Nickel 9,520.0 0.3 4.8 -8.5
Copper 6,004.0 0.8 3.5 22.0
Tin 20,185.0 -0.2 5.2 13.9
JCI Index VS MSCI Emerging Markets
650
800
950
1,100
3,500
4,500
5,500
07/13 07/14 07/15 07/16 07/17
JCI MSCI EM(pt)
(pt)
650
800
950
1,100
3,500
4,500
5,500
04/13 01/14 10/14 07/15 04/16
(pt) JCI MSCI EM (pt)
-1 Std Dev
Avg P/E
+1 Std Dev
-2 Std Dev
+2 Std Dev
10
12
14
16
18
20
22
24
7/12 7/13 7/14 7/15 7/16 7/17
( x )
July 24, 2017
2
Embun Pagi
Mirae Asset Sekuritas Indonesia
Mirae Asset Sekuritas Indonesia cartoon

July 24, 2017
3
Embun Pagi
Mirae Asset Sekuritas Indonesia
Local flashes
AISA: Tiga Pilar mengklaim ikuti aturan main beras kemasan. Manajemen PT Tiga
Pilar Sejahtera Food Tbk menginformasikan bahwa benar adanya PT Indo Beras Unggul
(IBU), anak perusahaanya diinspeksi oleh satuan tugas pangan yang berwenang. Saat
ini pihak manajemen masih melakukan koordinasi secara internal dan eksternal untuk
melakukan verifikasi semua fakta. Namun, perusahaan berkode saham AISA ini
mengklaim masih berpegang teguh pada kualitas produk yang dihasilkan dan menaati
ketentuan dan hukum yang berlaku. (Kontan)
ANTM: Aneka Tambang mulai ekspor bijih bauksit. PT Aneka Tambang (Persero) Tbk.
mulai mengapalkan bijih bauksit ke pasar ekspor usai memperoleh kuota sebanyak
850.000 ton pada tahun ini. Direktur Utama PT Aneka Tambang (Persero) Tbk. Arie
Prabowo Ariotedjo mengungkapkan perseroan sudah mulai melakukan ekspor bijih
bauksit sebanyak 110.000 ton.Perseroan, memperoleh kuota ekspor bauksit karena
telah memiliki fasilitas pengolahan bijih bauksit melalui proses chemical grade alumina
(CGA). (Bisnis Indonesia)
GPRA: Perdana Gapuraprima raih marketing sales Rp260 miliar. PT Perdana
Gapuraprima Tbk. (GPRA) mencatatkan marketing sales pada Juni 2017 senilai Rp260
miliar. Arvin F. Iskandar, Managing Director Gapuraprima, mengungkapkan raihan
marketing sales perseroan terbilang cukup bagus, atau mencapai 80% dari target pada
paruh pertama. Awalnya, GPRA memperkirakan realisasi marketing sales pada Juni
2017 bisa mencapai sekitar Rp300 miliar, atau setara 43% dari target perseroan tahun
ini yang sekitar Rp700 miliar. (Bisnis Indonesia)
WSBP: Produksi pecast WSBP pada Juni capai 864.165 ton. Korporasi beton PT
Waskita Beton Precast Tbk., memproduksi precast 864.165 ton sampai Juni 2017.
Perusahaan memperkirakan kapasitas produksi precast tersebut dapat mencapai 3,25
juta ton pada 2017 atau meningkat dibandingkan dengan 2,65 juta ton pada 2016.
Pada 2016, dari kapasitas produksi 2,65 juta ton, volume produksi precast yang
dibukukan oleh Waskita Beton Precast mencapai 1,56 juta ton. (Bisnis Indonesia)
MABA: Marga Abhinaya bidik pertumbuhan laba 30%. PT Marga Abhinaya Abadi Tbk
(MABA) melihat adanya potensi pertumbuhan tahun ini dari industri perhotelan. Untuk
itu, perusahaan akan menambah portofolio hotel. Adrian Bramantyo Musyanif Direktur
Utama MABA menyatakan, rencananya MABA akan membangun hotel bintang tiga di
Yogyakarta, dan hotel bintang lima di Medan. Kedua kota ini dinilai memiliki potensi
dan permintaan yang baik untuk perhotelan. (Kontan)
SIDO: SIDO bakal koreksi target pertumbuhan. PT Industri Jamu dan Farmasi Sido
Muncul Tbk (SIDO) tahun ini membidik penjualan sebesar Rp 2,94 triliun atau tumbuh
15% year on year (yoy). Namun nampaknya manajemen SIDO bakal merevisi target
tersebut. Direktur Keuangan SIDO Venancia Sri Indrijati bilang melihat kondisi ekonomi
saat ini ada kemungkinan untuk memangkas target pertumbuhan awal sebesar 15%.
Namun ini masih dalam tahap pembahsan manajemen, jadi belum ada angak
penurunanya. (Kontan)
BBNI: BNI targetkan volume kartu kredit tumbuh 15%. PT Bank Negara Indonesia Tbk
(BNI) menargetkan volume transaksi kartu kredit bisa meningkat akhir tahun ini.
Direktur Bisnis Konsumer BNI, Anggoro Eko Cahyo mengatakan, pertumbuhan volume
transaksi ditargetkan 15%. Dia mengatakan tidak memasang target untuk jumlah
nasabah. Hingga semester I 2017 BNI mencatatkan nilai transaksi kartu kredit Rp 19
triliun. Jumlah ini mengalami peningkatan 11% secara tahunan. (Detik Finance)
July 24, 2017
4
Embun Pagi
Mirae Asset Sekuritas Indonesia
Technical analysis Tasrul +62-21-515-1140 [email protected]
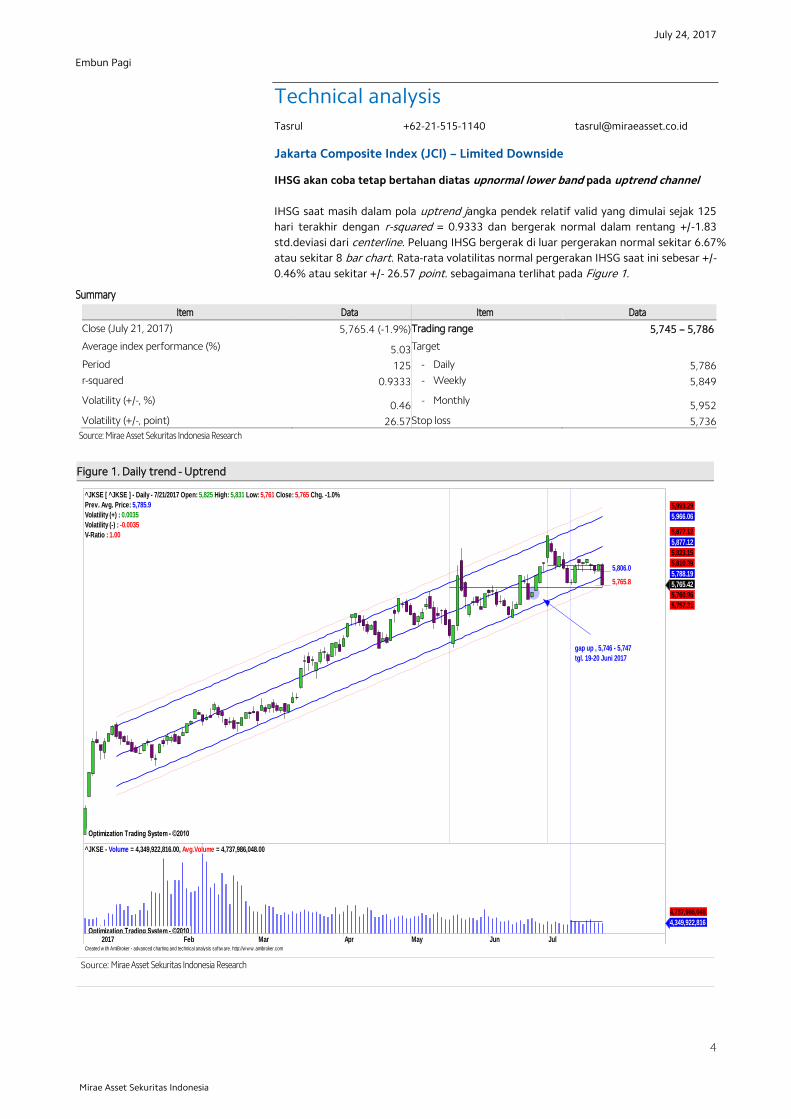
Jakarta Composite Index (JCI) – Limited Downside
IHSG akan coba tetap bertahan diatas upnormal lower band pada uptrend channel
IHSG saat masih dalam pola uptrend jangka pendek relatif valid yang dimulai sejak 125
hari terakhir dengan r-squared = 0.9333 dan bergerak normal dalam rentang +/-1.83
std.deviasi dari centerline. Peluang IHSG bergerak di luar pergerakan normal sekitar 6.67%
atau sekitar 8 bar chart. Rata-rata volatilitas normal pergerakan IHSG saat ini sebesar +/-
0.46% atau sekitar +/- 26.57 point. sebagaimana terlihat pada Figure 1.
Summary
Item Data Item Data
Close (July 21, 2017) 5,765.4 (-1.9%) Trading range 5,745 – 5,786
Average index performance (%) 5.03 Target
Period 125 - Daily 5,786
r-squared 0.9333 - Weekly 5,849
Volatility (+/-, %) 0.46 - Monthly 5,952
Volatility (+/-, point) 26.57 Stop loss 5,736
Source: Mirae Asset Sekuritas Indonesia Research
Figure 1. Daily trend - Uptrend
Source: Mirae Asset Sekuritas Indonesia Research
Created w ith AmiBroker - advanced charting and technical analysis softw are. http://w w w .amibroker.com
_____ 5,806.0
_____ 5,765.8
Optimization Trading System - ©2010 Optimization Trading System - ©2010 Optimization Trading System - ©2010 Optimization Trading System - ©2010 Optimization Trading System - ©2010
gap up , 5,746 - 5,747
tgl. 19-20 Juni 2017
^JKSE [ ^JKSE ] - Daily - 7/21/2017 Open: 5,825 High: 5,831 Low: 5,761 Close: 5,765 Chg. -1.0%
Prev. Avg. Price: 5,785.9
Volatility (+) : 0.0035
Volatility (-) : -0.0035
V-Ratio : 1.00
5,765.42
5,760.96
5,757.31
5,788.19
5,810.39
5,823.15
5,877.12
5,877.12
5,966.06
5,993.29
2017 Feb Mar Apr May Jun Jul Optimization Trading System - ©2010
^JKSE - Volume = 4,349,922,816.00, Avg.Volume = 4,737,986,048.00
4,349,922,816
4,737,986,048

July 24, 2017
5
Embun Pagi
Mirae Asset Sekuritas Indonesia
Aliran dana masukdan volatilitas pergerakkan indeks turun sudah terbatas.
Pada Figure 2, terlihat dari hasil optimalisasi terakhir pada periode daily terlihat
indikator MFI optimized masih cenderung naik meskipun saat ini indicator RSI optimized ,
indikator W%R optimized masih bergerak turun namun sudah mendekati support
trendline. Sementara itu pada Figure 3 pada periode weekly pergerakkan indikator MFI
Optimized dan indikator W%R optimized sudah berada di support trendline. Daily
resistance di 5,786 dan daily support di 5,745.Cut loss level di 5,736.
Figure 2. Daily MFI optimized ,W%R optimized & RSI optimized
Source: Mirae Asset Sekuritas Indonesia Research
Created w ith AmiBroker - advanced charting and technical analysis softw are. http://w w w .amibroker.com
^JKSE - MFI Smoothed = 47.34
47.3363
^JKSE - Will%R Smoothed = -77.78
-77.7779
^JKSE - RSI Smoothed = 25.90
25.9044
_____ 5,806.0
_____ 5,765.8
Optimization Trading System - ©2010 Optimization Trading System - ©2010 Optimization Trading System - ©2010
^JKSE [ ^JKSE ] - Daily - 7/21/2017 Open: 5,825 High: 5,831 Low: 5,761 Close: 5,765 Chg. -1.0%
Prev. Avg. Price: 5,785.9
Volatility (+) : 0.0035
Volatility (-) : -0.0035
V-Ratio : 1.00 5,765.42
5,757.31
5,810.39
5,823.15
27 Apr 10 17 25 May 8 15 22 29 Jun 12 19 Jul 10 17 Optimization Trading System - ©2010
^JKSE - Volume = 4,349,922,816.00, Avg.Volume = 4,737,986,048.00
4,349,922,816
4,737,986,048
July 24, 2017
6
Embun Pagi
Mirae Asset Sekuritas Indonesia
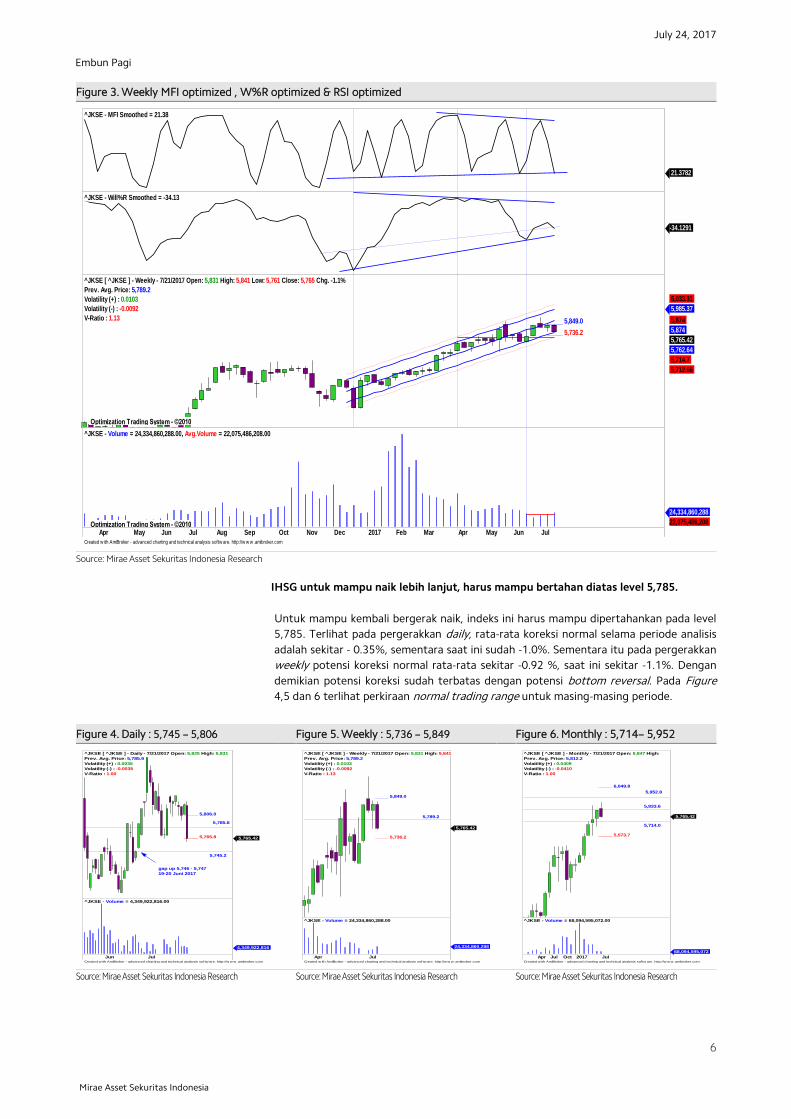
Figure 3. Weekly MFI optimized , W%R optimized & RSI optimized
Source: Mirae Asset Sekuritas Indonesia Research
IHSG untuk mampu naik lebih lanjut, harus mampu bertahan diatas level 5,785.
Untuk mampu kembali bergerak naik, indeks ini harus mampu dipertahankan pada level
5,785. Terlihat pada pergerakkan daily, rata-rata koreksi normal selama periode analisis
adalah sekitar - 0.35%, sementara saat ini sudah -1.0%. Sementara itu pada pergerakkan
weekly potensi koreksi normal rata-rata sekitar -0.92 %, saat ini sekitar -1.1%. Dengan
demikian potensi koreksi sudah terbatas dengan potensi bottom reversal. Pada Figure
4,5 dan 6 terlihat perkiraan normal trading range untuk masing-masing periode.
Figure 4. Daily : 5,745 – 5,806 Figure 5. Weekly : 5,736 – 5,849 Figure 6. Monthly : 5,714– 5,952
x
Source: Mirae Asset Sekuritas Indonesia Research
Source: Mirae Asset Sekuritas Indonesia Research
Source: Mirae Asset Sekuritas Indonesia Research
Created w ith AmiBroker - advanced charting and technical analysis softw are. http://w w w .amibroker.com
^JKSE - MFI Smoothed = 21.38
21.3782
^JKSE - Will%R Smoothed = -34.13
-34.1291
Optimization Trading System - ©2010
_____ 5,849.0
_____ 5,736.2
Optimization Trading System - ©2010 Optimization Trading System - ©2010
^JKSE [ ^JKSE ] - Weekly - 7/21/2017 Open: 5,831 High: 5,841 Low: 5,761 Close: 5,765 Chg. -1.1%
Prev. Avg. Price: 5,789.2
Volatility (+) : 0.0103
Volatility (-) : -0.0092
V-Ratio : 1.13
5,985.37
5,874
5,874
5,765.42
5,762.64
5,714.7
5,712.66
6,033.31
24Apr May Jun Jul Aug Sep Oct Nov Dec 2017 Feb Mar Apr May Jun 22Jul Optimization Trading System - ©2010
^JKSE - Volume = 24,334,860,288.00, Avg.Volume = 22,075,486,208.00
24,334,860,288
22,075,486,208
Created w ith AmiBroker - advanced charting and technical analysis softw are. http://w w w .amibroker.com
_____ 5,806.0
_____ 5,765.8
gap up 5,746 - 5,747
19-20 Juni 2017
5,745.2
5,785.6
^JKSE [ ^JKSE ] - Daily - 7/21/2017 Open: 5,825 High: 5,831
Prev. Avg. Price: 5,785.9
Volatility (+) : 0.0035
Volatility (-) : -0.0035
V-Ratio : 1.00
5,765.42
Jun Jul
^JKSE - Volume = 4,349,922,816.00
4,349,922,816
Created w ith AmiBroker - advanced charting and technical analysis softw are. http://w w w .amibroker.com
_____ 5,849.0
_____ 5,736.2
5,789.2
^JKSE [ ^JKSE ] - Weekly - 7/21/2017 Open: 5,831 High: 5,841
Prev. Avg. Price: 5,789.2
Volatility (+) : 0.0103
Volatility (-) : -0.0092
V-Ratio : 1.13
5,765.42
Apr Jul
^JKSE - Volume = 24,334,860,288.00
24,334,860,288
Created w ith AmiBroker - advanced charting and technical analysis softw are. http://w w w .amibroker.com
_____ 6,049.8
_____ 5,573.7
5,833.6
5,714.0
5,952.8
^JKSE [ ^JKSE ] - Monthly - 7/21/2017 Open: 5,847 High:
Prev. Avg. Price: 5,812.2
Volatility (+) : 0.0409
Volatility (-) : -0.0410
V-Ratio : 1.00
5,765.42
Apr Jul Oct 2017 Jul
^JKSE - Volume = 68,094,595,072.00
68,094,595,072
July 24, 2017
7
Embun Pagi
Mirae Asset Sekuritas Indonesia
Stocks on our focus list
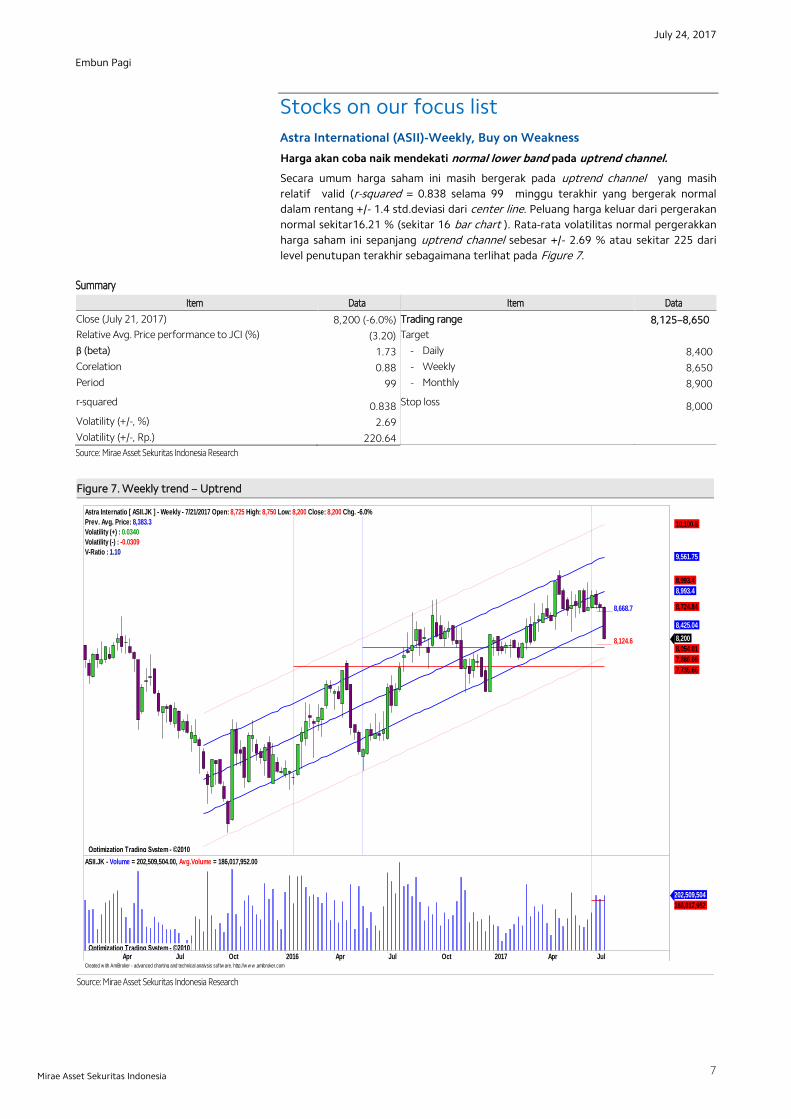
Astra International (ASII)-Weekly, Buy on Weakness
Harga akan coba naik mendekati normal lower band pada uptrend channel.
Secara umum harga saham ini masih bergerak pada uptrend channel yang masih
relatif valid (r-squared = 0.838 selama 99 minggu terakhir yang bergerak normal
dalam rentang +/- 1.4 std.deviasi dari center line. Peluang harga keluar dari pergerakan
normal sekitar16.21 % (sekitar 16 bar chart ). Rata-rata volatilitas normal pergerakkan
harga saham ini sepanjang uptrend channel sebesar +/- 2.69 % atau sekitar 225 dari
level penutupan terakhir sebagaimana terlihat pada Figure 7.
Summary
Item Data Item Data
Close (July 21, 2017) 8,200 (-6.0%) Trading range 8,125–8,650
Relative Avg. Price performance to JCI (%) (3.20) Target
β (beta) 1.73 - Daily 8,400
Corelation 0.88 - Weekly 8,650
Period 99 - Monthly 8,900
r-squared 0.838 Stop loss 8,000
Volatility (+/-, %) 2.69
Volatility (+/-, Rp.) 220.64
Source: Mirae Asset Sekuritas Indonesia Research
Figure 7. Weekly trend – Uptrend
Source: Mirae Asset Sekuritas Indonesia Research
Created w ith AmiBroker - advanced charting and technical analysis softw are. http://w w w .amibroker.com
_____ 8,668.7
_____ 8,124.6
Optimization Trading System - ©2010 Optimization Trading System - ©2010 Optimization Trading System - ©2010 Optimization Trading System - ©2010 Optimization Trading System - ©2010
Astra Internatio [ ASII.JK ] - Weekly - 7/21/2017 Open: 8,725 High: 8,750 Low: 8,200 Close: 8,200 Chg. -6.0%
Prev. Avg. Price: 8,383.3
Volatility (+) : 0.0340
Volatility (-) : -0.0309
V-Ratio : 1.10
8,200
8,054.01
7,886.05
7,735.66
8,425.04
8,724.84
8,993.4
8,993.4
9,561.75
10,100.8
Apr Jul Oct 2016 Apr Jul Oct 2017 Apr Jul Optimization Trading System - ©2010
ASII.JK - Volume = 202,509,504.00, Avg.Volume = 186,017,952.00
202,509,504
186,017,952
July 24, 2017
8
Embun Pagi
Mirae Asset Sekuritas Indonesia
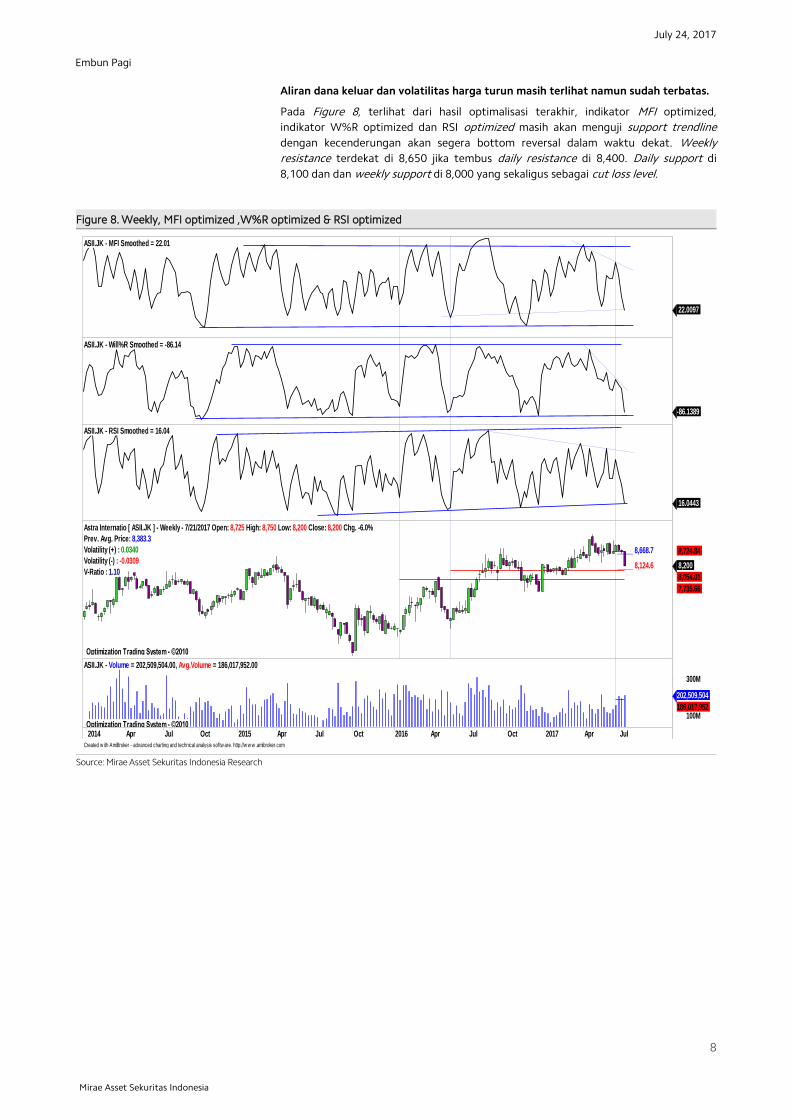
Aliran dana keluar dan volatilitas harga turun masih terlihat namun sudah terbatas.
Pada Figure 8, terlihat dari hasil optimalisasi terakhir, indikator MFI optimized,
indikator W%R optimized dan RSI optimized masih akan menguji support trendline
dengan kecenderungan akan segera bottom reversal dalam waktu dekat. Weekly
resistance terdekat di 8,650 jika tembus daily resistance di 8,400. Daily support di
8,100 dan dan weekly support di 8,000 yang sekaligus sebagai cut loss level.
Figure 8. Weekly, MFI optimized ,W%R optimized & RSI optimized
Source: Mirae Asset Sekuritas Indonesia Research
Created w ith AmiBroker - advanced charting and technical analysis softw are. http://w w w .amibroker.com
ASII.JK - MFI Smoothed = 22.01
22.0097
ASII.JK - Will%R Smoothed = -86.14
-86.1389
ASII.JK - RSI Smoothed = 16.04
16.0443
_____ 8,668.7
_____ 8,124.6
Optimization Trading System - ©2010 Optimization Trading System - ©2010 Optimization Trading System - ©2010
Astra Internatio [ ASII.JK ] - Weekly - 7/21/2017 Open: 8,725 High: 8,750 Low: 8,200 Close: 8,200 Chg. -6.0%
Prev. Avg. Price: 8,383.3
Volatility (+) : 0.0340
Volatility (-) : -0.0309
V-Ratio : 1.10 8,200
8,054.01
7,735.66
8,724.84
2014 Apr Jul Oct 2015 Apr Jul Oct 2016 Apr Jul Oct 2017 Apr Jul
100M
200M
300M
Optimization Trading System - ©2010
ASII.JK - Volume = 202,509,504.00, Avg.Volume = 186,017,952.00
202,509,504
186,017,952

July 24, 2017
9
Embun Pagi
Mirae Asset Sekuritas Indonesia
Harga akan coba naik dan bertahan diatas rata-rata pada masing-masing periode.
Untuk mampu naik lebih lanjut, harga saham saat ini harus mampu minimal bertahan
diatas rata-rata masing-masing periode (positive area) .Pada pergerakkan weekly terlihat
harga dalam minggu ini telah terkoreksi sekitar -6.0%, koreksi normal di level -3.09%.
Sementara itu pada pergerakkan daily harga telah terkoreksi -4.1 % normalnya hanya
sekitar- 1.29 %. Dengan demikian potensi koreksi mulai terbatas. Pada Figure 9,10 dan
11 terlihat perkiraan normal trading range untuk masing-masing periode.
Figure 9. Daily : 8,100 – 8,400 Figure 10. Weekly : 8,000 – 8,650 Figure 11. Monthly : 7,850 – 8,900
Source: Mirae Asset Sekuritas Indonesia Research
Source: Mirae Asset Sekuritas Indonesia Research
Source: Mirae Asset Sekuritas Indonesia Research
Created w ith AmiBroker - advanced charting and technical analysis softw are. http://w w w .amibroker.com
_____ 8,415.3
_____ 8,200.9
8,305.8
8,094.2
Astra Internatio [ ASII.JK ] - Daily - 7/21/2017 Open: 8,525
Prev. Avg. Price: 8,308.3
Volatility (+) : 0.0129
Volatility (-) : -0.0129
V-Ratio : 1.00
8,200
19 Jul 10 17
ASII.JK - Volume = 46,991,000.00
46,991,000
Created w ith AmiBroker - advanced charting and technical analysis softw are. http://w w w .amibroker.com
_____ 8,668.7
_____ 8,124.6
8,383.3
7,995.3
Astra Internatio [ ASII.JK ] - Weekly - 7/21/2017 Open: 8,725
Prev. Avg. Price: 8,383.3
Volatility (+) : 0.0340
Volatility (-) : -0.0309
V-Ratio : 1.10
8,200
Apr Jul
ASII.JK - Volume = 202,509,504.00
202,509,504
Created w ith AmiBroker - advanced charting and technical analysis softw are. http://w w w .amibroker.com
_____ 9,326.0
_____ 7,846.0
8,475.0
8,160.5
8,900.5
Astra Internatio [ ASII.JK ] - Monthly - 7/21/2017 Open:
Prev. Avg. Price: 8,475.0
Volatility (+) : 0.1004
Volatility (-) : -0.0742
V-Ratio : 1.35
8,200
Apr Jul Oct 2017 Jul
ASII.JK - Volume = 595,579,456.00
595,579,456
July 24, 2017
10
Embun Pagi
Mirae Asset Sekuritas Indonesia
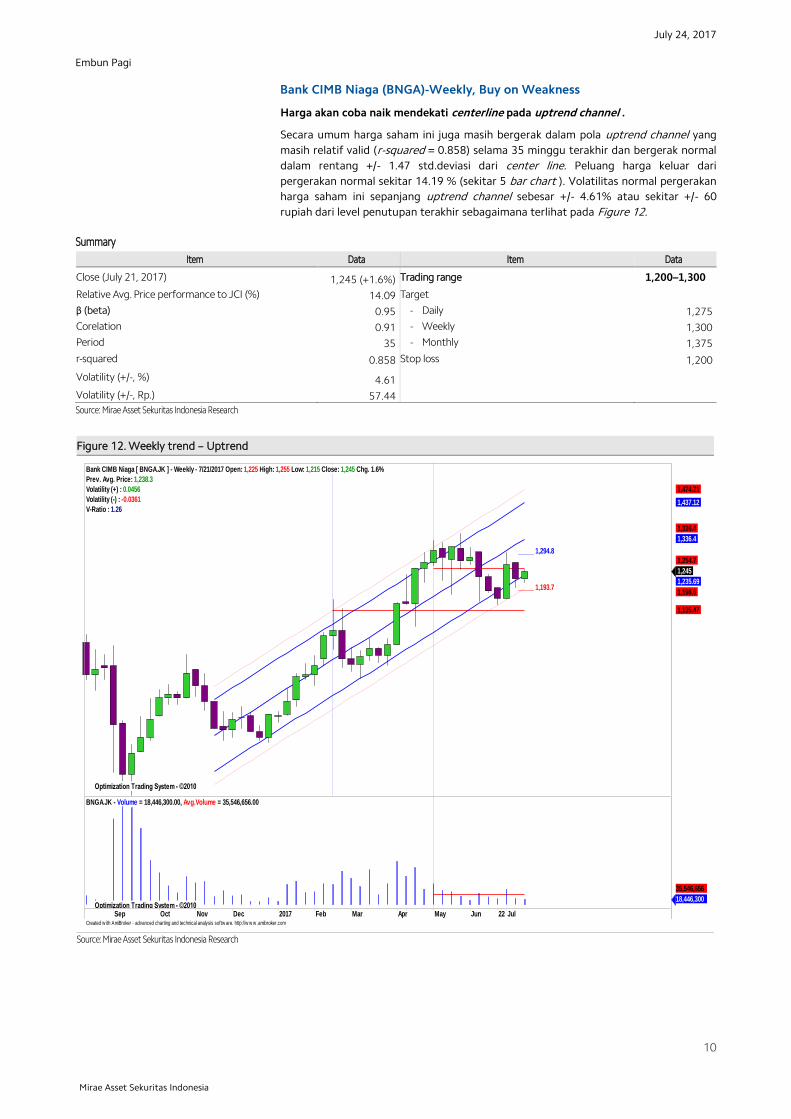
Bank CIMB Niaga (BNGA)-Weekly, Buy on Weakness
Harga akan coba naik mendekati centerline pada uptrend channel .
Secara umum harga saham ini juga masih bergerak dalam pola uptrend channel yang
masih relatif valid (r-squared = 0.858) selama 35 minggu terakhir dan bergerak normal
dalam rentang +/- 1.47 std.deviasi dari center line. Peluang harga keluar dari
pergerakan normal sekitar 14.19 % (sekitar 5 bar chart ). Volatilitas normal pergerakan
harga saham ini sepanjang uptrend channel sebesar +/- 4.61% atau sekitar +/- 60
rupiah dari level penutupan terakhir sebagaimana terlihat pada Figure 12.
Summary
Item Data Item Data
Close (July 21, 2017) 1,245 (+1.6%) Trading range 1,200–1,300
Relative Avg. Price performance to JCI (%) 14.09 Target
β (beta) 0.95 - Daily 1,275
Corelation 0.91 - Weekly 1,300
Period 35 - Monthly 1,375
r-squared 0.858 Stop loss 1,200
Volatility (+/-, %) 4.61
Volatility (+/-, Rp.) 57.44
Source: Mirae Asset Sekuritas Indonesia Research
Figure 12. Weekly trend – Uptrend
Source: Mirae Asset Sekuritas Indonesia Research
Created w ith AmiBroker - advanced charting and technical analysis softw are. http://w w w .amibroker.com
_____ 1,294.8
_____ 1,193.7
Optimization Trading System - ©2010 Optimization Trading System - ©2010 Optimization Trading System - ©2010 Optimization Trading System - ©2010
Bank CIMB Niaga [ BNGA.JK ] - Weekly - 7/21/2017 Open: 1,225 High: 1,255 Low: 1,215 Close: 1,245 Chg. 1.6%
Prev. Avg. Price: 1,238.3
Volatility (+) : 0.0456
Volatility (-) : -0.0361
V-Ratio : 1.26
1,245
1,235.69
1,198.6
1,135.47
1,254.7
1,336.4
1,336.4
1,437.12
1,474.21
Sep Oct Nov Dec 2017 Feb Mar Apr May Jun 22 Jul Optimization Trading System - ©2010
BNGA.JK - Volume = 18,446,300.00, Avg.Volume = 35,546,656.00
18,446,300
35,546,656

July 24, 2017
11
Embun Pagi
Mirae Asset Sekuritas Indonesia
Aliran dana masuk dan volatilitas harga naik masih terlihat.
Pada Figure 13, terlihat dari hasil optimalisasi indikator MFI optimized, W%R optimized
dan RSI optimized yang masih cenderung naik.Weekly resistance di 1,300 dengan
catatan daily resistance dapat ditembus di 1,275. Sementara itu weekly support di
1,200 dengan catatan daily support di 1,225 juga dapat ditembus.Cut loss level di
1,200.
Figure 13. Daily, MFI optimized , W&R optimized & RSI optimized
Source: Mirae Asset Sekuritas Indonesia Research
Created w ith AmiBroker - advanced charting and technical analysis softw are. http://w w w .amibroker.com
BNGA.JK - MFI Smoothed = 66.86
66.8579
BNGA.JK - Will%R Smoothed = -40.38
-40.3788
BNGA.JK - RSI Smoothed = 57.78
57.7825
_____ 1,294.8
_____ 1,193.7
Optimization Trading System - ©2010 Optimization Trading System - ©2010
Bank CIMB Niaga [ BNGA.JK ] - Weekly - 7/21/2017 Open: 1,225 High: 1,255 Low: 1,215 Close: 1,245 Chg. 1.6%
Prev. Avg. Price: 1,238.3
Volatility (+) : 0.0456
Volatility (-) : -0.0361
V-Ratio : 1.26 1,245
1,135.47
1,254.7
Sep Oct Nov Dec 23 2016 Feb Mar 24Apr May Jun Jul Aug Sep Oct Nov Dec 2017 Feb Mar Apr May Jun 22Jul Optimization Trading System - ©2010
BNGA.JK - Volume = 18,446,300.00, Avg.Volume = 35,546,656.00
18,446,300
35,546,656

July 24, 2017
12
Embun Pagi
Mirae Asset Sekuritas Indonesia
Harga saat ini akan coba naik dan bertahan diatas rata-rata pada masing-masing
periode.
Untuk mampu naik lebih lanjut, harga saham saat ini harus mampu minimal bertahan
diatas rata-rata masing-masing periode (positive area) . Jika dilihat lebih lanjut koreksi
normal pada pergerakkan daily sekitar -1.69%, saat ini di level -0.4% %. Sementara itu
pada pergerakkan weekly kenaikkan normal sekitar +4.56% %, saat ini baru sekitar
+1.6 %. Dengan demikian terlihat potensi kenaikkan lebih lanjut pada pergerakkan
weekly. Pada Figure 14,15 dan 16 terlihat perkiraan normal trading range untuk masing-
masing periode.
Figure 14. Daily : 1,225 – 1,275 Figure 15. Weekly : 1,200 – 1,300 Figure 16. Monthly : 1,150 – 1,375
x
Source: Mirae Asset Sekuritas Indonesia Research
Source: Mirae Asset Sekuritas Indonesia Research
Source: Mirae Asset Sekuritas Indonesia Research
Created w ith AmiBroker - advanced charting and technical analysis softw are. http://w w w .amibroker.com
_____ 1,267.2
_____ 1,219.1
1,240.0
1,272.3
1,224.0
Bank CIMB Niaga [ BNGA.JK ] - Daily - 7/21/2017 Open:
Prev. Avg. Price: 1,240.0
Volatility (+) : 0.0219
Volatility (-) : -0.0169
V-Ratio : 1.30
1,245
19 Jul 10 17
BNGA.JK - Volume = 2,870,800.00
2,870,800
Created w ith AmiBroker - advanced charting and technical analysis softw are. http://w w w .amibroker.com
_____ 1,294.8
_____ 1,193.7
1,238.3
Bank CIMB Niaga [ BNGA.JK ] - Weekly - 7/21/2017 Open:
Prev. Avg. Price: 1,238.3
Volatility (+) : 0.0456
Volatility (-) : -0.0361
V-Ratio : 1.26
1,245
Apr Jul
BNGA.JK - Volume = 18,446,300.00
18,446,300
Created w ith AmiBroker - advanced charting and technical analysis softw are. http://w w w .amibroker.com
_____ 1,382.4
_____ 1,144.8
1,238.3
Bank CIMB Niaga [ BNGA.JK ] - Monthly - 7/21/2017 Open:
Prev. Avg. Price: 1,238.3
Volatility (+) : 0.1164
Volatility (-) : -0.0756
V-Ratio : 1.54
1,245
Apr Jul Oct 2017 Jul
BNGA.JK - Volume = 95,252,688.00
95,252,688

July 24, 2017
13
Embun Pagi
Mirae Asset Sekuritas Indonesia
Bank Rakyat Indonesia (BBRI)-Weekly, Buy on Weakness
Harga akan coba naik mendekati centerline pada uptrend channel.
Secara umum harga saham ini akan mencoba naik mendekati centerline pada uptrend
channel yang masih relatif valid dengan r-squared = 0,913 selama 34 minggu terakhir
dan bergerak normal dalam rentang +/-1.71 std.deviasi dari centerline. Peluang harga
keluar dari pergerakan normalnya sekitar 8.72% (sekitar 3 bar chart ). Volatilitas normal
pergerakan harga saham ini sepanjang uptrend channel sebesar +/-2.46 atau sekitar +/-
360 dari level penutupan terakhir sebagaimana terlihat pada Figure 17.
Summary
Item Data Item Data
Close (July 21, 2017) 14,675 (-0.8%) Normal trading range 14,050-15,175
Relative Avg. Price performance to JCI (%) 12.20 Target
β (beta) 1.45 - Daily 14,825
Corelation 0.94 - Weekly 15,175
Period 34 - Monthly 15,575
r-squared 0.913 Stop loss 14,050
Volatility (+/-, %) 2.46
Volatility (+/-, Rp.) 360.76
Source: Mirae Asset Sekuritas Indonesia Research
Figure 17. Daily Trend – Uptrend
Source: Mirae Asset Sekuritas Indonesia Research
Created w ith AmiBroker - advanced charting and technical analysis softw are. http://w w w .amibroker.com
_____ 15,174.8
_____ 14,480.0
Optimization Trading System - ©2010 Optimization Trading System - ©2010 Optimization Trading System - ©2010 Optimization Trading System - ©2010
Bank Rakyat Indo [ BBRI.JK ] - Weekly - 7/21/2017 Open: 14,800 High: 15,000 Low: 14,650 Close: 14,675 Chg. -0.8%
Prev. Avg. Price: 14,775.0
Volatility (+) : 0.0271
Volatility (-) : -0.0200
V-Ratio : 1.36
14,675
14,302.7
14,058.6
14,988.2
15,003.6
15,003.6
15,673.6
24Apr May Jun Jul Aug Sep Oct Nov Dec 2017 Feb Mar Apr May Jun 22Jul Optimization Trading System - ©2010
BBRI.JK - Volume = 74,337,800.00, Avg.Volume = 97,539,000.00
74,337,800
97,539,000
July 24, 2017
14
Embun Pagi
Mirae Asset Sekuritas Indonesia
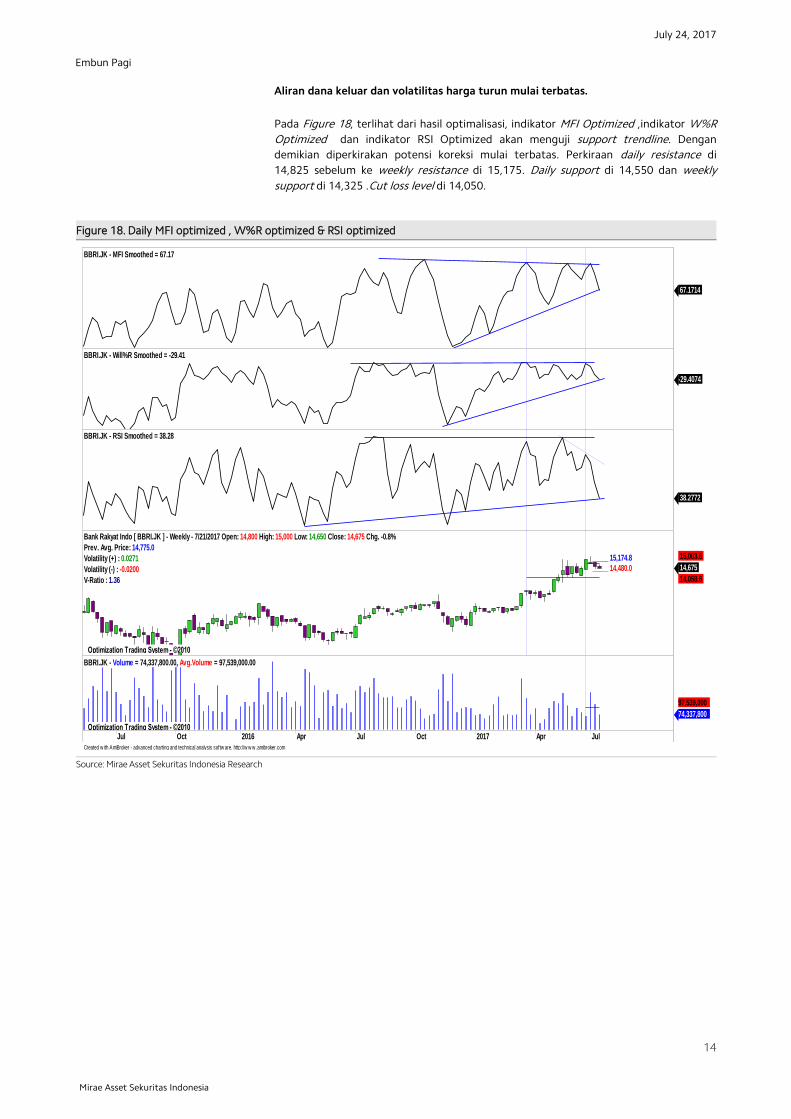
Aliran dana keluar dan volatilitas harga turun mulai terbatas.
Pada Figure 18, terlihat dari hasil optimalisasi, indikator MFI Optimized ,indikator W%R
Optimized dan indikator RSI Optimized akan menguji support trendline. Dengan
demikian diperkirakan potensi koreksi mulai terbatas. Perkiraan daily resistance di
14,825 sebelum ke weekly resistance di 15,175. Daily support di 14,550 dan weekly
support di 14,325 .Cut loss level di 14,050.
Figure 18. Daily MFI optimized , W%R optimized & RSI optimized
Source: Mirae Asset Sekuritas Indonesia Research
Created w ith AmiBroker - advanced charting and technical analysis softw are. http://w w w .amibroker.com
BBRI.JK - MFI Smoothed = 67.17
67.1714
BBRI.JK - Will%R Smoothed = -29.41
-29.4074
BBRI.JK - RSI Smoothed = 38.28
38.2772
_____ 15,174.8
_____ 14,480.0
Optimization Trading System - ©2010 Optimization Trading System - ©2010
Bank Rakyat Indo [ BBRI.JK ] - Weekly - 7/21/2017 Open: 14,800 High: 15,000 Low: 14,650 Close: 14,675 Chg. -0.8%
Prev. Avg. Price: 14,775.0
Volatility (+) : 0.0271
Volatility (-) : -0.0200
V-Ratio : 1.36
14,675
14,058.6
15,003.6
Jul Oct 2016 Apr Jul Oct 2017 Apr Jul Optimization Trading System - ©2010
BBRI.JK - Volume = 74,337,800.00, Avg.Volume = 97,539,000.00
74,337,800
97,539,000
July 24, 2017
15
Embun Pagi
Mirae Asset Sekuritas Indonesia
Relative Avg.Price Performance to JCI (%) : Persentase kenaikan harga saham dari rata-rata sejak IHSG memulai uptrend-nya β (beta) : Indikator sensitivitas harga saham terhadap IHSG, beta diatas 1 berarti harga makin sensitif terhadap pergerakan IHSG dan sebaliknya Correlation : Ukuran kuat hubungan (korelasi) pergerakan harga saham dibanding dengan pergerakan IHSG selama periode analisis. Period : Periode uptrend / downtrend yang valid dari pergerakan harga saham. r-squared : Koefisien determinasi, menunjukkan persentase gerakan yang dapat dijelaskan dengan regresi linier.Nilai R2 terletak antara 0 – 1, dan kecocokan model dikatakan lebih baik kalau R2 semakin mendekati 1 (validitas uptrend atau downtrend makin valid) Volatility (+/-%) : Besaran volatilitas normal maksimal/minimal dari pergerakan harga harian selama harga saham bergerak normal pada trend channel dalam persentase. Volatility (+/- point or Rp) : Besaran volatilitas normal maksimal/minimal dari pergerakan harga harian selama harga saham bergerak dalam periode analisis.
Buy: : Beli, harga sudah menyentuh atau jatuh di bawah support dan
indikator teknikal berada di oversold area.
Sell: : Jual, harga sudah menyentuh atau tembus resistance normal
dan indikator berada di overbought area.
BoW: : Buy on Weakness, beli ketika harga sudah melemah, dimana
Volume tekanan jual mulai berkurang dan harga mendekati
support, serta indikator teknikal sudah berada di oversold area.
SoS: : Sell on Strength, jual ketika kenaikan harga sudah mulai terbatas
dimana volume beli mulai berkurang dan harga mendekati
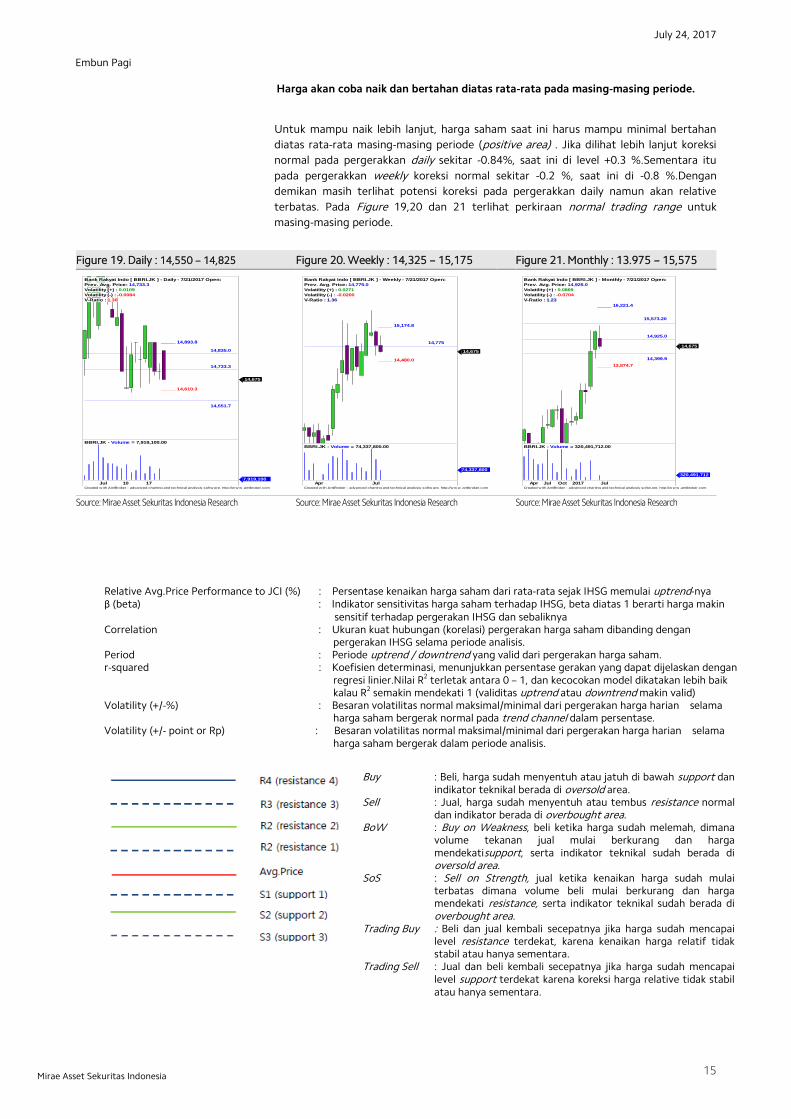
Harga akan coba naik dan bertahan diatas rata-rata pada masing-masing periode.
Untuk mampu naik lebih lanjut, harga saham saat ini harus mampu minimal bertahan
diatas rata-rata masing-masing periode (positive area) . Jika dilihat lebih lanjut koreksi
normal pada pergerakkan daily sekitar -0.84%, saat ini di level +0.3 %.Sementara itu
pada pergerakkan weekly koreksi normal sekitar -0.2 %, saat ini di -0.8 %.Dengan
demikan masih terlihat potensi koreksi pada pergerakkan daily namun akan relative
terbatas. Pada Figure 19,20 dan 21 terlihat perkiraan normal trading range untuk
masing-masing periode.
Figure 19. Daily : 14,550 – 14,825 Figure 20. Weekly : 14,325 – 15,175 Figure 21. Monthly : 13.975 – 15,575
Source: Mirae Asset Sekuritas Indonesia Research
Source: Mirae Asset Sekuritas Indonesia Research
Source: Mirae Asset Sekuritas Indonesia Research
Buy : Beli, harga sudah menyentuh atau jatuh di bawah support dan indikator teknikal berada di oversold area.
Sell : Jual, harga sudah menyentuh atau tembus resistance normal dan indikator berada di overbought area.
BoW : Buy on Weakness, beli ketika harga sudah melemah, dimana volume tekanan jual mulai berkurang dan harga mendekatisupport, serta indikator teknikal sudah berada di oversold area.
SoS : Sell on Strength, jual ketika kenaikan harga sudah mulai terbatas dimana volume beli mulai berkurang dan harga mendekati resistance, serta indikator teknikal sudah berada di overbought area.
Trading Buy : Beli dan jual kembali secepatnya jika harga sudah mencapai level resistance terdekat, karena kenaikan harga relatif tidak stabil atau hanya sementara.
Trading Sell : Jual dan beli kembali secepatnya jika harga sudah mencapai level support terdekat karena koreksi harga relative tidak stabil atau hanya sementara.
Created w ith AmiBroker - advanced charting and technical analysis softw are. http://w w w .amibroker.com
_____ 14,893.8
_____ 14,610.3
14,733.3
14,835.0
14,551.7
Bank Rakyat Indo [ BBRI.JK ] - Daily - 7/21/2017 Open:
Prev. Avg. Price: 14,733.3
Volatility (+) : 0.0109
Volatility (-) : -0.0084
V-Ratio : 1.30
14,675
Jul 10 17
BBRI.JK - Volume = 7,919,100.00
7,919,100
Created w ith AmiBroker - advanced charting and technical analysis softw are. http://w w w .amibroker.com
_____ 15,174.8
_____ 14,480.0
14,775
Bank Rakyat Indo [ BBRI.JK ] - Weekly - 7/21/2017 Open:
Prev. Avg. Price: 14,775.0
Volatility (+) : 0.0271
Volatility (-) : -0.0200
V-Ratio : 1.36
14,675
Apr Jul
BBRI.JK - Volume = 74,337,800.00
74,337,800
Created w ith AmiBroker - advanced charting and technical analysis softw are. http://w w w .amibroker.com
_____ 16,221.4
_____ 13,874.7
14,925.0
15,573.20
14,399.9
Bank Rakyat Indo [ BBRI.JK ] - Monthly - 7/21/2017 Open:
Prev. Avg. Price: 14,925.0
Volatility (+) : 0.0869
Volatility (-) : -0.0704
V-Ratio : 1.23
14,675
Apr Jul Oct 2017 Jul
BBRI.JK - Volume = 320,491,712.00
320,491,712
July 24, 2017
16
Embun Pagi
Mirae Asset Sekuritas Indonesia
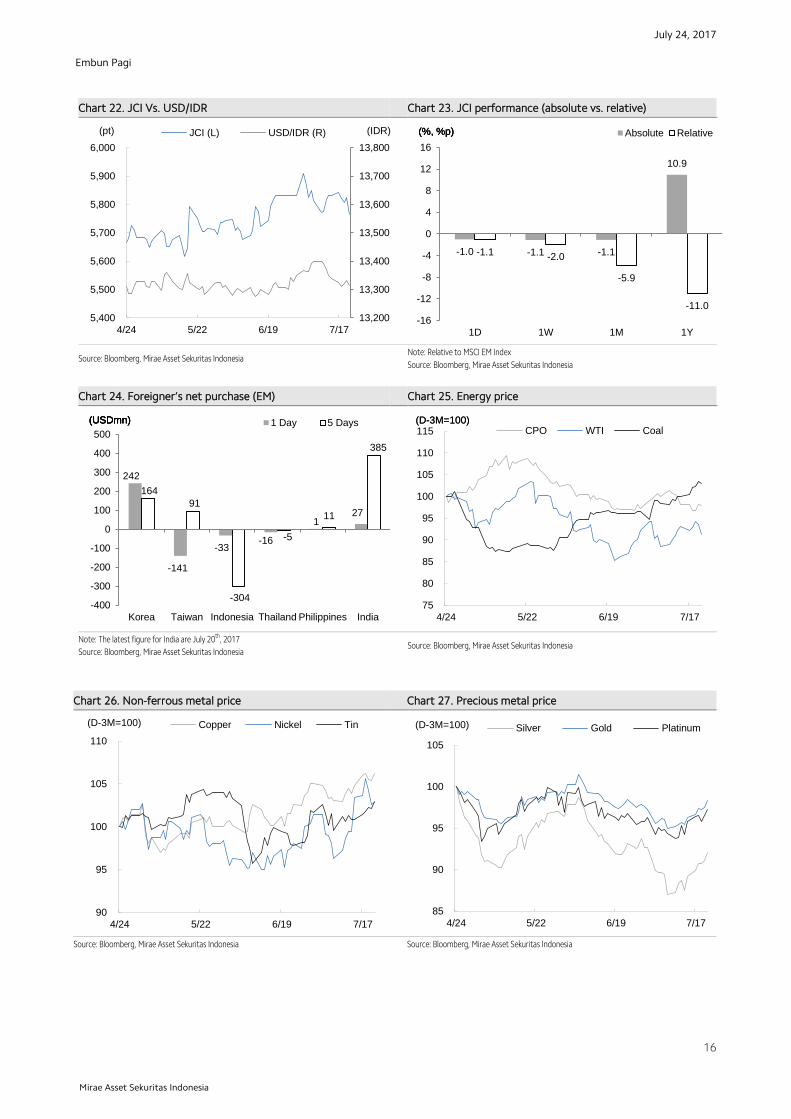
Chart 22. JCI Vs. USD/IDR Chart 23. JCI performance (absolute vs. relative)
Source: Bloomberg, Mirae Asset Sekuritas Indonesia Note: Relative to MSCI EM Index
Source: Bloomberg, Mirae Asset Sekuritas Indonesia
Chart 24. Foreigner’s net purchase (EM) Chart 25. Energy price
Note: The latest figure for India are July 20th, 2017
Source: Bloomberg, Mirae Asset Sekuritas Indonesia Source: Bloomberg, Mirae Asset Sekuritas Indonesia
Chart 26. Non-ferrous metal price Chart 27. Precious metal price
Source: Bloomberg, Mirae Asset Sekuritas Indonesia Source: Bloomberg, Mirae Asset Sekuritas Indonesia
13,200
13,300
13,400
13,500
13,600
13,700
13,800
5,400
5,500
5,600
5,700
5,800
5,900
6,000
4/24 5/22 6/19 7/17
(IDR) (pt) JCI (L) USD/IDR (R)
-1.0 -1.1 -1.1
10.9
-1.1 -2.0
-5.9
-11.0
-16
-12
-8
-4
0
4
8
12
16
1D 1W 1M 1Y
Absolute Relative(%, %p) (%, %p) (%, %p)
242
-141
-33 -16
1 27
164
91
-304
-5
11
385
-400
-300
-200
-100
0
100
200
300
400
500
Korea Taiwan Indonesia Thailand Philippines India
1 Day 5 Days (USDmn) (USDmn) (USDmn) (USDmn)
75
80
85
90
95
100
105
110
115
4/24 5/22 6/19 7/17
CPO WTI Coal(D-3M=100) (D-3M=100)
90
95
100
105
110
4/24 5/22 6/19 7/17
(D-3M=100) Copper Nickel Tin
85
90
95
100
105
4/24 5/22 6/19 7/17
Silver Gold Platinum(D-3M=100)
July 24, 2017
17
Embun Pagi
Mirae Asset Sekuritas Indonesia
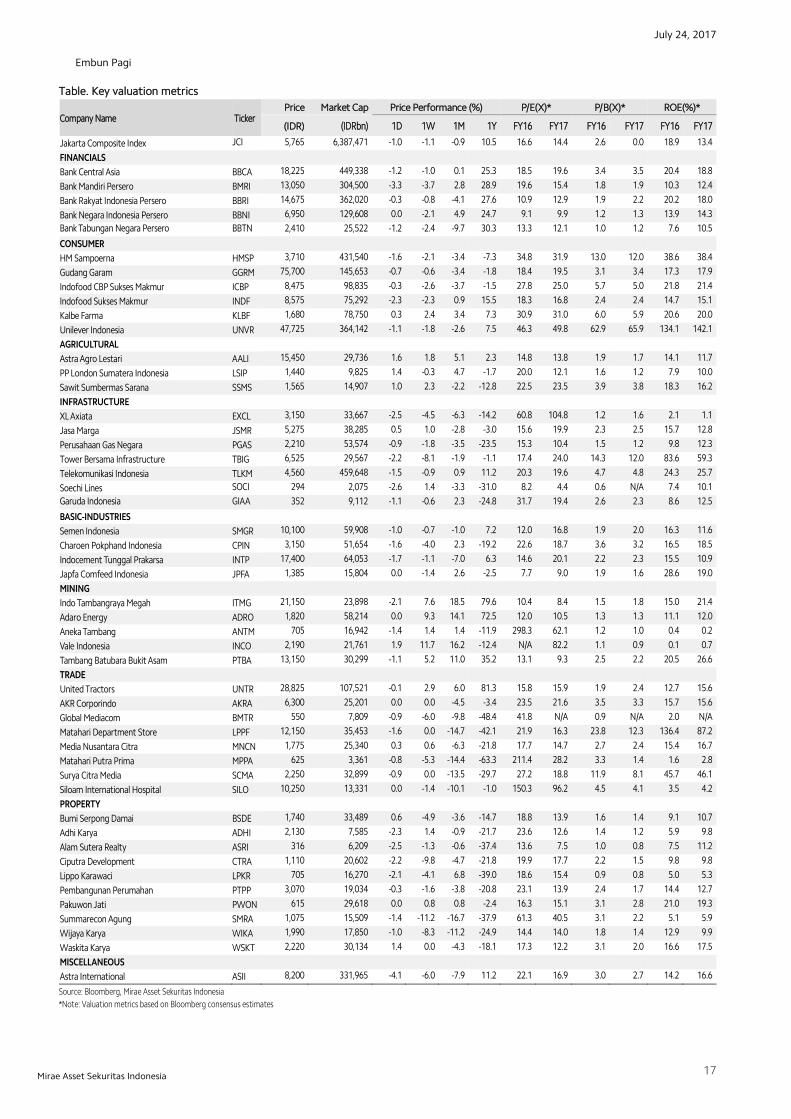
Table. Key valuation metrics
Company Name Ticker Price Market Cap Price Performance (%) P/E(X)* P/B(X)* ROE(%)*
(IDR) (IDRbn) 1D 1W 1M 1Y FY16 FY17 FY16 FY17 FY16 FY17
Jakarta Composite Index JCI 5,765 6,387,471 -1.0 -1.1 -0.9 10.5 16.6 14.4 2.6 0.0 18.9 13.4
FINANCIALS
Bank Central Asia BBCA 18,225 449,338 -1.2 -1.0 0.1 25.3 18.5 19.6 3.4 3.5 20.4 18.8
Bank Mandiri Persero BMRI 13,050 304,500 -3.3 -3.7 2.8 28.9 19.6 15.4 1.8 1.9 10.3 12.4
Bank Rakyat Indonesia Persero BBRI 14,675 362,020 -0.3 -0.8 -4.1 27.6 10.9 12.9 1.9 2.2 20.2 18.0
Bank Negara Indonesia Persero BBNI 6,950 129,608 0.0 -2.1 4.9 24.7 9.1 9.9 1.2 1.3 13.9 14.3
Bank Tabungan Negara Persero BBTN 2,410 25,522 -1.2 -2.4 -9.7 30.3 13.3 12.1 1.0 1.2 7.6 10.5
CONSUMER
HM Sampoerna HMSP 3,710 431,540 -1.6 -2.1 -3.4 -7.3 34.8 31.9 13.0 12.0 38.6 38.4
Gudang Garam GGRM 75,700 145,653 -0.7 -0.6 -3.4 -1.8 18.4 19.5 3.1 3.4 17.3 17.9
Indofood CBP Sukses Makmur ICBP 8,475 98,835 -0.3 -2.6 -3.7 -1.5 27.8 25.0 5.7 5.0 21.8 21.4
Indofood Sukses Makmur INDF 8,575 75,292 -2.3 -2.3 0.9 15.5 18.3 16.8 2.4 2.4 14.7 15.1
Kalbe Farma KLBF 1,680 78,750 0.3 2.4 3.4 7.3 30.9 31.0 6.0 5.9 20.6 20.0
Unilever Indonesia UNVR 47,725 364,142 -1.1 -1.8 -2.6 7.5 46.3 49.8 62.9 65.9 134.1 142.1
AGRICULTURAL
Astra Agro Lestari AALI 15,450 29,736 1.6 1.8 5.1 2.3 14.8 13.8 1.9 1.7 14.1 11.7
PP London Sumatera Indonesia LSIP 1,440 9,825 1.4 -0.3 4.7 -1.7 20.0 12.1 1.6 1.2 7.9 10.0
Sawit Sumbermas Sarana SSMS 1,565 14,907 1.0 2.3 -2.2 -12.8 22.5 23.5 3.9 3.8 18.3 16.2
INFRASTRUCTURE
XL Axiata EXCL 3,150 33,667 -2.5 -4.5 -6.3 -14.2 60.8 104.8 1.2 1.6 2.1 1.1
Jasa Marga JSMR 5,275 38,285 0.5 1.0 -2.8 -3.0 15.6 19.9 2.3 2.5 15.7 12.8
Perusahaan Gas Negara PGAS 2,210 53,574 -0.9 -1.8 -3.5 -23.5 15.3 10.4 1.5 1.2 9.8 12.3
Tower Bersama Infrastructure TBIG 6,525 29,567 -2.2 -8.1 -1.9 -1.1 17.4 24.0 14.3 12.0 83.6 59.3
Telekomunikasi Indonesia TLKM 4,560 459,648 -1.5 -0.9 0.9 11.2 20.3 19.6 4.7 4.8 24.3 25.7
Soechi Lines SOCI 294 2,075 -2.6 1.4 -3.3 -31.0 8.2 4.4 0.6 N/A 7.4 10.1
Garuda Indonesia GIAA 352 9,112 -1.1 -0.6 2.3 -24.8 31.7 19.4 2.6 2.3 8.6 12.5
BASIC-INDUSTRIES
Semen Indonesia SMGR 10,100 59,908 -1.0 -0.7 -1.0 7.2 12.0 16.8 1.9 2.0 16.3 11.6
Charoen Pokphand Indonesia CPIN 3,150 51,654 -1.6 -4.0 2.3 -19.2 22.6 18.7 3.6 3.2 16.5 18.5
Indocement Tunggal Prakarsa INTP 17,400 64,053 -1.7 -1.1 -7.0 6.3 14.6 20.1 2.2 2.3 15.5 10.9
Japfa Comfeed Indonesia JPFA 1,385 15,804 0.0 -1.4 2.6 -2.5 7.7 9.0 1.9 1.6 28.6 19.0
MINING
Indo Tambangraya Megah ITMG 21,150 23,898 -2.1 7.6 18.5 79.6 10.4 8.4 1.5 1.8 15.0 21.4
Adaro Energy ADRO 1,820 58,214 0.0 9.3 14.1 72.5 12.0 10.5 1.3 1.3 11.1 12.0
Aneka Tambang ANTM 705 16,942 -1.4 1.4 1.4 -11.9 298.3 62.1 1.2 1.0 0.4 0.2
Vale Indonesia INCO 2,190 21,761 1.9 11.7 16.2 -12.4 N/A 82.2 1.1 0.9 0.1 0.7
Tambang Batubara Bukit Asam PTBA 13,150 30,299 -1.1 5.2 11.0 35.2 13.1 9.3 2.5 2.2 20.5 26.6
TRADE
United Tractors UNTR 28,825 107,521 -0.1 2.9 6.0 81.3 15.8 15.9 1.9 2.4 12.7 15.6
AKR Corporindo AKRA 6,300 25,201 0.0 0.0 -4.5 -3.4 23.5 21.6 3.5 3.3 15.7 15.6
Global Mediacom BMTR 550 7,809 -0.9 -6.0 -9.8 -48.4 41.8 N/A 0.9 N/A 2.0 N/A
Matahari Department Store LPPF 12,150 35,453 -1.6 0.0 -14.7 -42.1 21.9 16.3 23.8 12.3 136.4 87.2
Media Nusantara Citra MNCN 1,775 25,340 0.3 0.6 -6.3 -21.8 17.7 14.7 2.7 2.4 15.4 16.7
Matahari Putra Prima MPPA 625 3,361 -0.8 -5.3 -14.4 -63.3 211.4 28.2 3.3 1.4 1.6 2.8
Surya Citra Media SCMA 2,250 32,899 -0.9 0.0 -13.5 -29.7 27.2 18.8 11.9 8.1 45.7 46.1
Siloam International Hospital SILO 10,250 13,331 0.0 -1.4 -10.1 -1.0 150.3 96.2 4.5 4.1 3.5 4.2
PROPERTY
Bumi Serpong Damai BSDE 1,740 33,489 0.6 -4.9 -3.6 -14.7 18.8 13.9 1.6 1.4 9.1 10.7
Adhi Karya ADHI 2,130 7,585 -2.3 1.4 -0.9 -21.7 23.6 12.6 1.4 1.2 5.9 9.8
Alam Sutera Realty ASRI 316 6,209 -2.5 -1.3 -0.6 -37.4 13.6 7.5 1.0 0.8 7.5 11.2
Ciputra Development CTRA 1,110 20,602 -2.2 -9.8 -4.7 -21.8 19.9 17.7 2.2 1.5 9.8 9.8
Lippo Karawaci LPKR 705 16,270 -2.1 -4.1 6.8 -39.0 18.6 15.4 0.9 0.8 5.0 5.3
Pembangunan Perumahan PTPP 3,070 19,034 -0.3 -1.6 -3.8 -20.8 23.1 13.9 2.4 1.7 14.4 12.7
Pakuwon Jati PWON 615 29,618 0.0 0.8 0.8 -2.4 16.3 15.1 3.1 2.8 21.0 19.3
Summarecon Agung SMRA 1,075 15,509 -1.4 -11.2 -16.7 -37.9 61.3 40.5 3.1 2.2 5.1 5.9
Wijaya Karya WIKA 1,990 17,850 -1.0 -8.3 -11.2 -24.9 14.4 14.0 1.8 1.4 12.9 9.9
Waskita Karya WSKT 2,220 30,134 1.4 0.0 -4.3 -18.1 17.3 12.2 3.1 2.0 16.6 17.5
MISCELLANEOUS
Astra International ASII 8,200 331,965 -4.1 -6.0 -7.9 11.2 22.1 16.9 3.0 2.7 14.2 16.6
Source: Bloomberg, Mirae Asset Sekuritas Indonesia
*Note: Valuation metrics based on Bloomberg consensus estimates

July 24, 2017
18
Embun Pagi
Mirae Asset Sekuritas Indonesia
Sector performance
Top 10 market cap performance
Name Index Chg (%) Ticker Price Market Cap (IDRbn) Chg (%)
Agricultural 1,793.1 0.2 HERO IJ 1200 5,020 10.60
Mining 1,466.8 -0.7
GEMS IJ 2300 13,529 4.55
Basic-Industry 618.1 -0.7 AUTO IJ 2580 12,435 1.98
Miscellaneous Industry 1,398.5 -3.4 INCO IJ 2190 21,761 1.86
Consumer Goods 2,489.2 -1.1 AALI IJ 15450 29,736 1.6
Property & Construction 483.1 -0.4
LSIP IJ 1440 9,825 1.41
Infrastructure 1,174.0 -1.2 WSKT IJ 2220 30,134 1.37
Finance 945.7 -1.2 SMBR IJ 3210 31,782 1.26
Trade 918.2 0.2 VIVA IJ 344 5,664 1.2
Composite 5,765.4 -1.0 SSMS IJ 1565 14,907 0.97 Source: Bloomberg
Top 5 leading movers Top 5 lagging movers
Name Chg (%) Close Name Chg (%) Close
MABA IJ 24.7 1,515 ASII IJ -4.1 8,200
MIKA IJ 3.6 2,000 BMRI IJ -3.3 13,050
LINK IJ 5.9 5,400 TLKM IJ -1.5 4,560
GEMS IJ 4.6 2,300 HMSP IJ -1.6 3,710
PADI IJ 14.7 390 BBCA IJ -1.2 18,225 Source: Bloomberg
Economic Calendar
Time Currency Detail Forecast Previous
7:30am JPY Flash Manufacturing PMI
52.4
2:00pm EUR French Flash Manufacturing PMI 54.8
2:00pm EUR French Flash Services PMI 56.9
2:30pm EUR German Flash Manufacturing PMI 59.6
2:30pm EUR German Flash Services PMI 54.0
3:00pm EUR Flash Manufacturing PMI 57.4
3:00pm EUR Flash Services PMI 55.4
Tentative EUR German Buba Monthly Report
7:30pm CAD Wholesale Sales m/m 1.0%
8:00pm CNY CB Leading Index m/m 1.3%
8:45pm USD Flash Manufacturing PMI 52.0
8:45pm USD Flash Services PMI 54.2
9:00pm USD Existing Home Sales 5.62M
Note: Time is based on Indonesian local time
Source: Forex Factory
Disclaimers
This report is prepared strictly for private circulation only to clients of PT Mirae Asset Sekuritas Indonesia (MASI). It is purposed only to person having
professional experience in matters relating to investments. The information contained in this report has been taken from sources which we deem reliable. No
warranty (express or implied) is made to the accuracy or completeness of the information. All opinions and estimates included in this report constitute our
judgments as of this date, without regards to its fairness, and are subject to change without notice. However, none of MASI and/or its affiliated companies
and/or their respective employees and/or agents makes any representation or warranty (express or implied) or accepts any responsibility or liability as to, or
in relation to, the accuracy or completeness of the information and opinions contained in this report or as to any information contained in this report or any
other such information or opinions remaining unchanged after the issue thereof. We expressly disclaim any responsibility or liability (express or implied) of
MASI, its affiliated companies and their respective employees and agents whatsoever and howsoever arising (including, without limitation for any claims,
proceedings, action, suits, losses, expenses, damages or costs) which may be brought against or suffered by any person as a results of acting in reliance upon
the whole or any part of the contents of this report and neither MASI, its affiliated companies or their respective employees or agents accepts liability for any
errors, omissions or misstatements, negligent or otherwise, in the report and any liability in respect of the report or any inaccuracy therein or omission there
from which might otherwise arise is hereby expresses disclaimed.
This document is not an offer to sell or a solicitation to buy any securities. This firms and its affiliates and their officers and employees may have a position,
make markets, act as principal or engage in transaction in securities or related investments of any company mentioned herein, may perform services for or
solicit business from any company mentioned herein, and may have acted upon or used any of the recommendations herein before they have been provided
to you. © PT Mirae Asset Sekuritas Indonesia 2016.