fat free mass index as parameter for nutritional status in
TRANSCRIPT
240 Med J IndonesKumala et al
Fat free mass index as parameter for nutritional status in non-dialysis chronic kidney disease patients stage 3, 4 and 5Meilani Kumala1, Widjaja Lukito2, Soemilah Sastroamidjojo3, Wiguno Prodjosudjadi4
Abstrak
Tujuan penelitian ini untuk memperoleh parameter komposisi tubuh yang dapat mendeteksi kecenderungan terjadinya MEP pada penderita PGKND. Penelitian dilakukan dengan rancangan potong lintang. Subyek penelitian terdiri dari 45 pasien PGKND dan 45 subyek sehat yang disepadankan jenis kelamin, usia, tinggi badan (TB) dan indeks massa tubuh (IMT). Status nutrisi dikelompokkan dalam status nutrisi kurang, normal dan lebih berdasarkan IMT, WHO, 1995. Secara antropometri massa bebas lemak (MBL), indeksMBL (IMBL), massa lemak (ML) dan persen ML pasien PGKND tidak berbeda bermakna dengan subyek sehat. Berdasarkan BIA didapatkan MBL, dan IMBL pasien PGKND lebih rendah bermakna dibandingkan subyek sehat (p < 0,05). Massa bebas lemak (MBL), IMBL dan ML pasien PGKND berbeda bermakna antara ketiga status nutrisi (p < 0,001). Nilai MBL, IMBL dan ML mempunyai linearitas dengan klasifikasi status nutrisi berdasarkan uji trend analysis. Massa bebas lemak, I-MBL, ML dan persen ML PGKND tidak berbeda bermakna di antara ketiga stadium PGK.Terdapat derajat kesesuaian yang baik antara IMBL dengan IMT untuk penilaian status nutrisi pasien PGKND. Dengan uji Receiver Operating Curve didapatkan titik potong IMBL sebesar 14,23 kg/m2 untuk membedakan status nutrisi kurang dan baik. Penelitian ini menunjukkan bahwa Indeks MBL dapat membedakan derajat status nutrisi pasien PGKND dan mempunyai korelasi dengan IMT. IndeksMBL dapat digunakan sebagai prediktor untuk skrining status nutrisi pasien PGKND. (Med J Indones 2008; 17: 240-7)
Abstract
The aim of this study is to obtain body composition parameters for early detection of PEM in non dialysis CKD (NDCKD) patients. The study was carried out using the cross sectional design. The subjects of the study consist of 45 NDCKD patients and 45 healthy subjects matched for age, gender, height and body mass index (BMI). The nutritional status of patients and healthy subjects were classified based on BMI (WHO, 1995) into low, normal and high nutritional status groups. Fat free mass (FFM), FFMindex (FFMI) and percentage of fat mass (FM percentage) in patients measured by anthropometric technique showed no significant difference with healthy subjects. Using the BIA method, FFM and FFM-I were significantly lower in the ND-CKD patients compared to the healthy subjects (p < 0,05). Significant difference in FFM, FFM-I, FM and FM percentage was observed between the patients with different nutritional status. (p < 0,001). Trend analysis statistical test showed that there is linear correlation of FFM, FFM-I and FM with nutritional status classification. FFM, FFM-I, FM and FM percentage in ND-CKD patients were not significantly different between the three stages of CKD. There was an acceptable degree of agreement between BMI with FFMI for nutritional assessment in NDCKD patients. The Receiver Operating Curve test showed the cut off points of FFMI 14.23 kg/m2 to differentiate undernutrition and normal nutritional status in NDCKD patients. This study showed FFMI has good correlation with BMI and can be used to differentiate degrees of nutritional status in stage 3, 4 and 5 NDCKD patients. FFMI considered predictor parameters for nutritional status screening in NDCKD patients. (Med J Indones 2008; 17: 240-7)
Keywords:: Non dialysis chronic kidney disease, protein energy malnutrition, body composition, fat free mass, fat free mass index
Protein energy malnutrition (PEM) is a condition which often observed in patients suffering from chronic kidney disease (CKD) who undergo hemodialysis therapy (CKD-D) or the conservative therapy that is non-hemodialysis (CKD-ND). Studies that has been performed on patient with chronic kidney disease showed that PEM prevalence reached 28% while patients at their end stage of CKD who will undergo hemodialysis
1 Department of Nutrition, Faculty of Medicine, Tarumanagara University, Jakarta, Indonesia
2 Regional Center For Community NutritionUniversity of Indonesia, SEAMEO TROPMED, Jakarta, Indonesia
3 Department of Nutrition, Faculty of Medicine, University of Indonesia, Jakarta, Indonesia
4 Department of Internal Medicine, Kidney and Hypertension Division. Faculty of Medicine, University of Indonesia, Jakarta, Indonesia
241Vol 17, No 4, October - December 2008 Parameter for nutritional status in non dialysis chronic kidney disease
therapy have PEM prevalence of 44-48 %.1 Protein energy malnutrition in CKD-ND patients has a strong corelation with decreased quality of life.2 In fact, the increase in morbidity can be one of strong predictors to survival of CKD-D patients in the future.1 Several methods of nutritional status assessment in CKD patients have been discovered, however, no optimum parameter was established.3 Visceral protein including albumin, transferrin and pre-albumin has been a biochemical parameter which often used as marker for PEM in CKD-D patients; lately, the validity of this marker was questionable. This was due to the con-centration of these visceral protein which can be affected by many different non-nutritional factors. 1,3
Previous studies showed that CKD patients suffer from protein energy malnutrition1 because many changes have occurred to their body composition, particularly the visceral and somatic protein.2,4 These changes in body composition supposedly resulted from many other factors including a decrease in nutritional intake which is due to anorexic effect of uremic toxin, metabolic acidosis (MA) and inflammation.5 Decreases in nutritional intake cause a decrease in visceral protein and insulin like growth factor-1 (IGF-1) which has anabolic character. Metabolic acidosis (MA) and inflammation in CKD-D patients suppressed protein synthesis in the body including the synthesis of visceral protein. Metabolic acidosis and inflammation also stimulate protein catabolism. As a result, somatic protein like reserved protein in muscle decreased and lowered the fat free mass (FFM).6
Research on somatic protein parameter as one method for nutritional status assessment on CKD patients has been carried out. However, the study was performed mostly on CKD-D patients and not many was done on CKD-ND patients.3,7 Based on this study results, further studies on CKD-ND is needed to evaluate nutritional status parameter which reflect the status of somatic protein. To date, somatic protein evaluation can be assessed with bioelectric impedance method, a non-invasive method which does not require active collaboration of patients and has high reproducibility.
METHODS
The current study has been approved by the Human Ethic Committee of the Faculty of Medicine of the University of Indonesia. All subjects participated in the
studies has approved their participation in the study by signing an informed consent.
This study is a cross sectional study where 45 CKD-ND patients were paired macthed with 45 healthy subjects for sex, age, body height and body mass index (BMI). Chronic kidney disease non hemodialysis patients were chosen by consecutive sampling of three different hospitals in Jakarta. They were Sumber Waras, PGI Cikini and Islam Jakarta hospitals. The selection criteria for CKD-ND patients were based on anamnesis, several laboratory tests including kidney function, glomerular filtration rate, and ultrasonography (USG) of CKD patients who were diagnosed to be in their 3rd, 4th and 5th stages of CKD and has not undergone hemo-dialysis therapy. Exclusions were applied to CKD patients who have fever, require blood transfusion, albumin infusion, as well as pregnant female CKD patients at the time of selection. CKD-ND patient obtained drug therapy according to the standard CKD and CKD related diseases. Healhty subjects (not CKD sufferer) were University of Tarumanagara and Sumber Waras hospital employees who have clinical, physical, and blood test results within the normal range. Healthy subjects who were involved in a strict diet program at the time of selection were excluded from the study. The duration of data collection for this study is 18 months.
In the current study, blood sample test on urea, creatinin, albumin, pre-albumin and transferrin level were carried out on the CKD-ND patients as well as healthy subjects according to standardized method used by Prodia laboratory.
Nutrition intake assessments were done by recording food intake in three consecutive days, starting on the day subjects agreed to participate in the study and signed an informed consent. Nutrition intake data was processed and calculated using Nutrisurvey 2004 programe. The calculated nutrition intake data for each subject consisted of average energy, protein, fat and carbohydrate intake.
Nutritional status assessments were performed using antropometric and body composition (BC) assessments. The antropometric evaluations include body height (BH) and body weight (BW) measurements. Body weight measurement was done using digital scale (Seca, Hamgurg-German) with scale accuracy up to 0.1 kg in standing position. In the current study, nutritional status can be classified based on body mass index (BMI). They were classification-1 (BMI-1), classification-II (BMI-II),

242 Med J IndonesKumala et al
classification-III (BMI-III) with BMI value of less than 18.49 kg/m2, 18.5-24.99 kg/m2 and 25-29.99 kg/m2 respectively.
Body composition measurements, were performed by field method, antropometric and bioelectric impedence analysis (BIA) method. Body composition measurements by antropometric method were done using mid upper arm circumference (MUAC) and subcutaneous fat in four different locations of the body (triceps, biceps, sub-scapula and supra-illiaca). using non elastic flexible plastic ribbon with a scale accuracy of 0.1 cm. Thickness of subcutaneous fat was measured using Holtain caliper (CMS weighing equipment, London, England) with scale accuracy of 0.2 mm. Mid upper arm circumference measurement results and the sum of four subcutaneous fat values were used to estimate fat mass (FM) and fat free mass (FFM).
Body composition assessment using bioelectric im-pedance analysis (BIA) was performed using multi frequency BIA (multi frequency, Human-Im Scan, Milano, Italy). Four hours prior to assessment, subjects were not allowed to eat and performed heavy activities. Body composition assessments by BIA were done on subjects in lying down on their back position on a bed with his or her two hands away from the body trunk and two legs apart. Electrodes were placed on the back of right hand palm and on the arm of the same hand. Body composition evaluation, in this study, used BIA at a frequency of 50 kHz were done in triplicate and followed by taking an average of these values to give the end result. Body composition evaluation using the BIA technique allow for estimation on total body water (TBW), intracellular water (ICW) as well as fat mass (FM) and fat free mass (FFM).
Data processing was carried out using Statistical Package for Social Sciences (SPSS) program version 11.5. In order to assess compatibility of age, body height and body mass index (BMI) on CKD-ND patients and healthy subjects pairs; and also to evaluate the difference in energy and macronutrient intake, biochemical data and body composition in CKD-ND patients and healthy subjects pairs, paired-t test were performed. ANOVA test was used to compare means between three or more variables. Correlation between variable were predicted using Pearson Correlation test. Statistical analysis using two different methods (agreement test of alternative methods)8 was performed to identify correlation between FFM-index (FFM-I) and BMI when evaluating the nutritional status. The level of significance was set at p<0.05.
RESULTS
Characteristics of CKD-ND patients and healthy volunteer subjects
CKD-ND patients and healthy volunteer subjects in this research study consisted of male [n=30, (66.7%)] and female [n=15, (33.3%)]. Age, body height and BMI in CKD-ND male and/or female patients showed no significance difference from the healthy subjects.
Table 1. Demographic data and biochemical characteristic of CKD-ND patients and healthy volunteer subjects
Variable CKD-ND patient
volunteer
Total subjects (person) Female/male (person)
4515/30
4515/30
Age (year) Total (n = 45) 48,2 ± 7.3 47,7 ± 6,2 Female 44,5 ± 7,6 44,9 ± 5,8
Male 50,1 ± 6,6 49,1 ± 5,9
Body height (cm)Total (n = 45) 159,4 ± 7,5 160,6 ± 7,6
Female 151,2 ± 3,3 152,7 ± 3,9 Male 163,1 ± 6,1 164,1 ± 6,5
Body mass index (kg/m2) Total (n = 45) 22,3 ± 3,4 22,5 ± 3,1
Female 22,3 ± 3,7 22,8 ± 3,2 Male 22,3 ± 3,3 22, 4 ± 3,1
GFR (mL/men/1,73 m2) 19,3 ± 1,7 91,6 ± 1,3LaboratoryAlbumin (g/dL) 3,8 (2,2 – 4,7) 4,4 (4,0 – 4,8)Prealbumin (mg/dL) 26,6 (8.4 – 45,1) 25,0 (13,3– 41,8)Transferrin (g/dL) 1,9 ± 0,6 2,5 ± 0,5
CKD-ND : Chronic kidney disease non hemodyalisis; GFR:glomerulus filtration rate; results are expressed as mean ± SD and median (minimum-maximum)
Table 1 showed that albumin serum concentration in CKD-ND patients has lower value than those in healhty subjects. Of the 45 CKD-ND patients, 25 subjects (55.5%) have an albumin serum concentration within the normal range (3.5g/dL-4.5g/dL), 17 subjects (37.8%) have albumin serum concentrations of less than 3.5g/dL and three other subjects have an albumin concentration of more than 4.5g/dL. Healthy subjects, in the current study, did not have albumin serum concentration of less than 3.5g/dL. Transferrin concentration of the CKD-ND patients, in this study, also has lower value when compared to the healthy subjects. The pre-albumin concentrations in CKD-ND patients were higher than that in the healthy subjects even though they were not different statistically.

243Vol 17, No 4, October - December 2008 Parameter for nutritional status in non dialysis chronic kidney disease
Characteristics of CKD-ND patients based on BMI and the stages of CKD
Of the 45 CKD-ND patients, 7 subjects (15.6%) were found to be in BMI-I classification, 28 subjects (62.2%) were in BMI-II group and 10 subjects (22.2%) fall into BMI-III classification. In each of these BMI classifications, biochemical characteristics of the CKD-ND patients were different. Results of the study demonstrated that there were no significant differences in GFR, albumin and pre-albumin serum concentration between the three BMI classification groups of the CKD-ND patients. Urea, creatinin and transferrin concentrations did not show same trend as the ascending or descending trend of BMI classification.
Based on the stages of CKD, this study showed that 13 subjects (28.9%) were in the third stage, 17 subjects (37.8%) were in the fourth stage and 15 subjects (33.3%) were in the fifth stage. In this study, BMI and concentrations of albumin, pre-albumin and transferrin showed no significant difference with ascending stages of CKD.
Nutritional Intake of CKD-ND patients and healthy subjects
Energy (E), protein (P), fat (F) and carbohydrate (CH) intake of CKD-ND patients were significantly lower than those of healhty subjects. If protein intake, based on daily food intake analysis, were divided by body weight, a mean value of protein intake in healthy subjects was calculated to be 0.8g/kgBW/day and the mean of protein intake of CKD-ND patients were 0.6g/kgBW/day. In order to determine whether energy intake of subjects participated in the study was sufficient, ratio of energy intake values and resting energy expenditure (REE) of each subject was calculated using Harris Benedict formula (% E/REE). From this calculation, % E/REE in CKD-ND patients were significantly lower than healthy subjects. From total CKD-ND patients, there were 35 (77.8%) CKD-ND patients has energy intake of less than or equal to 100% (</= 100%) from REE, while in healthy healhty subjects, only 19 subjects (42.2%) has an energy intake of less than or equal to 100% from REE.
Body composition of CKD-ND patients and healhty subjects
Table 2 indicated that the mean of FFM, FFM-I, FM and % FM based on antropometric measurement in
CKD-ND was not significantly different compared to healthy subjects. However, based on BIA, the mean of FFM and FFM-I of CKD-ND patients were significantly lower than those in healthy subjects while % FM of CKD-ND patients were significantly higher than those in healthy subjects. Fat mass of CKD-ND patients were not significantly different from healhty subject in this study.
Table 2. Body composition of CKD-ND patients and healhty subjects based on antropometric and bioelectric impedance analysis (BIA)
Variable CKD-ND patients
Healhty p
( n = 45) ( n = 45)
Anthropometric
FFM (kg) 41,4 ± 7,1 42,5 ± 7,1 NSFFM-I (kg/m2) 16,2 ± 1,7 16,4 ± 1,7 NSFM (kg) 15,4 ± 6,0 16,1 ± 6,1 NSFM persentage (%) 26,5 ± 7,2 26,8 ± 7,9 NS
Bioelectric impedance analysis (BIA)FFM (kg) 42,0 ± 8,1 44,0 ± 7,6 0,004FFM-I (kg/m2) 16,5 ± 2,2 16,9 ± 1,6 0,022FM (kg) 15,0 ± 5,5 14,4 ± 5,3 NSFM percentage (%) 25,9 ± 7,2 24,2 ± 6,5 0,036TBW (kg) 32.7 ± 5.7 34.7 ± 5.3 0,003TBW/FFM (%) 78,3 ± 6,6 79,2 ± 5,2 NSECW (kg) 13,8 ± 2,3 14,6 ± 1,9 0,007ECW percentage (%) 42,4 ± 3,1 42,3 ± 2,6 NS
CKD-ND: chronic kidney disease-non hemodialysis; FFM: fat free mass (kg); FFM-I: fat free mass index;FM: fat mass; %FM: fat mass percentage, FM/BW*100%; TBF: total body water; ESW (kg): extracellular water; % ESF: ESW/TBW*100%; statistical test used was paired-t test; NS: not significantly different.
The antropometric method was unable to measure total body water volume, this is the reason for using BIA to measure the total body water and its components on subjects involved in this study. The current study result demonstrated that total body water (TBW) and extracellular water (ECW) of CKD-ND patients was significantly lower than those in healthy subjects, although, the ratio of TBW/FFM and ECW/TBW of CKD-ND patients did not differ from the healthy subjects. Based on stages of CKD, no difference between FFM, FFM-I, FM and ECW/TBW (hydration status) were observed between the three groups of CKD stages (Table 3).
244 Med J IndonesKumala et al
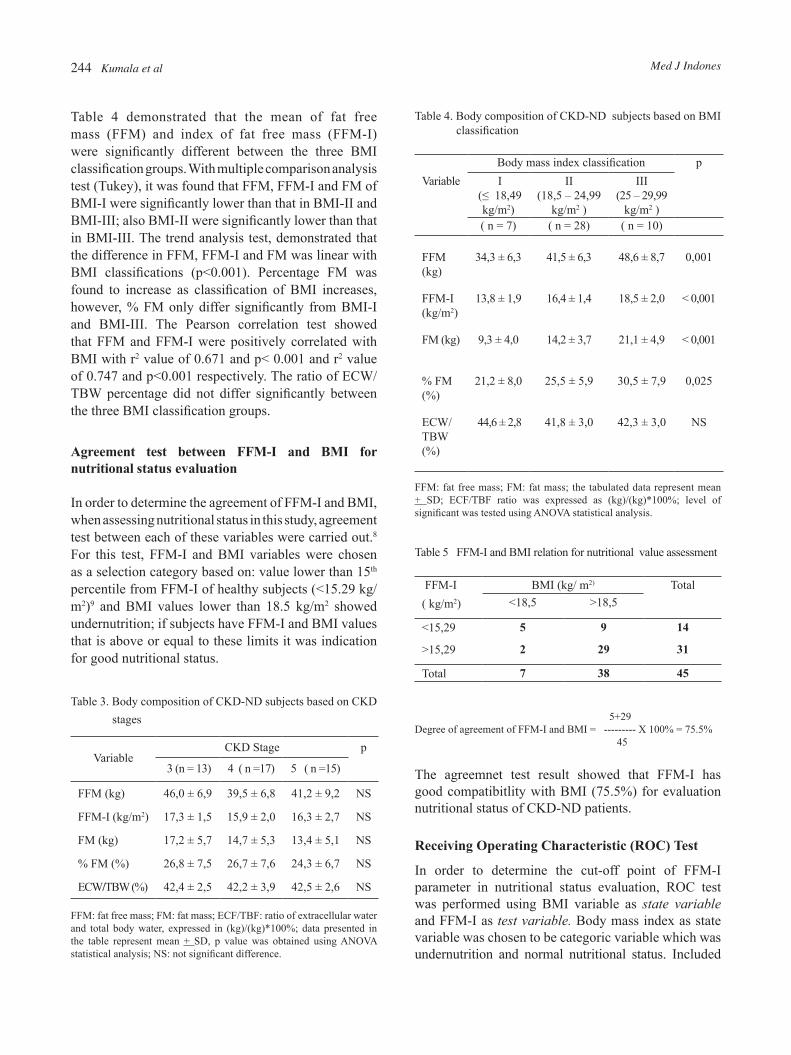
Table 4 demonstrated that the mean of fat free mass (FFM) and index of fat free mass (FFM-I) were significantly different between the three BMI classification groups. With multiple comparison analysis test (Tukey), it was found that FFM, FFM-I and FM of BMI-I were significantly lower than that in BMI-II and BMI-III; also BMI-II were significantly lower than that in BMI-III. The trend analysis test, demonstrated that the difference in FFM, FFM-I and FM was linear with BMI classifications (p<0.001). Percentage FM was found to increase as classification of BMI increases, however, % FM only differ significantly from BMI-I and BMI-III. The Pearson correlation test showed that FFM and FFM-I were positively correlated with BMI with r2 value of 0.671 and p< 0.001 and r2 value of 0.747 and p<0.001 respectively. The ratio of ECW/TBW percentage did not differ significantly between the three BMI classification groups.
Agreement test between FFM-I and BMI for nutritional status evaluation
In order to determine the agreement of FFM-I and BMI, when assessing nutritional status in this study, agreement test between each of these variables were carried out.8 For this test, FFM-I and BMI variables were chosen as a selection category based on: value lower than 15th percentile from FFM-I of healthy subjects (<15.29 kg/m2)9 and BMI values lower than 18.5 kg/m2 showed undernutrition; if subjects have FFM-I and BMI values that is above or equal to these limits it was indication for good nutritional status.
Table 3. Body composition of CKD-ND subjects based on CKD stages
VariableCKD Stage p
3 (n = 13) 4 ( n =17) 5 ( n =15)
FFM (kg) 46,0 ± 6,9 39,5 ± 6,8 41,2 ± 9,2 NS
FFM-I (kg/m2) 17,3 ± 1,5 15,9 ± 2,0 16,3 ± 2,7 NS
FM (kg) 17,2 ± 5,7 14,7 ± 5,3 13,4 ± 5,1 NS
% FM (%) 26,8 ± 7,5 26,7 ± 7,6 24,3 ± 6,7 NS
ECW/TBW (%) 42,4 ± 2,5 42,2 ± 3,9 42,5 ± 2,6 NS FFM: fat free mass; FM: fat mass; ECF/TBF: ratio of extracellular water and total body water, expressed in (kg)/(kg)*100%; data presented in the table represent mean + SD, p value was obtained using ANOVA statistical analysis; NS: not significant difference.
Table 4. Body composition of CKD-ND subjects based on BMI classification
Body mass index classification pVariable I
(≤ 18,49 kg/m2)
II(18,5 – 24,99
kg/m2 )
III(25 – 29,99
kg/m2 ) ( n = 7) ( n = 28) ( n = 10)
FFM (kg)
34,3 ± 6,3 41,5 ± 6,3 48,6 ± 8,7 0,001
FFM-I (kg/m2)
13,8 ± 1,9 16,4 ± 1,4 18,5 ± 2,0 < 0,001
FM (kg) 9,3 ± 4,0 14,2 ± 3,7 21,1 ± 4,9 < 0,001
% FM (%)
21,2 ± 8,0 25,5 ± 5,9 30,5 ± 7,9 0,025
ECW/TBW (%)
44,6 ± 2,8 41,8 ± 3,0 42,3 ± 3,0 NS
FFM: fat free mass; FM: fat mass; the tabulated data represent mean + SD; ECF/TBF ratio was expressed as (kg)/(kg)*100%; level of significant was tested using ANOVA statistical analysis.
Table 5 FFM-I and BMI relation for nutritional value assessment
FFM-I( kg/m2)
BMI (kg/ m2) Total<18,5 >18,5
<15,29 5 9 14
>15,29 2 29 31
Total 7 38 45
5+29Degree of agreement of FFM-I and BMI = --------- X 100% = 75.5% 45
The agreemnet test result showed that FFM-I has good compatibitlity with BMI (75.5%) for evaluation nutritional status of CKD-ND patients.
Receiving Operating Characteristic (ROC) Test
In order to determine the cut-off point of FFM-I parameter in nutritional status evaluation, ROC test was performed using BMI variable as state variable and FFM-I as test variable. Body mass index as state variable was chosen to be categoric variable which was undernutrition and normal nutritional status. Included
245Vol 17, No 4, October - December 2008 Parameter for nutritional status in non dialysis chronic kidney disease
in the undernutrition status is BMI ≤18.5kg/m2 while normal nutritional status is BMI value lie between 18.5-29.99 kg/m2.
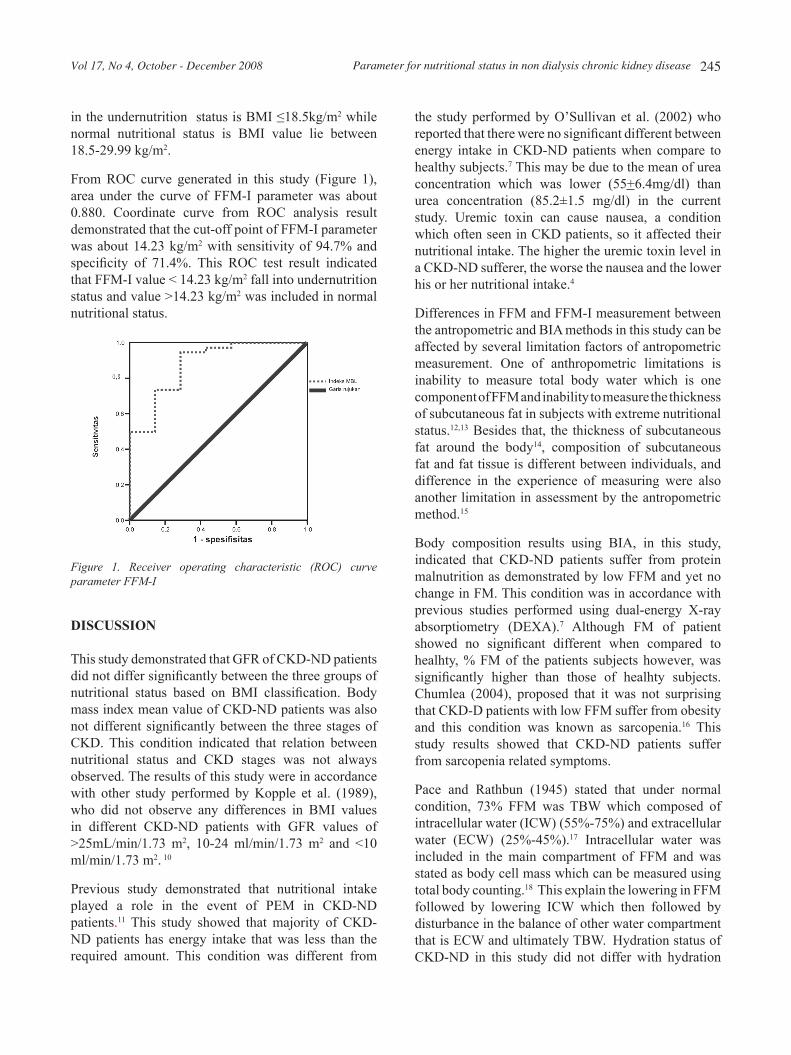
From ROC curve generated in this study (Figure 1), area under the curve of FFM-I parameter was about 0.880. Coordinate curve from ROC analysis result demonstrated that the cut-off point of FFM-I parameter was about 14.23 kg/m2 with sensitivity of 94.7% and specificity of 71.4%. This ROC test result indicated that FFM-I value < 14.23 kg/m2 fall into undernutrition status and value >14.23 kg/m2 was included in normal nutritional status.
Figure 1. Receiver operating characteristic (ROC) curve parameter FFMI
DISCUSSION
This study demonstrated that GFR of CKD-ND patients did not differ significantly between the three groups of nutritional status based on BMI classification. Body mass index mean value of CKD-ND patients was also not different significantly between the three stages of CKD. This condition indicated that relation between nutritional status and CKD stages was not always observed. The results of this study were in accordance with other study performed by Kopple et al. (1989), who did not observe any differences in BMI values in different CKD-ND patients with GFR values of >25mL/min/1.73 m2, 10-24 ml/min/1.73 m2 and <10 ml/min/1.73 m2. 10
Previous study demonstrated that nutritional intake played a role in the event of PEM in CKD-ND patients.11 This study showed that majority of CKD-ND patients has energy intake that was less than the required amount. This condition was different from
the study performed by O’Sullivan et al. (2002) who reported that there were no significant different between energy intake in CKD-ND patients when compare to healthy subjects.7 This may be due to the mean of urea concentration which was lower (55+6.4mg/dl) than urea concentration (85.2±1.5 mg/dl) in the current study. Uremic toxin can cause nausea, a condition which often seen in CKD patients, so it affected their nutritional intake. The higher the uremic toxin level in a CKD-ND sufferer, the worse the nausea and the lower his or her nutritional intake.4
Differences in FFM and FFM-I measurement between the antropometric and BIA methods in this study can be affected by several limitation factors of antropometric measurement. One of anthropometric limitations is inability to measure total body water which is one component of FFM and inability to measure the thickness of subcutaneous fat in subjects with extreme nutritional status.12,13 Besides that, the thickness of subcutaneous fat around the body14, composition of subcutaneous fat and fat tissue is different between individuals, and difference in the experience of measuring were also another limitation in assessment by the antropometric method.15
Body composition results using BIA, in this study, indicated that CKD-ND patients suffer from protein malnutrition as demonstrated by low FFM and yet no change in FM. This condition was in accordance with previous studies performed using dual-energy X-ray absorptiometry (DEXA).7 Although FM of patient showed no significant different when compared to healhty, % FM of the patients subjects however, was significantly higher than those of healhty subjects. Chumlea (2004), proposed that it was not surprising that CKD-D patients with low FFM suffer from obesity and this condition was known as sarcopenia.16 This study results showed that CKD-ND patients suffer from sarcopenia related symptoms.
Pace and Rathbun (1945) stated that under normal condition, 73% FFM was TBW which composed of intracellular water (ICW) (55%-75%) and extracellular water (ECW) (25%-45%).17 Intracellular water was included in the main compartment of FFM and was stated as body cell mass which can be measured using total body counting.18 This explain the lowering in FFM followed by lowering ICW which then followed by disturbance in the balance of other water compartment that is ECW and ultimately TBW. Hydration status of CKD-ND in this study did not differ with hydration
246 Med J IndonesKumala et al
status of healhty subjects. Low TBW and ECW in CKD-ND patients participated in the current study comparable with the significantly low measured FFM in the patients when compared to the healhty subjects.
The current study demonstrated that changes in FFM and FFM-I did not comply with changes in CKD stages. This condition was in agreement with previous study by Heimburger et al. (2000) who stated that creatinin clearance which reflected kidney function did not always relate to nutritional status and also FFM.2 Total body water mean value, TBW/FFM, ECW and %ECW did not significantly different between CKD-ND patients in the three stages of CKD. This situation indicated that hydration status of CKD-ND patients of different stages of CKD and under normal condition showed no difference.
Fat free mass was affected by body height; individual with heigher body height generally has higher FFM than shorter individual. Fat free mass index reflected the status of body composition more accurately and significantly in clinical term when compared to FFM values.19,20,21 This was the reason to recommend for choosing FFM-I value with percentile limit of 15-85 from normal population as standardized normal value for body composition (BC) data in this study. In the current study, the measured FFM-I showed the difference in nutritional status between CKD-ND patients and healhty subjects; and differentiate the level of nutritional status of CKD-ND patients. Besides, FFM-I of CKD-ND patients has correlation with BMI (r2 = 0747, p<0.001). Agreement test between FFM-I and BMI for evaluation of nutritional status demonstrated the degree of good compatibility (75.5%). Based on these study results, FFM-I was chosen to be a good predictor of CKD-ND patients’ nutritional status. The receiver operating curve (ROC) test performed in this study showed that FFM-I <14.233kg/m2 indicated undernutrition while FFM-I >14.23kg/m2 was normal nutritional status.
It is concluded that fat free mass (FFM) and FFM-I in CKD-ND patients has linear relationship with BMI for nutritional status assessments. CKD-ND patients with low BMI has low FFM and FFM-I that was significantly lower than those patients with high BMI. Fat free mass index value reflected body compartment status more legitimately clinically and more significantly when compare to FFM values. Fat free mass Index has stronger compatibility with BMI for assessment of nutritional status in CKD-ND patients. This explained
the use of FFM-I as nutritional status predictor in CKD-ND stages 3, 4 and 5 patients with FFM-I cut-off point of 14.23kg/m2.
REFERENCES
1. Heimburger O, Qureshi AR, Blaner WS, Berglund L, and Stenvinkel P. Handgrip muscle strength, lean body mass, and plasma protein as markers of nutritional status in patients with chronic renal failure close to start of dialysis therapy. Am J Kidney Dis. 2000;36:1213-25
2. Toigo G, Aparicio M, Attman PO, Cano N, Cianciaruso B, Engel B, Fourque D, Hidland A, Teplor V, and Wanner C. Concensus report. Expert working group report on nutrition in adult patients with renal insufficiensy (part 1 of 2). Clin Nutr. 2000;19:197-207
3. National Kidney Foundation: K/DOQI Clinical practice guidelines for chronic kidney disease: Evaluation, classification and stratification. Am J Kidney Dis. 2002;39 (suppl 1)
4. Bergstrom J. Why are dialysis patients malnourished? Am J Kidney Dis. 1995; 26:229-41
5. Mitch WE. Insights into the abnormalities of chronic renal disease attributed to malnutrition. J Am Soc Nephrol. 2002;13:S22-S7
6. May RC, Hara Y, Kelly RA, Block KP, Buse MG, and Mitch WE. Branched–chain amino acid metabolism in rat muscle: abnormal regulation in acidosis. Am J Physiol Soc. 1987;252:E712-E78
7. O’Sullivan AJ, Lawson JA, Chan M, and Kelly JJ. Body composition and energy metabolism in chronic renal isufficiency. Am J Kidney Dis. 2002;39:369-75
8. Altman D.G.: Some common problems in medical research, In: Practical statistics for medical research. London, Chapman and Hall, 1991;p 397-409.
9. VanItallie TB, Yang M-U, Boileau RA, and Heymsfield SB. Applications of body composition technology in clinical medicine: some issues and problems, In: Kral JG, and Vantallie TB. (eds) Recent developments in body composition analysis:methods and applications 1st ed. Great Britain, Eldred Smith-Gordon, 1993. p 87-97
10. Kopple JD, Berg R, Houser H, Steinman TI, and Teschan P. Nutritionaol status of patients with different levels of chronic renal insufficiency. Kidney Int.1989;36 (Suppl 27): S184-S94
11. Lindholm B, Heimbürger O, and Stenvinkel P What are the causes of protein energy malnutrition in chronic renal isufficiency. Am J Kidney Dis. 2002;39:422-5
12. Vansant G, Van Gaal L, and De Leuw I.: Assessment of body composition by skinfold anthropometry and bioelectrical impeandce technique: A comparative study. JPEN 1994;18:427-9
13. Gray DS, Bray GA, and Bauer M. Skinfold thickness measurement in obese subjects. Am J Clin Nutr 1990;51:571-7
14. Steiner MC, Barton SJ, Singh MDLM. Bedside methods versus dual energy x-ray absorptiometry for body

247Vol 17, No 4, October - December 2008 Parameter for nutritional status in non dialysis chronic kidney disease
composition measurement in COPD. Eur Respir J. 2002; 19:626-31.
15. Heyward VH and Wagner DR: Applied body composition assessment 2nd ed Australia, Human Kinetics, Price Avenue, 2004; p3-14, 123-34
16. Chumlea WC. Anthropometric and body composition assessment in dialysis patients. Semin dial.2004;17:466-70
17. Pace N, and Rathbun EN. Studies on body composition. III. The body water and chemically combined nitrogen content in relation to fat content J Biol Chem. 1945;158:685-91
18. Heymsfield SB and Matthews D. Body composition: Research and clinical advances-1993 A.S.P.E.N. Research workshop. JPEN 1994;18:91-103
19. Wells JC. A Critique of the expression of paediatric body composition data. Arch Dis Child.2001;85:67-72
20. Foster BJ and Leonard MB. Measuring nutritional status in children with chronic kidney disease. Am J Clin Nutr. 2004;80: 801-14
21. Pichard C, Kyle UG, Moraian A, Perrier A, Vermeulen B, and Unger P. Nutritional assessment lean body mass depletion at hospital admission associated with an increased lenght of stay. Am J Clin Nutr.2004;79:613-8.