analisis dan perancangan sistem monitoring jaringan...
TRANSCRIPT

ANALISIS DAN PERANCANGAN SISTEM MONITORING JARINGAN BERBASIS
NAGIOS DI BADAN PENGKAJIAN DAN PENERAPAN TEKNOLOGI SERPONG
Krisna Dwipayana Universitas Bina Nusantara, Jakarta, DKI Jakarta, Indonesia
Surya Universitas Bina Nusantara, Jakarta, DKI Jakarta, Indonesia
Dan
Franc Arifianto Universitas Bina Nusantara, Jakarta, DKI Jakarta, Indonesia
Fauzie Dahmir Kddsn: D1524
ABSTRAK
The purpose of this study is to analysis and design a network monitoring system based on nagios
which has function to ease the network monitoring activitiy for network administrator. With Nagios, network monitoring will be more integrated and network administrator do not need to access the network devices to do the monitoring. Research method used in this study is analysis method and design method. Analysis method involving system observation, interview, and literature study. Design method involving several step which is process design and designing the network monitoring tools. The result of this study is a network monitoring tools based on nagios, which also plays a role as network monitoring system, that can shows several monitoring items in integrated way. The conclusion from this study is that the network monitoring system based on nagios has been going well and can give ease to network administrator to do the monitoring activity, especially network devices. Key words: Nagios, Monitoring, Network
Tujuan penelitian ialah menganalisis dan merancang sistem monitoring jaringan berbasis nagios yang berfungsi untuk memudahkan network administrator dalam melakukan monitoring jaringan. Dengan nagios, monitoring jaringan akan lebih terpadu dan network administrator tidak perlu mengakses perangkat jaringan untuk melakukan monitoring. Metode penelitian yang digunakan dalam skripsi ini adalah metode analisis dan metode perancangan. Metode analisis meliputi observasi sistem, wawancara, dan studi kepustakaan. Metode perancangan berupa beberapa tahapan yaitu perancangan proses dan perancangan network monitoring tools. Hasil yang dicapai dari skripsi ini adalah sebuah network monitoring tools berbasis nagios, yang juga berperan sebagai sistem monitoring jaringan, yang dapat menampilkan hal-hal yang di monitoring secara terpadu. Simpulan dari skripsi ini adalah bahwa sistem monitoring jaringan berbasis nagios telah berjalan dengan baik dan dapat memberikan kemudahan bagi Network Administrator dalam melakukan monitoring jaringan, khususnya perangkat jaringan. Kata Kunci: Nagios, Monitoring, Jaringan

1. PENDAHULUAN
Dewasa ini, sudah banyak lembaga pemerintah yang menggunakan teknologi jaringan komputer sebagai salah satu sistem komunikasi antar satu dengan yang lainya, dan manfaat ini juga untuk mempermudah kerja manusia terutama di lingkungan lembaga pemerintah. Seiring dengan berjalannya waktu, lingkungan lembaga pemerintah menjadi makin luas cakupannya hingga masuk dalam kategori WAN (Wide Area Network). Pada saat ini, pemantauan jaringan menjadi suatu hal yang cukup sulit dilakukan apabila jaringan komputer pada lingkungan lembaga sudah menjadi sangat luas dan kompleks. Masalah-masalah jaringan yang sering terjadi dalam suatu lembaga pemerintah salah satunya adalah kerusakan elemen jaringan seperti hub, bridge, router, Transmission Facilities dan sebagainya, dimana kesalahannya tidak diketahui oleh pemantau jaringan secara manual dan pemeriksaan jaringan yang terlalu lama.
Perkembangan jaringan pada lembaga pemerintah ini memicu semakin dibutuhkannya suatu sistem yang dapat memantau jaringan komputer beserta perangkatnya dalam lingkungan lembaga pemerintah yang cukup luas dan kompleks. Solusi yang dapat digunakan dalam kasus ini adalah dengan menggunakan Network Monitoring System atau yang sering disingkat NMS. NMS sudah menjadi suatu syarat yang mutlak bagi lembaga atau perusahaan yang memiliki jaringan komputer yang topologinya kompleks. Penggunaannya dalam operasi kerja dalam suatu lembaga pemerintah akan sangat membantu administrator jaringan ketika ingin melakukan pengelolaan dan pemeliharaan jaringan. Dalam membangun NMS ini, salah satu cara yang efisien dan efektif adalah dengan menggunakan Network Monitoring Tools atau yang sering disingkat NM-Tools.
Dalam pengertian yang sederhana NM-Tools adalah sistem ekstrak atau kumpulan sistem yang memiliki tugas-tugas mengamati atau memantau sistem yang kemungkinan terjadi masalah-masalah pada sistem tersebut. Dengan adanya NM-tools ini, gangguan, kesalahan atau error yang terjadi pada jaringan komputer dapat di deteksi dan diberikan solusi secara cepat, sehingga membuat efektifitas & efesiensi kinerja lembaga meningkat dan tidak akan ada gangguan pada saluran dan jaringan komunikasi. Pada intinya, tujuan utama sistem monitoring adalah untuk menemukan dan melaporkan sistem yang tidak bekerja secara baik, sehingga para administrator jaringan selalu waspada terhadap masalah sebelum pengguna mengetahuinya.
Pusat Data, Informasi, dan Standardisasi (PDIS), sebagai salah satu lembaga di Badan Pengkajian dan Penerapan Teknologi (BPPT), Serpong, yang bergerak di bidang penelitian teknologi di Indonesia, memilik jaringan dengan kategori WAN. Jaringan ini sendiri digunakan untuk membagi internet yang ada, pertukaran file dan data, komunikasi Video Conference menggunakan Internet Protocol Television (IPTV) dan sebagainya. Dengan adanya hal ini, perangkat-perangkat jaringan yang ada harus dipastikan tidak mengalami masalah, dan jika ada masalah harus dipastikan perangkat mana yang bermasalah dan apa masalahya.
2. METODOLOGI PENELITIAN Metodologi yang digunakan dalam penelitian ini adalah: 1. Metode Analisis
a. Wawancara b. Observasi c. Kepustakaan
2. Metode Perancangan a. Perancangan Network Monitoring System b. Perancangan Proses dengan menggunakan Use Case Diagram
3. LANDASAN TEORI
3.1 Network Monitoring System (NMS)
NMS adalah kumpulan sistem yang memiliki tugas pemantauan sistem lainnya didalam suatu jaringan dan dapat digunakan untuk mendeteksi masalah-masalah yang akan terjadi, misalnya suatu sistem pemantauan dapat menghubungi suatu service web, secara berkala mengetahui apakah service web dapat memberikan respond atau tidak, jika tidak sistem

pemantauan dapat mengirimkan pemberitahuan kepada administrator jaringan melalui email atau SMS (Short Message Service), bahwa terjadi kegagalan respond dari service web tersebut.
NMS mampu mengamati internal performance dari suatu sistem komputer seperti : 1. Kapasitas penggunaan memori. 2. Jumlah proses yang berjalan dalam suatu sistem komputer. 3. Beban prosesor 4. Jumlah pengguna.
Tujuan sistem pemantauan ini adalah agar masalah-masalah jaringan yang terjadi pada suatu sistem mungkin dapat dicegah secara cepat. NMS ini juga dapat memberikan visualisasi mengenai jaringan dan sistem yang diamati berupa gambaran yang lebih jelas dan jelas dilihat sehingga dalam mengambil langkah-langkah penyelesaikan masalah tidak mengganggu aktifitas kerja yang lainnya.
3.2 Manajemen Jaringan
Manajemen jaringan merupakan sebuah pengaturan, pengurusan atau pengelolaan elemen pada jaringan agar jaringan tetap dapat digunakan untuk ke depannya, (Subramanian 2000, p135) 1. Configuration Management (Manajemen Konfigurasi)
Manajemen konfirgurasi berhubungan dengan pembaruan, perubahan di dalam jaringan. Tugas konfigurasi jaringan pertama kali yang dilakukan instalasi dan mungkin juga dari manajemen lain mengakibatkan terjadinya kegagalan atau kesalahan yang dikoreksi melalui pengaturan konfigurasi. 2. Fault Management (Manajemen Kesalahan)
Manajemen kesalahan berhubungan dengan kejadian-kejadian masalah di dalam jaringan, dimana manajemen jaringan bisa mendeteksi jaringan yang bermasalah dan bisa mengisolasi masalah tersebut. 3. Performance Management (Manajemen Kinerja)
Manajemen Kinerja berhubungan dengan keterkaitan pada prilaku kinerja jaringan 4. Security Management (Manajemen Keamaan)
Manajemen keamanan berhubungan dengan keamaan terhadap jaringan, Manajemen keamanan ini sangat berkaitan dengan manajemen kesalahan dan manajemen konfigurasi supaya pengaturan konfigurasi perangkat jaringan harus mendapatkan sistem keamanan yang bagus dan bisa menangani keamanan pengkonfigurasian password pada server sehingga pengaksesan yang dicurigai dapat diamankan 5. Accounting Management (Manajemen Akuntansi)
Akuntansi manajemen berhubungan dengan masalah pengguna sumber jaringan di dalam sistem dan meminta bayaranan atas pelayanan atau jasa ketersediaan sumber jaringan.
3.3 Simple Network Management Protocol (SNMP)
SNMP merupakan kumpulan protocol yang dikembangkan untuk menangani
manajemen jaringan yang membuat administrator jaringan dapat memantau dan mengatur jaringan komputer secara sistematis dari jarak jauh atau dalam satu pusat kontrol. SNMP ini bekerja dengan menukar pesan yang berisi informasi jaringan yang dikenal sebagai PDU, kegunaannya yaitu untuk melakukan monitoring startup dan shutdown, dan untuk pengatur informasi. Dalam SNMP ini terdapat elemen-elemen sebagai berikut : 1. Manager
Manager adalah pelaksana dan manajemen jaringan, kenyataanya manager ini merupakan komputer biasa yang ada pada jaringan yang mengoperasikan perangkat lunak untuk manajemen jaringan. 2. Management Information Base (MIB)
MIB adalah sebagai struktur basis data variable dari element jaringan yang dikelola. Struktur tersebut bersifat hirarki dan memiliki aturan sedemikian rupa sehingga informasi setiap variable dapat dikelola atau ditetapkan dengan mudah. Salah satu contoh dari MIB adalah MIB-II (RFC 1213). 3. Agent

Agent adalah perangkat lunak yang dijalankan setiap elemen jaringan yang dikelola. Setiap agent memiliki basis data variable yang bersifat lokal yang menerangkan keadaan dan berkas aktivitas yang dilakukan.
3.4 Nagios
Nagios merupakan perangkat yang berfungsi untuk memantau sistem jaringan dan merupakan salah satu NM-Tools (Network Monitoring Tools) yang bersifat open source. Nagios dapat langsung memeriksa kondisi jaringan dan beberapa layanan yang berada dalam perangkat jaringan. Pemeriksaan jaringan dilakukan secara langsung terhadap host atau service yang dibantu dengan menggunakan plugin. Nagios pada awalnya di desain untuk beroperasi dibawah sistem operasi Linux, namun dapat juga berjalan di bawah sistem operasi bertipe Unix. (Wojciech Kocjan, 2008, p8).
Mongkolluksamee, S. (2010,p3) mendeskripsikan nagios sebagai sebuah network monitoring tool yang sangat fleksibel dan mudah di konfigurasi. Penggunanya dapat membuat plugin masing-masing untuk mendukung berbagai macam perangkat atau layanan pada jaringan. Dengan fleksibilitas, ekstensibilitas, dan berbagai macam add-ons yang ada pada nagios, nagios dapat dipakai sebagai framework untuk membangun sebuah monitoring software yang kuat dan mudah digunakan.
Dalam mengamati terhadap objek yang dipantau, terdapat empat pernyataan untuk mendeskripsikan status, yaitu Ok, Warning, Critical, dan Unknown. Dengan demikian, pemantau dapat mengutamakan yang memiliki status critical dan warning untuk diperbaiki.
Hampir semua pemeriksaan yang dilakukan oleh Nagios dibantu dengan plugin. Dalam pemantauan jaringan, plugin membantu pemantau agar mendapatkan hasil yang lebih detail. jadi, para administrator dapat membaca hasil pemeriksaan dengan lebih rinci.
Nagios tidak hanya menawarkan sistem inti untuk memantau, tetapi juga menawarkan standard plugin. Pemantau juga dapat membuat plugin-nya sendiri jika ingin melakukan pemeriksaan yang lebih spesifik. Dengan menguasai programming language, Nagios membantu pemantau untuk dapat lebih mudah membuat plugin yang diinginkan. Perbedaan yang dimiliki antara Nagios dengan NM-Tools yang lain : 1. Nagios bersifat open source, sehingga untuk mengembangkannya lebih mudah. 2.Fleksibel, sehingga lebih mudah untuk memenuhi persyaratan dan kebutuhan dalam pemantauan jaringan. 3. Menggunakan plugin dalam pengambilan data perangkat jaringan. 4. Plugin dapat dibuat dan dikembangkan sendiri sesuai kebutuhan pemantau jaringan, sehingga menambah fitur-fitur nagios menjadi semakin lengkap dibandingkan NM-Tool yang lain. 5. Bersifat modular. 6. Menggunakan web interface sebagai tampilan data perangkat jaringan, sehingga dapat diakses secara mudah dan remote dari tempat lain. 7. Dapat memantau host resources, seperti disk usage, memory usage, CPU procces, dll). 8. Mempunyai fitur reporting melalui web interface. 9. Dapat diintegrasikan dengan web browser, salah satunya Mozilla Firefox, untuk fitur reporting.
4. HASIL DAN PEMBAHASAN 4.1 Sistem Monitoring Jaringan dengan Nagios
Dari 5 metode pemeriksaan yang ada pada nagios, 2 metode dinilai yang terbaik untuk digunakan di BPPT, yakni metode pemeriksaan melalui plugin dan melalui SNMP. Kemudian, nagios diintegrasikan dengan beberapa komponen tambahan yang akan mendukung sistem monitoring jaringan, yakni nagvis yang berperan sebagai visualitator nagios, nagiosql yang berperan sebagai configuration interface, dan pnp4nagios yang berperan sebagai graphing presentation dari data perangkat jaringan. Berikut skema sistem monitoring jaringan berbasis nagios yang dirancang.

Gambar 1. Skema Sistem Monitoring Jaringan Berbasis Nagios
Hal-hal yang di monitoring dalam lembaga BPPT adalah: 1. RTA (Round Trip Average) : RTA adalah waktu yang diperlukan sebuah paket untuk dikirim dan kembali lagi ke host asal. Ini akan memperlihatkan performa perangkat jaringan secara umum. 2. Packet Lost : Untuk melihat berapa paket data yang hilang dalam suatu periode waktu. 3. SSH (Secure Shell) : Untuk monitoring apakah port 22 / untuk SSH terbuka atau tidak. 4. Traffic : Untuk monitoring bandwidth utilization yang ada di tiap perangkat. 5. Uptime : Untuk melihat informasi sudah berapa lama perangkat jaringan tersebut dalam kondisi Up. 6. Sensor status : Untuk melihat kondisi kipas & suplai listrik pada perangkat. 7. CPU Usage : Untuk monitoring seberapa besar penggunaan CPU di perangkat jaringan. 8. Memory Usage : Untuk monitoring seberapa banyak memori tersisa pada perangkat jaringan. 4.2 Evaluasi
4.2.1 Monitoring Utama dengan Nagios
Nagios telah berhasil melakukan monitoring jaringan, dengan mendeteksi perangkat jaringan mana saja yang bermasalah. Seperti yang tergambar pada gambar berikut.

Gambar 2. Current Host Status
Dalam gambar terlihat perangkat jaringan yang mati muncul dengan status DOWN, sedangkan yang beroperasi muncul dengan status UP. Status UNREACHABLE muncul jika sebuah perangkat jaringan secara topologi merupakan child node dari perangkat jaringan ber-status DOWN.
Gambar 3. Current Service Status

Pada gambar diatas dapat dilihat data yang dikumpulkan oleh nagios, dimana
data tersebut merupakan status dari hasil monitoring service di tiap perangkat. AS_B2TE-1 terlihat bermasalah pada service-nya. Ini diakibatkan dari perangkat jaringannya memang sedang DOWN. Jika perangkat jaringan berstatus DOWN, maka pemeriksaan service tidak akan dilakukan oleh nagios. 4.2.2 Konfigurasi dengan NagiosQL
Dengan menggunakan NagioSQL, telah berhasil dibuat konfigurasi untuk nagios. Konfigurasi yang dilakukan terutama pada Host Definition, Service Definition, dan Command Definition. Berikut tampilan dimana file konfigurasi berada.
Gambar 4. Host Definition
Gambar 5. Service Definition

Gambar 6. Command Definition
4.2.3 Peta Nagvis
Dengan menggunakan Nagvis, telah berhasil dibuat peta logikal, fisikal, dan geografikal. Dapat dilihat pada gambar dibawah ini.
Gambar 7. Peta Logikal
Dapat dilihat pada gambar ini bahwa peta menggambarkan hubungan secara topologikal antara perangkat jaringan. Perangkat jaringan yang ada adalah Access Switch, Distribution Switch, Core Switch, Router, dan Firewall. Peta ini di generate secara otomatis oleh nagvis karena nagvis mampu untuk mendeteksi parent di tiap host.
Gambar 8. Peta Geografikal

Peta geografikal ini menggambarkan letak perangkat jaringan sesuai peta
wilayah BPPT Puspiptek-Serpong. Peta ini dibuat secara manual dengan memanfaatkan fitur "create map" yang ada pada nagvis.
Gambar 9. Peta Fisikal
Peta fisikal yang dimaksud adalah penggambaran perangkat jaringan secara fisik. Jadi dapat dilihat bagaimana situasinya secara fisik. Peta yang dibuat lebih menekankan ke pemetaan interface port yang terdapat pada perangkat jaringan. 4.2.4 Grafik Data PNP4Nagios
Grafik data yang dapat ditampilkan oleh PNP4Nagios antara lain: Traffic,
Memory Usage, PING, CPU Usage. Service-service yang dipantau ini dapat tampil secara grafik karena memiliki performance data. Berikut data yang dihasilkan oleh salah satu Access Switch dengan nama AS-B2TKS_1.
Gambar 10. Tampilan Performance Data IN dan OUT Bandwidth
Dapat terlihat bahwa selama 3 hari dilakukan implementasi, inBandwidth yang terpantau maksimum sebesar 17 MB/s sedangkan rata-ratanya hanya sekitar 1,3MB/s. Puncak pemakaian dapat terlihat pada hari Rabu sekitar jam 16.00
Sedangkan untuk outBandwidth terpantau maksimum sebesar 6,3 MB/s sedangkan rata-ratanya sekitar 1,2 MB/s. Puncaknya terpantau pada hari Rabu sekitar jam 16.00.
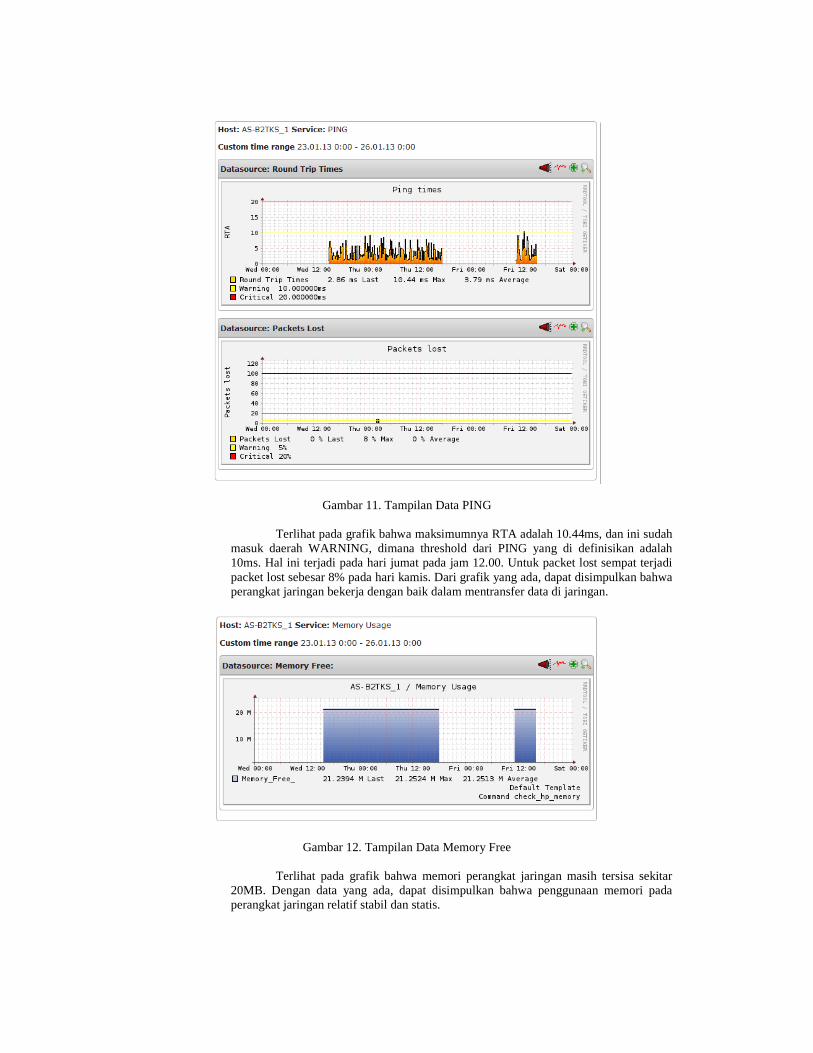
Gambar 11. Tampilan Data PING
Terlihat pada grafik bahwa maksimumnya RTA adalah 10.44ms, dan ini sudah masuk daerah WARNING, dimana threshold dari PING yang di definisikan adalah 10ms. Hal ini terjadi pada hari jumat pada jam 12.00. Untuk packet lost sempat terjadi packet lost sebesar 8% pada hari kamis. Dari grafik yang ada, dapat disimpulkan bahwa perangkat jaringan bekerja dengan baik dalam mentransfer data di jaringan.
Gambar 12. Tampilan Data Memory Free
Terlihat pada grafik bahwa memori perangkat jaringan masih tersisa sekitar 20MB. Dengan data yang ada, dapat disimpulkan bahwa penggunaan memori pada perangkat jaringan relatif stabil dan statis.

Gambar 13. Tampilan Data Penggunaan CPU
Terlihat pada grafik bahwa rata-rata penggunaan CPU pada perangkat jaringan AS_B2TKS-1 ini relatif stabil. Maksimum penggunaan yang pernah tercatat adalah sekitar 10%. Ini menandakan bahwa perangkat jaringan masih bekerja dibawah status kritis.
5. SIMPULAN DAN SARAN 5.1 Simpulan
Dari hasil evaluasi yang telah dilakukan terhadap NM-Tools nagios, maka dapat disimpulkan: 1. Selama masa implementasi di Badan Pengkajian dan Penerapan Teknologi (BPPT), nagios telah berhasil diajalankan pada platform LINUX Ubuntu versi 11.10 yang mendukung SNMP. 2. Fitur-fitur yang terdapat pada nagios beserta komponennya ini telah berfungsi dengan baik. Fitur-fitur yang dimaksud seperti:
a. Monitoring Host & Service - nagios mampu mendeteksi adanya masalah pada perangkat jaringan. b. Configuration Interface - NagiosQL sudah berfungsi dengan baik dalam menampung dan mendefinisikan Host Definition, Service Definition, dan Command Definition. c. Visualization of Network - Nagvis berfungsi dengan baik dalam membuat peta logikal, geografikal, dan fisikal dari perangkat jaringan. d. Reporting with Graphic - PNP4Nagios sudah dapat berfungsi untuk membuat grafik dari performance data yang di kumpulkan oleh proses nagios.
5.2 Saran 1. Menambahkan command definition bagi nagios untuk mengumpulkan data melalui SNMP Traps. 2. Melakukan riset lebih mendalam lagi untuk data-data apa saja yang dapat dikumpulkan melalui SNMP. 3. Mengembangkan scripting nagios milik sendiri. 4. Membuat Help menu yang lengkap untuk penggunaan sistem monitoring jaringan berbasis nagios. 5. Memonitoring data center yang ada pada BPPT-PDIS.

6. REFERENSI
Andi.(2005). Menjadi Administrator Jaringan Komputer. Wahana Komputer, Semarang. Barth, W.(2006) Nagios System And Network Monitoring. No Starch Press. San Francisco. Black, U.(1995).Network Management Standards: SNMP, CMIP, TMN, MIBs, and object
libraries. McGraw-Hill, Inc BPPT.(2012).Technical Note nomor 10-1.9.01-TN-0.2.1.2-24 Tentang Desain untuk Kerja
Monitoring Router. BPPT-PDIS Serpong. BPPT.(2012).Technical Note nomor 10-1.9.01-TN-0.2.1.2-49 Tentang Desain Kerja Monitoring
Firewall. BPPT-PDIS Serpong. BPPT.(2012).Technical Note nomor 10-1.9.01-TN-0.2.1.2-47 Tentang Desain Untuk Kerja
Monitoring Switch. BPPT-PDIS Serpong. Bradley Mitchell.(2012)Apache Web Server.11-15-2012
http://compnetworking.about.com/cs/webservers/g/bldef_apache.htm Chendramata, A. Priyambobo, A(2011).Nagios : Open Source Network Management System.
Kementerian Komunikasi dan Informatika Feibel, W.(1996). The Network Press Encyclopedia Of Networking. SYNEX Inc. Hall, J.A.(2008). Introduction to Accounting Information Systems 7th Edition. Cengage
Learning. Joerg Linge.(2012).PNP4Nagios.11-15-2012 http://docs.pnp4nagios.org/pnp-0.6/start Josephsen, D.(2007). Building A Monitoring Infrastructure With Nagios. Pearson Education,
Inc. Kaushik, A.(2010). Use Of Open Source Technologies For Enterprise Server Monitoring Using
SNMP. International Journal, 2. Kocjan, W.(2008). Learning Nagios 3.0.Packt Publishing. Leinwand, A. Fang Conroy, Ka.(1996). Network Management A Practical Perspective. Wesley
Longman, Inc Miah, W.(2010).Monitoring Scientific Computing Infrastructure Using Nagios. Merilainen, K. Lemmetyninen, A.(2011). Destination Network Management: A Conceptual
Analysis. Tourism Review. Mongkolluksamee, S. Strengths and Limitations of Nagios as a Network Monitoring Solution.
In Proceedings of the 7th International Joint Conference on Computer Science and Software Engineering (JCSSE 2010) Vol (Vol. 1, pp. 96-101).
Oracle Corporation.(2012).MySQL.11-1.2012 http://www.mysql.com/why-mysql/ Pervila, M. A.(2007). Using Nagios to Monitor Faults in a Self-Healing Environment. In
Seminar on Self-Healing Systems, University of Helsinki. Rouven Homann.(2012).NagioSQL.11-15-2012 http://www.nagiosql.org/ Rosenberg, D. Stephens, M.(2007). Use Case Driven Object Modelling with UML. Appress Schubert, M. Bennett, D. Gines, J. Hay, A. Strand, J.(2008).Nagios 3 Enterprise Network
Monitoring Including Plug-Ins and Hardware Devices.Syngress Publishing, Inc, Burlington.
Subramanian, M.(1999). Network Management: Principles and practice: An Introduction to Principles and Practice. Addison Wesley.
Tanenbaum, A.(2003). Computer Network, Fourth Edition. Prentice Hall. The PHP Group.(2012).PHP Hypertext Preprocessor.10-23.2012 http://php.net/ Tobias Oetiker.(2011).RRDtool.11-15-2012 http://oss.oetiker.ch/rrdtool/ Turnbull, J.(2006). Pro Nagios 2.0. Apress. Suite. Zeltserman, David.(1999). A Practical Guide to SNMPv3 and Network Management. Prentice-
Hall, Inc.

ANALYSIS AND DESIGN OF NETWORK MONITORING SYSTEM WITH NAGIOS
BASED AT AGENCY FOR THE ASSESSMENT AND APPLICATION OF TECHNOLOGY
SERPONG
Krisna Dwipayana Universitas Bina Nusantara, Jakarta, DKI Jakarta, Indonesia
Surya Universitas Bina Nusantara, Jakarta, DKI Jakarta, Indonesia
Dan
Franc Arifianto Universitas Bina Nusantara, Jakarta, DKI Jakarta, Indonesia
Fauzie Dahmir Kddsn: D1524
ABSTRACT
The purpose of this study is to analysis and design a network monitoring system based on nagios
which has function to ease the network monitoring activitiy for network administrator. With Nagios, network monitoring will be more integrated and network administrator do not need to access the network devices to do the monitoring. Research method used in this study is analysis method and design method. Analysis method involving system observation, interview, and literature study. Design method involving several step which is process design and designing the network monitoring tools. The result of this study is a network monitoring tools based on nagios, which also plays a role as network monitoring system, that can shows several monitoring items in integrated way. The conclusion from this study is that the network monitoring system based on nagios has been going well and can give ease to network administrator to do the monitoring activity, especially network devices. Key words: Nagios, Monitoring, Network

1. INTRODUCTION
Today, many government agencies that use computer networking technology as a system of communication between each other, and this benefit is also to facilitate the work of humans, especially in the government agencies. Over time, the government became increasingly wide-ranging up into the category of WAN (Wide Area Network). At this time, network monitoring becomes a matter that is quite difficult to do if the computer network at the institute has become a very large and complex.
Network problems that often occur in a government such as is damage to network elements such as hubs, bridges, routers, Transmission Facilities, and so on, where the fault is not known by the network monitoring and testing networks manually is too long. The development of the network of government agencies has sparked the need for a system that can monitor network computers and devices in a government agency that is quite extensive and complex. The solution can be used in this case is to use a Network Monitoring System or often abbreviated as NMS.
NMS has become an absolute requirement for institutions or companies that have a complex computer network topology. Its use in the operation of work in a government agency would greatly help network administrators when they want to perform network management and maintenance. In building this NMS, one solution which is an efficient and effective way is to use a Network Monitoring Tools or often abbreviated as NM-Tools.
In terms of simple NM-Tools is a system or set of extract systems have tasks observe or monitor the system the possibility of problems in the system. With the NM-tools, interruption, fault or error occurs on a computer network can be detected and given a solution quickly, thus making the effectiveness and efficiency of agency performance increase and there will be no interference with the channel and network communication. In essence, the main goal of system of monitoring is to find and reporting systems that do not work properly, so that network administrators are alert to problems before users know it.
Center for Data, Information, and Standardization (PDIS), as one of the institutions in the Agency for the Assessment and Application of Technology (BPPT), Serpong, engaged in technology research in Indonesia, choose a network with WAN categories. This network itself is used to divide the existing Internet, file and data exchange, video conferencing communications using Internet Protocol Television (IPTV) and so on. Given this, the network devices must be ensured that there are no problems, and if there is a problem which must be ascertained the problem and what the problem is.
2. RESEARCH METHOD The methodology used in this study are: 1. Analysis Methods
a. Interview b. Environment Observation c. Literature Study
2. Design Methods a. Design of Network Monitoring System b. The design process using a Use Case Diagram
3. THEORY FOUNDATION
3.1 Network Monitoring System (NMS)
NMS is a collection system that has the task of monitoring other systems within the network and can be used to detect problems that would occur, for example, a monitoring system can call a web service, periodically determine whether a web service can deliver or not respond, otherwise the system monitoring can send a notification to a network administrator via email or SMS (Short Message Service), respond that the failure of the web service.
NMS was able to observe the internal performance of a computer system such as: 1. The capacity of the memory usage. 2. The number of processes running on a computer system. 3. Processor load

4. Number of users. The purpose of this monitoring system is that network problems that occur in a system
may be prevented quickly. NMS can also provide visualization of the network and the observed system form a clearer picture and is clearly seen that in taking steps this settlement activity does not interfere with other work.
3.2 Network Management
Network management is an arrangement, administration or management of the network elements in the network so it can still be used for the future, (Subramanian, 2000, p135)
1. Configuration Management Configuration management related to the update, the changes in the network. Network
configuration tasks are performed the first time installation and possibly also from other management resulted in failures or errors are corrected through the configuration settings. 2. Fault Management
Management errors associated with the events of a problem in the network, which can detect network management network problems and can isolate the problem. 3. Performance Management
Performance Management link on the behavior associated with network performance 4. Security Management
Security management related to the network's security, security management is highly related to fault management and configuration management of network devices configuration settings that need to get a good security system and can handle configuring security passwords on the server so that suspected access can be secured suspected 5. Accounting Management
Accounting management issues related to the network resource users in the system and charging for services or service availability of network resources.
3.3 Simple Network Management Protocol (SNMP)
SNMP is a set of protocols developed to address network management makes network
administrators can monitor and manage the network in a systematic computer remotely or in the control center. SNMP works by exchanging messages containing information network known as PDU, its usefulness for monitoring the startup and shutdown, and to control information. In SNMP, there are the following elements:
1. Manager Manager is executing and network management, this manager in reality it is a
regular on the network operating software for network management. 2. Management Information Base (MIB)
MIB is a database structure variable of a managed network element. The structure is hierarchical and has a rule such that any variable information can be managed or set up easily. One example of the MIB is MIB-II (RFC 1213). 3. agent
Agent is software that run each managed network element. Each agent has a database that is local variable that explains the situation and file activities.
3.4 Nagios
Nagios is a device whose function is to monitor network systems and is one of the NM-Tools (Network Monitoring Tools) which is open source. Nagios can directly check the condition of the network and services that are within the network. Examination of tissue made directly to the host or service assisted by using a plugin. Nagios was originally designed to operate under the Linux operating system, but can also run under Unix-like operating systems. (Wojciech Kocjan, 2008, p8).
Mongkolluksamee, S. (2010, p3) describes Nagios as a network monitoring tool that is very flexible and easy to configure. Users can create their plugins to support a variety of devices

or services on the network. With the flexibility, extensibility, and various add-ons that exist in Nagios, Nagios can be used as a framework to build a monitoring software that is powerful and easy to use.
In observing the object being monitored, there are four statements to describe the status, that is OK, Warning, Critical, and Unknown. Thus, observers can prioritize the critical and warning status for repair.
Almost all of the tests done by Nagios plugin assisted. In network monitoring, help monitor plugin in order to obtain more detailed results. so, the administrator can read the results in more detail.
Nagios offers not only the core system for monitoring, but also offers a standard plugin. Monitoring can also create their own plugin if you want a more specific examination. By mastering the programming language, helping Nagios monitoring to more easily create the desired plugin.
The difference between the Nagios owned by other NM-tools: 1. Nagios is open source, so as to develop more easily. 2.Fleksibel, making it easier to meet the requirements and needs of the monitoring network. 3. Using the plugin in the data collection network devices. 4. Plugins can be created and developed network monitoring needs, thereby increasing the Nagios features become more complete than any other NM-Tool. 5. Is modular. 6. Using the web interface as a display device data network, so it can be accessed easily and remotely from anywhere else. 7. Can monitor host resources, such as disk usage, memory usage, CPU procces, etc.). 8. Has a feature reporting through the web interface. 9. Can be integrated with a web browser, one of Mozilla Firefox, for feature reporting.
4. RESULTS AND DISCUSSION 4.1 Network Monitoring System with Nagios
From 5 inspection methods that exist in Nagios, 2 rated the best method to use in BPPT, the method of inspection through plugins and through SNMP. Then, Nagios integrated with some additional components that will support the network monitoring system, which acts as the nagvis visualitator Nagios, nagiosql who plays configuration interface, and which acts as a graphing pnp4nagios presentation of the data network devices. The following schema-based network monitoring system Nagios designed.
Figure 1. Scheme Based Nagios Network Monitoring System

Things that in monitoring the BPPT institutions are: 1. RTA (Round Trip Average): RTA is the time it takes a packet to be sent and returned to the original host. This will show the performance of the network in general. 2. Lost Packet: To see how many packets are lost in a period of time. 3. SSH (Secure Shell): To monitor whether port 22 / SSH to open or not. 4. Traffic: For monitoring bandwidth utilization that exist in each device. 5. Uptime: To see how long the information network in Up state. 6. Sensor status: To view the condition of the fan and power supply of the device. 7. CPU Usage: To monitor how much CPU usage on network devices. 8. Memory Usage: To monitor how much memory is left on network devices. 4.2 Evaluation
4.2.1 Main Monitoring with Nagios
Nagios monitoring network has successfully done, the device detects any network problems. As illustrated in the following figure.
Figure 2. Current Host Status
In the picture looks the dead devices appears with status DOWN, while appearing to the operating status of UP. UNREACHABLE status appears when a network device topology is a child node of the network device with the status DOWN.

Figure 3. Current Service Status
In the picture above can be seen the data collected by Nagios, where the data is the status of the monitoring service on each device. AS_B2TE-1 looks troubled at his service. This is the result of the network is being DOWN. If the network device status is DOWN, the inspection service will not be done by Nagios. 4.2.2 Configuration with NagiosQL
By using NagioSQL, has been created for Nagios configuration. Configuration is done primarily on the Host Definition, Service Definition, and Command Definition. The following screen where the configuration file is located.
Figure 4. Host Definition

Figure 5. Service Definition
Figure 6. Command Definition
4.2.3 Nagvis Map
By using Nagvis, has successfully created a map of the logical, physical, and geographically. Can be seen in the picture below.
Figure 7. Logical Map Can be seen in this picture that the maps illustrate the topologikal relationship between network devices. There are network devices Access Switches, Distribution Switch, Core
Switch, Router, and Firewall. These maps are generated automatically by nagvis because nagvis able to detect the parent in each host.
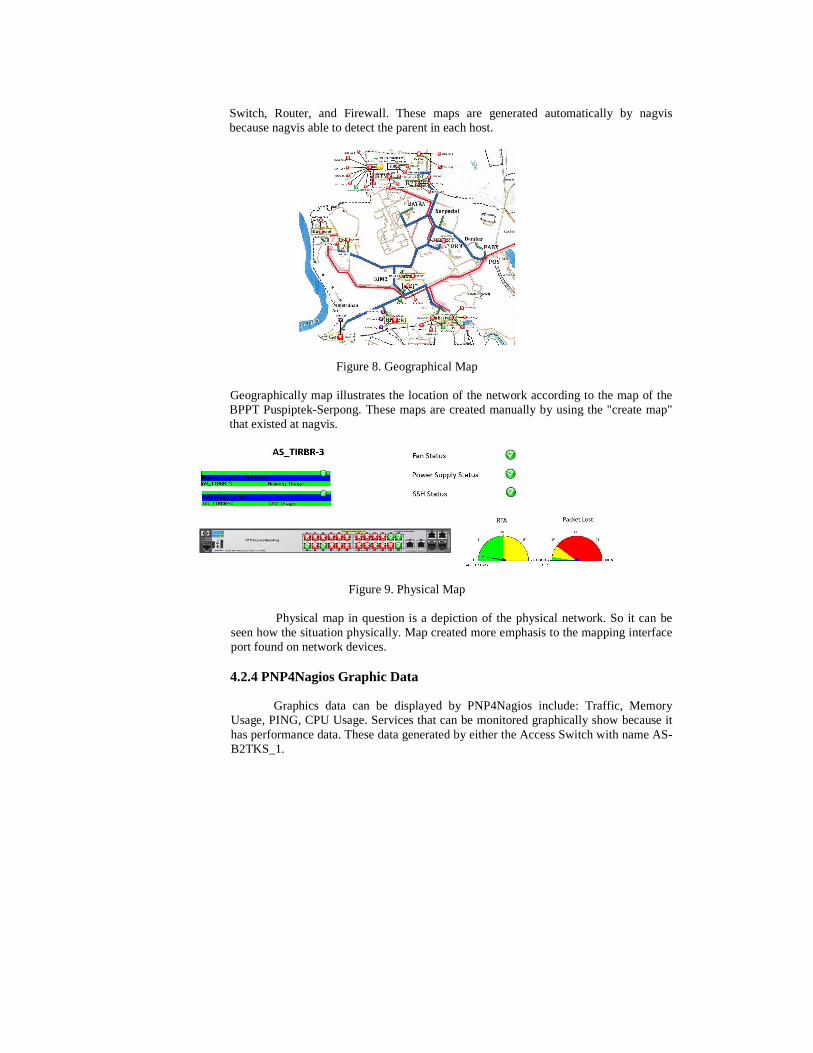
Figure 8. Geographical Map Geographically map illustrates the location of the network according to the map of the BPPT Puspiptek-Serpong. These maps are created manually by using the "create map" that existed at nagvis.
Figure 9. Physical Map
Physical map in question is a depiction of the physical network. So it can be seen how the situation physically. Map created more emphasis to the mapping interface port found on network devices. 4.2.4 PNP4Nagios Graphic Data
Graphics data can be displayed by PNP4Nagios include: Traffic, Memory
Usage, PING, CPU Usage. Services that can be monitored graphically show because it has performance data. These data generated by either the Access Switch with name AS-B2TKS_1.

Figure 10. Performance Data IN and OUT Bandwidth Presentation
It can be seen that for 3 days implementation, inBandwidth the maximum observed rate of 17 MB / s, while the average is only about 1.3 MB / s. Peak can be seen at about 16:00 Wednesday
As for the activities outBandwidth maximum of 6.3 MB / s, while the average is around 1.2 MB / s. Peak is seen at about 16:00 Wednesday.
Figure 11. PING Data Presentation

Seen on the graph that the maximum RTA is 10.44ms, and it has entered
WARNING region, where the threshold of PING is defined in 10ms. This happened on Friday at 12.00. For the lost packet had been a packet lost by 8% on Thursday. From the graph there, it can be concluded that the network works well in transferring data across the network.
Figure 12. Memory Free Data Presentation
Seen on the graph that the remaining network device memory about 20MB. With the data available, it can be concluded that the use of network memory on the device is relatively stable and static.
Figure 13. CPU Usage Data Presentation
Seen on the chart that the average CPU utilization on network devices AS_B2TKS-1 is relatively stable. Maximum usage ever recorded is around 10%. This indicates that the network is still working under critical status.
5. CONCLUSION AND SUGGESTION 5.1 Conclusion
From the results of evaluations that have been conducted on NM-Tools Nagios, it can be concluded:

1. During the period of implementation of the Agency for the Assessment and Application of Technology (BPPT), Nagios has successfully diajalankan on Ubuntu Linux platform that supports SNMP version 11:10. 2. The features found in Nagios and its components have functioned properly. These features are defined as:
a. Host and Service Monitoring - Nagios is able to detect a problem with the network device. b. Configuration Interface - NagiosQL is functioning properly in accommodating and defining Host Definition, Service Definition, and Command Definition. c. Visualization of Network - Nagvis function well in making maps logical, geographically, and physically from network devices. d. Reporting with Graphic - PNP4Nagios it works to create graphs from performance data gathered by Nagios process.
5.2 Suggestion 1. Adding a definition for the Nagios command to gather data via SNMP Traps. 2. Doing research deeper to what data can be collected via SNMP. 3. Developing one's own scripting Nagios. 4. Make a complete Help menu for usage-based network monitoring system Nagios. 5. Monitoring of existing data center at BPPT-PDIS.
6. REFERENCE
Andi.(2005). Menjadi Administrator Jaringan Komputer. Wahana Komputer, Semarang. Barth, W.(2006) Nagios System And Network Monitoring. No Starch Press. San Francisco. Black, U.(1995).Network Management Standards: SNMP, CMIP, TMN, MIBs, and object
libraries. McGraw-Hill, Inc BPPT.(2012).Technical Note nomor 10-1.9.01-TN-0.2.1.2-24 Tentang Desain untuk Kerja
Monitoring Router. BPPT-PDIS Serpong. BPPT.(2012).Technical Note nomor 10-1.9.01-TN-0.2.1.2-49 Tentang Desain Kerja Monitoring
Firewall. BPPT-PDIS Serpong. BPPT.(2012).Technical Note nomor 10-1.9.01-TN-0.2.1.2-47 Tentang Desain Untuk Kerja
Monitoring Switch. BPPT-PDIS Serpong. Bradley Mitchell.(2012)Apache Web Server.11-15-2012
http://compnetworking.about.com/cs/webservers/g/bldef_apache.htm Chendramata, A. Priyambobo, A(2011).Nagios : Open Source Network Management System.
Kementerian Komunikasi dan Informatika Feibel, W.(1996). The Network Press Encyclopedia Of Networking. SYNEX Inc. Hall, J.A.(2008). Introduction to Accounting Information Systems 7th Edition. Cengage
Learning. Joerg Linge.(2012).PNP4Nagios.11-15-2012 http://docs.pnp4nagios.org/pnp-0.6/start Josephsen, D.(2007). Building A Monitoring Infrastructure With Nagios. Pearson Education,
Inc. Kaushik, A.(2010). Use Of Open Source Technologies For Enterprise Server Monitoring Using
SNMP. International Journal, 2. Kocjan, W.(2008). Learning Nagios 3.0.Packt Publishing. Leinwand, A. Fang Conroy, Ka.(1996). Network Management A Practical Perspective. Wesley
Longman, Inc Miah, W.(2010).Monitoring Scientific Computing Infrastructure Using Nagios. Merilainen, K. Lemmetyninen, A.(2011). Destination Network Management: A Conceptual
Analysis. Tourism Review. Mongkolluksamee, S. Strengths and Limitations of Nagios as a Network Monitoring Solution.
In Proceedings of the 7th International Joint Conference on Computer Science and Software Engineering (JCSSE 2010) Vol (Vol. 1, pp. 96-101).
Oracle Corporation.(2012).MySQL.11-1.2012 http://www.mysql.com/why-mysql/

Pervila, M. A.(2007). Using Nagios to Monitor Faults in a Self-Healing Environment. In Seminar on Self-Healing Systems, University of Helsinki.
Rouven Homann.(2012).NagioSQL.11-15-2012 http://www.nagiosql.org/ Rosenberg, D. Stephens, M.(2007). Use Case Driven Object Modelling with UML. Appress Schubert, M. Bennett, D. Gines, J. Hay, A. Strand, J.(2008).Nagios 3 Enterprise Network
Monitoring Including Plug-Ins and Hardware Devices.Syngress Publishing, Inc, Burlington.
Subramanian, M.(1999). Network Management: Principles and practice: An Introduction to Principles and Practice. Addison Wesley.
Tanenbaum, A.(2003). Computer Network, Fourth Edition. Prentice Hall. The PHP Group.(2012).PHP Hypertext Preprocessor.10-23.2012 http://php.net/ Tobias Oetiker.(2011).RRDtool.11-15-2012 http://oss.oetiker.ch/rrdtool/ Turnbull, J.(2006). Pro Nagios 2.0. Apress. Suite. Zeltserman, David.(1999). A Practical Guide to SNMPv3 and Network Management. Prentice-
Hall, Inc.