pengumuman equity research pt gunawan dianjaya steel … filepefindo credit rating indonesia...
TRANSCRIPT

PENGUMUMAN Equity Research
PT Gunawan Dianjaya Steel Tbk (GDST) (Tercatat di Papan: Pengembangan)
Peng-ER-00022/BEI.PPR/11-2012 (dapat dilihat di internet : http://www.idx.co.id)
PT Bursa Efek Indonesia pada tanggal 8 November 2012 telah menerima surat melalui email dari PT Pemeringkat Efek Indonesia dengan No.1804/PEF-DIR/XI/2012 tanggal 7 November 2012, perihal Publikasi Laporan Penilaian Target Harga Referensi Saham PT Gunawan Dianjaya Steel Tbk sebagaimana terlampir. (lampiran 23 lembar) Demikian pemberitahuan yang disampaikan PT Pemeringkat Efek Indonesia
8 November 2012
Nunik Gigih Ujiani Andre PJ. Toelle P. H. Kepala Divisi Penilaian Perusahaan
Sektor Riil Kepala Divisi Perdagangan Saham
Tembusan: 1. Yth. Ketua Badan Pengawas Pasar Modal dan LK; 2. Yth. Kepala Biro Transaksi dan Lembaga Efek, Bapepam dan LK; 3. Yth. Kepala Biro PKP Sektor Riil, Bapepam dan LK; 4. Yth. Pusat Referensi Pasar Modal; 5. Yth. Direktur Indonesian Capital Market Electronic Library; 6. Yth. Direksi PT Gunawan Dianjaya Steel Tbk.
AFi_GDST_er_20121012_00022

PEFINDO CREDIT RATING INDONESIA
1804/PEF-DIR/XI/2012
Jakarta, 7 November 2012
Kepada Yth.1. PT Gunawan Dianjaya Steel TbkJI. Margomulyo No. 29AGreges-Asemrowo, SurabayaJawa Timur60183
u.p. Bapak Saiful Fuad, Direktur
2. PT Bursa Efek IndonesiaGedung Bursa Efek IndonesiaJI. Jend. Sudirman Kav 52-53Jakarta Selatan, 12190
u.p. Bapak Ito Warsito, Direktur utama:Bapak Hoesen, Direktur Penilaian Perusahaan
Perihal: Publikasi Laporan Penilaian Target Harga Referensi Saham PT GunawanDianjaya Steel Tbk.
Dengan hormat,
Sehubungan dengan penugasan yang kami peroleh untuk melakukan Penilaian Target HargaReferensi Saham, dengan ini kami sampaikan hasil penilaian kami atas saham PT Gunawan DianjayaSteel Tbk (GDST) dalam versi Bahasa Indonesia dan Bahasa Inggris.
Apabila masih ada hat-hat yang memerlukan penjelasan lebih lanjut, mohon agar menghubungi kami.Atas perhatian dan kerjasamanya, kami ucapkan terima kasih.
Hormat kami,
Ronald T. Andi Kasim, CFADirektur Utama
Y se Rizalirektur
Tembusan : Bapak I Gede Nyoman Yetna, Kepala Divisi Pencatatan Sektor Riil, PT Bursa EfekIndonesia
/ma

Halaman 1 dari 11
Kontak: Equity & Index Valuation Division Phone: (6221) 7278 2380 [email protected]
“Pernyataan disclaimer pada halaman akhir
merupakan bagian yang tidak terpisahkan dari
dokumen ini”
www.pefindo.com
Gunawan Dianjaya Steel, Tbk Laporan Kedua
Equity Valuation
6 November 2012
Target Harga
Terendah Tertinggi 115 130
Baja
Kinerja Saham
0
20
40
60
80
100
120
140
160
0
500
1.000
1.500
2.000
2.500
3.000
3.500
4.000
4.500
5.000
Oct-11 Dec-11 Feb-12 Apr-12 Jun-12 Aug-12 Oct-12
GDSTIHSG
IHSG GDST Sumber: Bloomberg, Pefindo Divisi Valuasi Saham & Indexing
Informasi Saham Rp Rp
Kode Saham GDST MICE
Harga Saham Per 5 November 2012 112 410
Harga Tertinggi 52 minggu terakhir 145 470
Harga Terendah 52 minggu terakhir 100 305
Kapitalisasi Pasar Tertinggi 52 minggu
(miliar) 1.566 426
Kapitalisasi Pasar Terendah 52 minggu (miliar)
820 153
Penilaian saham Sebelumnya Saat ini
Tertinggi 150 130
Terendah 125 115
Market Value Added & Market Risk
0,8
0,8
0,9
0,9
0,9
0,9
0,9
1,0
1,0
1,0
1,0
0
10
20
30
40
50
60
70
1H11 1H12
MVA Market risk
Sumber: Bloomberg, Pefindo Divisi Valuasi Saham & Indexing
Pemegang saham (%)
Kellywood Holdings limited 51,37
Bavarian Venture Investment Ltd 35,94
PT Jaya Pari Steel Tbk 8,29
PT Betonjaya Manunggal 2,29
Publik (masing-masing dibawah 5%
kepemilikan) 2,11
Peningkatan Kapasitas Produksi untuk Mengerek Pertumbuhan
v
PT Gunawan Dianjaya Steel Tbk ("GDST") adalah perusahaan yang bergerak dalam industri pelat baja canai panas. GDST didirikan pada tahun 1989 di Surabaya dan memulai operasinya pada akhir 1991. Pada dasarnya, target pasar GDST meliputi sekitar 70% untuk pasar ekspor dan sisanya untuk domestik. Dalam melayani pelanggannya, GDST menyediakan beberapa ragam produk, yaitu: pelat baja untuk
penggunaan umum, pelat baja untuk boiler dan pressure vessel serta pelat baja untuk galangan kapal. Untuk ketebalannya, umumnya berkisar antara 8,0 mm sampai 80 mm, dan memiliki rentang lebar dari 1.200
mm sampai 2.500 mm, sedangkan panjangnya umumnya dari 2.400 mm sampai 12.000 mm dan beratnya mencapai 7,4 m/ton per pelat baja. Pembeli pelat baja biasanya dari kontraktor galangan kapal, perusahaan konstruksi, otomotif, perdagangan baja internasional, dan perusahaan
alat berat. Pabrik GDST terletak di atas lahan seluas 20 hektar dan dilengkapi oleh fasilitas produksi dengan teknologi tinggi yaitu mesin 4 high-rolling. Setelah menjalankan revitalisasi mesin yang dimulai dengan penggantian motor utama dalam mesin rolling, saat ini kapasitas produksi GDST telah mencapai 480.000 ton per tahun, dan secara bertahap akan meningkat menjadi 550.000 ton per tahun.
“Pernyataan disclaimer pada halaman
akhir merupakan bagian tak
terpisahkan dari dokumen ini”
www.pefindo.com
Gunawan Dianjaya Steel, Tbk
6 November 2012 Halaman 2 dari 11
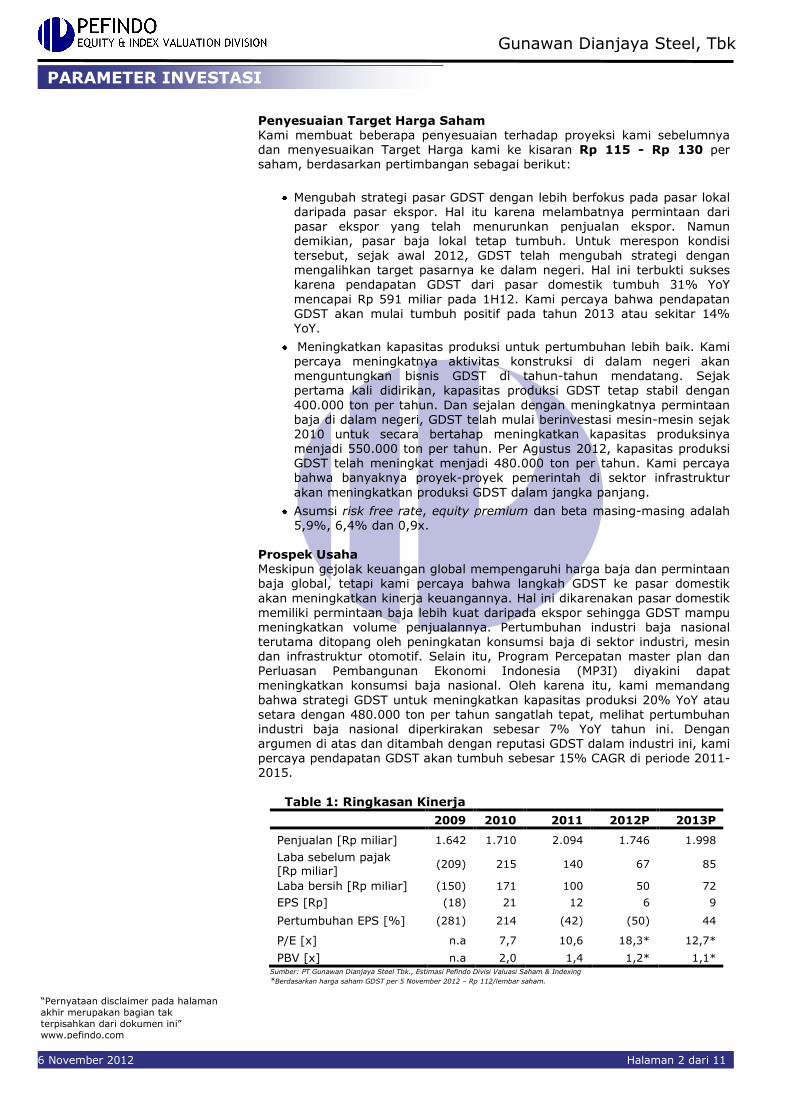
Penyesuaian Target Harga Saham Kami membuat beberapa penyesuaian terhadap proyeksi kami sebelumnya dan menyesuaikan Target Harga kami ke kisaran Rp 115 - Rp 130 per saham, berdasarkan pertimbangan sebagai berikut:
Mengubah strategi pasar GDST dengan lebih berfokus pada pasar lokal daripada pasar ekspor. Hal itu karena melambatnya permintaan dari pasar ekspor yang telah menurunkan penjualan ekspor. Namun demikian, pasar baja lokal tetap tumbuh. Untuk merespon kondisi tersebut, sejak awal 2012, GDST telah mengubah strategi dengan mengalihkan target pasarnya ke dalam negeri. Hal ini terbukti sukses karena pendapatan GDST dari pasar domestik tumbuh 31% YoY
mencapai Rp 591 miliar pada 1H12. Kami percaya bahwa pendapatan GDST akan mulai tumbuh positif pada tahun 2013 atau sekitar 14% YoY.
Meningkatkan kapasitas produksi untuk pertumbuhan lebih baik. Kami
percaya meningkatnya aktivitas konstruksi di dalam negeri akan menguntungkan bisnis GDST di tahun-tahun mendatang. Sejak pertama kali didirikan, kapasitas produksi GDST tetap stabil dengan
400.000 ton per tahun. Dan sejalan dengan meningkatnya permintaan baja di dalam negeri, GDST telah mulai berinvestasi mesin-mesin sejak 2010 untuk secara bertahap meningkatkan kapasitas produksinya menjadi 550.000 ton per tahun. Per Agustus 2012, kapasitas produksi GDST telah meningkat menjadi 480.000 ton per tahun. Kami percaya bahwa banyaknya proyek-proyek pemerintah di sektor infrastruktur
akan meningkatkan produksi GDST dalam jangka panjang.
Asumsi risk free rate, equity premium dan beta masing-masing adalah 5,9%, 6,4% dan 0,9x.
Prospek Usaha Meskipun gejolak keuangan global mempengaruhi harga baja dan permintaan baja global, tetapi kami percaya bahwa langkah GDST ke pasar domestik
akan meningkatkan kinerja keuangannya. Hal ini dikarenakan pasar domestik
memiliki permintaan baja lebih kuat daripada ekspor sehingga GDST mampu meningkatkan volume penjualannya. Pertumbuhan industri baja nasional terutama ditopang oleh peningkatan konsumsi baja di sektor industri, mesin dan infrastruktur otomotif. Selain itu, Program Percepatan master plan dan Perluasan Pembangunan Ekonomi Indonesia (MP3I) diyakini dapat meningkatkan konsumsi baja nasional. Oleh karena itu, kami memandang
bahwa strategi GDST untuk meningkatkan kapasitas produksi 20% YoY atau setara dengan 480.000 ton per tahun sangatlah tepat, melihat pertumbuhan industri baja nasional diperkirakan sebesar 7% YoY tahun ini. Dengan argumen di atas dan ditambah dengan reputasi GDST dalam industri ini, kami percaya pendapatan GDST akan tumbuh sebesar 15% CAGR di periode 2011-2015.
Table 1: Ringkasan Kinerja
2009 2010 2011 2012P 2013P
Penjualan [Rp miliar] 1.642 1.710 2.094 1.746 1.998
Laba sebelum pajak [Rp miliar]
(209) 215 140 67 85
Laba bersih [Rp miliar] (150) 171 100 50 72
EPS [Rp] (18) 21 12 6 9
Pertumbuhan EPS [%] (281) 214 (42) (50) 44
P/E [x] n.a 7,7 10,6 18,3* 12,7*
PBV [x] n.a 2,0 1,4 1,2* 1,1* Sumber: PT Gunawan Dianjaya Steel Tbk., Estimasi Pefindo Divisi Valuasi Saham & Indexing
*Berdasarkan harga saham GDST per 5 November 2012 – Rp 112/lembar saham.
PARAMETER INVESTASI
“Disclaimer statement in the last page
is an integral part of this report”
www.pefindo.com
Gunawan Dianjaya Steel, Tbk
6 November 2012 Page 3 of 11
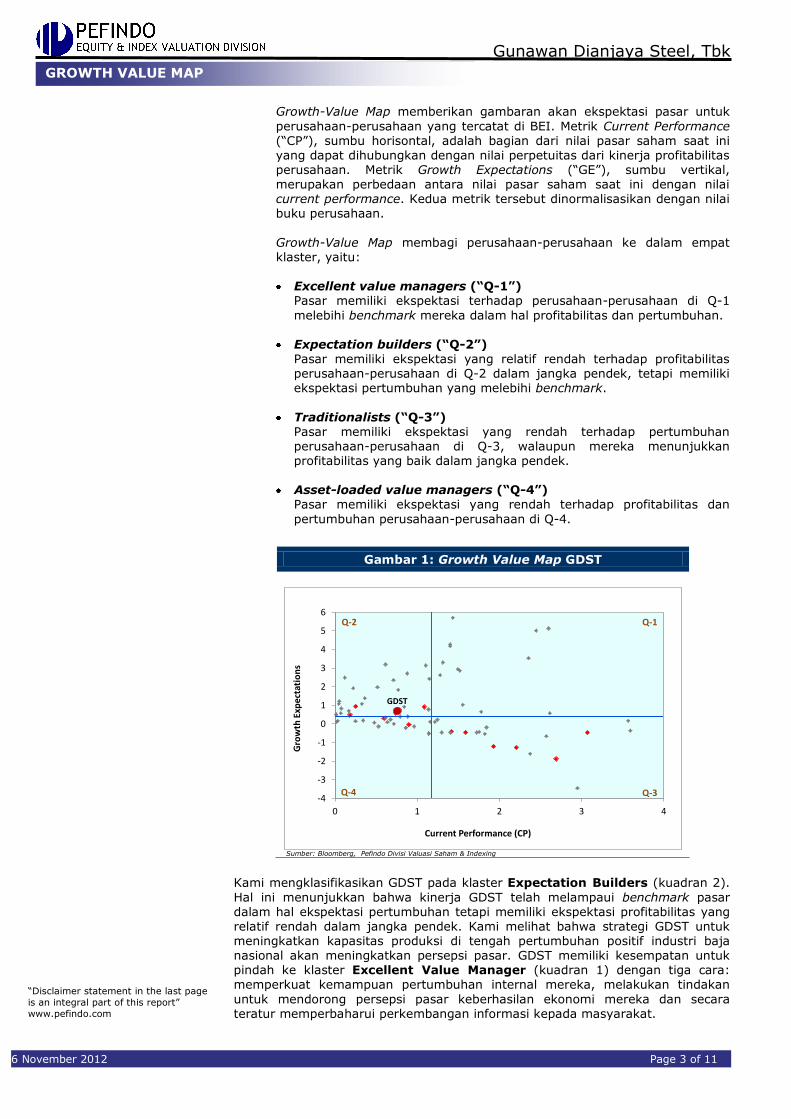
Growth-Value Map memberikan gambaran akan ekspektasi pasar untuk
perusahaan-perusahaan yang tercatat di BEI. Metrik Current Performance (“CP”), sumbu horisontal, adalah bagian dari nilai pasar saham saat ini yang dapat dihubungkan dengan nilai perpetuitas dari kinerja profitabilitas perusahaan. Metrik Growth Expectations (“GE”), sumbu vertikal, merupakan perbedaan antara nilai pasar saham saat ini dengan nilai current performance. Kedua metrik tersebut dinormalisasikan dengan nilai buku perusahaan.
Growth-Value Map membagi perusahaan-perusahaan ke dalam empat klaster, yaitu:
Excellent value managers (“Q-1”)
Pasar memiliki ekspektasi terhadap perusahaan-perusahaan di Q-1
melebihi benchmark mereka dalam hal profitabilitas dan pertumbuhan. Expectation builders (“Q-2”)
Pasar memiliki ekspektasi yang relatif rendah terhadap profitabilitas perusahaan-perusahaan di Q-2 dalam jangka pendek, tetapi memiliki ekspektasi pertumbuhan yang melebihi benchmark.
Traditionalists (“Q-3”) Pasar memiliki ekspektasi yang rendah terhadap pertumbuhan perusahaan-perusahaan di Q-3, walaupun mereka menunjukkan profitabilitas yang baik dalam jangka pendek.
Asset-loaded value managers (“Q-4”)
Pasar memiliki ekspektasi yang rendah terhadap profitabilitas dan
pertumbuhan perusahaan-perusahaan di Q-4.
Kami mengklasifikasikan GDST pada klaster Expectation Builders (kuadran 2).
Hal ini menunjukkan bahwa kinerja GDST telah melampaui benchmark pasar dalam hal ekspektasi pertumbuhan tetapi memiliki ekspektasi profitabilitas yang relatif rendah dalam jangka pendek. Kami melihat bahwa strategi GDST untuk meningkatkan kapasitas produksi di tengah pertumbuhan positif industri baja nasional akan meningkatkan persepsi pasar. GDST memiliki kesempatan untuk pindah ke klaster Excellent Value Manager (kuadran 1) dengan tiga cara: memperkuat kemampuan pertumbuhan internal mereka, melakukan tindakan
untuk mendorong persepsi pasar keberhasilan ekonomi mereka dan secara teratur memperbaharui perkembangan informasi kepada masyarakat.
Gambar 1: Growth Value Map GDST
-4
-3
-2
-1
0
1
2
3
4
5
6
0 1 2 3 4
Gro
wth
Exp
ecta
tio
ns
Current Performance (CP)
GDST
Q-1
Q-3
Q-2
Q-4
Sumber: Bloomberg, Pefindo Divisi Valuasi Saham & Indexing
GROWTH VALUE MAP

“Pernyataan disclaimer pada halaman
akhir merupakan bagian tak
terpisahkan dari dokumen ini”
www.pefindo.com
Gunawan Dianjaya Steel, Tbk
6 November 2012 Halaman 4 dari 11
Perkembangan Ekonomi Indonesia: Tetap Kuat di tengah Krisis Global
Pertumbuhan ekonomi Indonesia yang mencapai 6,4% YoY di 1H12 telah menarik banyak perusahaan asing untuk berinvestasi di dalam negeri. Kami
memperkirakan bahwa pertumbuhan ekonomi Indonesia bisa mencapai 6,2% YoY di akhir 2012. Seiring dengan inflasi terjaga sebesar 4,53% YoY di 1H12, suku bunga acuan yang rendah (BI Rate) sebesar 5,75%, dan PDB per kapita yang dapat menembus level USD 4.000, proyek Master Plan Percepatan dan Perluasan Pembangunan Ekonomi Indonesia (MP3EI) serta industri otomotif yang diperkirakan akan tumbuh 12% YoY tahun ini, kami percaya bahwa GDST memiliki kesempatan yang lebih luas untuk memperkuat penjualannya di pasar
domestik. Strategi yang Tepat untuk Menyasar Pasar Domestik GDST dikenal sebagai perusahaan yang berorientasi ekspor, yang mencakup tiga benua, antara lain: Asia, Eropa dan Australia. Karena terdapat ketidakpastian ekonomi global, sehingga permintaan baja global juga semakin lemah. Di sisi
lain, kami mencatat bahwa pasar domestik memiliki prospek yang lebih baik
daripada ekspor karena ada sejumlah aktivitas pembangunan baik dari pemerintah maupun swasta yang selanjutnya akan meningkatkan volume penjualan baja. Oleh karena itu untuk mempertahankan pertumbuhan pendapatan, GDST telah mengalihkan pasarnya ke domestik sejak awal 2012. Perubahan strategi tersebut terbukti sukses seperti yang tercermin dari kinerjanya di 1H12, di mana pendapatan dari dalam negeri melonjak sebesar
31% YoY atau mencapai Rp 591 miliar. Sejalan dengan pasar baja Indonesia yang diperkirakan tumbuh 7% YoY dengan tahun ini, kami memperkirakan pendapatan GDST dari dalam negeri dapat mencapai Rp 1.207 miliar di 2012, atau mencerminkan pertumbuhan sebesar 30% YoY dibandingkan dengan
periode 2011.
Gambar 2: Pendapatan GDST Berdasarkan Segmen Geografis dan Gambaran Industri Baja di Indonesia
0
200
400
600
800
1.000
1.200
2009 2010 2011 1H11 1H12
895
1.009
1.167
704
325
749 702
926
451
591
Rp miliar
Ekspor Domestik
0
1
2
3
4
5
6
7
8
9
2007 2008 2009 2010 2011
6,9
7,8
5,7
7,58,3
4,55,3
3,7
5,25,7
2,4 2,51,9 2,3
2,6
da
lam
ju
ta
to
n
Konsumsi Produksi Impor
Sumber: Beberapa sumber diolah oleh Pefindo., Pefindo Divisi Valuasi Saham & Indexing
Penurunan Harga Harga Baja Saat ini, produsen baja menghadapi pelemahan harga baja. Meskipun industri baja telah pulih sejak krisis keuangan global di 2008, tetapi krisis utang dari zona Eropa saat ini telah menciptakan banyak ketidakpastian di pasar. Ketidakpastian
kondisi makro ekonomi tersebut telah membuat negara-negara lain untuk melakukan sejumlah langkah-langkah penghematan.
INFORMASI USAHA
“Pernyataan disclaimer pada halaman
akhir merupakan bagian tak
terpisahkan dari dokumen ini”
www.pefindo.com
Gunawan Dianjaya Steel, Tbk
6 November 2012 Halaman 5 dari 11
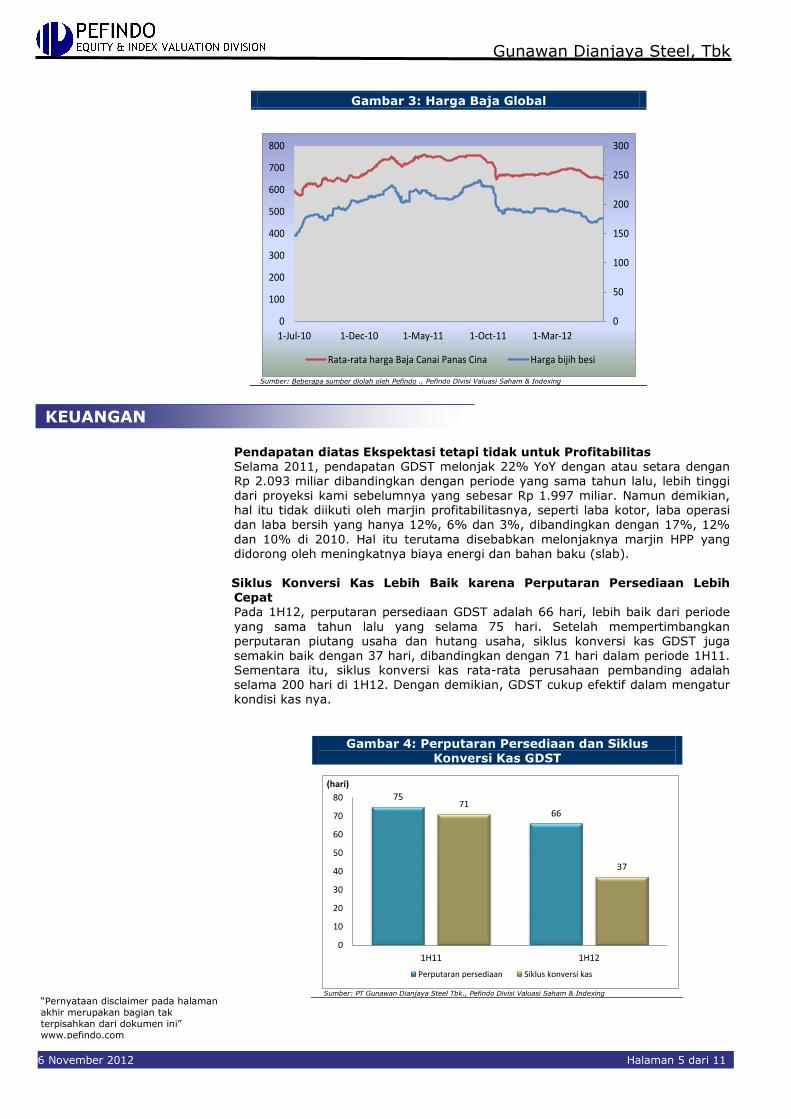
Gambar 3: Harga Baja Global
0
50
100
150
200
250
300
0
100
200
300
400
500
600
700
800
1-Jul-10 1-Dec-10 1-May-11 1-Oct-11 1-Mar-12
Rata-rata harga Baja Canai Panas Cina Harga bijih besi
Sumber: Beberapa sumber diolah oleh Pefindo ., Pefindo Divisi Valuasi Saham & Indexing
Pendapatan diatas Ekspektasi tetapi tidak untuk Profitabilitas
Selama 2011, pendapatan GDST melonjak 22% YoY dengan atau setara dengan Rp 2.093 miliar dibandingkan dengan periode yang sama tahun lalu, lebih tinggi dari proyeksi kami sebelumnya yang sebesar Rp 1.997 miliar. Namun demikian, hal itu tidak diikuti oleh marjin profitabilitasnya, seperti laba kotor, laba operasi dan laba bersih yang hanya 12%, 6% dan 3%, dibandingkan dengan 17%, 12%
dan 10% di 2010. Hal itu terutama disebabkan melonjaknya marjin HPP yang didorong oleh meningkatnya biaya energi dan bahan baku (slab).
Siklus Konversi Kas Lebih Baik karena Perputaran Persediaan Lebih Cepat
Pada 1H12, perputaran persediaan GDST adalah 66 hari, lebih baik dari periode
yang sama tahun lalu yang selama 75 hari. Setelah mempertimbangkan perputaran piutang usaha dan hutang usaha, siklus konversi kas GDST juga semakin baik dengan 37 hari, dibandingkan dengan 71 hari dalam periode 1H11. Sementara itu, siklus konversi kas rata-rata perusahaan pembanding adalah selama 200 hari di 1H12. Dengan demikian, GDST cukup efektif dalam mengatur kondisi kas nya.
Gambar 4: Perputaran Persediaan dan Siklus Konversi Kas GDST
75
6671
37
0
10
20
30
40
50
60
70
80
1H11 1H12
(hari)
Perputaran persediaan Siklus konversi kas
Sumber: PT Gunawan Dianjaya Steel Tbk., Pefindo Divisi Valuasi Saham & Indexing
KEUANGAN

“Pernyataan disclaimer pada halaman
akhir merupakan bagian tak
terpisahkan dari dokumen ini”
www.pefindo.com
Gunawan Dianjaya Steel, Tbk
6 November 2012 Halaman 6 dari 11
Penambahan Kapasitas Produksi untuk Pertumbuhan Masa Depan Sejalan dengan meningkatnya permintaan baja di dalam negeri, GDST telah mulai berinvestasi mesin-mesin sejak 2010 untuk secara bertahap meningkatkan
kapasitas produksinya menjadi 550.000 ton per tahun. Pada Agustus 2012, kapasitas produksi GDST telah ditingkatkan menjadi 480.000 ton per tahun. Kami
percaya bahwa banyaknya proyek-proyek pemerintah pada sektor infrastruktur akan mendorong produksi GDST dalam jangka panjang.
Prospek Usaha GDST Meskipun gejolak keuangan global mempengaruhi harga baja dan permintaan baja global, tetapi kami percaya bahwa langkah GDST ke pasar domestik akan meningkatkan kinerja keuangannya. Hal ini dikarenakan pasar domestik memiliki
permintaan baja lebih kuat daripada ekspor sehingga GDST mampu meningkatkan volume penjualannya. Pertumbuhan industri baja nasional terutama ditopang oleh peningkatan konsumsi baja di sektor industri, mesin dan infrastruktur otomotif. Selain itu, Program Percepatan master plan dan Perluasan Pembangunan Ekonomi Indonesia (MP3I) diyakini dapat meningkatkan konsumsi baja nasional. Oleh karena itu, kami memandang bahwa strategi GDST untuk meningkatkan kapasitas
produksi YoY 20% atau setara dengan 480.000 ton per tahun sangatlah tepat,
melihat pertumbuhan industri baja nasional diperkirakan sebesar 7% YoY tahun ini. Dengan argumen di atas dan ditambah dengan reputasi GDST dalam industri ini, kami percaya pendapatan GDST akan tumbuh sebesar 15% CAGR di periode 2011-2015.
Gambar 5: Estimasi Pendapatan GDST
-
500
1.000
1.500
2.000
2.500
2012P 2013P 2014P 2016P
1.746
1.998
2.229 2.494 Rp miliar
Pendapatan GDST
Sumber: PT Gunawan Dianjaya Steel Tbk., Estimasi Pefindo Divisi Valuasi Saham & Indexing

“Pernyataan disclaimer pada halaman
akhir merupakan bagian tak
terpisahkan dari dokumen ini”
www.pefindo.com
Gunawan Dianjaya Steel, Tbk
6 November 2012 Halaman 7 dari 11
Tabel 2: Ringkasan Kinerja GDST dan Perusahaan Pembanding per Juni
2012
Sumber: Bloomberg, PT Gunawan Dianjaya Steel Tbk, PT Betonjaya Manunggal Tbk, PT Jayapari Steel Tbk., Pefindo Divisi
Valuasi Saham & Indexing
GDST BTON JPRS Rata-rata
Penjualan [Rp, miliar] 916 85 166
Laba Kotor [Rp, miliar] 82 16 11
Laba Operasi [Rp, miliar] 38 18 3
Laba Bersih [Rp, miliar] 24 14 4
Total Aset [Rp, miliar] 1.099 142 434
Total Kewajiban [Rp, miliar] 329 40 93
Total Ekuitas [Rp, miliar] 771 102 341
Pertumbuhan YoY
Penjualan [%] (21) 25 (49) (12)
Laba Kotor [%] (56) 45 (77) (16)
Laba Operasi [%] (70) 100 (93) 4
Laba Bersih [%] (77) 133 (87) 23
Profitabilitas
Marjin Laba Kotor [%] 9 19 7 13
Marjin Laba Operasi [%] 4 21 2 11
Marjin Laba Bersih [%] 3 16 2 9
ROA [%] 2 10 1 5
ROE [%] 3 14 1 7
Leverage
DER [x] 0,43 0,39 0,27 0,33
PERBANDINGAN INDUSTRI

“Pernyataan disclaimer pada halaman
akhir merupakan bagian tak
terpisahkan dari dokumen ini”
www.pefindo.com
Gunawan Dianjaya Steel, Tbk
6 November 2012 Halaman 8 dari 11
VALUASI
Metodologi Kami mengaplikasikan metode Discounted Cash Flow (DCF) sebagai metode
penilaian utama dengan pertimbangan bahwa pertumbuhan pendapatan adalah merupakan faktor yang sangat mempengaruhi nilai (value driver) GDST jika dibandingkan dengan metode pertumbuhan aset. Selanjutnya, kami juga mengaplikasikan metode Guideline Company Method (GCM) sebagai metode pembanding lainnya.
Penilaian ini berdasarkan pada nilai 100% saham GDST per 5 November
2012, menggunakan laporan keuangan GDST per 30 Juni 2012 sebagai dasar dilakukannya analisa fundamental.
Estimasi Nilai
Kami menggunakan Cost of Capital sebesar 11,4% dan Cost of Equity
sebesar 11,4% berdasarkan asumsi-asumsi berikut:
Table 3: Asumsi
Risk free rate [%]* 5,8 Risk premium [%]* 6,8 Beta [x]* 0,8 Cost of Equity [%] 11,4 Marginal tax rate [%] 25,0 Debt to Equity Ratio [x] 0,43
WACC [%] 11,4 Sumber: Bloomberg, Estimasi Pefindo Divisi Valuasi Saham & Indexing *Catatan: Per 5 November 2012
Estimasi Target harga referensi saham untuk 12 bulan berdasarkan posisi
penilaian pada tanggal 5 November 2012 adalah sebagai berikut:
Dengan menggunakan metode DCF dan asumsi tingkat diskonto
11,4% adalah sebesar Rp 130 - Rp 140 per saham. Dengan menggunakan metode GCM method (PBV 1,11x and P/E
12,60x) adalah sebesar Rp 80 - Rp 110 per saham.
Untuk mendapatkan nilai yang mewakili kedua indikasi nilai tersebut dilakukan rekonsiliasi dengan dilakukan pembobotan terhadap kedua metode tersebut sebesar 70% untuk DCF dan 30%untuk metode GCM. Berdasarkan hasil perhitungan diatas, maka Estimasi Target harga referensi saham GDST untuk 12 bulan adalah Rp 115 - Rp 130 per lembar saham.
Tabel 4: Ringkasan Penilaian dengan Metode DCF
Konservatif Moderat Agresif
PV of Free Cash Flows [Rp miliar] 157 165 174 PV Terminal Value [Rp miliar] 620 653 686 Non-Operating Asset [Rp miliar] 280 280 280 Net Debt [Rp miliar] - - - Total Equity Value [Rp miliar] 1.056 1.099 1.140
Number of Share [juta saham] 8.200 8.200 8.200 Fair Value per Share [Rp] 130 135 140
Sumber: Estimasi Pefindo Divisi Valuasi Saham & Indexing
TARGET HARGA

“Pernyataan disclaimer pada halaman
akhir merupakan bagian tak
terpisahkan dari dokumen ini”
www.pefindo.com
Gunawan Dianjaya Steel, Tbk
6 November 2012 Halaman 9 dari 11
Tabel 5: Perbandingan GCM
GDST BTON JPRS Rata2
Valuasi, 5 November 2012
P/E, [x] 13,10 5,25 19,44 12,60
P/BV, [x] 1,17 1,34 0,83 1,11
Sumber: Bloomberg, Estimasi Pefindo Divisi Valuasi Saham & Indexing
Tabel 6: Ringkasan Penilaian dengan Metode GCM
Kelipatan
(x)
Est. EPS
(Rp)
Est. BV/Share
(Rp)
Nilai
(Rp)
P/BV 1,11 - 97 110 P/E 12,60 6 - 80
Sumber: Bloomberg, Estimasi Pefindo Divisi Valuasi Saham & Indexing
Tabel 7: Nilai Wajar Rekonsiliasi
Nilai Wajar Per Saham [Rp]
DCF GCM Rata-rata
Batas atas 140 110 130
Batas bawah 130 80 115
Berat 70% 30%
Sumber: Bloomberg, Estimasi Pefindo Divisi Valuasi Saham & Indexing
“Disclaimer statement in the last page
is an integral part of this report”
www.pefindo.com
6 November 2012 Page 10 of 11
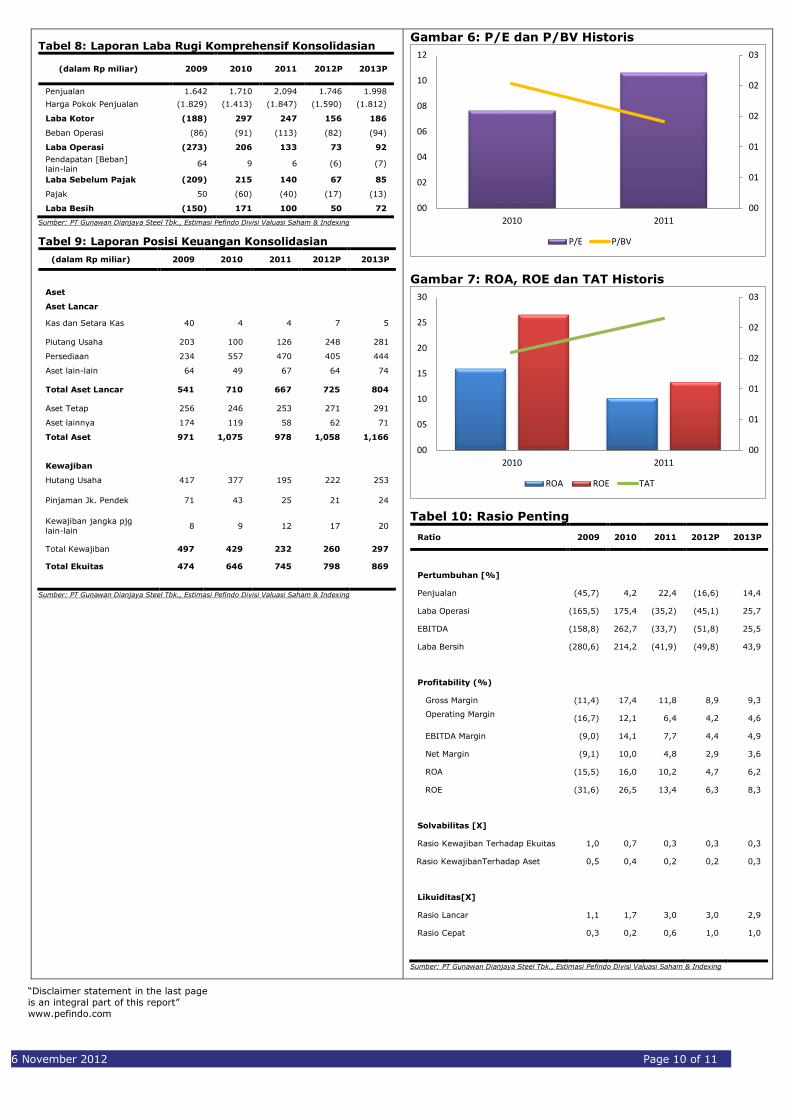
Tabel 8: Laporan Laba Rugi Komprehensif Konsolidasian
(dalam Rp miliar) 2009 2010 2011 2012P 2013P
Penjualan 1.642 1.710 2.094 1.746 1.998
Harga Pokok Penjualan (1.829) (1.413) (1.847) (1.590) (1.812)
Laba Kotor (188) 297 247 156 186
Beban Operasi (86) (91) (113) (82) (94)
Laba Operasi (273) 206 133 73 92
Pendapatan [Beban] lain-lain
64 9 6 (6) (7)
Laba Sebelum Pajak (209) 215 140 67 85
Pajak 50 (60) (40) (17) (13)
Laba Besih (150) 171 100 50 72
Sumber: PT Gunawan Dianjaya Steel Tbk., Estimasi Pefindo Divisi Valuasi Saham & Indexing
Tabel 9: Laporan Posisi Keuangan Konsolidasian
(dalam Rp miliar) 2009 2010 2011 2012P 2013P
Aset
Aset Lancar
Kas dan Setara Kas 40 4 4 7 5
Piutang Usaha 203 100 126 248 281
Persediaan 234 557 470 405 444
Aset lain-lain 64 49 67 64 74
Total Aset Lancar 541 710 667 725 804
Aset Tetap 256 246 253 271 291
Aset lainnya 174 119 58 62 71
Total Aset 971 1,075 978 1,058 1,166
Kewajiban
Hutang Usaha 417 377 195 222 253
Pinjaman Jk. Pendek 71 43 25 21 24
Kewajiban jangka pjg
lain-lain 8 9 12 17 20
Total Kewajiban 497 429 232 260 297
Total Ekuitas 474 646 745 798 869
Sumber: PT Gunawan Dianjaya Steel Tbk., Estimasi Pefindo Divisi Valuasi Saham & Indexing
Gambar 6: P/E dan P/BV Historis
00
01
01
02
02
03
00
02
04
06
08
10
12
2010 2011
P/E P/BV
Gambar 7: ROA, ROE dan TAT Historis
00
01
01
02
02
03
00
05
10
15
20
25
30
2010 2011
ROA ROE TAT
Tabel 10: Rasio Penting
Ratio 2009 2010 2011 2012P 2013P
Pertumbuhan [%]
Penjualan (45,7) 4,2 22,4 (16,6) 14,4
Laba Operasi (165,5) 175,4 (35,2) (45,1) 25,7
EBITDA (158,8) 262,7 (33,7) (51,8) 25,5
Laba Bersih (280,6) 214,2 (41,9) (49,8) 43,9
Profitability (%)
Gross Margin (11,4) 17,4 11,8 8,9 9,3
Operating Margin
(16,7) 12,1 6,4 4,2 4,6
EBITDA Margin (9,0) 14,1 7,7 4,4 4,9
Net Margin (9,1) 10,0 4,8 2,9 3,6
ROA (15,5) 16,0 10,2 4,7 6,2
ROE (31,6) 26,5 13,4 6,3 8,3
Solvabilitas [X]
Rasio Kewajiban Terhadap Ekuitas 1,0 0,7 0,3 0,3 0,3
Rasio KewajibanTerhadap Aset 0,5 0,4 0,2 0,2 0,3
Likuiditas[X]
Rasio Lancar 1,1 1,7 3,0 3,0 2,9
Rasio Cepat 0,3 0,2 0,6 1,0 1,0
Sumber: PT Gunawan Dianjaya Steel Tbk., Estimasi Pefindo Divisi Valuasi Saham & Indexing

“Pernyataan disclaimer pada halaman
akhir merupakan bagian tak
terpisahkan dari dokumen ini”
www.pefindo.com
Gunawan Dianjaya Steel, Tbk
6 November 2012 Halaman 11 dari 11
DISCLAIMER
Laporan ini dibuat berdasarkan sumber-sumber yang kami anggap terpercaya dan dapat
diandalkan, Namun kami tidak menjamin kelengkapan, keakuratan atau kecukupannya, Dengan demikian kami tidak bertanggung jawab atas segala keputusan investasi yang diambil
berdasarkan laporan ini, Adapun asumsi, opini, dan perkiraan merupakan hasil dari pertimbangan internal kami per tanggal penilaian (cut-off date), dan kami dapat mengubah pertimbangan diatas sewaktu-waktu tanpa pemberitahuan terlebih dahulu. Kami tidak bertanggung jawab atas kekeliruan atau kelalaian yang terjadi akibat penggunaan laporan ini, Kinerja dimasa lalu tidak selalu dapat dijadikan acuan hasil masa depan, Laporan ini bukan merupakan rekomendasi penawaran, pembelian atau menahan suatu saham tertentu ,
Laporan ini mungkin tidak sesuai untuk beberapa investor, Seluruh opini dalam laporan ini telah disampaikan dengan itikad baik, namun sewaktu-waktu dapat berubah tanpa pemberitahuan terlebih dahulu, dan disajikan dengan benar per tanggal diterbitkan laporan ini , Harga, nilai, atau pendapatan dari setiap saham Perseroan yang disajikan dalam laporan ini kemungkinan dapat lebih rendah dari harapan pemodal, dan pemodal juga mungkin mendapatkan pengembalian yang lebih rendah dari nilai investasi yang ditanamkan, Investasi didefinisikan
sebagai pendapatan yang kemungkinan besar diterima dimasa depan, namun nilai dari
pendapatan yang akan diterima tersebut kemungkinan besar juga akan berfluktuasi , Untuk saham Perseroan yang penyajian laporan keuangannya didenominasi dalam mata uang selain Rupiah, perubahan nilai tukar mata uang tersebut kemungkinan dapat menurunkan nilai, harga, atau pendapatan investasi pemodal, Informasi dalam laporan ini bukan merupakan pertimbangan pajak dalam mengambil suatu keputusan investasi .
Target harga saham dalam Laporan ini merupakan nilai fundamental, bukan merupakan Nilai Pasar Wajar, dan bukan merupakan harga acuan transaksi yang diwajibkan oleh peraturan perundang-undangan yang berlaku. Laporan target harga saham yang diterbitkan oleh Pefindo Divisi Valuasi Saham dan Indexing bukan merupakan rekomendasi untuk membeli, menjual, atau menahan suatu saham tertentu, dan tidak dapat dianggap sebagai nasehat investasi oleh Pefindo Divisi Valuasi Saham dan
Indexing yang behubungan dengan cakupan Jasa Pefindo kepada, atau kaitannya kepada, beberapa pihak, termasuk emiten, penasehat keuangan, pialang saham, investment banks, institusi keuangan dan perantara keuangan, dalam kaitannya menerima imbalan atau keuntungan lainnya dari pihak tersebut.
Laporan ini tidak ditujukan untuk pemodal tertentu dan tidak dapat dijadikan bagian da ri tujuan
investasi terhadap suatu saham dan juga bukan merupakan rekomendasi investasi terhadap suatu saham tertentu atau suatu strategi investasi, Sebelum melakukan tindakan dari hasil laporan ini, pemodal disarankan untuk mempertimbangkan terlebih dahulu kesesuaian situasi dan kondisi dan, jika dibutuhkan, mintalah bantuan penasehat keuangan. PEFINDO memisahkan kegiatan Valuasi Saham dengan kegiatan Pemeringkatan untuk menjaga independensi dan objektivitas dari proses dan produk kegiatan analitis , PEFINDO telah
menetapkan kebijakan dan prosedur untuk menjaga kerahasiaan informasi non-publik tertentu yang diterima sehubungan dengan proses analitis, Keseluruhan proses, metodologi dan database yang digunakan dalam penyusunan Laporan Target Harga Referensi Saham ini secara keseluruhan adalah berbeda dengan proses, metodologi dan database yang digunakan PEFINDO dalam melakukan pemeringkatan. Laporan ini dibuat dan disiapkan Pefindo Divisi Valuasi Saham & Indexing dengan tujuan untuk
meningkatkan transparansi harga saham yang tercatat di Bursa Efek Indonesia, Laporan ini
juga bebas dari pengaruh tekanan atau paksaan dari Bursa maupun Perseroan yang dinilai , Pefindo Divisi Valuasi Saham & Indexing akan menerima imbalan sebesar Rp . 20.000.000,- masing-masing dari Bursa Efek Indonesia dan Perseroan yang dinilai untuk 2 (dua) kali pelaporan per tahun, Untuk keterangan lebih lanjut, dapat mengunjungi website kami di http://www,pefindo,com
Laporan ini dibuat dan disiapkan oleh Pefindo Divisi Valuasi Saham dan Indexing, Di Indonesia Laporan ini dipublikasikan pada website kami dan juga pada website Bursa Efek Indonesia .

Page 1 of 11
Contact: Equity & Index Valuation Division Phone: (6221) 7278 2380 [email protected]
“Disclaimer statement in the last page is an
integral part of this report”
www.pefindo.com
Gunawan Dianjaya Steel, Tbk Secondary Report
Equity Valuation
November 6th, 2012
Target Price
Low High 115 130
Steel
Historical Chart
0
20
40
60
80
100
120
140
160
0
500
1.000
1.500
2.000
2.500
3.000
3.500
4.000
4.500
5.000
Oct-11 Dec-11 Feb-12 Apr-12 Jun-12 Aug-12 Oct-12
GDSTJCI
JCI GDST Source: Bloomberg
Stock Information Rp
Ticker code GDST
Market price as of November 5th 2012 112
Market price – 52 week high 145
Market price – 52 week low 100
Market cap – 52 week high (bn) 1,566
Market cap – 52 week low (bn) 820
Stock Valuation Last Current
High 150 130
Low 125 115
Market Value Added & Market Risk
0,8
0,8
0,9
0,9
0,9
0,9
0,9
1,0
1,0
1,0
1,0
0
10
20
30
40
50
60
70
1H11 1H12
MVA Market risk
Source: Bloomberg, Pefindo Equity & Index Valuation Division
Shareholders (%)
Kellywood Holdings limited 51.37
Bavarian Venture Investment Ltd 35.94
PT Jaya Pari Steel Tbk 8.29
PT Betonjaya Manunggal 2.29
Public (each below 5% ownership) 2.11
Additional Production Capacity to Hoist Growth
PT Gunawan Dianjaya Steel Tbk (“GDST”) is company that engaged in hot rolled steel plate industry. GDST was established in 1989 in Surabaya and started its operations at the end of 1991. Basically, GDST’s target market is covering around 70% for export market and the rest is for domestic. In serving the customers, GDST provides several ranges of
products, namely: steel plates for general use, steel plates for boilers and pressure vessels use and shipbuilding steel plates. In term of thickness, it usually ranges from 8.0 mm to 80 mm, and it has width range from
1,200 mm to 2,500 mm, while its length range usually from 2,400 mm to 12,000 mm and the weight are up to 7.4 m/tons per steel plate. These steel plate products buyers are usually from shipyard contractor, construction companies, automotive, international steel trading, and
heavy equipment companies. GDST’s plant is located on approximately 20-hectare areas and equipped by production facilities with high technology of 4 high-rolling machines. After running the revitalization of the machines that begins with the replacement of main motors in rolling machines, currently GDST’s production capacity has reached 480,000 tons per year, and will gradually increase to 550,000 tons per year in coming years.
“Disclaimer statement in the last page
is an integral part of this report”
www.pefindo.com
Gunawan Dianjaya Steel, Tbk
3 November 6th, 2012 Page 2 of 11
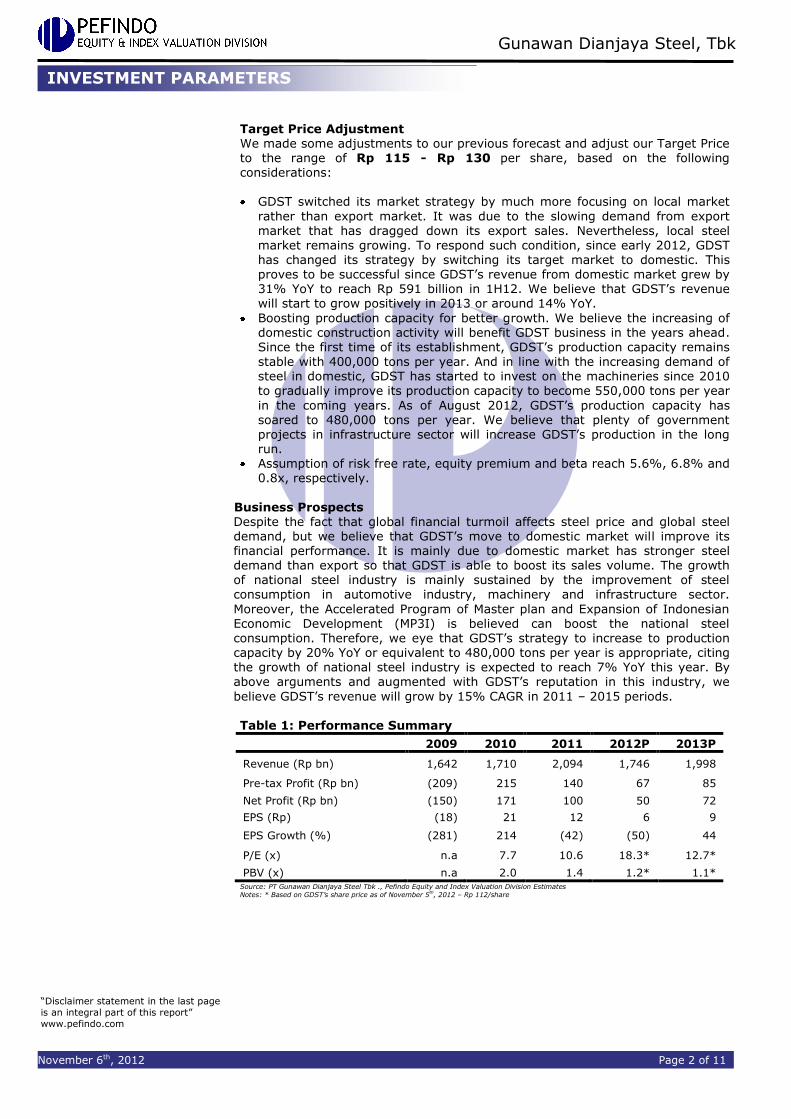
Target Price Adjustment We made some adjustments to our previous forecast and adjust our Target Price to the range of Rp 115 - Rp 130 per share, based on the following considerations:
GDST switched its market strategy by much more focusing on local market
rather than export market. It was due to the slowing demand from export market that has dragged down its export sales. Nevertheless, local steel market remains growing. To respond such condition, since early 2012, GDST has changed its strategy by switching its target market to domestic. This proves to be successful since GDST’s revenue from domestic market grew by 31% YoY to reach Rp 591 billion in 1H12. We believe that GDST’s revenue will start to grow positively in 2013 or around 14% YoY.
Boosting production capacity for better growth. We believe the increasing of domestic construction activity will benefit GDST business in the years ahead. Since the first time of its establishment, GDST’s production capacity remains
stable with 400,000 tons per year. And in line with the increasing demand of steel in domestic, GDST has started to invest on the machineries since 2010 to gradually improve its production capacity to become 550,000 tons per year
in the coming years. As of August 2012, GDST’s production capacity has soared to 480,000 tons per year. We believe that plenty of government projects in infrastructure sector will increase GDST’s production in the long run.
Assumption of risk free rate, equity premium and beta reach 5.6%, 6.8% and 0.8x, respectively.
Business Prospects Despite the fact that global financial turmoil affects steel price and global steel demand, but we believe that GDST’s move to domestic market will improve its financial performance. It is mainly due to domestic market has stronger steel demand than export so that GDST is able to boost its sales volume. The growth of national steel industry is mainly sustained by the improvement of steel consumption in automotive industry, machinery and infrastructure sector.
Moreover, the Accelerated Program of Master plan and Expansion of Indonesian Economic Development (MP3I) is believed can boost the national steel consumption. Therefore, we eye that GDST’s strategy to increase to production capacity by 20% YoY or equivalent to 480,000 tons per year is appropriate, citing the growth of national steel industry is expected to reach 7% YoY this year. By above arguments and augmented with GDST’s reputation in this industry, we
believe GDST’s revenue will grow by 15% CAGR in 2011 – 2015 periods.
Table 1: Performance Summary
2009 2010 2011 2012P 2013P
Revenue (Rp bn) 1,642 1,710 2,094 1,746 1,998
Pre-tax Profit (Rp bn) (209) 215 140 67 85
Net Profit (Rp bn) (150) 171 100 50 72
EPS (Rp) (18) 21 12 6 9
EPS Growth (%) (281) 214 (42) (50) 44
P/E (x) n.a 7.7 10.6 18.3* 12.7*
PBV (x) n.a 2.0 1.4 1.2* 1.1* Source: PT Gunawan Dianjaya Steel Tbk ., Pefindo Equity and Index Valuation Division Estimates Notes: * Based on GDST’s share price as of November 5
th, 2012 – Rp 112/share
INVESTMENT PARAMETERS
“Disclaimer statement in the last page
is an integral part of this report”
www.pefindo.com
Gunawan Dianjaya Steel, Tbk
November 6th, 2012 Page 3 of 11
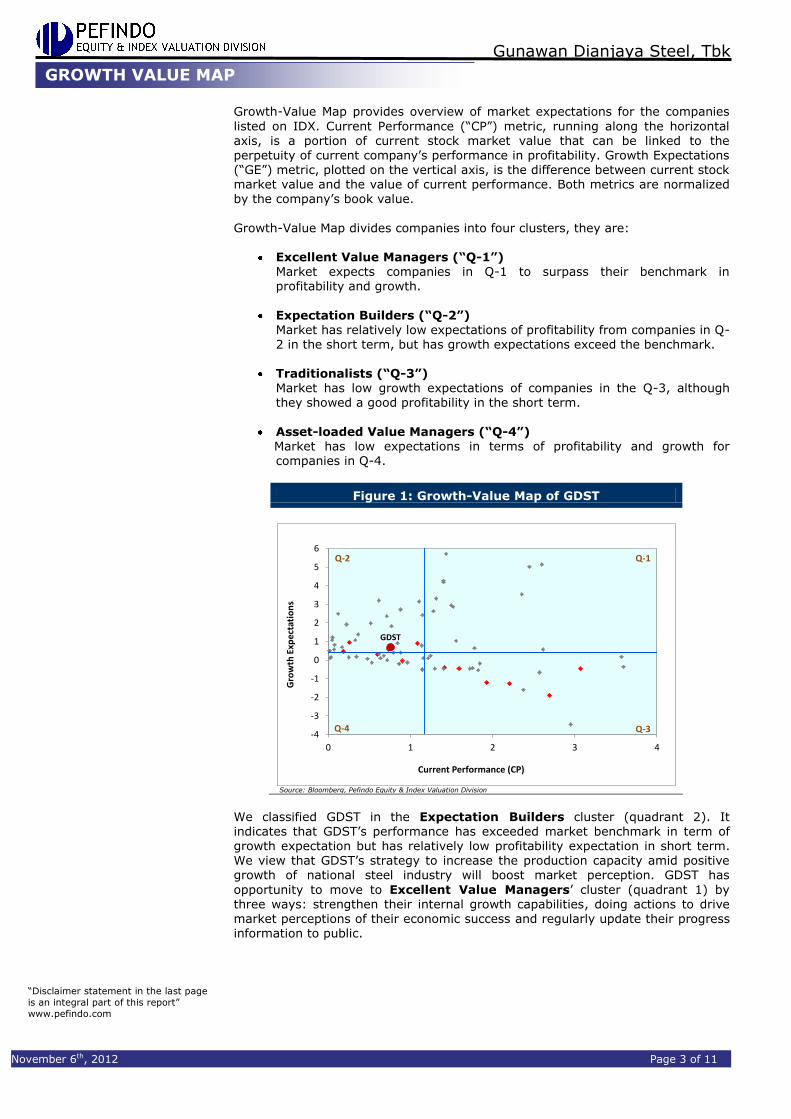
Growth-Value Map provides overview of market expectations for the companies
listed on IDX. Current Performance (“CP”) metric, running along the horizontal axis, is a portion of current stock market value that can be linked to the perpetuity of current company’s performance in profitability. Growth Expectations (“GE”) metric, plotted on the vertical axis, is the difference between current stock market value and the value of current performance. Both metrics are normalized by the company’s book value.
Growth-Value Map divides companies into four clusters, they are:
Excellent Value Managers (“Q-1”) Market expects companies in Q-1 to surpass their benchmark in profitability and growth.
Expectation Builders (“Q-2”) Market has relatively low expectations of profitability from companies in Q-2 in the short term, but has growth expectations exceed the benchmark.
Traditionalists (“Q-3”)
Market has low growth expectations of companies in the Q-3, although they showed a good profitability in the short term.
Asset-loaded Value Managers (“Q-4”) Market has low expectations in terms of profitability and growth for companies in Q-4.
Figure 1: Growth-Value Map of GDST
-4
-3
-2
-1
0
1
2
3
4
5
6
0 1 2 3 4
Gro
wth
Exp
ecta
tio
ns
Current Performance (CP)
GDST
Q-1
Q-3
Q-2
Q-4
Source: Bloomberg, Pefindo Equity & Index Valuation Division
We classified GDST in the Expectation Builders cluster (quadrant 2). It indicates that GDST’s performance has exceeded market benchmark in term of
growth expectation but has relatively low profitability expectation in short term. We view that GDST’s strategy to increase the production capacity amid positive growth of national steel industry will boost market perception. GDST has
opportunity to move to Excellent Value Managers’ cluster (quadrant 1) by three ways: strengthen their internal growth capabilities, doing actions to drive market perceptions of their economic success and regularly update their progress information to public.
GROWTH VALUE MAP
“Disclaimer statement in the last page
is an integral part of this report”
www.pefindo.com
Gunawan Dianjaya Steel, Tbk
3 November 6th, 2012 Page 4 of 11
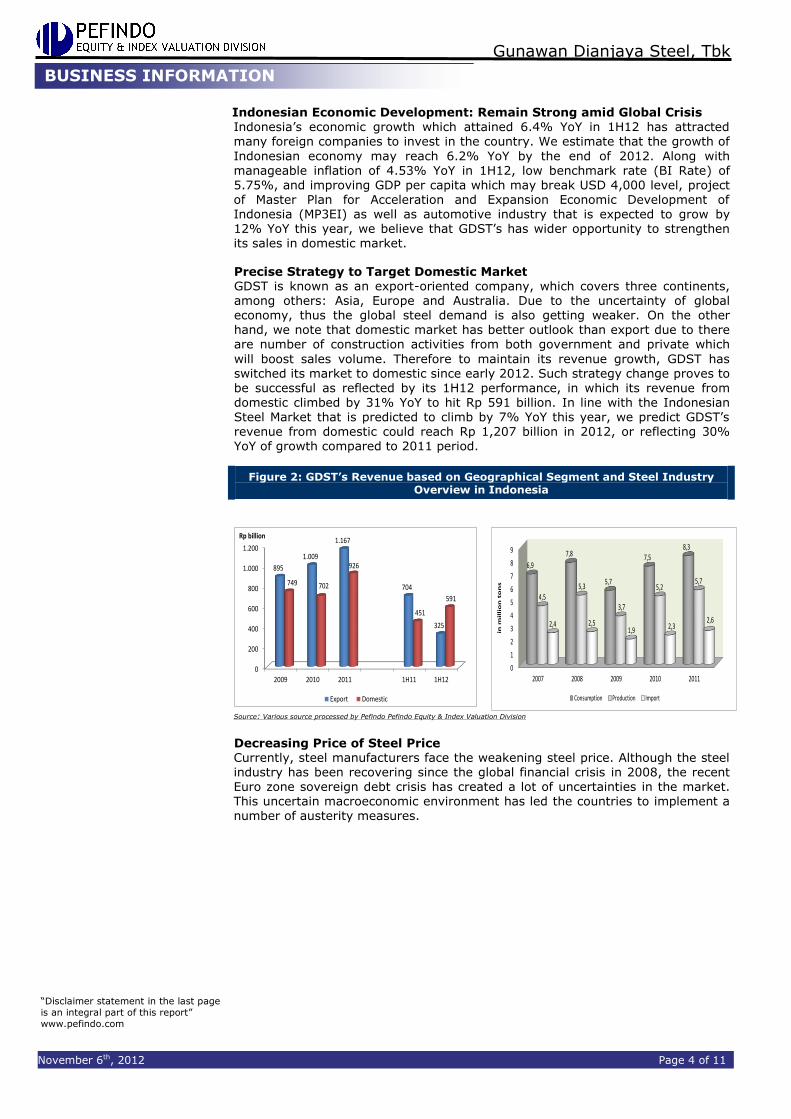
Indonesian Economic Development: Remain Strong amid Global Crisis
Indonesia’s economic growth which attained 6.4% YoY in 1H12 has attracted many foreign companies to invest in the country. We estimate that the growth of
Indonesian economy may reach 6.2% YoY by the end of 2012. Along with manageable inflation of 4.53% YoY in 1H12, low benchmark rate (BI Rate) of 5.75%, and improving GDP per capita which may break USD 4,000 level, project of Master Plan for Acceleration and Expansion Economic Development of Indonesia (MP3EI) as well as automotive industry that is expected to grow by 12% YoY this year, we believe that GDST’s has wider opportunity to strengthen its sales in domestic market. Precise Strategy to Target Domestic Market GDST is known as an export-oriented company, which covers three continents, among others: Asia, Europe and Australia. Due to the uncertainty of global economy, thus the global steel demand is also getting weaker. On the other hand, we note that domestic market has better outlook than export due to there are number of construction activities from both government and private which
will boost sales volume. Therefore to maintain its revenue growth, GDST has switched its market to domestic since early 2012. Such strategy change proves to be successful as reflected by its 1H12 performance, in which its revenue from domestic climbed by 31% YoY to hit Rp 591 billion. In line with the Indonesian Steel Market that is predicted to climb by 7% YoY this year, we predict GDST’s revenue from domestic could reach Rp 1,207 billion in 2012, or reflecting 30% YoY of growth compared to 2011 period.
Figure 2: GDST’s Revenue based on Geographical Segment and Steel Industry Overview in Indonesia
0
200
400
600
800
1.000
1.200
2009 2010 2011 1H11 1H12
895
1.009
1.167
704
325
749 702
926
451
591
Rp billion
Export Domestic
0
1
2
3
4
5
6
7
8
9
2007 2008 2009 2010 2011
6,9
7,8
5,7
7,58,3
4,55,3
3,7
5,25,7
2,4 2,51,9 2,3
2,6
in m
illi
on
to
ns
Consumption Production Import
Source: Various source processed by Pefindo Pefindo Equity & Index Valuation Division
Decreasing Price of Steel Price Currently, steel manufacturers face the weakening steel price. Although the steel industry has been recovering since the global financial crisis in 2008, the recent Euro zone sovereign debt crisis has created a lot of uncertainties in the market. This uncertain macroeconomic environment has led the countries to implement a number of austerity measures.
BUSINESS INFORMATION

“Disclaimer statement in the last page
is an integral part of this report”
www.pefindo.com
Gunawan Dianjaya Steel, Tbk
3 November 6th, 2012 Page 5 of 11
Figure 3: Global Steel Price
0
50
100
150
200
250
300
0
100
200
300
400
500
600
700
800
1-Jul-10 1-Dec-10 1-May-11 1-Oct-11 1-Mar-12
Average price of China Domestic Hot Rolled Steel Iron ore spot price
Source: PT Gunawan Dianjaya Steel Tbk., Pefindo Equity & Index Valuation Division
Revenue was Above Expectation but not for Profitability
During 2011, GDST’s revenue soared by 22% YoY or equivalent to Rp 2,093 billion compared to the same period last year, higher than our previous projection which was Rp 1,997 billion. Nevertheless, it was not followed by its profitability margins, as the gross, operating and net profit margins were only 12%, 6% and 3%, compared to 17%, 12% and 10% in 2010. It was mainly due to soaring of COGS margin which was bolstered by the increasing of energy cost and raw material (slab).
Better Cash Coversion Cycle due to Faster Inventory Turnover In 1H12, GDST’s inventory turnover was 66 days, better than the same period last year which was 75 days. After considering the turnover of trade receivable
and trade payable, GDST’s cash conversion cycle was also getting better with 37 days, compared to 71 days in 1H11 period. Meanwhile, its peers cash conversion cycle was high as 200 days in 1H12. Accordingly, GDST is quite effective in
managing its cash condition.
Figure 4: GDST’s Inventory Turnover and Cash
Conversion Cycle
75
6671
37
0
10
20
30
40
50
60
70
80
1H11 1H12
(days)
Inventory turnover Cash conversion cycle
Source: PT Gunawan Dianjaya Steel Tbk., Pefindo Equity & Index Valuation Division
Additional Production Capacity for Future Growth In line with the increasing demand of steel in domestic, GDST has started to invest the machineries since 2010 to gradually improve its production capacity to become 550,000 tons per year. As of August 2012, GDST’s production capacity has lifted up to 480,000 tons per year. We believe that plenty of government projects in infrastructure sector will increase GDST’s production in the long run.
FINANCE
“Disclaimer statement in the last page
is an integral part of this report”
www.pefindo.com
Gunawan Dianjaya Steel, Tbk
3 November 6th, 2012 Page 6 of 11
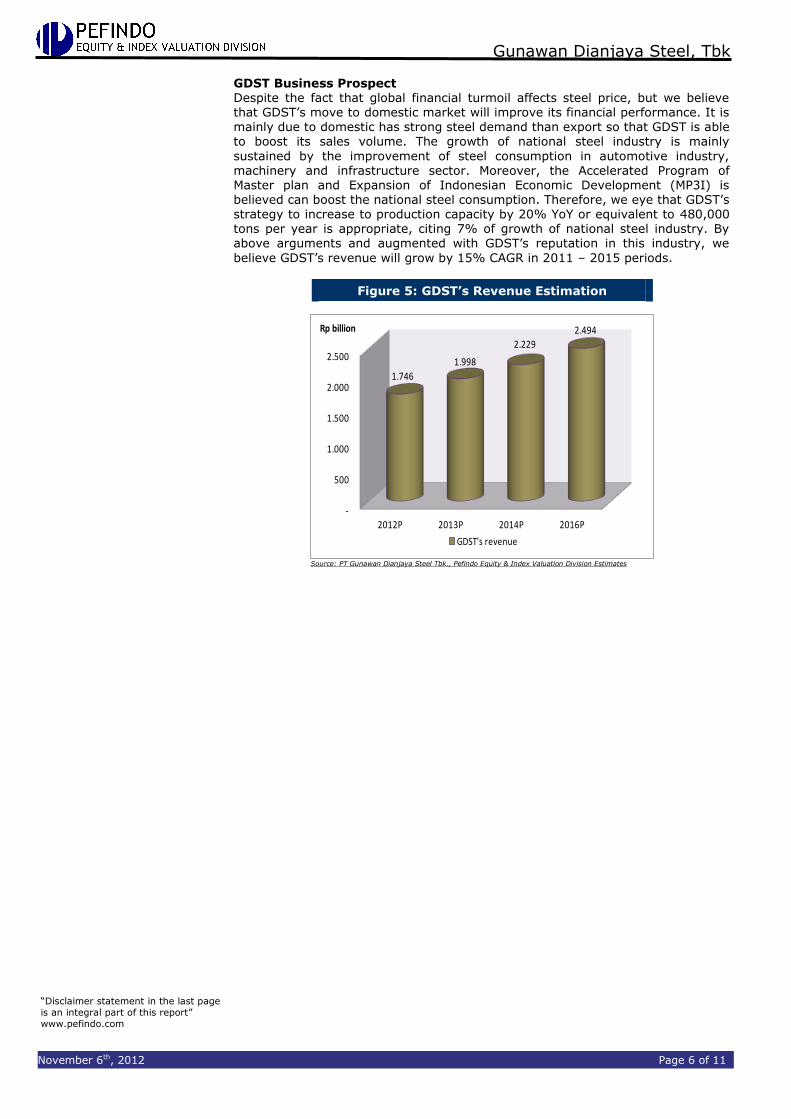
GDST Business Prospect Despite the fact that global financial turmoil affects steel price, but we believe that GDST’s move to domestic market will improve its financial performance. It is
mainly due to domestic has strong steel demand than export so that GDST is able to boost its sales volume. The growth of national steel industry is mainly
sustained by the improvement of steel consumption in automotive industry, machinery and infrastructure sector. Moreover, the Accelerated Program of Master plan and Expansion of Indonesian Economic Development (MP3I) is believed can boost the national steel consumption. Therefore, we eye that GDST’s strategy to increase to production capacity by 20% YoY or equivalent to 480,000 tons per year is appropriate, citing 7% of growth of national steel industry. By above arguments and augmented with GDST’s reputation in this industry, we
believe GDST’s revenue will grow by 15% CAGR in 2011 – 2015 periods.
Figure 5: GDST’s Revenue Estimation
-
500
1.000
1.500
2.000
2.500
2012P 2013P 2014P 2016P
1.746
1.998
2.229
2.494 Rp billion
GDST's revenue
Source: PT Gunawan Dianjaya Steel Tbk., Pefindo Equity & Index Valuation Division Estimates
“Disclaimer statement in the last page
is an integral part of this report”
www.pefindo.com
Gunawan Dianjaya Steel, Tbk
3 November 6th, 2012 Page 7 of 11
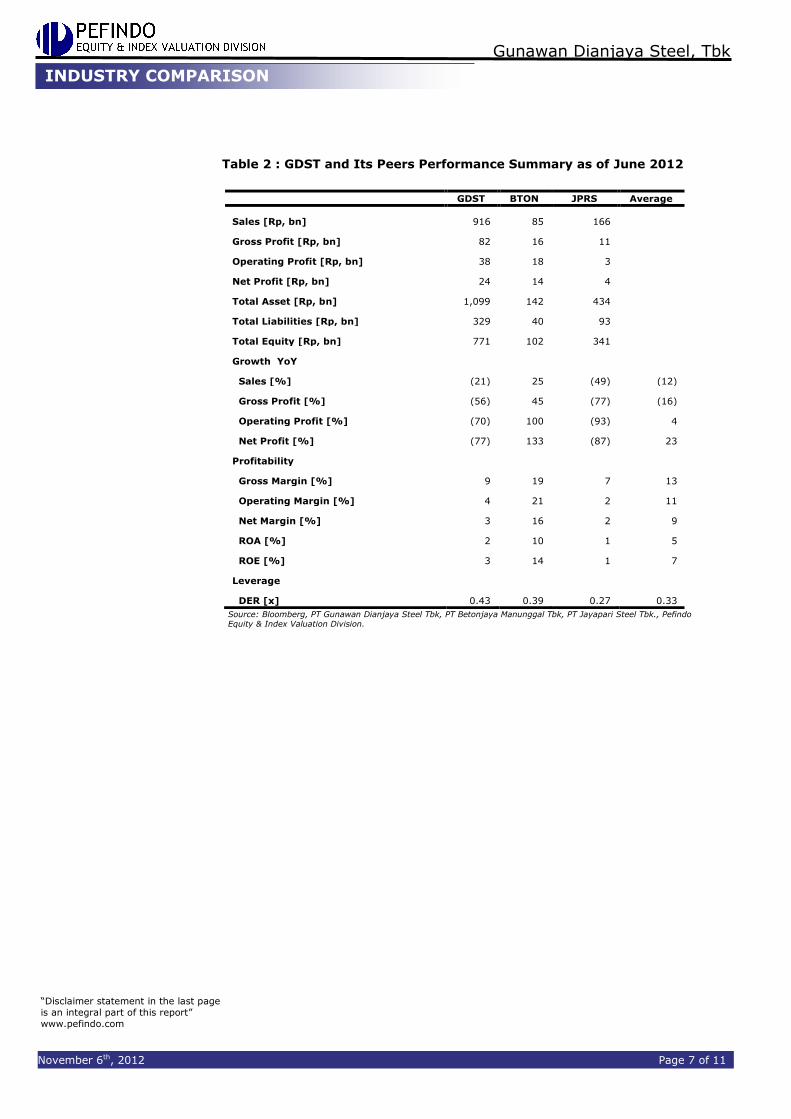
Table 2 : GDST and Its Peers Performance Summary as of June 2012
Source: Bloomberg, PT Gunawan Dianjaya Steel Tbk, PT Betonjaya Manunggal Tbk, PT Jayapari Steel Tbk., Pefindo Equity & Index Valuation Division.
GDST BTON JPRS Average
Sales [Rp, bn] 916 85 166
Gross Profit [Rp, bn] 82 16 11
Operating Profit [Rp, bn] 38 18 3
Net Profit [Rp, bn] 24 14 4
Total Asset [Rp, bn] 1,099 142 434
Total Liabilities [Rp, bn] 329 40 93
Total Equity [Rp, bn] 771 102 341
Growth YoY
Sales [%] (21) 25 (49) (12)
Gross Profit [%] (56) 45 (77) (16)
Operating Profit [%] (70) 100 (93) 4
Net Profit [%] (77) 133 (87) 23
Profitability
Gross Margin [%] 9 19 7 13
Operating Margin [%] 4 21 2 11
Net Margin [%] 3 16 2 9
ROA [%] 2 10 1 5
ROE [%] 3 14 1 7
Leverage
DER [x] 0.43 0.39 0.27 0.33
INDUSTRY COMPARISON

“Disclaimer statement in the last page
is an integral part of this report”
www.pefindo.com
Gunawan Dianjaya Steel, Tbk
3 November 6th, 2012 Page 8 of 11
VALUATION
Methodology
We apply Discounted Cash Flow (DCF) method as the main valuation approach considering the income growth is a value driver in GDST instead of asset growth. Furthermore, we also apply Guideline Company Method (GCM) as comparison method.
This valuation is based on 100% GDST’s shares price as of November 5th, 2012, using GDST’s financial report as of June 30th, 2012 for our fundamental analysis.
Value Estimation
We use Cost of Capital of 11.4% and Cost of Equity of 11.4% based on the following assumption:
Table 3: Assumption
Risk free rate [%]* 5.6 Risk premium [%]* 6.8 Beta [x]* 0.8 Cost of Equity [%] 11.4
Marginal tax rate [%] 25.0 Debt to Equity Ratio [x] 0.43 WACC [%] 11.4
Source: Bloomberg, Pefindo Equity & Index Valuation Division Estimates Notes: *As of November 5
th, 2012
Target price for 12 months based on valuation as per November 5th, 2012 is as follows:
Using DCF method with discount rate assumption 11.4% is Rp 130 - Rp 140 per share.
Using GCM method (PBV 1.11x and P/E 12.60x) is Rp 80 - Rp 110 per share.
In order to obtain a value which represents both value indications, we have weighted both DCF and GCM methods by 70%:30%.
Based on the above calculation, target price of GDST for 12 month is Rp 115 - Rp 130 per share. Table 4: Summary of DCF Method Valuation
Conservative Moderate Aggressive
PV of Free Cash Flows [Rp bn] 157 165 174 PV Terminal Value [Rp bn] 620 653 686 Non-Operating Assets- [Rp bn] 280 280 280 Net Debt [Rp bn] - - - Total Equity Value [Rp bn] 1,056 1,099 1,140 Number of Share [mn shares] 8,200 8,200 8,200 Fair Value per Share [Rp] 130 135 140 Source: Pefindo Equity & Index Valuation Division Estimates
TARGET PRICE

“Disclaimer statement in the last page
is an integral part of this report”
www.pefindo.com
Gunawan Dianjaya Steel, Tbk
3 November 6th, 2012 Page 9 of 11
Table 5: GCM Comparison
GDST BTON JPRS Average
Valuation, November 5th, 2012
P/E, [x] 13.10 5.25 19.44 12.60
P/BV, [x] 1.17 1.34 0.83 1.11
Source: Bloomberg, Pefindo Equity & Index Valuation Division Estimates
Table 6: Summary of GCM Valuation
Multiples
(x)
Est. EPS
(Rp)
Est. BV/Share
(Rp)
Value
(Rp)
P/BV 1.11 - 97 110 P/E 12.60 6 - 80
Source: Bloomberg, Pefindo Equity & Index Valuation Division Estimates
Table 7: Fair Value Reconciliation
Fair Value per Share [Rp]
DCF GCM Average
Upper limit 140 110 130
Bottom limit 130 80 115
Weight 70% 30%
Source: Pefindo Equity & Index Valuation Division Estimates

“Disclaimer statement in the last page
is an integral part of this report”
www.pefindo.com
Gunawan Dianjaya Steel, Tbk
3 November 6th, 2012 Page 10 of 11
Table 8: Income Statement
(in Rp billion) 2009 2010 2011 2012P 2013P
Sales 1,642 1,710 2,094 1,746 1,998
COGS (1,829) (1,413) (1,847) (1,590) (1,812)
Gross Profit (188) 297 247 156 186
Operating Expense (86) (91) (113) (82) (94)
Operating Profit (273) 206 133 73 92
Other Income (Charges) 64 9 6 (6) (7)
Pre-tax Profit (209) 215 140 67 85
Tax 50 (60) (40) (17) (13)
Net Profit (150) 171 100 50 72
Source: PT Gunawan Dianjaya Steel Tbk., Pefindo Equity and Index Valuation Division Estimates
Table 9: Balance Sheet
(in Rp billion) 2009 2010 2011 2012P 2013P
Assets
Current Assets
Cash & cash equivalents 40 4 4 7 5
Receivables 203 100 126 248 281
Inventory 234 557 470 405 444
Other Assets 64 49 67 64 74
Total Current Assets 541 710 667 725 804
Fixed Assets 256 246 253 271 291
Other Assets 174 119 58 62 71
Total Assets 971 1,075 978 1,058 1,166
Liabilities
Trade liabilities 417 377 195 222 253
Other liabilities 71 43 25 21 24
Long-term liabilities 8 9 12 17 20
Total Liabilities 497 429 232 260 297
Total Equity 474 646 745 798 869
Source: PT Gunawan Dianjaya Steel Tbk., Pefindo Equity and Index Valuation Division Estimates
Figure 6: Historical P/E and P/BV
00
01
01
02
02
03
00
02
04
06
08
10
12
2010 2011
P/E P/BV
Figure 7: Historical ROA, ROE and TAT
00
01
01
02
02
03
00
05
10
15
20
25
30
2010 2011
ROA ROE TAT
Table 10: Key Ratio
Ratio 2009 2010 2011 2012P 2013P
Growth (%)
Sales (45.7) 4.2 22.4 (16.6) 14.4
Operating Profit (165.5) 175.4 (35.2) (45.1) 25.7
EBITDA (158.8) 262.7 (33.7) (51.8) 25.5
Net Profit (280.6) 214.2 (41.9) (49.8) 43.9
Profitability (%)
Gross Margin (11.4) 17.4 11.8 8.9 9.3
Operating Margin
(16.7) 12.1 6.4 4.2 4.6
EBITDA Margin (9.0) 14.1 7.7 4.4 4.9
Net Margin (9.1) 10.0 4.8 2.9 3.6
ROA (15.5) 16.0 10.2 4.7 6.2
ROE (31.6) 26.5 13.4 6.3 8.3
Solvability (X)
Debt to Equity 1.0 0.7 0.3 0.3 0.3
Debt to Asset 0.5 0.4 0.2 0.2 0.3
Liquidity (X)
Current Ratio 1.1 1.7 3.0 3.0 2.9
Quick Ratio 0.3 0.2 0.6 1.0 1.0
Source: PT Gunawan Dianjaya Steel Tbk., Pefindo Equity and Index Valuation Division Estimates
“Disclaimer statement in the last page
is an integral part of this report”
www.pefindo.com
Gunawan Dianjaya Steel, Tbk
3 November 6th, 2012 Page 11 of 11
DISCLAIMER
This report was prepared based on the trusted and reliable sources. Nevertheless, we do not guarantee its completeness, accuracy and adequacy. Therefore we do not responsible of any investment decision making based on this report. As for any assumptions, opinions and predictions were solely our internal judgments as per reporting date, and those judgments are subject to change without further notice.
We do not responsible for mistake and negligence occurred by using this report. Last performance could not always be used as reference for future outcome. This report is not an offering recommendation, purchase or holds particular shares. This report might not be suitable for some investors. All opinion in this report has been presented fairly as per issuing date with good intentions; however it could be change at any time without further notice. The price, value or income from each share of the Company stated in this report might lower than the investor
expectation and investor might obtain lower return than the invested amount. Investment is defined as the probable income that will be received in the future; nonetheless such return may possibly fluctuate. As for the Company which its share is denominated other than Rupiah, the foreign exchange fluctuation may reduce the value, price or investor investment return. This
report does not contain any information for tax consideration in investment decision mak ing.
The share price target in this report is a fundamental value, not a fair market value nor a transaction price reference required by the regulations. The share price target issued by Pefindo Equity & Index Valuation Division is not a recommendation to buy, sell or hold particular shares and it could not be considered as an investment advice from Pefindo Equity & Index Valuation Division as its scope of service to, or in relation to some parties, including listed companies, financial advisor, broke r, investment
bank, financial institution and intermediary, in correlation with receiving rewards or any other benefits from that parties. This report is not intended for particular investor and cannot be used as part of investment objective on particular shares and neither an investment recommendation on particular shares or an investment strategy. We strongly recommended investor to consider the suitable situation and condition at first before making decision in relation with the figure in this report. I f it is
necessary, kindly contact your financial advisor.
PEFINDO keeps the activities of Equity Valuation separate from Ratings to preserve independence and objectivity of its analytical processes and products. PEFINDO has established policies and procedures to maintain the confidentiality of certain non-public information received in connection with each analytical process. The entire process, methodology and the
database used in the preparation of the Reference Share Price Target Report as a whole is different from the processes, methodologies and databases used PEFINDO in doing the rating. This report was prepared and composed by Pefindo Equity & Index Valuation Division with the objective to enhance shares price transparency of listed companies in Indonesia Stock Exchange (IDX). This report is also free of other party’s influence, pressure or force either from IDX or the listed company which reviewed by Pefindo Equity & Index Valuation Division. Pefindo Equity & Index Valuation
Division will earn reward amounting to Rp 20 mn each from IDX and the reviewed company for issuing report twice per year. For further information, please visit our website at http://www.pefindo.com This report is prepared and composed by Pefindo Equity & Index Valuation Division. In Indonesia, this report is published in our website and in IDX website .