peng-00005 bei-pg2 05-2014 - idx.co.id file“pernyataan disclaimer pada halaman akhir merupakan...
TRANSCRIPT


854/PEF-DIR/V/2014
Jakarta, 23 Mei 2014
Yang terhormat,1. Ibu Juliana Samudro, Direktur
PT Trikomsel Oke, TbkEquity Tower Lt. 30 SCBDLot.9JI. Jend. Sudirman Kav 52-53Jakarta 12190
2. Bapak Ito Warsito, Direktur UtamaBapak Hoesen, Direktur Penilaian PerusahaanPT Bursa Efek IndonesiaGedung Bursa Efek IndonesiaJI. Jend. Sudirman Kav 52-53Jakarta Selatan, 12190
Perihal: Publikasi Laporan Kedua Penilaian Target Harga Referensi Saham PT TrikomselOkeTbk
Dengan hormat,
Sehubungan dengan penugasan yang kami peroleh untuk melakukan Penilaian Target HargaReferensi Saham, dengan ini kami sampaikan hasil penilaian kami atas saham PT Trikomsel Oke Tbk(TRIO) dalam versi Bahasa Indonesia dan Bahasa Inggris.
Apabila masih ada hat-hat yang memerlukan penjelasan lebih lanjut, mohon agar menghubungi kami.Atas perhatian dan kerjasamanya, kami ucapkan terima kasih.
Hormat kami,
~Yohanes Arts Abimanyu ,Direktur
Tembusan : Ibu Umi Kulsum, Kepala Divisi Penilaian Perusahaan Sektor Jasa, PT Bursa Efek Indonesia
/ma
PT. Pemeringkat Efek IndonesiaPanin Tower Senayan City, 17th FloorJI. Asia Afrika Lot. 19, Jakarta 10270, INDONESIAPhone: (62-21) 7278 2380 • Fax: (62-21) 7278 2370
Halaman 1 dari 11
Kontak:
Equity & Index Valuation Division Phone: (6221) 7278 2380 [email protected] “Pernyataan disclaimer pada halaman akhir
merupakan bagian yang tidak terpisahkan dari
dokumen ini”
www.pefindo.com
Trikomsel Oke, Tbk Laporan Kedua
Equity Valuation
23 Mei 2014
Target Harga
Terendah Tertinggi 1.700 1.995
Perdagangan & Ritel
Kinerja Saham
0
300
600
900
1,200
1,500
1,800
2,100
2,400
0
500
1,000
1,500
2,000
2,500
3,000
3,500
4,000
4,500
5,000
5,500
May-13 Jul-13 Sep-13 Nov-13 Jan-14 Mar-14
TRIOJCI
JCI TRIO
Sumber: Bloomberg, PEFINDO Divisi Valuasi Saham &
Indexing
Informasi Saham Rp
Kode Saham TRIO
Harga Saham Per 22 Mei 2014 1.240
Harga Tertinggi 52 minggu terakhir 2.075
Harga Terendah 52 minggu terakhir 990
Kapitalisasi Pasar Tertinggi 52 minggu
(miliar) 9.880
Kapitalisasi Pasar Terendah 52 minggu (miliar) 4.714
Penilaian Saham Sebelumnya Saat ini
Tertinggi 1.940 1.995
Terendah 1.700 1.700
Market Value Added & Market Risk
-
0.20
0.40
0.60
0.80
1.00
1.20
-
100
200
300
400
500
600
700
800
900
1,000
2012 2013
Market Value Added (IDR) Market Risk (x)
Sumber:Bloomberg, PEFINDO Divisi Valuasi Saham & Indexing
Pemegang Saham
(%)
JP Morgan Bank Luxembourg 42,3
Canopus Finance Limited 25,7
Standard Chartered Private Equity 13,5
PT SL TRIO 9,4
Sugiono Wiyono Sugialam 1,2
Publik 7,9
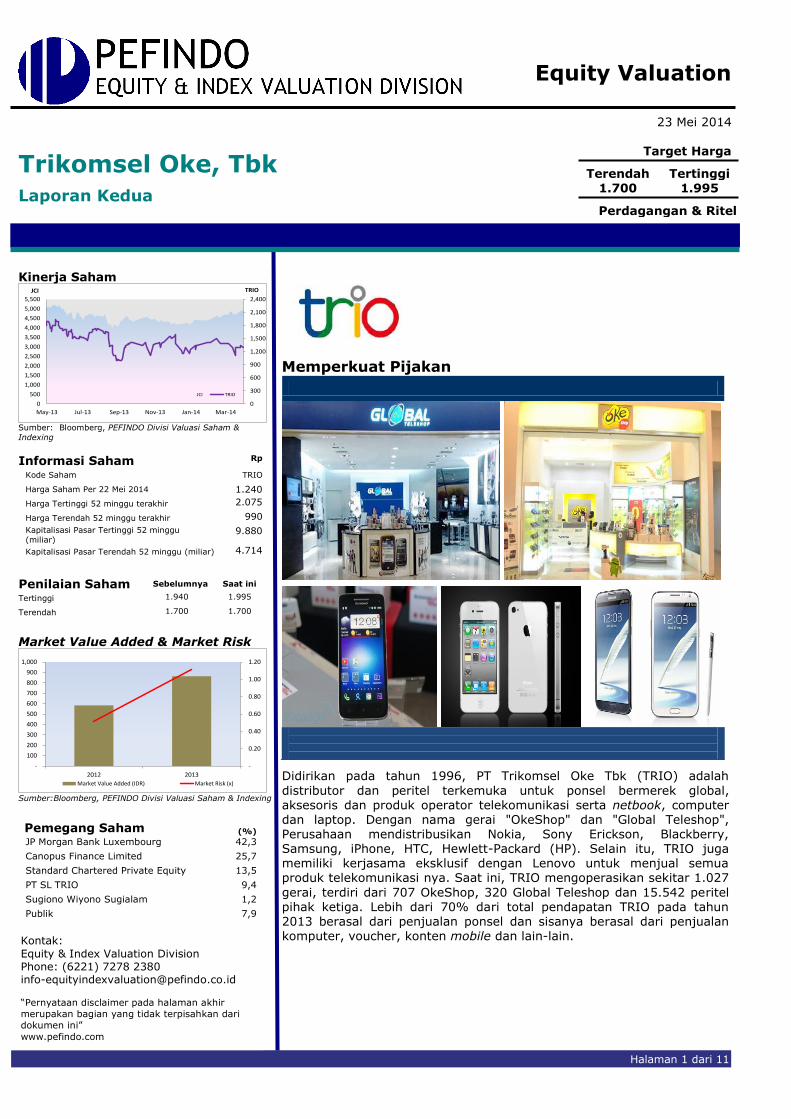
Memperkuat Pijakan
Didirikan pada tahun 1996, PT Trikomsel Oke Tbk (TRIO) adalah
distributor dan peritel terkemuka untuk ponsel bermerek global, aksesoris dan produk operator telekomunikasi serta netbook, computer dan laptop. Dengan nama gerai "OkeShop" dan "Global Teleshop", Perusahaan mendistribusikan Nokia, Sony Erickson, Blackberry, Samsung, iPhone, HTC, Hewlett-Packard (HP). Selain itu, TRIO juga memiliki kerjasama eksklusif dengan Lenovo untuk menjual semua produk telekomunikasi nya. Saat ini, TRIO mengoperasikan sekitar 1.027
gerai, terdiri dari 707 OkeShop, 320 Global Teleshop dan 15.542 peritel pihak ketiga. Lebih dari 70% dari total pendapatan TRIO pada tahun 2013 berasal dari penjualan ponsel dan sisanya berasal dari penjualan
komputer, voucher, konten mobile dan lain-lain.

“Pernyataan disclaimer pada halaman
akhir merupakan bagian tak
terpisahkan dari dokumen ini”
www.pefindo.com
Trikomsel Oke, Tbk
23 Mei 2014 Halaman 2 dari 11
Penyesuaian Target Harga Saham Kami melakukan beberapa penyesuaian terhadap proyeksi kami sebelumnya dan menyesuaikan target harga saham menjadi pada kisaran Rp1.700 – Rp1.995 per saham, berdasarkan beberapa pertimbangan berikut:
Pengguna smartphone di Indonesia terus meningkat, dan pada kenyataannya, negara ini berada di peringkat kelima dalam daftar pengguna smartphone terbesar dunia. Tahun ini, penjualan smartphone diperkirakan mencapai 46 juta unit dari 42 juta unit tahun lalu. Menurut survei pasar, pembelian smartphone di Indonesia pada 2013 ditandai sebagai yang tertinggi di Asia Tenggara.
Hasil menggembirakan pada produk Lenovo. TRIO memiliki kerjasama
eksklusif dengan Lenovo sejak 2012 untuk mendistribusikan semua produk telekomunikasinya. Perusahaan ini telah menjual sekitar 1 juta unit produk Lenovo tahun lalu dan menargetkan dua kali lipat tahun ini. Melihat kinerja yang mengesankan tersebut, kami memperkirakan kontribusi Lenovo akan melonjak, mengingat harga yang terjangkau dan produknya yang berkualitas tinggi.
Kinerja lebih baik pada tahun 2013. TRIO mencetak pertumbuhan
pendapatan 8% YoY menjadi Rp10,3 triliun, sejalan dengan perkiraan kami dalam laporan sebelumnya. Hal tersebut terutama didorong oleh anak perusahaan sebagai akibat dari peraturan baru dari pemerintah untuk memisahkan antara importir dan distributor, selanjutnya menciptakan PT Trio Distribusi sebagai distributor dan PT Okeshop sebagai peritel. Di lini bawah, laba meningkat menjadi Rp500 miliar
(pertumbuhan 31% YoY) pada tahun 2013 dikarenakan meningkatnya
pendapatan operasional lainnya dari keuntungan laba selisih kurs.
Asumsi risk free rate, equity premium dan beta masing-masing adalah sebesar 8,0%, 3,5% dan 1,1x.
Prospek Usaha Indonesia merupakan basis besar untuk pasar konsumen domestik
mengingat terdapat 240 juta penduduk yang didominasi oleh usia produktif. Seiring dengan perluasan cakupan jaringan data di pasar negara berkembang, peningkatan jumlah kelas menengah, adopsi smartphone dan feature phone dengan kemampuan internet akan mendorong pertumbuhan mobile phone berbasis internet. Selain itu, jumlah ketersediaan smartphone dengan harga yang terjangkau diprediksi akan meningkat. Mempertimbangkan kondisi tersebut serta
meningkatnya kinerja penjualan Lenovo, kami perkirakan pendapatan
TRIO dapat bertumbuh sebesar 10% YoY atau Rp11,4 triliun tahun ini. Tabel 1: Ringkasan Kinerja
2011 2012 2013 2014P 2015P
Penjualan [Rp miliar] 8.848 9.588 10.367 11.403 12.564
Laba sebelum pajak [Rp miliar]
522 599 673 712 725
Laba bersih [Rp miliar] 303 382 500 530 574
EPS [Rp] 63,6 80,2 105,0 111,3 124,8
Pertumbuhan EPS [%] 48,3 26,1 30,9 6,0 12,1
P/E [x] 14,0 12,1 12,3 12,1* 9,9*
PBV [x] 3,3 2,5 3,0 2,9* 2,2*
Sumber: PT Trikomsel Oke Tbk., Estimasi PEFINDO Divisi Valuasi Saham & Indexing
Catatan: * Berdasarkan Harga Saham TRIO per 22 Mei 2014 – Rp1.240/lembar
PARAMETER INVESTASI

“Pernyataan disclaimer pada halaman
akhir merupakan bagian tak
terpisahkan dari dokumen ini”
www.pefindo.com
Trikomsel Oke, Tbk
23 Mei 2014 Halaman 3 dari 11
Gambaran Industri 2014: Diuntungkan oleh Persaingan yang Ketat
Kami percaya penjualan smartphone di dalam negeri akan terus meningkat di tahun-tahun mendatang didorong oleh; (i) konsumsi domestik tetap kuat, (ii) rendahnya penetrasi smartphone dibandingkan dengan penduduk yang masih di bawah negara-negara tetangga, (iii) persaingan yang ketat di antara produsen smartphone. Kami melihat bahwa penurunan penjualan Blackberry dalam beberapa tahun terakhir tidak akan mempengaruhi penjualan smartphone dalam negeri karena dikompensasi oleh booming Android dan iOS
Berdasarkan data Frost & Sullivan, penjualan smartphone di Indonesia meningkat dengan pertumbuhan rata-rata tahunan (CAGR) dari 58,06% pada tahun 2009-2015. Tahun depan, volume penjualan smartphone di dalam negeri diperkirakan mencapai 18,7 juta unit. Sejalan dengan meningkatnya kebutuhan komunikasi
dan basis data, kami percaya industri ini memiliki prospek cerah di masa depan.
Gambar 1: Pengiriman Ponsel ke Indonesia
16.8 20.827.9 33.4 40 45.4 50.5
37.736.8
41.841.6
40.439.8
38.4
0
10
20
30
40
50
60
70
80
90
100
2011 2012 2013P 2014P 2015P 2016P 2017P
(dalam juta unit)
Ponsel Pintar Feature Phones
Sumber: Gartner, PEFINDO Divisi Valuasi Saham & Indexing
Ekspansi Berkelanjutan TRIO telah menunjukkan pertumbuhan organik dan anorganik yang seimbang selama bertahun-tahun. Secara khusus, pertumbuhan pendapatan periode 2010-
2011 didorong oleh akuisisi 72% saham di Global Teleshop. Kami melihat ini sebagai pergerakan positif dengan melihat persaingan yang ketat di industri ini. Untuk menangani hal ini, TRIO memiliki beberapa kekuatan, termasuk distribusi dan jaringan ritel yang komprehensif, hubungan jangka panjang dengan vendor ponsel dan operator serta merek gerainya yang terbangun baik. Pertumbuhan
penjualan ponsel didukung oleh periode lebih cepat dari penggantian ponsel dan
harga ponsel yang lebih terjangkau.
Gambar 2: Aksi Korporasi TRIO
Oct 2011 Jul 2012 Aug 2012 Oct 2012 May 2013 May 2013
Being authorized
distributor for computer product
Acquired 72% shares of GLOB
equaled to IDR910 billion
Having exclusive
partnership to distribute all
Lenovo telecommuni
cation products
TRIO established
PT Nusantara Trimultiprima
TRIO established PT
Trisatindo, voucher
distributor
Increase ownership in GLOB from 72% to 89.7%
Sumber: PT Trikomsel Oke Tbk, Estimasi PEFINDO Divisi Valuasi Saham & Indexing
INFORMASI USAHA
“Pernyataan disclaimer pada halaman
akhir merupakan bagian tak
terpisahkan dari dokumen ini”
www.pefindo.com
Trikomsel Oke, Tbk
23 Mei 2014 Halaman 4 dari 11
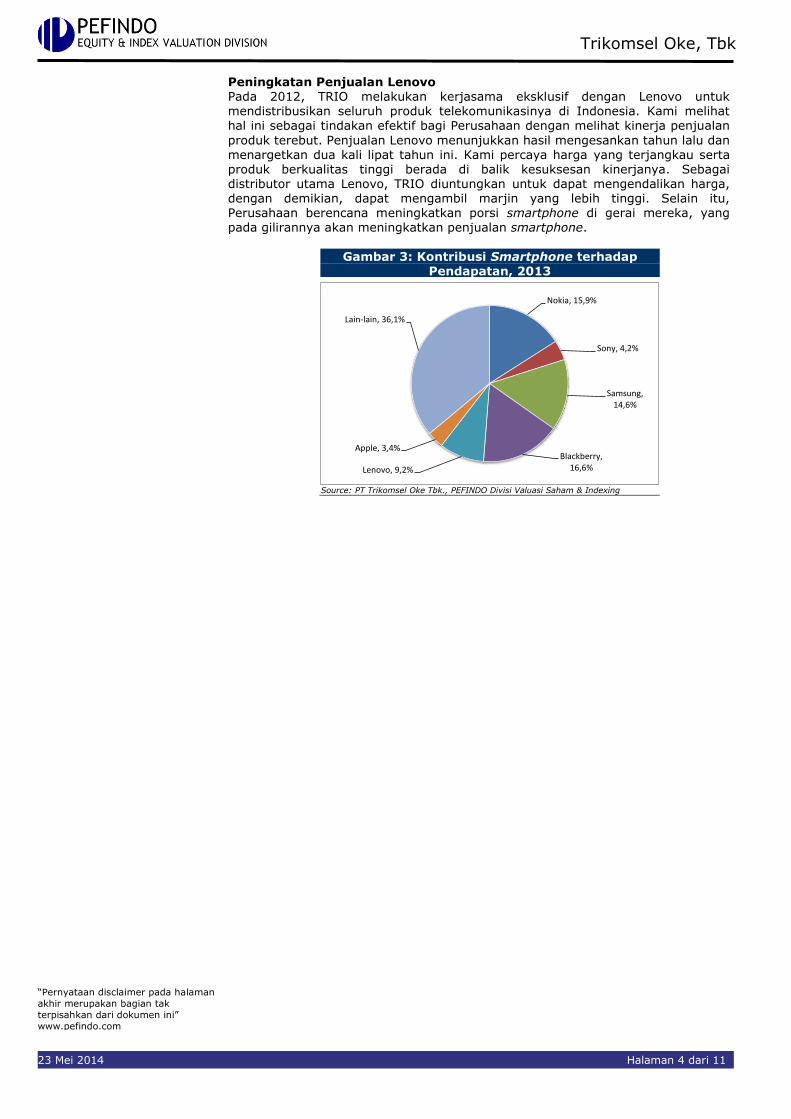
Peningkatan Penjualan Lenovo Pada 2012, TRIO melakukan kerjasama eksklusif dengan Lenovo untuk
mendistribusikan seluruh produk telekomunikasinya di Indonesia. Kami melihat hal ini sebagai tindakan efektif bagi Perusahaan dengan melihat kinerja penjualan
produk terebut. Penjualan Lenovo menunjukkan hasil mengesankan tahun lalu dan menargetkan dua kali lipat tahun ini. Kami percaya harga yang terjangkau serta produk berkualitas tinggi berada di balik kesuksesan kinerjanya. Sebagai distributor utama Lenovo, TRIO diuntungkan untuk dapat mengendalikan harga, dengan demikian, dapat mengambil marjin yang lebih tinggi. Selain itu, Perusahaan berencana meningkatkan porsi smartphone di gerai mereka, yang pada gilirannya akan meningkatkan penjualan smartphone.
Gambar 3: Kontribusi Smartphone terhadap
Pendapatan, 2013
Nokia, 15,9%
Sony, 4,2%
Samsung, 14,6%
Blackberry, 16,6%Lenovo, 9,2%
Apple, 3,4%
Lain-lain, 36,1%
Source: PT Trikomsel Oke Tbk., PEFINDO Divisi Valuasi Saham & Indexing

“Pernyataan disclaimer pada halaman
akhir merupakan bagian tak
terpisahkan dari dokumen ini”
www.pefindo.com
Trikomsel Oke, Tbk
23 Mei 2014 Halaman 5 dari 11
Pertumbuhan Pendapatan Moderat, Laba tetap Kuat
TRIO membukukan pendapatan Rp10,3 triliun selama 2013, atau mencerminkan pertumbuhan 8% YoY dibandingkan tahun sebelumnya, sejalan dengan perkiraan kami dalam laporan sebelumnya. Hal ini terjadi karena peraturan pemerintah yang baru dimana mewajibkan untuk membedakan antara importir dan distributor. Pada lini bawah, laba melonjak menjadi Rp500 miliar (tumbuh 31% YoY) pada tahun 2013 dibalik meningkatnya pendapatan operasional lainnya dari laba selisih kurs. Tahun ini, dengan penjualan smartphone yang tumbuh di negeri
ini, kami estimasi TRIO akan mampu mencetak pertumbuhan dan laba sebesar Rp11,4 triliun dan Rp530 miliar.
Gambar 4: Pendapatan dan Laba Bersih TRIO
8.848 9.588
10.367 11.403
12.564
-
100
200
300
400
500
600
700
-
2.000
4.000
6.000
8.000
10.000
12.000
14.000
2011 2012 2013 2014P 2015P
Pendapatan Laba bersih
Sumber: PT Trikomsel Oke Tbk., Estimasi PEFINDO Divisi Valuasi Saham &
Indexing
Peningkatan Marjin Profitabilitas Marjin laba kotor, laba operasi, dan laba bersih Perusahaan di 2013 meningkat
menjadi 14,1%, 9,9% dan 4,8% dari sebelumnya 14,1%, 8,6% dan 3,9% pada 2012. Kenaikan tertinggi terjadi pada marjin operasi terjadi karena kenaikan laba selisih kurs. Hasilnya, TRIO dapat mencetak pertumbuhan laba operasi dan laba bersih yang kuat sebesar 32% YoY dan 31% YoY. Kami memperkirakan marjin Perusahaan akan terus meningkat karena lebih fokus pada smartphone bermarjin tinggi termasuk Lenovo, Samsung, Nokia dan Apple. Sejalan dengan meningkatnya pasar smartphone di dalam negeri, kami percaya masih ada ruang
yang luas bagi TRIO untuk meningkatkan kinerja penjualan serta marjin.
Gambar 5: Marjin Laba TRIO
13,7% 14,1% 14,1% 14,3%
7,9%8,6%
9,9% 9,4%
3,4%4,0%
4,8% 4,6%
0,0%
2,0%
4,0%
6,0%
8,0%
10,0%
12,0%
14,0%
16,0%
2011 2012 2013 2014P
Marjin laba kotor Marjin laba operasi Marjin laba bersih
Sumber: PT Trikomsel Oke Tbk., Estimasi PEFINDO Divisi Valuasi Saham & Indexing
KEUANGAN
“Pernyataan disclaimer pada halaman
akhir merupakan bagian tak
terpisahkan dari dokumen ini”
www.pefindo.com
Trikomsel Oke, Tbk
23 Mei 2014 Halaman 6 dari 11
Selain itu, kami melihat bahwa marjin TRIO lebih unggul dibandingkan dengan
rata-rata industri. Kami percaya hal ini disebabkan oleh strategi Perusahaan untuk menggantikan gerai yang tidak produktif serta mengurangi porsi penjualan dari
peritel pihak ketiga.
Tabel 2: Profitabilitas TRIO dibandingkan Rata-rata Industri, 2013
TRIO ERAA SKYB TELE Rata-rata
Marjin laba kotor 14,1 9,2 1,4 6,0 5,5
Marjin laba operasi 9,9 4,3 (0,7) 4,3 2,6
Marjin laba bersih 4,8 2,7 (1,0) 2,8 1,5
ROE Disetahunkan 24,6 12,7 (6,1) 21,3 9,3
Sumber: beberapa sumber diolah oleh PEFINDO Divisi Valuasi Saham & Indexing
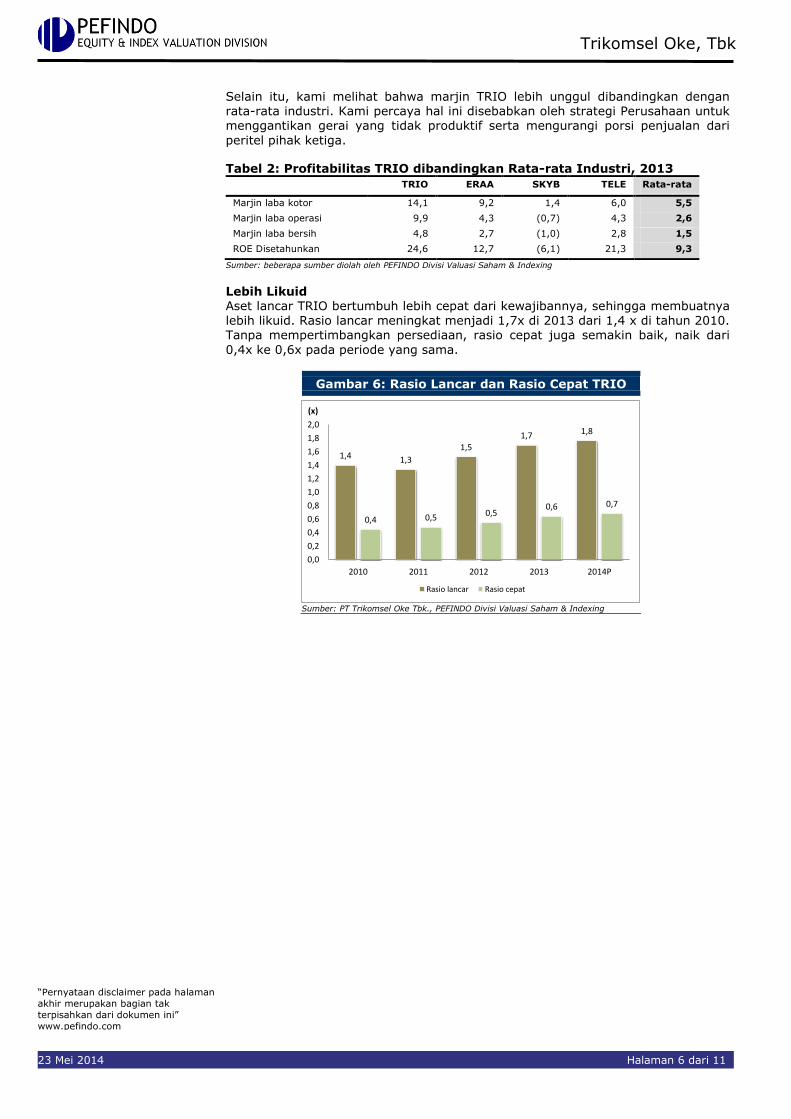
Lebih Likuid Aset lancar TRIO bertumbuh lebih cepat dari kewajibannya, sehingga membuatnya
lebih likuid. Rasio lancar meningkat menjadi 1,7x di 2013 dari 1,4 x di tahun 2010. Tanpa mempertimbangkan persediaan, rasio cepat juga semakin baik, naik dari
0,4x ke 0,6x pada periode yang sama.
Gambar 6: Rasio Lancar dan Rasio Cepat TRIO
1,4 1,3
1,5
1,7 1,8
0,4 0,5 0,50,6 0,7
0,0
0,2
0,4
0,6
0,8
1,0
1,2
1,4
1,6
1,8
2,0
2010 2011 2012 2013 2014P
(x)
Rasio lancar Rasio cepat
Sumber: PT Trikomsel Oke Tbk., PEFINDO Divisi Valuasi Saham & Indexing

“Pernyataan disclaimer pada halaman
akhir merupakan bagian tak
terpisahkan dari dokumen ini”
www.pefindo.com
Trikomsel Oke, Tbk
23 Mei 2014 Halaman 7 dari 11
Tabel 3: Perbandingan terhadap Perusahaan Sejenis, Desember 2013 TRIO SKYB ERAA TELE
Penjualan [Rp. miliar] 10.367 1.355 12.727 10.485
Laba Kotor [Rp. miliar] 1.461 19 1.169 628
Laba Operasi [Rp. miliar] 1.025 (10) 546 448
Laba Bersih [Rp. miliar] 500 (13) 349 295
Total Aset [Rp. miliar] 8.243 859 5.002 3.455 Total Kewajiban [Rp. miliar] 6.213 645 2.248 2.069
Total Ekuitas [Rp. miliar] 2.029 214 2.754 1.386
Pertumbuhan YoY
Penjualan [%] 8,1 (21,2) (1,2) 28,0
Laba Kotor [%] 8,3 (51,3) 2,0 38,9
Laba Operasi [%] 24,0 (176,9) (12,8) 50,3
Laba Bersih [%] 30,9 (200,0) (19,6) 44,6
Profitabilitas
Marjin Laba Kotor [%] 14,1 1,4 9,2 6,0
Marjin Laba Operasi [%] 9,9 (0,7) 4,3 4,3
ROA [%] 6,1 (1,5) 7,0 8,5
ROE [%] 24,6 (6,1) 12,7 21,3
Leverage
DER [x] 3,1 3,0 0,8 1,5
Sumber: PT Trikomsel Oke Tbk.. PT Skybee Tbk. PT Erajaya Swasembada Tbk. PT Erajaya Swasembada Tbk
PT Tiphone Mobile Indonesia Tbk.. PEFINDO Divisi Valuasi Saham & Indexing
PERBANDINGAN INDUSTRI

“Pernyataan disclaimer pada halaman
akhir merupakan bagian tak
terpisahkan dari dokumen ini”
www.pefindo.com
Trikomsel Oke, Tbk
23 Mei 2014 Halaman 8 dari 11
VALUASI
Metodologi
Kami mengaplikasikan metode discounted cash flow (DCF) sebagai metode penilaian utama dengan pertimbangan bahwa pertumbuhan pendapatan adalah merupakan faktor yang sangat mempengaruhi nilai (value driver) bagi TRIO jika dibandingkan dengan pertumbuhan aset.
Selanjutnya, kami juga mengaplikasikan Guideline Company Method (GCM) sebagai metode pembanding lainnya.
Penilaian ini berdasarkan pada nilai 100% saham TRIO per 22 Mei 2014,
menggunakan laporan keuangan TRIO per 31 Desember 2013 sebagai dasar dilakukannya analisis fundamental.
Estimasi Nilai
Kami menggunakan Cost of Capital sebesar 9,0% dan Cost of Equity sebesar 11,8% berdasarkan asumsi-asumsi berikut:
Tabel 4: Asumsi
Risk free rate [%]* 8,0 Risk premium [%]* 3,3
Beta [x]** 1,1
Cost of Equity [%] 11,8 Marginal tax rate [%] 25,0
Debt to Equity Ratio [x] 2,7
WACC [%] 9,0 Sumber: Bloomberg. Estimasi PEFINDO Divisi Valuasi Saham & Indexing *Catatan: Per 22 Mei 2014 **PEFINDO Beta Saham. per 22 Mei 2014
Estimasi target harga referensi saham untuk 12 bulan berdasarkan posisi penilaian pada tanggal 22 Mei 2014 adalah sebagai berikut:
Dengan menggunakan metode DCF dengan asumsi tingkat diskonto
9,0%, adalah sebesar Rp1.924 – Rp2.238 per saham. Dengan menggunakan metode GCM (PBV 2,5X dan P/E 12,8X) adalah
sebesar Rp1.176 – Rp1.420 per saham.
Untuk mendapatkan nilai yang mewakili kedua indikasi nilai tersebut
dilakukan rekonsiliasi dengan dilakukan pembobotan terhadap kedua metode tersebut sebesar 70% untuk DCF dan 30% untuk GCM.
Berdasarkan hasil perhitungan diatas maka Estimasi Target Harga referensi saham TRIO untuk 12 bulan adalah Rp1.700 – Rp1.995 per lembar saham.
Tabel 5: Ringkasan Penilaian dengan Metode DCF
Konservatif Moderat Agresif
PV of Free Cash Flows [Rp miliar] 5.274 5.551 5.829 PV Terminal Value [Rp miliar] 8.927 9.397 9.867 Non-Operating Asset [Rp miliar] 510 510 510 Net Debt [Rp miliar] (5.549) (5.549) (5.549) Total Equity Value [Rp miliar] 9.162 9.909 10.657 Number of Share [juta saham] 4.762 4.762 4.762 Fair Value per Share [Rp] 1.924 2.081 2.238
Sumber: Estimasi PEFINDO Divisi Valuasi Saham & Indexing
TARGET HARGA
“Pernyataan disclaimer pada halaman
akhir merupakan bagian tak
terpisahkan dari dokumen ini”
www.pefindo.com
Trikomsel Oke, Tbk
23 Mei 2014 Halaman 9 dari 11
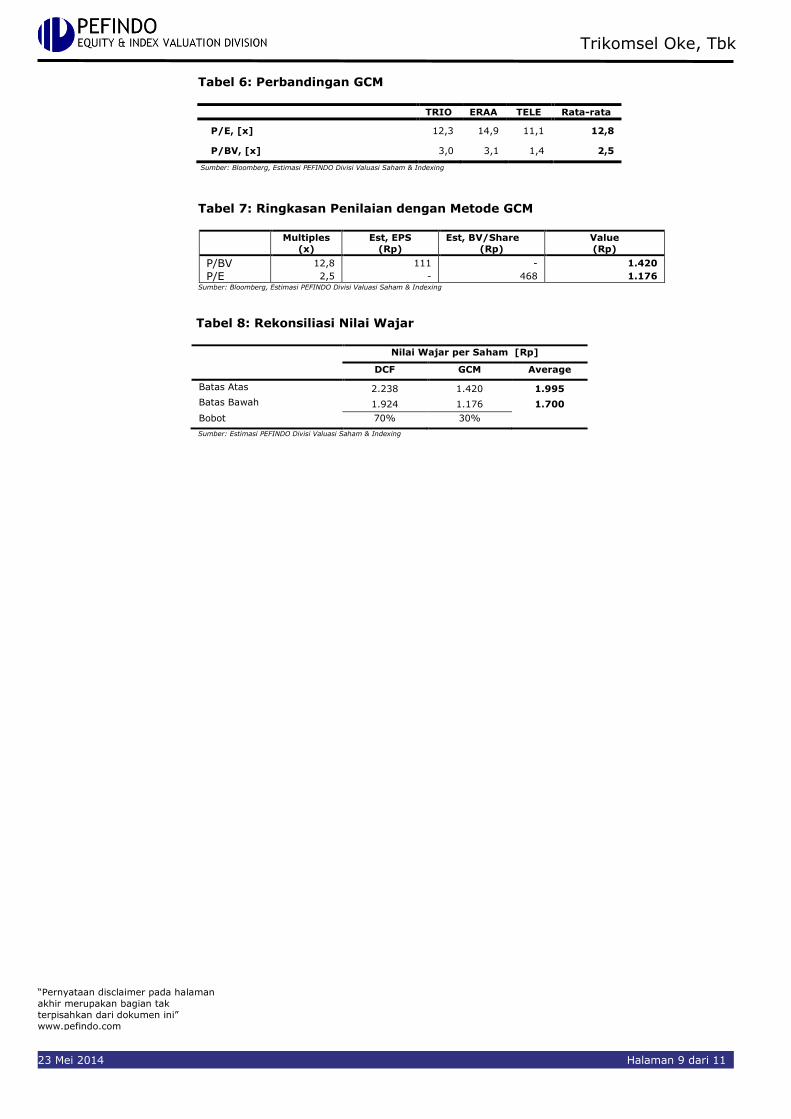
Tabel 6: Perbandingan GCM
TRIO ERAA TELE Rata-rata
P/E, [x] 12,3 14,9 11,1 12,8
P/BV, [x] 3,0 3,1 1,4 2,5
Sumber: Bloomberg, Estimasi PEFINDO Divisi Valuasi Saham & Indexing
Tabel 7: Ringkasan Penilaian dengan Metode GCM
Multiples
(x)
Est, EPS
(Rp)
Est, BV/Share
(Rp)
Value
(Rp)
P/BV 12,8 111 - 1.420
P/E 2,5 - 468 1.176 Sumber: Bloomberg, Estimasi PEFINDO Divisi Valuasi Saham & Indexing
Tabel 8: Rekonsiliasi Nilai Wajar
Nilai Wajar per Saham [Rp]
DCF GCM Average
Batas Atas 2.238 1.420 1.995
Batas Bawah 1.924 1.176 1.700
Bobot 70% 30%
Sumber: Estimasi PEFINDO Divisi Valuasi Saham & Indexing

“Pernyataan disclaimer pada halaman
akhir merupakan bagian tak
terpisahkan dari dokumen ini”
www.pefindo.com
Trikomsel Oke, Tbk
23 Mei 2014 Halaman 10 dari 11
Tabel 9: Laporan Laba Rugi Komprehensif Konsolidasian [dalam Rp Miliar]
2011 2012 2013 2014P 2015P
Penjualan 8.848 9.588 10.367 11.403 12.564
Harga Pokok Penjualan (7.638) (8.239) (8.906) (9.775) (10.768)
Laba Kotor 1.210 1.349 1.461 1.629 1.796
Beban Operasi (510) (522) (436) (552) (753)
Laba Operasi 700 827 1.025 1.077 1.043
Pendapatan [Beban] lain-lain (178) (228) (352) (365) (317)
Laba Sebelum Pajak 522 599 673 712 725
Pajak (141) (157) (173) (182) (152)
Efek penyesuaian proforma (78) (60)
Laba Bersih 303 382 500 530 574
Sumber: PT Trikomsel Oke Tbk. Estimasi PEFINDO Divisi Valuasi Saham & Indexing
Tabel 10: Laporan Posisi Keuangan Konsolidasian [dalam Rp Miliar]
2011 2012 2013 2014P 2015P
Aset
Aset Lancar
Kas dan Setara Kas 201 351 510 362 261
Piutang Usaha 1,305 1,402 1,945 2,173 2,392
Persediaan 1,247 1,436 2,957 2,444 2,542
Aset lain-lain 1,778 1,984 2,626 3,098 2,909
Total Aset Lancar 4,532 5,174 8,037 8,077 8,104
Aset Tetap 103 107 109 157 177
Aset lainnya 48 67 96 91 101
Total Aset 4,682 5,348 8,243 8,325 8,382
Kewajiban
Hutang Usaha 405 172 375 407 449
Hutang Jk. Pendek 2,885 3,112 4,140 3,940 3,540
Hutang Jk. Pendek
lainnya
99 113 218 235 253
Hutang Jk. Panjang 0,0 0,5 1,315 1,365 1,365
Hutang Jk. Panjang
Lainnya
22 109 165 149 152
Total Kewajiban 3,410 3,506 6,213 6,096 5,758
Total Ekuitas 1,272 1,842 2,029 2,229 2,624
Sumber: PT Trikomsel Oke Tbk. Estimasi PEFINDO Divisi Valuasi Saham & Indexing
Gambar 7: P/E dan P/BV Historis
-
2
4
6
8
10
12
14
2012 2013
(X)
P/E
PBV
Sumber: PT Trikomsel Oke Tbk. PEFINDO Divisi Valuasi Saham & Indexing
Gambar 8: ROA. ROE dan TAT Historis
0
0,5
1
1,5
2
-
5
10
15
20
25
30
2012 2013
TAT (X)ROA & ROE (%)
ROE ROA Total Asset Turn Over
Sumber: PT Trikomsel Oke Tbk. PEFINDO Divisi Valuasi Saham & Indexing
Tabel 11: Rasio Penting
Rasio 2011 2012 2013 2014P 2015P
Pertumbuhan [%]
Penjualan 60,6 8,4 8,1 10,0 10,2
Laba Operasi 82,5 18,2 24,0 5,0 (0,6)
EBITDA 81,7 18,2 23,3 3,4 (0,4)
Laba Bersih 48,3 26,1 30,9 6,0 12,1
Profitabilitas [%]
Marjin Laba Kotor 13,7 14,1 14,1 14,3 14,3
Marjin Laba Operasi 7,9 8,6 9,9 9,4 8,5
Marjin EBITDA 8,2 8,9 10,1 9,5 9,5
Marjin Laba Bersih 3,4 4,0 4,8 4,6 4,7
ROA 6,5 7,1 6,1 6,4 7,1
ROE 23,8 20,7 24,6 23,8 22,5
Solvabilitas [X]
Rasio Kewajiban Terhadap Ekuitas 2,7 1,9 3,1 2,7 2,2
Rasio KewajibanTerhadap Aset 0,7 0,7 0,8 0,7 0,7
Likuiditas[X]
Rasio Lancar 1,3 1,5 1,7 1,8 1,9
Rasio Cepat 0,5 0,5 0,6 0,7 0,8
Sumber: PT Trikomsel Oke Tbk. Estimasi PEFINDO Divisi Valuasi Saham & Indexing
“Pernyataan disclaimer pada halaman
akhir merupakan bagian tak
terpisahkan dari dokumen ini”
www.pefindo.com
Trikomsel Oke, Tbk
23 Mei 2014 Halaman 11 dari 11
DISCLAIMER
Laporan ini dibuat berdasarkan sumber-sumber yang kami anggap terpercaya dan dapat diandalkan. Namun kami tidak menjamin kelengkapan. keakuratan atau kecukupannya. Dengan demikian kami tidak bertanggung jawab atas segala keputusan investasi yang diambil berdasarkan laporan ini. Adapun asumsi. opini. dan perkiraan merupakan hasil dari
pertimbangan internal kami per tanggal penilaian (cut-off date). dan kami dapat mengubah pertimbangan diatas sewaktu-waktu tanpa pemberitahuan terlebih dahulu. Kami tidak bertanggung jawab atas kekeliruan atau kelalaian yang terjadi akibat penggunaan laporan ini. Kinerja dimasa lalu tidak selalu dapat dijadikan acuan hasil masa depan . Laporan ini bukan merupakan rekomendasi penawaran. pembelian atau menahan suatu saham tertentu. Laporan ini mungkin tidak sesuai untuk beberapa investor. Seluruh opini dalam laporan ini telah
disampaikan dengan itikad baik. namun sewaktu-waktu dapat berubah tanpa pemberitahuan terlebih dahulu. dan disajikan dengan benar per tanggal diterbitkan laporan ini . Harga. nilai.
atau pendapatan dari setiap saham Perseroan yang disajikan dalam laporan ini kemungkinan dapat lebih rendah dari harapan pemodal. dan pemodal juga mungkin mendapatkan pengembalian yang lebih rendah dari nilai investasi yang ditanamkan. Investasi didefinisikan sebagai pendapatan yang kemungkinan besar diterima dimasa depan. namun nilai dari
pendapatan yang akan diterima tersebut kemungkinan besar juga akan berfluktuasi. Untuk saham Perseroan yang penyajian laporan keuangannya didenominasi dalam mata uang selain Rupiah. perubahan nilai tukar mata uang tersebut kemungkinan dapat menurunkan nilai . harga. atau pendapatan investasi pemodal. Informasi dalam laporan ini bukan merupakan pertimbangan pajak dalam mengambil suatu keputusan investasi . Target harga saham dalam Laporan ini merupakan nilai fundamental . bukan merupakan Nilai
Pasar Wajar. dan bukan merupakan harga acuan transaksi yang diwajibkan oleh peraturan perundang-undangan yang berlaku.
Laporan target harga saham yang diterbitkan oleh PEFINDO Divisi Valuasi Saham dan Indexing bukan merupakan rekomendasi untuk membeli . menjual. atau menahan suatu saham tertentu. dan tidak dapat dianggap sebagai nasehat investasi oleh PEFINDO Divisi Valuasi Saham dan Indexing yang behubungan dengan cakupan Jasa PEFINDO kepada. atau kaitannya kepada.
beberapa pihak. termasuk emiten. penasehat keuangan. pialang saham. investment banks. institusi keuangan dan perantara keuangan. dalam kaitannya menerima imbalan atau keuntungan lainnya dari pihak tersebut. Laporan ini tidak ditujukan untuk pemodal tertentu dan tidak dapat dijadikan bagian dari tujuan investasi terhadap suatu saham dan juga bukan merupakan rekomendasi investasi terhadap
suatu saham tertentu atau suatu strategi investasi . Sebelum melakukan tindakan dari hasil laporan ini. pemodal disarankan untuk mempertimbangkan terlebih dahulu kesesuaian situasi dan kondisi dan. jika dibutuhkan. mintalah bantuan penasehat keuangan. PEFINDO memisahkan kegiatan Valuasi Saham dengan kegiatan Pemeringkatan untuk menjaga
independensi dan objektivitas dari proses dan produk kegiatan analitis . PEFINDO telah menetapkan kebijakan dan prosedur untuk menjaga kerahasiaan informasi non-publik tertentu
yang diterima sehubungan dengan proses analitis. Keseluruhan proses. metodologi dan database yang digunakan dalam penyusunan Laporan Target Harga Referensi Saham ini secara keseluruhan adalah berbeda dengan proses. metodologi dan database yang digunakan PEFINDO dalam melakukan pemeringkatan. Laporan ini dibuat dan disiapkan PEFINDO Divisi Valuasi Saham & Indexing dengan tujuan untuk meningkatkan transparansi harga saham yang tercatat di Bursa Efek Indonesia . Laporan
ini juga bebas dari pengaruh tekanan atau paksaan dari Bursa maupun Perseroan yang dinilai . PEFINDO Divisi Valuasi Saham & Indexing akan menerima imbalan sebesar Rp20 juta masing-masing dari Bursa Efek Indonesia dan Perseroan yang dinilai untuk 2 (dua) kali pelaporan per tahun. Untuk keterangan lebih lanjut. dapat mengunjungi website kami di http://www.pefindo.com
Laporan ini dibuat dan disiapkan oleh PEFINDO Divisi Valuasi Saham dan Indexing. Di Indonesia Laporan ini dipublikasikan pada website kami dan juga pada website Bursa Efek Indonesia .
Page 1 of 11
Contact: Equity & Index Valuation Division Phone: (6221) 7278 2380 [email protected] “Disclaimer statement in the last page is an
integral part of this report”
www.pefindo.com
Trikomsel Oke, Tbk Secondary Report
Equity Valuation
May 23, 2014
Target Price
Low High 1,700 1,995
Trade & Retail
Historical Chart
0
300
600
900
1,200
1,500
1,800
2,100
2,400
0
500
1,000
1,500
2,000
2,500
3,000
3,500
4,000
4,500
5,000
5,500
May-13 Jul-13 Sep-13 Nov-13 Jan-14 Mar-14
TRIOJCI
JCI TRIO
Source : Bloomberg, PEFINDO Equity & Index Valuation
Division
Stock Information IDR
Ticker code TRIO
Market price as of May 22, 2014 1,240
Market price – 52 week high 2,075
Market price – 52 week low 990
Market cap – 52 week high (bn) 9,880
Market cap – 52 week low (bn) 4,714
Stock Valuation Last Current
High 1,940 1,995
Low 1,700 1,700
Market Value Added & Market Risk
-
0.20
0.40
0.60
0.80
1.00
1.20
-
100
200
300
400
500
600
700
800
900
1,000
2012 2013
Market Value Added (IDR) Market Risk (x)
Source : Bloomberg, PEFINDO Equity & Index Valuation
Division
Shareholders (%)
JP Morgan Bank Luxembourg 42.3
Canopus Finance Limited 25.7
Standard Chartered Private Equity 13.5
PT SL TRIO 9.4
Sugiono Wiyono Sugialam 1.2
Public 7.9
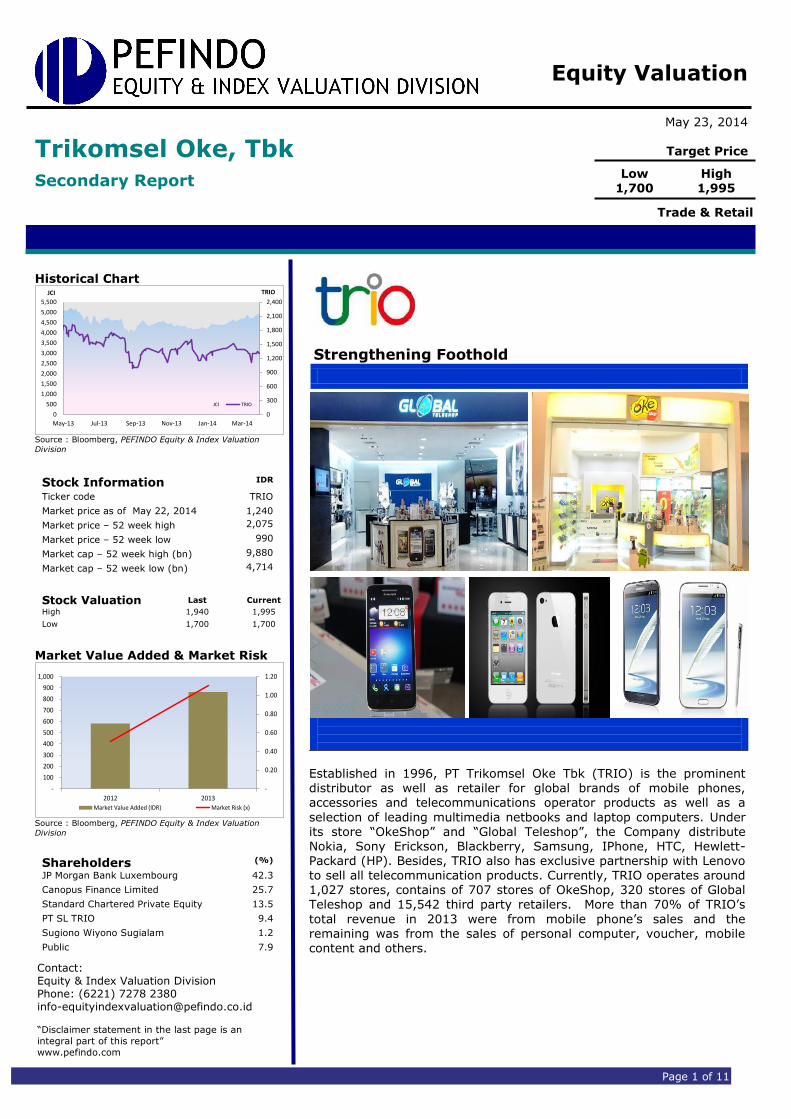
Strengthening Foothold
Established in 1996, PT Trikomsel Oke Tbk (TRIO) is the prominent distributor as well as retailer for global brands of mobile phones, accessories and telecommunications operator products as well as a
selection of leading multimedia netbooks and laptop computers. Under its store “OkeShop” and “Global Teleshop”, the Company distribute Nokia, Sony Erickson, Blackberry, Samsung, IPhone, HTC, Hewlett-Packard (HP). Besides, TRIO also has exclusive partnership with Lenovo to sell all telecommunication products. Currently, TRIO operates around 1,027 stores, contains of 707 stores of OkeShop, 320 stores of Global Teleshop and 15,542 third party retailers. More than 70% of TRIO’s
total revenue in 2013 were from mobile phone’s sales and the remaining was from the sales of personal computer, voucher, mobile
content and others.
“Disclaimer statement in the last page
is an integral part of this report”
www.pefindo.com
Trikomsel Oke, Tbk
May 23, 2014 Page 2 of 11
Target Price Adjustment We make several adjustments to our previous projections, and adjust our target price to a range of IDR1,700 – IDR1,995 per share, based on the following considerations:
Smartphone users in Indonesia continue to rise, and in fact, the country is ranked fifth in the list of world’s largest smartphone users. This year, smartphone sales are expected to reach 46 million units from 42 million units last year. According to market survey, the smartphone purchase in Indonesia in 2013 marked as the highest in Southeast Asia.
Encouraging result of Lenovo products. TRIO has exclusive partnership with Lenovo since 2012 to distribute all telecommunication products. The Company
has sold around 1 million unit of Lenovo products last year and targeting
twofold this year. Looking at the impressive performance, we estimate Lenovo contribution will jump, citing affordable price couple and high-quality products.
Better performance in 2013. TRIO posted 8% YoY of revenue growth to IDR10.3 trillion, in line with our estimate in the previous report. It was mainly fuelled by its subsidiaries as a result of new regulation from government to separate between importer and distributor, further creating PT Trio Distribusi as
distributor and PT Okeshop as retailer. On the bottom line side, its earnings jumped to IDR500 billion (31% YoY of growth) in 2013 on the back of rising other operating profit from gain of foreign exchange.
Risk free rate, equity premium, and beta assumption are 8.0%, 3.5%, and 1.1x respectively.
Business Prospects Indonesia represent a large base of domestic consumer market considering 240
million in population which dominated by productive age. Along with the expansion of the data network coverage in emerging markets and a rising middle class, the adoption of smartphones and feature phones with internet capabilities will drive the growth of mobile-based internet. Moreover, the amount of the availability of smartphones with affordable price is predicted to increase. Taking
above aforementioned condition as well as increasing Lenovo sales performance, we expect TRIO’s revenue to grow by 10% YoY or IDR11.4 trillion this year. Table 1: Performance Summary
2011 2012 2013 2014P 2015P
Revenue (Rp bn) 8,848 9,588 10,367 11,403 12,564
Pre-tax Profit (Rp bn) 522 599 673 712 725
Net Profit (Rp bn) 303 382 500 530 574
EPS (Rp) 63.6 80.2 105.0 111.3 124.8
EPS Growth (%) 48.3 26.1 30.9 6.0 12.1
P/E (x) 14.0 12.1 12.3 12.1* 9.9*
PBV (x) 3.3 2.5 3.0 2.9* 2.2* Source: PT Trikomsel Oke Tbk, PEFINDO Equity & Index Valuation Division Estimates Notes: *) Based on Share Price as of May 22, 2014 – IDR1,240/share
INVESTMENT PARAMETERS
Trikomsel Oke, Tbk
Page 3 of 11
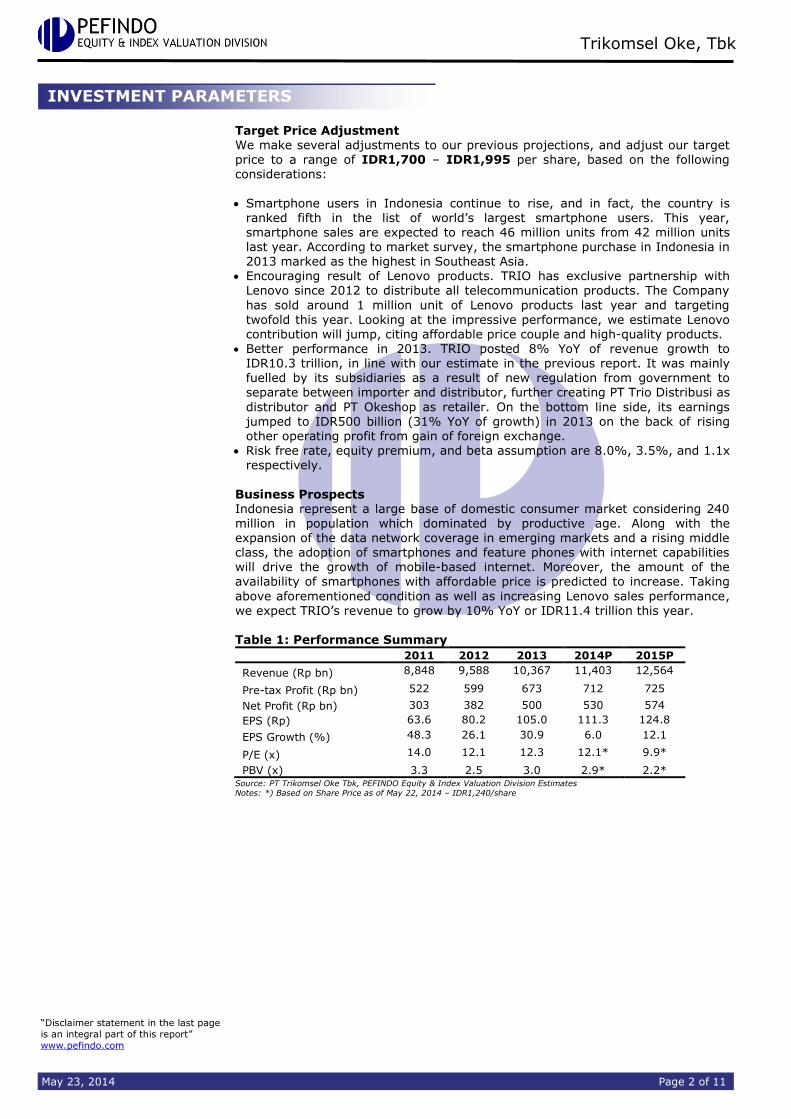
Industry Outlook 2014: Benefited by Stiff Competition We believe the smartphone sales in the country will continue to rise in the years ahead on the back of; (i) domestic private consumption remains strong, (ii) low penetration of smartphone compared to population and also below neighboring
countries, (iii) tight competition among smartphone producers. We view that Blackberry sales gloom in the last few years will not affect the domestic smartphone sales since it is compensated by the booming of Android and iOS. According to Frost & Sullivan, smartphone sales in Indonesia rises by an average annual growth (CAGR) of 58.06% in 2009-2015. Next year, smartphone sales in domestic is estimated to reach 18.7 million units. In line with increasing
communication needs and data base, we believe this industry has prospective outlook in the future.
Figure 1: Indonesia Mobile Phone Shipment
16,8 20,827,9 33,4 40 45,4 50,5
37,736,8
41,841,6
40,439,8
38,4
0
10
20
30
40
50
60
70
80
90
100
2011 2012 2013P 2014P 2015P 2016P 2017P
(in mn unit)
Smartphone Feature Phones
Source: Gartner, PEFINDO Equity & Index Valuation Division
Continuous Expansion TRIO has demonstrated balanced organic and inorganic growth over the years. In particular, its revenue growth from 2010 to 2011 was driven by the acquisition of 72% interest in Global Teleshop. We view this as a positive movement by looking at tight competition in this industry. To handle this, TRIO has several strength including comprehensive distribution and retail network, long standing relationship
with its mobile phone vendors and carrier as well as established brand of its outlets. The growth of mobile phone sales is supported by faster period of mobile phone replacement and more affordable mobile phones prices.
Figure 2: TRIO’s Corporate Action
Oct 2011 Jul 2012 Aug 2012 Oct 2012 May 2013 May 2013
Being authorized
distributor for computer product
Acquired 72% shares of GLOB
equaled to IDR910 billion
Having exclusive
partnership to distribute all
Lenovo telecommuni
cation products
TRIO established
PT Nusantara Trimultiprima
TRIO established PT
Trisatindo, voucher
distributor
Increase ownership in GLOB from 72% to 89.7%
Source: Gartner, PEFINDO Equity & Index Valuation Division
BUSINESS INFORMATION
“Disclaimer statement in the last page
is an integral part of this report”
www.pefindo.com
Trikomsel Oke, Tbk
May 23, 2014 Page 4 of 11
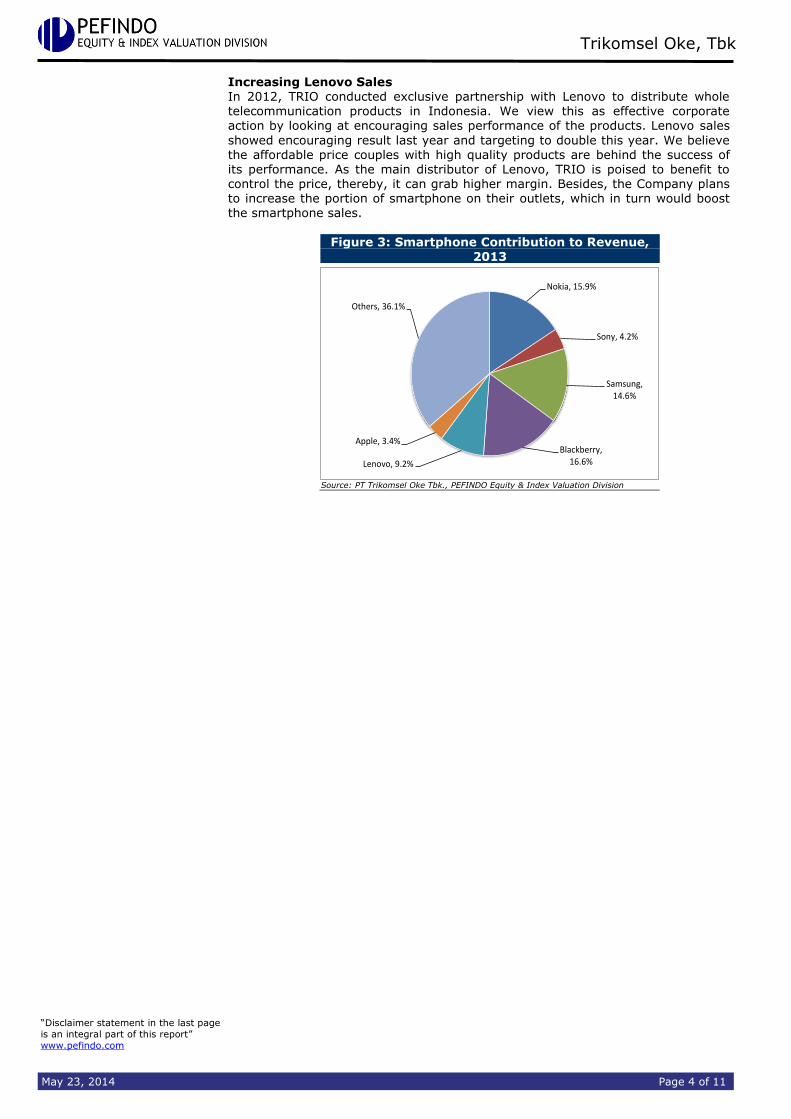
Increasing Lenovo Sales In 2012, TRIO conducted exclusive partnership with Lenovo to distribute whole
telecommunication products in Indonesia. We view this as effective corporate action by looking at encouraging sales performance of the products. Lenovo sales
showed encouraging result last year and targeting to double this year. We believe the affordable price couples with high quality products are behind the success of its performance. As the main distributor of Lenovo, TRIO is poised to benefit to control the price, thereby, it can grab higher margin. Besides, the Company plans to increase the portion of smartphone on their outlets, which in turn would boost the smartphone sales.
Figure 3: Smartphone Contribution to Revenue, 2013
Nokia, 15.9%
Sony, 4.2%
Samsung, 14.6%
Blackberry, 16.6%Lenovo, 9.2%
Apple, 3.4%
Others, 36.1%
Source: PT Trikomsel Oke Tbk., PEFINDO Equity & Index Valuation Division
“Disclaimer statement in the last page
is an integral part of this report”
www.pefindo.com
Trikomsel Oke, Tbk
May 23, 2014 Page 5 of 11
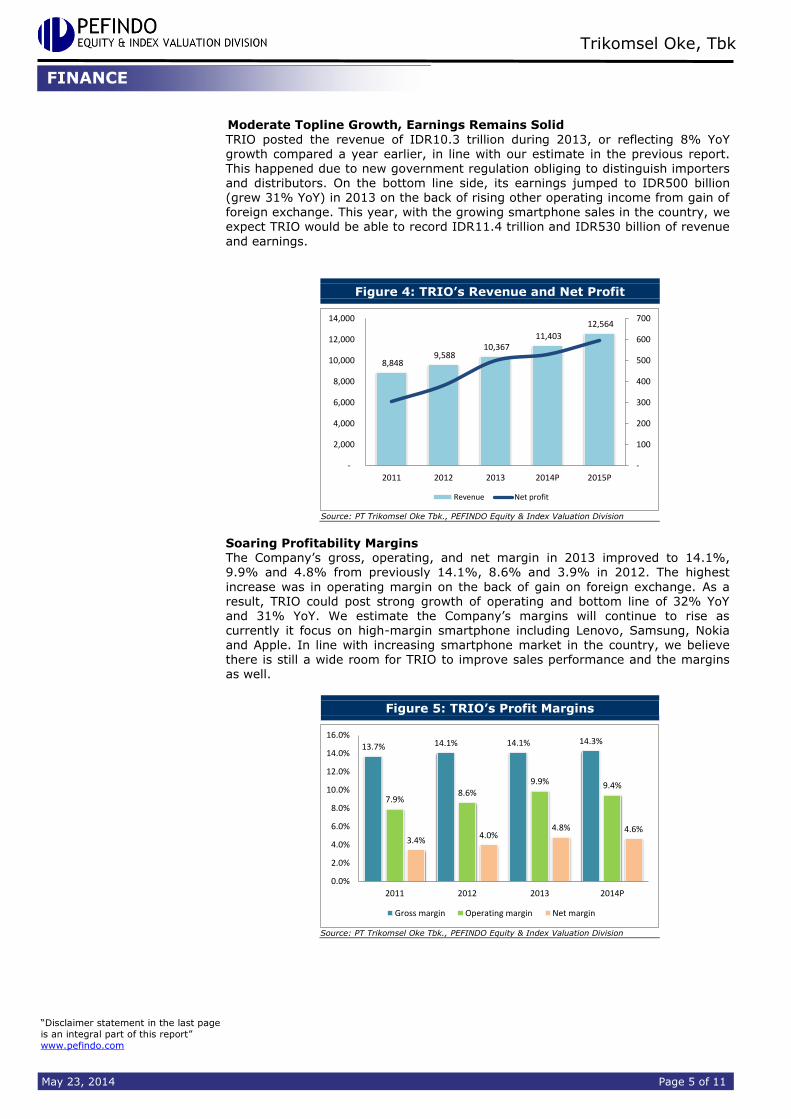
Moderate Topline Growth, Earnings Remains Solid
TRIO posted the revenue of IDR10.3 trillion during 2013, or reflecting 8% YoY growth compared a year earlier, in line with our estimate in the previous report. This happened due to new government regulation obliging to distinguish importers and distributors. On the bottom line side, its earnings jumped to IDR500 billion (grew 31% YoY) in 2013 on the back of rising other operating income from gain of foreign exchange. This year, with the growing smartphone sales in the country, we expect TRIO would be able to record IDR11.4 trillion and IDR530 billion of revenue
and earnings.
Figure 4: TRIO’s Revenue and Net Profit
8,848 9,588
10,367 11,403
12,564
-
100
200
300
400
500
600
700
-
2,000
4,000
6,000
8,000
10,000
12,000
14,000
2011 2012 2013 2014P 2015P
Revenue Net profit
Source: PT Trikomsel Oke Tbk., PEFINDO Equity & Index Valuation Division
Soaring Profitability Margins The Company’s gross, operating, and net margin in 2013 improved to 14.1%, 9.9% and 4.8% from previously 14.1%, 8.6% and 3.9% in 2012. The highest
increase was in operating margin on the back of gain on foreign exchange. As a result, TRIO could post strong growth of operating and bottom line of 32% YoY and 31% YoY. We estimate the Company’s margins will continue to rise as currently it focus on high-margin smartphone including Lenovo, Samsung, Nokia and Apple. In line with increasing smartphone market in the country, we believe there is still a wide room for TRIO to improve sales performance and the margins as well.
Figure 5: TRIO’s Profit Margins
13.7% 14.1% 14.1% 14.3%
7.9%8.6%
9.9% 9.4%
3.4%4.0%
4.8% 4.6%
0.0%
2.0%
4.0%
6.0%
8.0%
10.0%
12.0%
14.0%
16.0%
2011 2012 2013 2014P
Gross margin Operating margin Net margin
Source: PT Trikomsel Oke Tbk., PEFINDO Equity & Index Valuation Division
FINANCE
“Disclaimer statement in the last page
is an integral part of this report”
www.pefindo.com
Trikomsel Oke, Tbk
May 23, 2014 Page 6 of 11
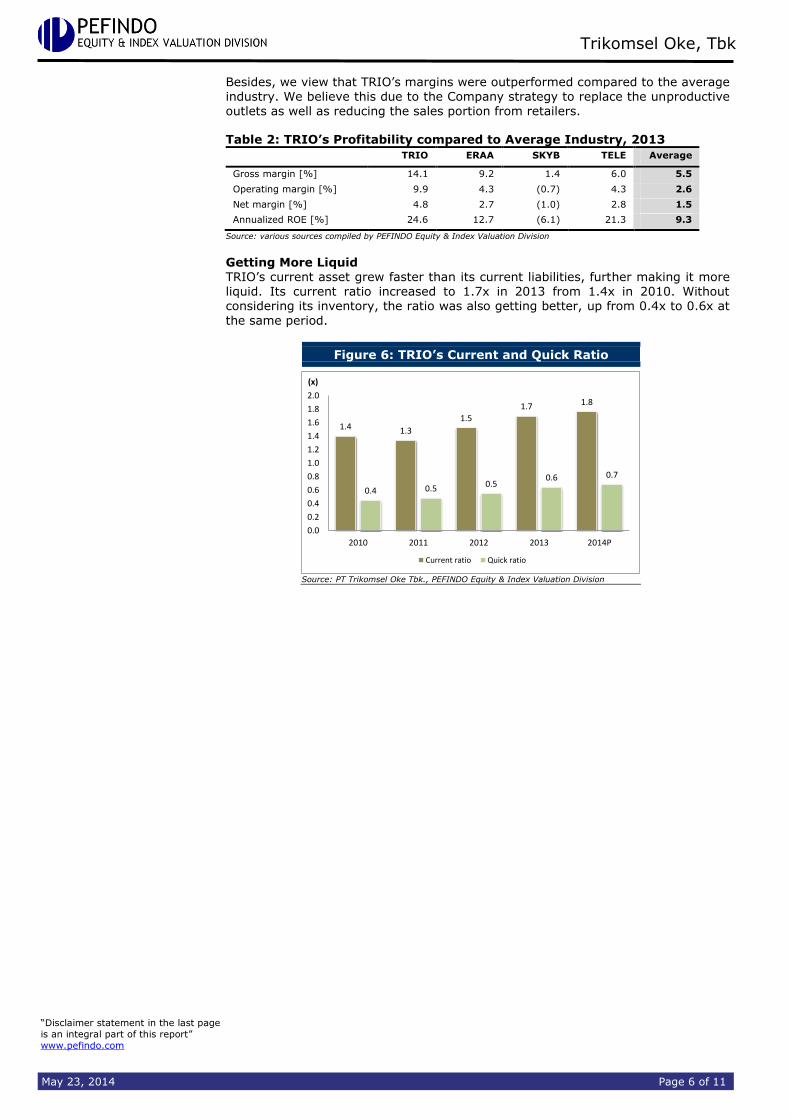
Besides, we view that TRIO’s margins were outperformed compared to the average industry. We believe this due to the Company strategy to replace the unproductive
outlets as well as reducing the sales portion from retailers.
Table 2: TRIO’s Profitability compared to Average Industry, 2013
TRIO ERAA SKYB TELE Average
Gross margin [%] 14.1 9.2 1.4 6.0 5.5
Operating margin [%] 9.9 4.3 (0.7) 4.3 2.6
Net margin [%] 4.8 2.7 (1.0) 2.8 1.5
Annualized ROE [%] 24.6 12.7 (6.1) 21.3 9.3
Source: various sources compiled by PEFINDO Equity & Index Valuation Division
Getting More Liquid TRIO’s current asset grew faster than its current liabilities, further making it more liquid. Its current ratio increased to 1.7x in 2013 from 1.4x in 2010. Without considering its inventory, the ratio was also getting better, up from 0.4x to 0.6x at
the same period.
Figure 6: TRIO’s Current and Quick Ratio
1.4 1.3
1.5
1.7 1.8
0.4 0.5 0.50.6 0.7
0.0
0.2
0.4
0.6
0.8
1.0
1.2
1.4
1.6
1.8
2.0
2010 2011 2012 2013 2014P
(x)
Current ratio Quick ratio
Source: PT Trikomsel Oke Tbk., PEFINDO Equity & Index Valuation Division
“Disclaimer statement in the last page
is an integral part of this report”
www.pefindo.com
Trikomsel Oke, Tbk
May 23, 2014 Page 7 of 11
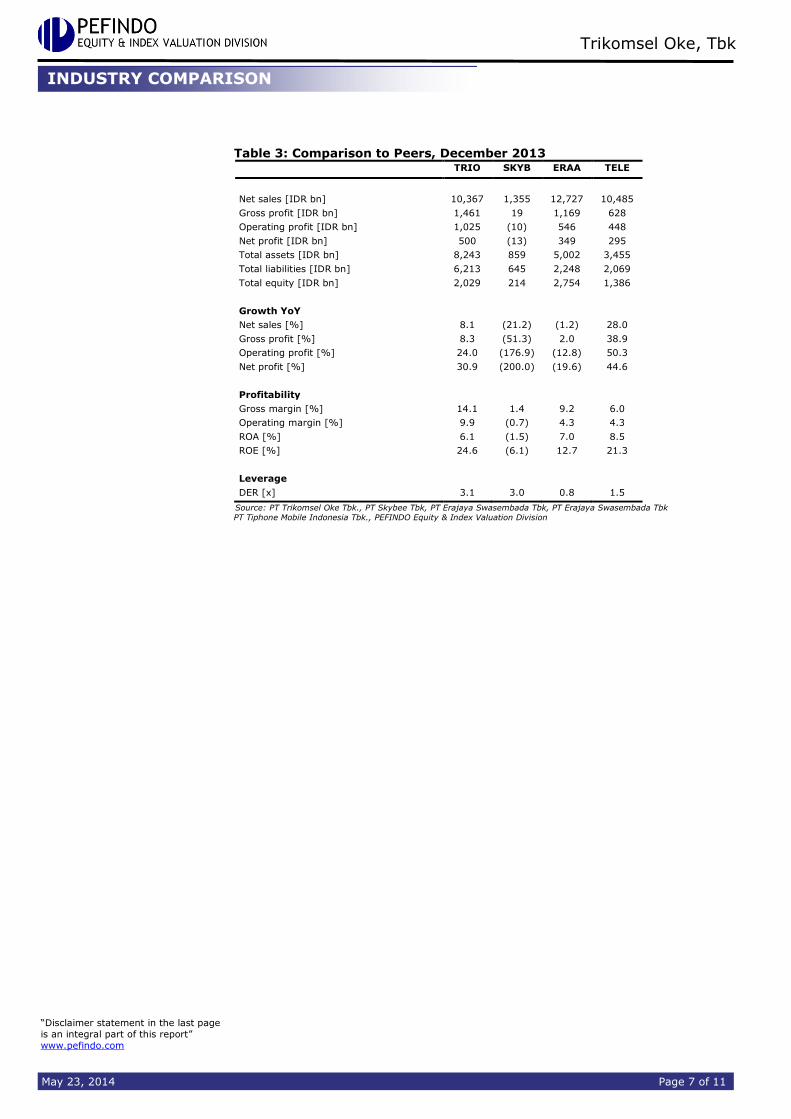
Table 3: Comparison to Peers, December 2013 TRIO SKYB ERAA TELE
Net sales [IDR bn] 10,367 1,355 12,727 10,485
Gross profit [IDR bn] 1,461 19 1,169 628
Operating profit [IDR bn] 1,025 (10) 546 448
Net profit [IDR bn] 500 (13) 349 295
Total assets [IDR bn] 8,243 859 5,002 3,455
Total liabilities [IDR bn] 6,213 645 2,248 2,069
Total equity [IDR bn] 2,029 214 2,754 1,386
Growth YoY
Net sales [%] 8.1 (21.2) (1.2) 28.0
Gross profit [%] 8.3 (51.3) 2.0 38.9
Operating profit [%] 24.0 (176.9) (12.8) 50.3
Net profit [%] 30.9 (200.0) (19.6) 44.6
Profitability
Gross margin [%] 14.1 1.4 9.2 6.0
Operating margin [%] 9.9 (0.7) 4.3 4.3
ROA [%] 6.1 (1.5) 7.0 8.5
ROE [%] 24.6 (6.1) 12.7 21.3
Leverage
DER [x] 3.1 3.0 0.8 1.5
Source: PT Trikomsel Oke Tbk., PT Skybee Tbk, PT Erajaya Swasembada Tbk, PT Erajaya Swasembada Tbk
PT Tiphone Mobile Indonesia Tbk., PEFINDO Equity & Index Valuation Division
INDUSTRY COMPARISON

“Disclaimer statement in the last page
is an integral part of this report”
www.pefindo.com
Trikomsel Oke, Tbk
May 23, 2014 Page 8 of 11
VALUATION
Methodology We apply Discounted Cash Flow (DCF) method as the main valuation approach considering the income growth is a value driver in TRIO instead of asset growth. Furthermore, we also apply Guideline Company Method (GCM) as comparison
method. This valuation is based on 100% shares price as of May 22, 2014, using TRIO’s financial report as of December 31, 2013, for our fundamental
analysis.
Value Estimation
We use Cost of Capital of 9.0% and Cost of Equity of 11.8% based on the following assumptions:
Table 4: Assumption
Risk free rate [%]* 8.0
Risk premium [%]* 3.3
Beta [x]* 1.1
Cost of Equity [%] 11.8
Marginal tax rate [%] 25.0
Debt to Equity Ratio [x] 2.7
WACC (%) 9.0
Source: Bloomberg, PEFINDO Equity & Index Valuation Division Estimates Notes: * As of May 22, 2014
**PEFINDO Beta Saham as of May 22, 2014
Target price for 12 months based on valuation as per May 22, 2014 is as follows:
Using DCF method with discount rate assumption 9.0% is IDR1,924 – IDR2,238 per share.
Using GCM method (PBV 2.5X and P/E 12.8X) is IDR1,176 – IDR1,420 per share.
In order to obtain a value which represents both value indications, we have weighted both DCF and GCM methods by 70%:30%.
Based on the above calculation, target price of TRIO for 12 months is IDR1,700 – IDR1,995 per share.
Table 5: Summary of DCF Method Valuation
Conservative Moderate Aggressive
PV of Free Cash Flows [Rp bn] 5,274 5,551 5,829
PV Terminal Value [Rp bn] 8,927 9,397 9,867
Non-Operating Asset [Rp bn] 510 510 510
Debt [Rp bn] (5,549) (5,549) (5,549)
Total Equity Value [Rp bn] 9,162 9,909 10,657
Number of Share [mn shares] 4,762 4,762 4,762
Fair Value per Share [Rp] 1,924 2,081 2,238
Source: PEFINDO Equity & Index Valuation Division Estimates
TARGET PRICE
“Disclaimer statement in the last page
is an integral part of this report”
www.pefindo.com
Trikomsel Oke, Tbk
May 23, 2014 Page 9 of 11
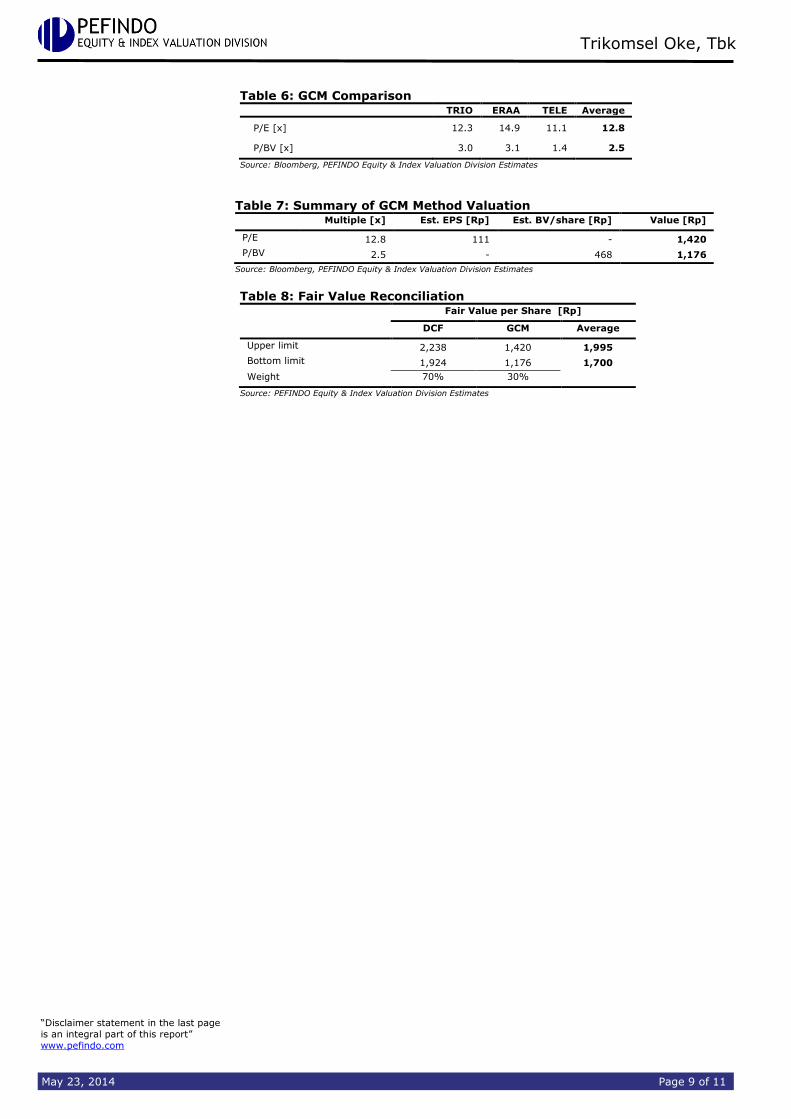
Table 6: GCM Comparison TRIO ERAA TELE Average
P/E [x] 12.3 14.9 11.1 12.8
P/BV [x] 3.0 3.1 1.4 2.5
Source: Bloomberg, PEFINDO Equity & Index Valuation Division Estimates
Table 7: Summary of GCM Method Valuation Multiple [x] Est. EPS [Rp] Est. BV/share [Rp] Value [Rp]
P/E 12.8 111 - 1,420
P/BV 2.5 - 468 1,176
Source: Bloomberg, PEFINDO Equity & Index Valuation Division Estimates
Table 8: Fair Value Reconciliation
Fair Value per Share [Rp]
DCF GCM Average
Upper limit 2,238 1,420 1,995
Bottom limit 1,924 1,176 1,700
Weight 70% 30%
Source: PEFINDO Equity & Index Valuation Division Estimates
“Disclaimer statement in the last page
is an integral part of this report”
www.pefindo.com
Trikomsel Oke, Tbk
May 23, 2014 Page 10 of 11
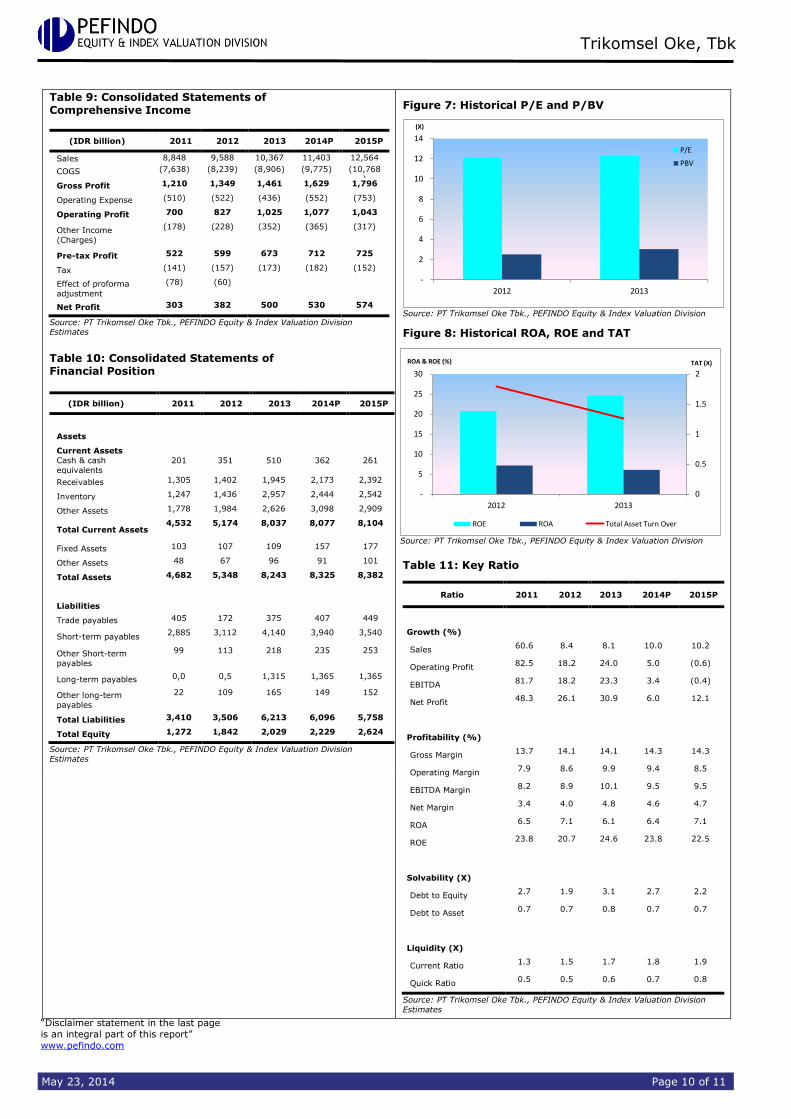
Table 9: Consolidated Statements of Comprehensive Income
(IDR billion) 2011 2012 2013 2014P 2015P
Sales 8,848 9,588 10,367 11,403 12,564
COGS (7,638) (8,239) (8,906) (9,775) (10,768)
Gross Profit 1,210 1,349 1,461 1,629 1,796
Operating Expense (510) (522) (436) (552) (753)
Operating Profit 700 827 1,025 1,077 1,043
Other Income
(Charges)
(178) (228) (352) (365) (317)
Pre-tax Profit 522 599 673 712 725
Tax (141) (157) (173) (182) (152)
Effect of proforma
adjustment
(78) (60)
Net Profit 303 382 500 530 574
Source: PT Trikomsel Oke Tbk., PEFINDO Equity & Index Valuation Division Estimates
Table 10: Consolidated Statements of Financial Position
(IDR billion) 2011 2012 2013 2014P 2015P
Assets
Current Assets
Cash & cash
equivalents
201 351 510 362 261
Receivables 1,305 1,402 1,945 2,173 2,392
Inventory 1,247 1,436 2,957 2,444 2,542
Other Assets 1,778 1,984 2,626 3,098 2,909
Total Current Assets 4,532 5,174 8,037 8,077 8,104
Fixed Assets 103 107 109 157 177
Other Assets 48 67 96 91 101
Total Assets 4,682 5,348 8,243 8,325 8,382
Liabilities
Trade payables 405 172 375 407 449
Short-term payables 2,885 3,112 4,140 3,940 3,540
Other Short-term
payables
99 113 218 235 253
Long-term payables 0,0 0,5 1,315 1,365 1,365
Other long-term
payables
22 109 165 149 152
Total Liabilities 3,410 3,506 6,213 6,096 5,758
Total Equity 1,272 1,842 2,029 2,229 2,624
Source: PT Trikomsel Oke Tbk., PEFINDO Equity & Index Valuation Division
Estimates
Figure 7: Historical P/E and P/BV
-
2
4
6
8
10
12
14
2012 2013
(X)
P/E
PBV
Source: PT Trikomsel Oke Tbk., PEFINDO Equity & Index Valuation Division
Figure 8: Historical ROA, ROE and TAT
0
0.5
1
1.5
2
-
5
10
15
20
25
30
2012 2013
TAT (X)ROA & ROE (%)
ROE ROA Total Asset Turn Over
Source: PT Trikomsel Oke Tbk., PEFINDO Equity & Index Valuation Division
Table 11: Key Ratio
Ratio 2011 2012 2013 2014P 2015P
Growth (%)
Sales 60.6 8.4 8.1 10.0 10.2
Operating Profit 82.5 18.2 24.0 5.0 (0.6)
EBITDA 81.7 18.2 23.3 3.4 (0.4)
Net Profit 48.3 26.1 30.9 6.0 12.1
Profitability (%)
Gross Margin 13.7 14.1 14.1 14.3 14.3
Operating Margin 7.9 8.6 9.9 9.4 8.5
EBITDA Margin 8.2 8.9 10.1 9.5 9.5
Net Margin 3.4 4.0 4.8 4.6 4.7
ROA 6.5 7.1 6.1 6.4 7.1
ROE 23.8 20.7 24.6 23.8 22.5
Solvability (X)
Debt to Equity 2.7 1.9 3.1 2.7 2.2
Debt to Asset 0.7 0.7 0.8 0.7 0.7
Liquidity (X)
Current Ratio 1.3 1.5 1.7 1.8 1.9
Quick Ratio 0.5 0.5 0.6 0.7 0.8
Source: PT Trikomsel Oke Tbk., PEFINDO Equity & Index Valuation Division
Estimates
“Disclaimer statement in the last page
is an integral part of this report”
www.pefindo.com
Trikomsel Oke, Tbk
May 23, 2014 Page 11 of 11
DISCLAIMER
This report was prepared based on trusted and reliable sources. Nevertheless, we do not guarantee its completeness, accuracy and adequacy. Therefore, we are not responsible for any
investment decisions made based on this report. All assumptions, opinions and predictions were
solely our internal judgments as of the reporting date, and those judgments are subject to change without further notice.
We are not responsible for any mistakes or negligence that occurs by using this report. Recent performance cannot always be used as a reference for future outcome. This report does not
offer a recommendation to purchase or hold particular shares. This report might not be suitable
for some investors. All opinions in this report have been presented fairly as of the issuing date with good intentions; however, they could change at any time without further notice. The price,
value or income of each share of the Company stated in this report might be lower than
investor expectations, and investors may obtain returns lower than the invested amount.
Investment is defined as the probable income that will be received in the future; nonetheless
such returns may fluctuate. As for companies whose shares are denominated in a currency
other than Rupiah, foreign exchange fluctuation may reduce their share value, price or the returns for investors. This report does not contain any information for tax considerations i n
investment decision-making.
The share price target in this report is a fundamental value, not a fair market value or a
transaction price reference required by regulations.
The share price target issued by the PEFINDO Equity & Index Valuation Division is not a
recommendation to buy, sell or hold particular shares. It should not be considered as
investment advice from the PEFINDO Equity & Index Valuation Division and its scope of service to some parties, including listed companies, financial advisors, brokers, investment banks,
financial institutions and intermediaries, does not correlate with receiving rewards or any other
benefits from such parties.
This report is not intended for any particular investor and cannot be used as part of an
objective investment analysis of particular shares, an investment recommendation, or an investment strategy. We strongly recommend investors to consider the suitability of the
situation and conditions before making a decision in relation with the figures in this repor t. If
necessary, consult with your financial advisor.
PEFINDO keeps the activities of the Equity Valuation Division separate from its Ratings Division
to preserve the independence and objectivity of its analytical processes and products. PEFINDO has established policies and procedures to ROTItain the confidentiality of non-public information
received in connection with each analytical process. The entire process, methodology and the
database used in the preparation of the Reference Share Price Target Report as a whole are different from the processes, methodologies and databases used by PEFINDO in issuing ratings.
This report was prepared and composed by the PEFINDO Equity & Index Valuation Division with the objective of enhancing the transparency of share prices of listed companies in the Indonesia
Stock Exchange (IDX). This report is also free of influence from any other party, including
pressure or force either from IDX or the listed company reviewed. PEFINDO Equity & Index Valuation Division earns a reward amounting to IDR20 million from IDX and the reviewed
company for issuing this report twice a year. For further information, please visit our website at
http://www.pefindo.com
This report was prepared and composed by the PEFINDO Equity & Index Valuation Division. In Indonesia, this report is published in our website and in the IDX website .