pembangunan berkelanjutan, pelaporan keberlanjutan, standar...
TRANSCRIPT
Pembangunan Berkelanjutan, Pelaporan Keberlanjutan, Standar GRI G3.1 dan GRI FPSS Jalal
Lingkar Studi CSR www.csrindonesia.com
Dipersiapkan untuk diskusi dengan perusahaan-perusahaan consumer goods
Jakarta, 16 April 2012

Report, or Explain Why Not.
(Peraturan yang berlaku untuk seluruh
perusahaan di Uni Eropa mulai tahun 2015.)
AGENDA
1. Pembangunan Berkelanjutan dan Keberlanjutan Perusahaan
2. Pelaporan keberlanjutan 3. Global Reporting Initiative
Generation 3.1 (GRI G3.1) 4. GRI Food Processing Sector
Supplement

Pembangunan Berkelanjutan dan Keberlanjutan Perusahaan

Pembangunan Berkelanjutan
• Pembangunan yang memenuhi kebutuhan generasi sekarang tanpa mengorbankan kemampuan generasi mendatang untuk memenuhi kebutuhannya (WCED, 1987, Our Common Future).
• Jumlah total kapital--sosial, ekonomi, lingkungan, budaya, politik, personal--yang ditransfer dari satu generasi ke generasi berikutnya minimal sama (Serageldin, I. 1996. Sustainability as Opportunity and the Problem of Social Capital’, Brown Journal of World Affairs Vol. 3 No. 2).
• Menjadi inspirasi utama triple bottom line: ekonomi, sosial, lingkungan. Tak ada aspek yang boleh dikorbankan dalam pembangunan.

Jejak Kaki Ekologis Manusia
Sumber: Ewing, et al. 2010. Ecological Footprint Atlas 2010. Global Footprint Network.
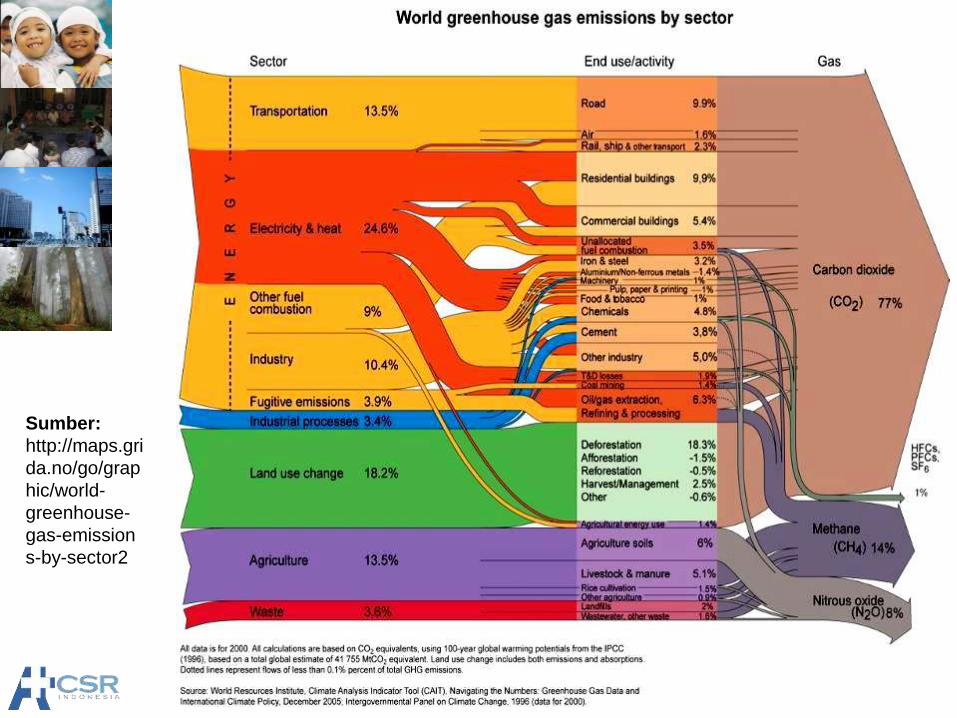
Sumber:
http://maps.gri
da.no/go/grap
hic/world-
greenhouse-
gas-emission
s-by-sector2

Peran Potensial Perusahaan dalam Pembangunan Berkelanjutan
“For the business enterprise, sustainable development means adopting business strategies and activities that meet the needs of the enterprise and its stakeholders today while protecting, sustaining and enhancing the human and natural resources that will be needed in the future.” Business Strategy for Sustainable Development (IISD, 1992)
“…If sustainable development is to achieve its potential, it must be integrated into the planning and measurement systems of business enterprises.” (Robert
Steele, AtKisson Group International)
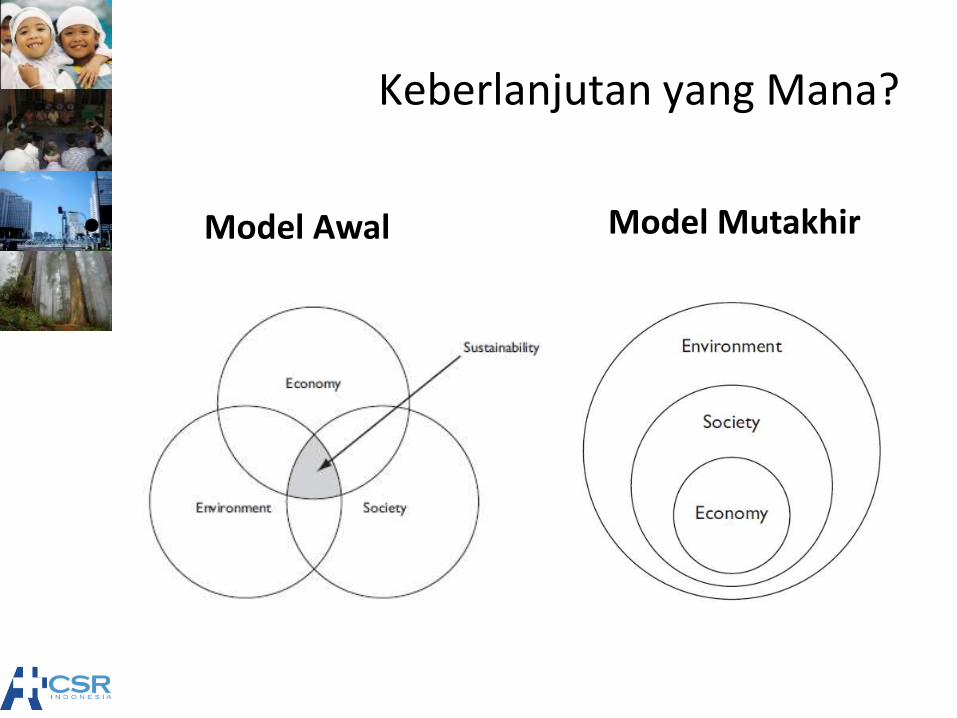
Keberlanjutan yang Mana?
• Model Awal Model Mutakhir
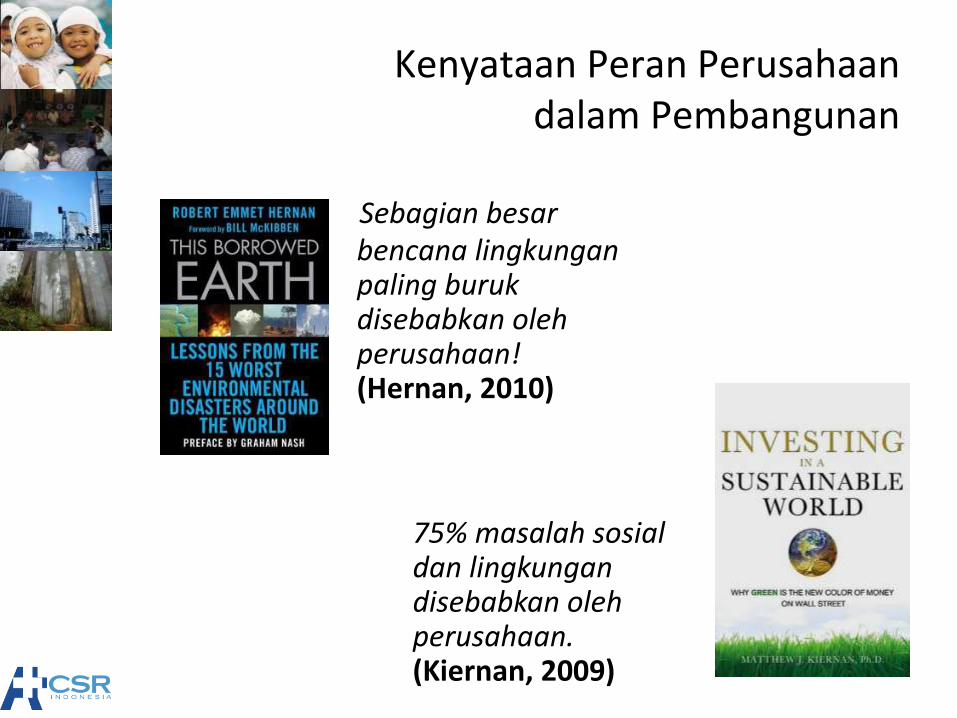
Kenyataan Peran Perusahaan dalam Pembangunan
Sebagian besar bencana lingkungan paling buruk disebabkan oleh perusahaan! (Hernan, 2010)
75% masalah sosial
dan lingkungan disebabkan oleh perusahaan. (Kiernan, 2009)
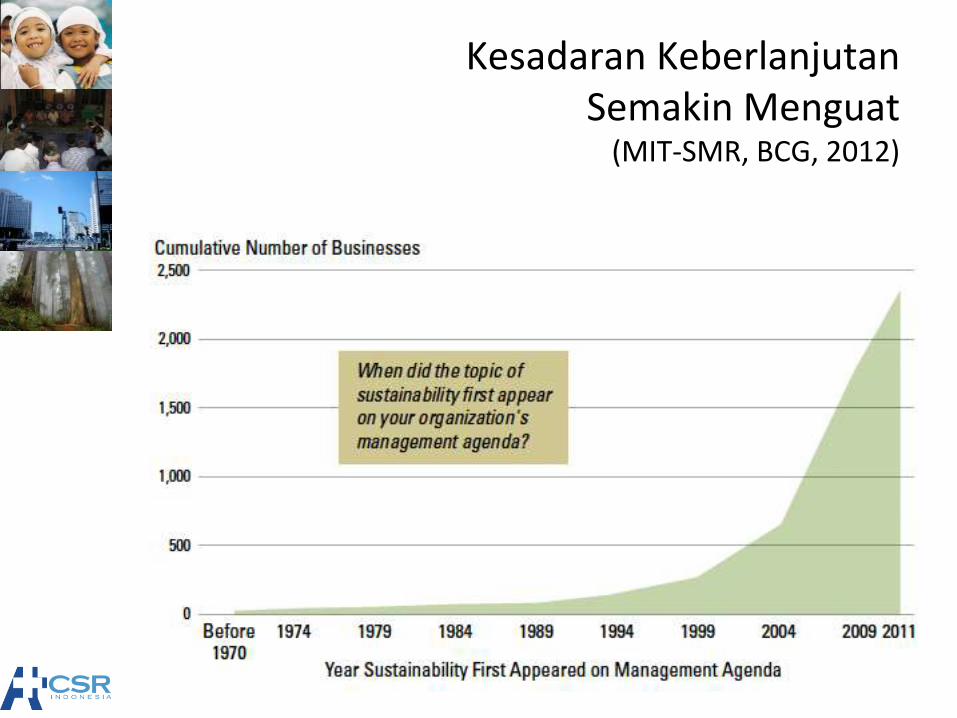
Kesadaran Keberlanjutan Semakin Menguat
(MIT-SMR, BCG, 2012)
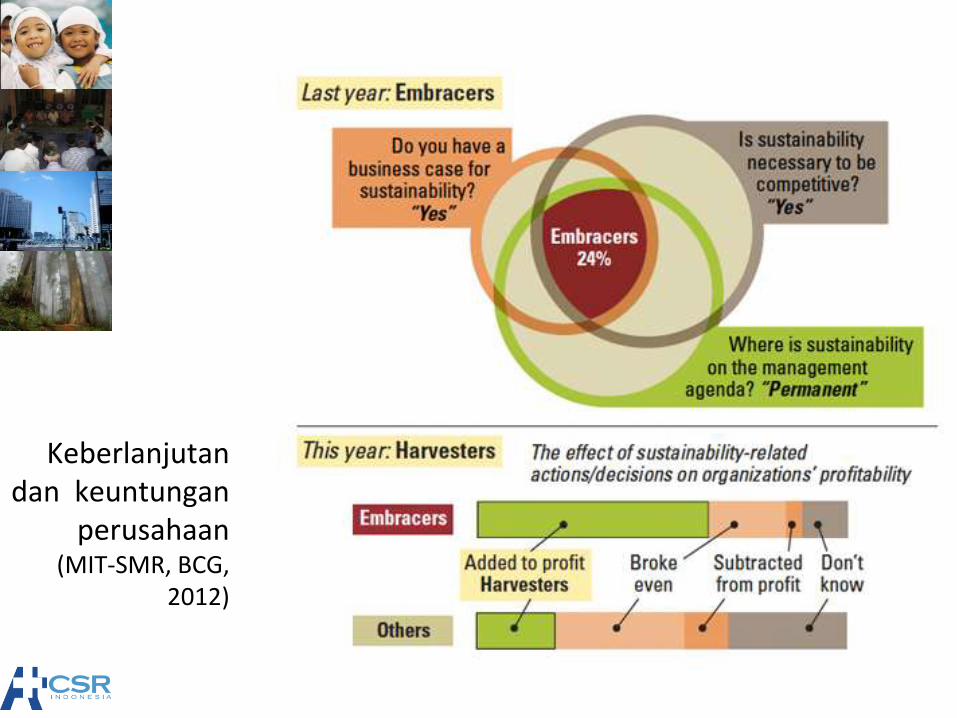
Keberlanjutan dan keuntungan
perusahaan (MIT-SMR, BCG,
2012)

Komitmen Keberlanjutan
di Berbagai Wilayah
(MIT-SMR, BCG, 2012)

Kerangka Keberlanjutan
Model yang menuntun cara
berpikir dan bertindak untuk
mencapai tujuan keberlanjutan.
(AtKisson, 2007)
1. The Natural Step
2. ISIS - Compass of Sustainability
3. Triple Bottom Line
4. ISO 26000
5. IFC Performance Standards
6. Global Reporting Initiative

Kerangka 1.
The Natural Step
• Dibuat oleh Dr. Karl-Henrik Robert, sebagai cara untuk menangani masalah lingkungan yang menyebabkan kanker.
• Dengan kerangka ABCD: Awareness, Baseline Mapping, Creating a Vision, dan Down to a Action, menjadi sangat terkenal, terutama di Eropa.
• Banyak digunakan pemerintah, perusahaan, maupun masyarakat.
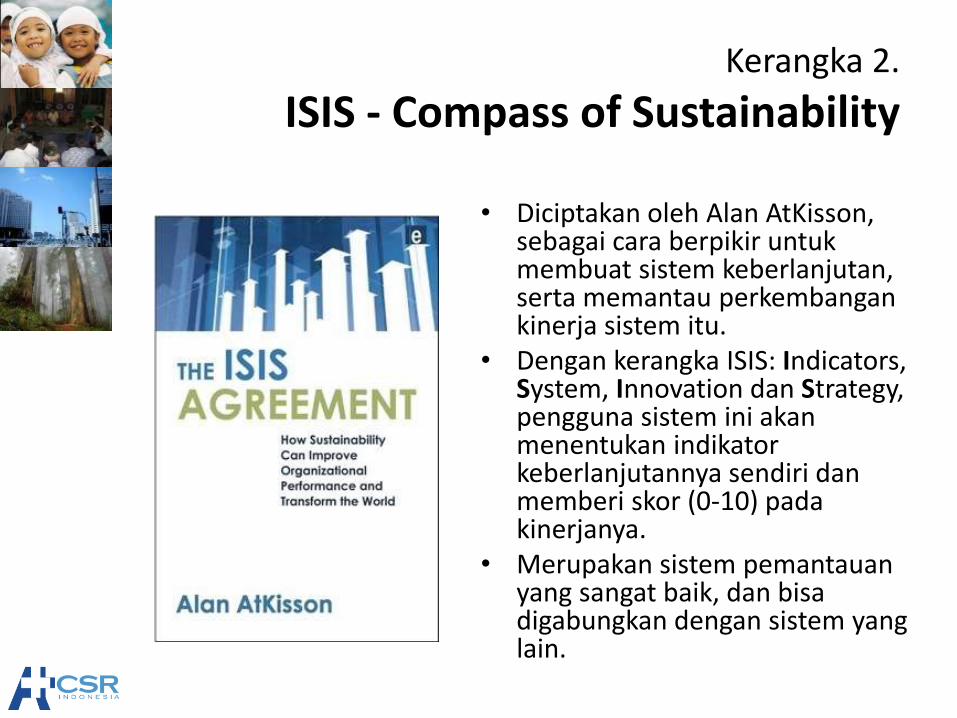
Kerangka 2.
ISIS - Compass of Sustainability
• Diciptakan oleh Alan AtKisson, sebagai cara berpikir untuk membuat sistem keberlanjutan, serta memantau perkembangan kinerja sistem itu.
• Dengan kerangka ISIS: Indicators, System, Innovation dan Strategy, pengguna sistem ini akan menentukan indikator keberlanjutannya sendiri dan memberi skor (0-10) pada kinerjanya.
• Merupakan sistem pemantauan yang sangat baik, dan bisa digabungkan dengan sistem yang lain.
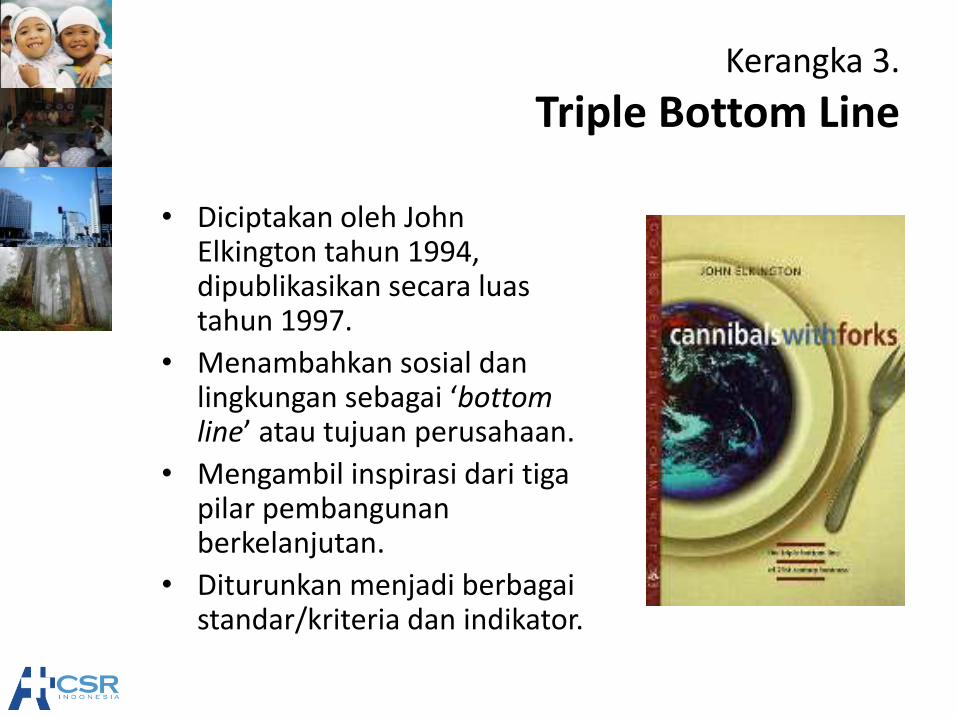
Kerangka 3.
Triple Bottom Line
• Diciptakan oleh John Elkington tahun 1994, dipublikasikan secara luas tahun 1997.
• Menambahkan sosial dan lingkungan sebagai ‘bottom line’ atau tujuan perusahaan.
• Mengambil inspirasi dari tiga pilar pembangunan berkelanjutan.
• Diturunkan menjadi berbagai standar/kriteria dan indikator.

Kerangka 4.
ISO 26000:2010
• Dibuat pertama kali dengan tujuan untuk perlindungan konsumen, kemudian membesar menjadi perlindungan untuk seluruh pemangku kepentingan dengan 7 subjek (kumpulan isu) inti.
• Telah diluncurkan pada tanggal 1 November 2010, setelah disetujui 93% negara anggota ISO yang memilih, termasuk Indonesia.
• Sifatnya adalah guidance, sehingga paling dekat dengan standar manajemen.

Kerangka 5.
IFC Performance Standards
• Dibuat terutama untuk mengelola projek Kategori A “berpotensi signifikan mempunyai dampak negatif yang beragam dan tak terbalikkan.”
• Dasar due diligence bagi bank-bank penanda tangan Equator Principles dengan biaya > USD10 juta.
• Sering digunakan investor untuk mengetahui risiko sosial dan lingkungan.
• Standar de facto kinerja sosial dan lingkungan sejak 2006. Versi baru mulai dipergunakan per 1 Januari 2012.

Kerangka 6.
Global Reporting Initiative
• Dibuat dengan konsensus pemangku kepentingan global, sejak 23 Maret 2011 telah menggunakan G3.1. Akhir tahun 2012 akan diluncurkan G4.
• Kemungkinan pada bulan Juni 2012 (Rio+20) akan disepakati pewajiban laporan keberlanjutan utnuk seluruh perusahaan bernilai pasar >USD 100 juta.
• Bukan kerangka manajemen, melainkan kerangka pelaporan kinerja.
• Ketika tak ada kerangka lain, banyak perusahaan menggunakannya sebagai kerangka manajemen untuk aspek sosial dan lingkungan.
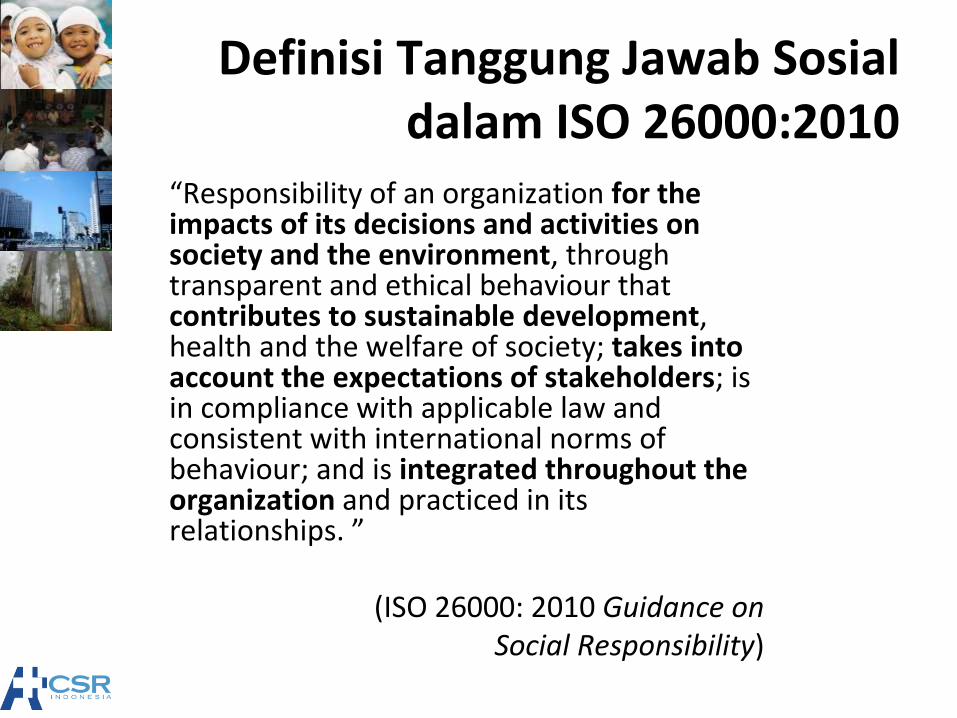
Definisi Tanggung Jawab Sosial dalam ISO 26000:2010
“Responsibility of an organization for the impacts of its decisions and activities on society and the environment, through transparent and ethical behaviour that contributes to sustainable development, health and the welfare of society; takes into account the expectations of stakeholders; is in compliance with applicable law and consistent with international norms of behaviour; and is integrated throughout the organization and practiced in its relationships. ”
(ISO 26000: 2010 Guidance on Social Responsibility)
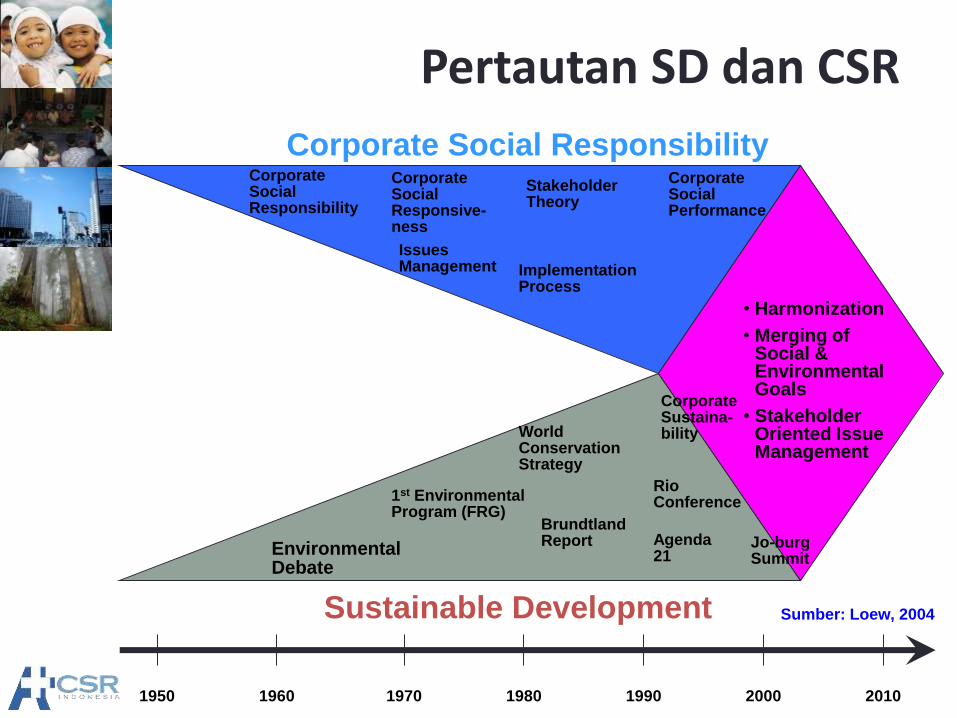
1950 1960 1970 1980 1990 2000 2010
Environmental Debate
1st Environmental Program (FRG)
World Conservation Strategy
Sustainable Development
Corporate Social Responsibility
Brundtland Report
Rio Conference
Corporate Social Responsive-ness
Issues Management
Agenda 21
Corporate Sustaina-bility
Jo-burg Summit
Stakeholder Theory
Implementation Process
Corporate Social Performance
• Harmonization
• Merging of Social & Environmental Goals
• Stakeholder Oriented Issue Management
Sumber: Loew, 2004
Corporate Social Responsibility
Pertautan SD dan CSR
Pelaporan Keberlanjutan

Mengapa Melaporkan? Futtera, KPMG, SustainAbility (2011)
1. Menunjukkan akuntabilitas.
2. Menunjukkan peningkatan kinerja.
3. Membangun hubungan dengan pemangku kepentingan.
4. Menunjukkan manajemen keberlanjutan.
5. Menunjukkan kondisi kinerja.

Dengan Apa Pelaporannya? Corporate Register (2011)
Majoritas perusahaan belum melaporkan dengan standar GRI; namun jelas standar GRI semakin penting.
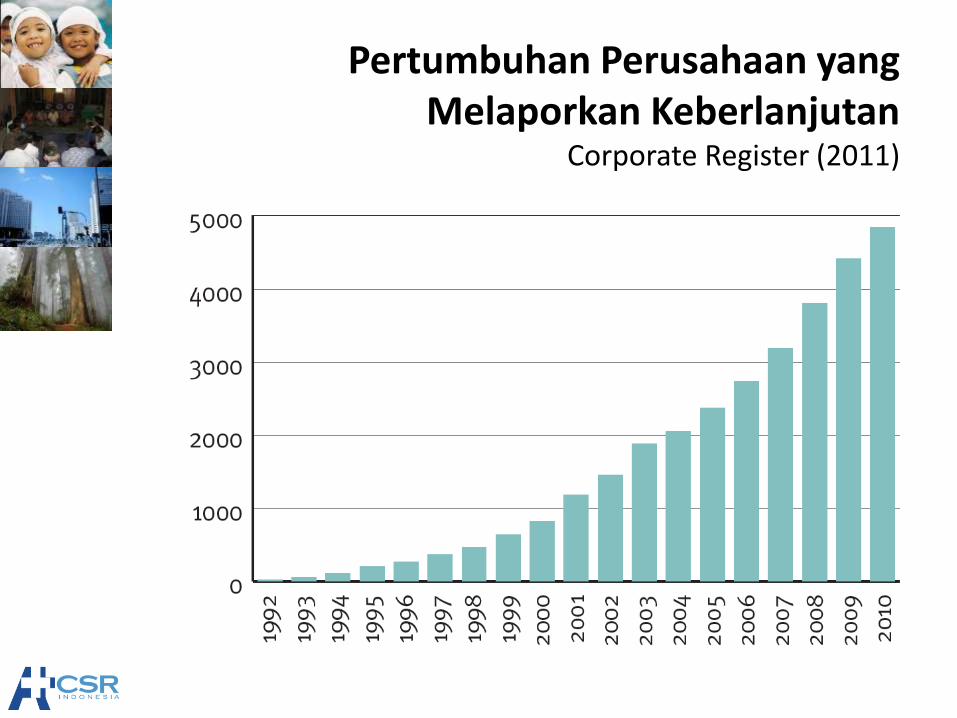
Pertumbuhan Perusahaan yang Melaporkan Keberlanjutan
Corporate Register (2011)
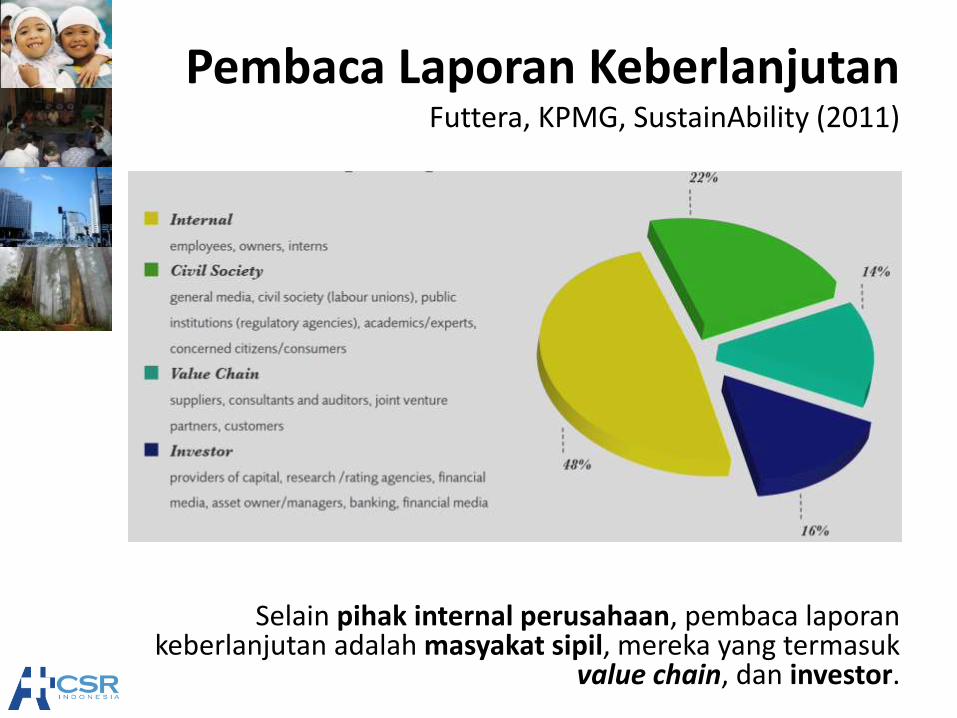
Pembaca Laporan Keberlanjutan Futtera, KPMG, SustainAbility (2011)
Selain pihak internal perusahaan, pembaca laporan keberlanjutan adalah masyakat sipil, mereka yang termasuk
value chain, dan investor.

Pembuat Laporan Keberlanjutan Futtera, KPMG, SustainAbility (2011)
Sektor ekstraktif termasuk pelapor yang besar!

Global Reporting Initiative Generation 3.1 (GRI G3.1)

Indikator-indikator dalam GRI Standard Disclosure G3.1
1. Ekonomi (9 indikator) 2. Lingkungan (30 indikator) 3. Sosial (45 indikator)
• Ketenagakerjaan (15) • HAM (11) • Masyarakat (10) • Tanggung Jawab atas
Produk (9)
Dengan cakupan yang luas, pelaporan keberlanjutan adalah
tanggung jawab seluruh bagian—bukan hanya “bagian CSR”—
dalam perusahaan!

Materialitas Isu
1. Sustainability impacts, risks and opportunities
2. Significance to stakeholders
3. Significance to the organization
4. Prioritizing

Sumber Materialitas Isu (AA1000)

Uji Materialitas Isu
Perusahaan sejenis.
Kebijakan.
Dampak finansial.
Perhatian pemangku kepentingan.
Norma masyarakat.

Perusahaan Sejenis
Apakah ada standar internasional/nasional untuk industri kita?
Apa yang dilaporkan dalam laporan keberlanjutan perusahaan paling terkemuka?
Apakah yang dikelola oleh perusahaan nasional dalam industri kita?
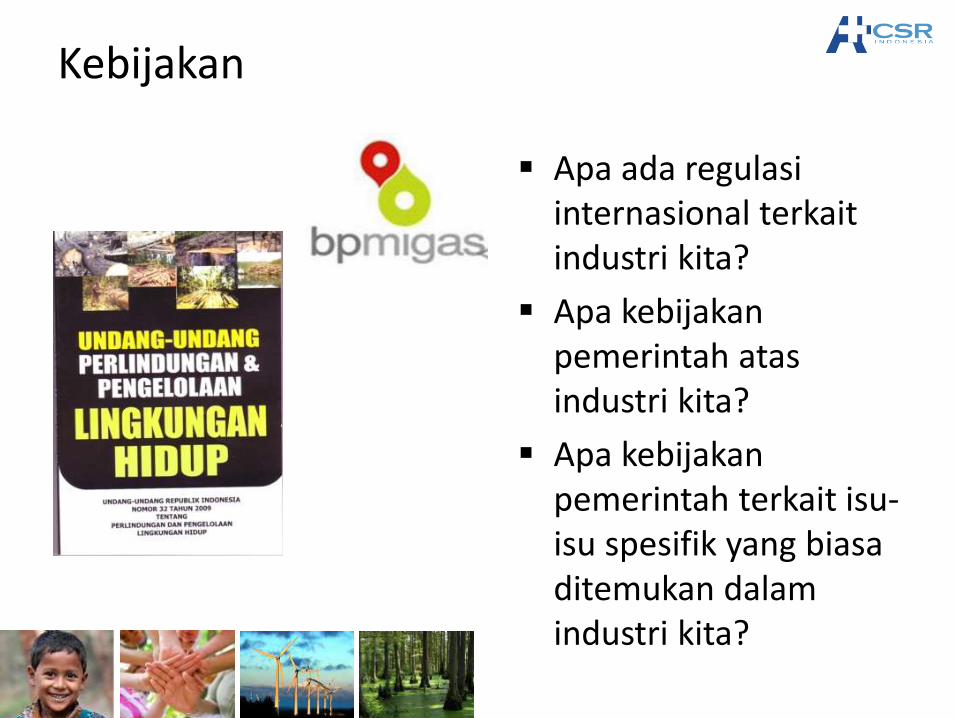
Kebijakan
Apa ada regulasi internasional terkait industri kita?
Apa kebijakan pemerintah atas industri kita?
Apa kebijakan pemerintah terkait isu-isu spesifik yang biasa ditemukan dalam industri kita?
Dampak Finansial
Apa dampak terhadap kondisi finansial perusahaan apabila isu tersebut diabaikan?
Apa dampak terhadap kondisi finansial perusahaan apabila isu itu dikelola dengan benar/diambil peluangnya?

Perhatian Pemangku Kepentingan
Mana isu yang merupakan perhatian seluruh pemangku kepentingan?
Mana isu yang merupakan perhatian pemangku kepentingan primer?
Mana isu yang merupakan perhatian pemangku kepentingan paling powerful?

Norma Masyarakat
Mana isu yang menjadi perhatian masyarakat global?
Mana isu yang menonjol dalam wacana nasional?
Mana isu yang terkait dengan norma (termasuk adat) masyarakat lokal di mana perusahaan beroperasi?

Rekomendasi Pelaporan Isu

Level Aplikasi Laporan Keberlanjutan
Logframe Indikator Kinerja GRI
1. Performance Indicators 2. Category 3. Aspect 4. Performance Indicator
Performance indicator: Qualitative or quantitative
information about results or outcomes associated with the organization that is comparable and demonstrates change over time.
Information on trends should be presented for the current reporting period and at least two previous periods, as well as future targets, where they have been established.

Deskripsi Isi Indikator Kinerja
1. Goals and Performance 2. Policy 3. Organizational Responsibility 4. Training and Awareness 5. Monitoring and Follow Up 6. Additional Contextual Information: Key successes and shortcomings; Major organizational
risks and opportunities; Major changes in the reporting period to systems or structures to improve performance; and Key strategies and procedures for implementing policies and achieving goals.
Economic Performance Indicators
• The economic dimension of sustainability concerns the organization ‘s impact on the economic conditions of its stakeholders and on economic systems at local, national and global level.
• The economic Indicators illustrate: First, flow of capital among different stakeholders; and two, main economic impacts of the organization throughout society.
• Aspects: Economic Performance, Market Presence, and Indirect Economic Impacts.

Performance Indicators: Economic Three (3) Aspects, Nine (9) Indicators
Core/Add
Code Indicators
1. Aspect: Economic Performance
Core EC1 Direct economic value generated and distributed, including revenues, operating costs, employee compensation, donations and other community investments, retained earnings, and payments to capital providers and governments.
Core EC2 Financial implications and other risks and opportunities for the organization’s activities due to climate change.
Core EC3 Coverage of the organization’s defined benefit plan obligations.
Core EC4 Significant financial assistance received from government.

PI: Economic
2. Aspect: Market Presence
Add EC5 Range of ratios of standard entry level wage compared to local minimum wage at significant locations of operation.
Core EC6 Policy, practices, and proportion of spending on locally-based suppliers at significant locations of operation.
Core EC7 Procedures for local hiring and proportion of senior management hired from the local community at significant locations of operation.
3. Aspect: Indirect Economic Impacts
Core EC8 Development and impact of infrastructure investments and services provided primarily for public benefit through commercial, in-kind, or pro bono engagement.
Add EC9 Understanding and describing significant indirect economic impacts, including the extent of impacts.
Environmental Performance Indicators
• The Environmental dimension of sustainability concerns an organization’s impacts on living and nonliving natural systems, including ecosystems, land, air, and water.
• Environmental Aspects: Materials; Energy; Water; Biodiversity; Emissions, Effluents, and Waste; Products and Services; Compliance; Transport; and Overall.

Performance Indicators: Environment Nine (9) Aspects, Thirty (30) Indicators
Core/Add
Code Indicators
1. Aspect: Materials
Core EN1 Materials used by weight or volume.
Core EN2 Percentage of materials used that are recycled input materials.
2. Aspect: Energy
Core EN3 Direct energy consumption by primary energy source.
Core EN4 Indirect energy consumption by primary source.
Add EN5 Energy saved due to conservation and efficiency improvements.
Add EN6 Initiative to provide energy-efficient or renewable energy-based products and services, and reductions in energy requirements as a result of these initiatives.
Add EN7 Initiatives to reduce indirect energy consumption and reductions achieved.

3. Aspect: Water
Core EN8 Total water withdrawal by source.
Add EN9 Water sources significantly affected by withdrawal of water.
Add EN10 Percentage and total volume of water recycled and reused.
4. Aspect: Biodiversity
Core EN11 Location and size of land owned, leased, managed in, or adjacent to, protected areas and areas of high biodiversity value outside protected areas.
Core EN12 Description of significant impacts of activities, products, and services on biodiversity in protected areas and areas of high biodiversity value outside protected areas.
Add EN13 Habitats protected or restored.
Add EN14 Strategies, current actions, and future plans for managing impacts on biodiversity.
Add EN15 Number of IUCN Red List species and national conservation list species with habitats in areas affected by operations, by level of extinction risk.

5. Aspect: Emissions, Effluents, and Waste
Core EN16 Total direct and indirect greenhouse gas emissions by weight.
Core EN17 Other relevant indirect greenhouse gas emissions by weight.
Add EN18 Initiatives to reduce greenhouse gas emissions and reductions achieved.
Core EN19 Emissions of ozone-depleting substances by weight.
Core EN20 NOx, SOx, and other significant air emissions by type and weight.
Core EN21 Total water discharge by quality and destination.
Core EN22 Total weight of waste by type and disposal method.
Core EN23 Total number and volume of significant spills.
Add EN24 Weight of transported, imported, exported, or treated waste deemed hazardous under the term of the Basel Convention Annex I, II, III, and IV, and percentage of transported waste shipped internationally.
Add EN25 Identity, size, protected status, and biodiversity value of water bodies and related habitats significantly affected by the reporting organization’s discharge of water and runoff.

6. Aspect: Products and Services
Core EN26 Initiatives to mitigate environmental impacts of products and services, and extent of impact mitigation.
Core EN27 Percentage of products sold and their packaging materials that are reclaimed by category.
7. Aspect: Compliance
Core EN28 Monetary value of significant fines and total number of non-monetary sanctions for non-compliance with environmental laws and regulations.
8. Aspect: Transport
Add EN29 Significant environmental impacts of transporting products and other goods and materials used for the organization’s operations, and transporting members of the workforce.
9. Aspect: Overall
Add EN30 Total environmental protection expenditures and investments by type.
Social Performance Indicators
• The Social dimension of sustainability concerns the impacts an organization has on the social systems within which it operates.
• Category: Labor Practices and Decent Work, Human Rights, Society, and Product Responsibility.

Performance Indicators: Social Category: Human Rights 7 Aspects, 9 Indicators
Core/Add
Code Indicators
1. Aspect: Investment and Procurement Practices
Core HR1 Percentage and total number of significant investment agreements that include human rights clauses or that have undergone human rights screening.
Core HR2 Percentage of significant suppliers and contractors that have undergone screening on human rights and actions taken.
Add HR3 Total hours of employee training on policies and procedures concerning aspects of human rights that are relevant to operations, including the percentage of employees trained.
2. Aspect: Non-discrimination
Core HR4 Total number of incidents of discrimination and actions taken

PI: Social (Human Rights)
3. Aspect: Freedom of Association and Collective Bargaining
Core HR5 Operations identified in which the right to exercise freedom of association and collective bargaining may be at significant risk, and actions taken to support these rights.
4. Aspect: Child Labor
Core HR6 Operations identified as having significant risk for incidents of child labor, and measures taken to contribute to the elimination of child labor.
5. Aspect: Forced and Compulsory Labor
Core HR7 Operations identified as having significant risk for incidents of forced or compulsory labor, and measures taken to contribute to the elimination of forced or compulsory labor.
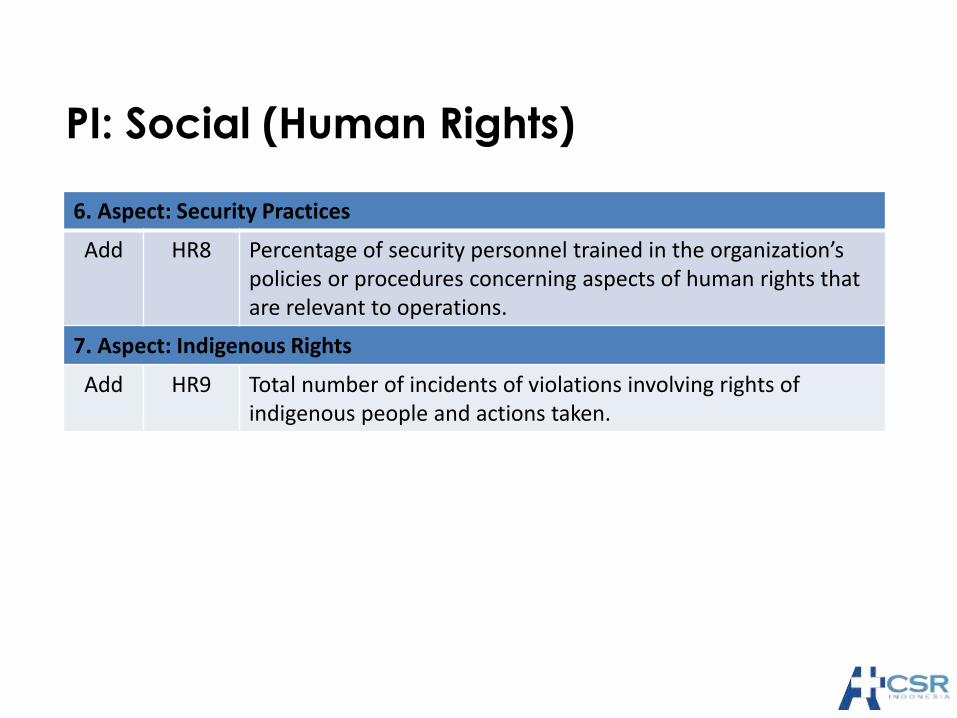
PI: Social (Human Rights)
6. Aspect: Security Practices
Add HR8 Percentage of security personnel trained in the organization’s policies or procedures concerning aspects of human rights that are relevant to operations.
7. Aspect: Indigenous Rights
Add HR9 Total number of incidents of violations involving rights of indigenous people and actions taken.

Performance Indicators: Social Category: Labor Practices & Decent Work
5 Aspects, 14 Indicators
Core/Add
Code Indicators
1. Aspect: Employment
Core LA1 Total workforce by employment type, employment contract, and region.
Core LA2 Total number and rate of employee turnover by age group, gender, and region.
Add LA3 Benefits provided to full-time employees that are not provided to temporary or part-time employees, by major operations.
2. Aspect: Labor/Management Relations
Core LA4 Percentage of employees covered by collective bargaining agreements.
Core LA5 Minimum notice period(s) regarding significant operational changes, including whether it is specified in collective agreements.

PI: Social (Labor Practices & Decent Work)
3. Aspect: Occupational Health and Safety
Add LA6 Percentage of total workforce represented in formal joint management-worker health and safety committees that help monitor and advise on occupational health and safety programs.
Core LA7 Rates of injury, occupational diseases, lost days, and absenteeism, and total number of work-related fatalities by region.
Core LA8 Education, training, counseling, prevention, and risk-control programs in place to assist workforce members, their families, or community members regarding serious diseases.
Add LA9 Health and safety topics covered in formal agreements with trade unions. Health and safety topics covered in formal agreements with trade unions.

PI: Social (Labor Practices & Decent Work)
4. Aspect: Training and Education
Core LA10 Average hours of training per year per employee by employee category.
Add LA11 Programs for skills management and lifelong learning that support the continued employability of employees and assist them in managing career endings.
Add LA12 Percentage of employees receiving regular performance and career development reviews.
5. Aspect: Diversity and Equal Opportunity
Core LA13 Composition of governance bodies and breakdown of employees per category according to gender, age group, minority group membership, and other indicators of diversity.
Core LA14 Ratio of basic salary of men to women by employee category.

Performance Indicators: Social Category: Product Responsibility
5 Aspects, 9 Indicators
Core/Add
Code Indicators
1. Aspect: Customer Health and Safety
Core PR1 Life cycle stages in which health and safety impacts of products and services are assessed for improvement, and percentage of significant products and services categories subject to such procedures.
Add PR2 Total number of incidents of non-compliance with regulations and voluntary codes concerning health and safety impacts of products and services, by type of outcomes.

2. Aspect: Product and Service Labeling
Core PR3 Type of product and service information required by procedures, and percentage of significant products and services subject to such information requirements.
Add PR4 Total number of incidents of non-compliance with regulations and voluntary codes concerning product and service information and labeling, by type of outcomes.
Add PR5 Practices related to customer satisfaction, including results of surveys measuring customer satisfaction.
3. Aspect: Marketing Communications
Core PR6 Programs for adherence to laws, standards, and voluntary codes related to marketing communications, including advertising, promotion, and sponsorship.
Add PR7 Total number of incidents of non-compliance with regulations and voluntary codes concerning marketing communications, including advertising, promotion, and sponsorship, by type of outcomes.
PI: Social (Product Responsibility)

PI: Social (Product Responsibility)
4. Aspect: Customer Privacy
Add PR8 Total number of substantiated complaints regarding breaches of customer privacy and losses of customer data.
5. Aspect: Compliance
Core PR9 Monetary value of significant fines for non-compliance with laws and regulations concerning the provision and use of products and services.
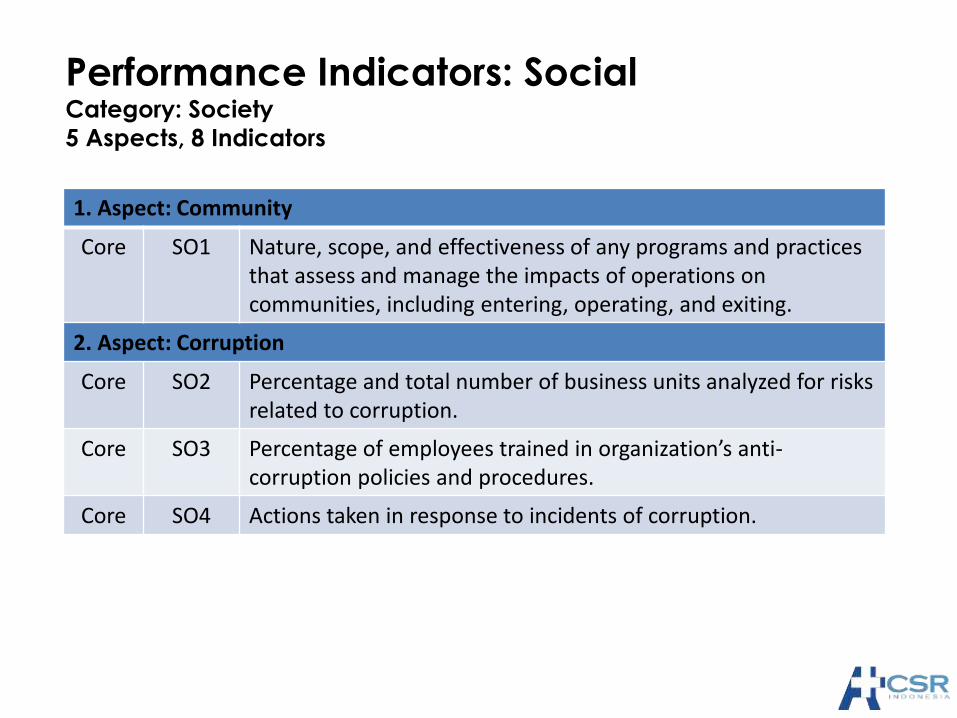
Performance Indicators: Social Category: Society
5 Aspects, 8 Indicators
1. Aspect: Community
Core SO1 Nature, scope, and effectiveness of any programs and practices that assess and manage the impacts of operations on communities, including entering, operating, and exiting.
2. Aspect: Corruption
Core SO2 Percentage and total number of business units analyzed for risks related to corruption.
Core SO3 Percentage of employees trained in organization’s anti-corruption policies and procedures.
Core SO4 Actions taken in response to incidents of corruption.

3. Aspect: Public Policy
Core SO5 Public policy positions and participation in public policy development and lobbying.
Add SO6 Total value of financial and in-kind contributions to political parties, politicians, and related institutions by country.
4. Aspect: Anti-Competitive Behavior
Add SO7 Total number of legal actions for anti-competitive behavior, anti-trust, and monopoly practices and their outcomes.
5. Aspect: Compliance
Core SO8 Monetary value of significant fines and total number of non-monetary sanctions for non-compliance with laws and regulations.
PI: Social (Society)

Indikator Baru dalam GRI G3.1
• LA15. Return to work and retention rates after parental leave, by gender.
• HR10. Percentage and total number of operations that have been subject to human rights reviews and/or impact assessments.
• HR11. Number of grievances related to human rights filed, addressed and resolved through formal grievance mechanisms.
• SO9. Operations with significant potential or actual negative impacts on local communities.
• SO10. Prevention and mitigation measures implemented in operations with significant potential or actual negative impacts on local communities.
Food Processing Sector Supplement

GRI-FPSS 2010
“This Sector Supplement is intended for all companies in the Food Processing sector. This includes all companies that are engaged in processing food, as well as food commodity trading related to food processing and fish processing, and beverage companies.”
Introductory Section

Sumber Pasokan: Sourcing Section
FP1. Percentage of purchased volume from suppliers compliant with company’s sourcing policy.
FP2. Percentage of purchased volume which is verified as being in accordance with credible, internationally recognized responsible production standards, broken down by standard.

Kinerja Ekonomi
EC1. Commentary added to invite reporting on sector-specific community investments.
EC4. Commentary added to describe the impact of governmental support in the sector.
Reference added.
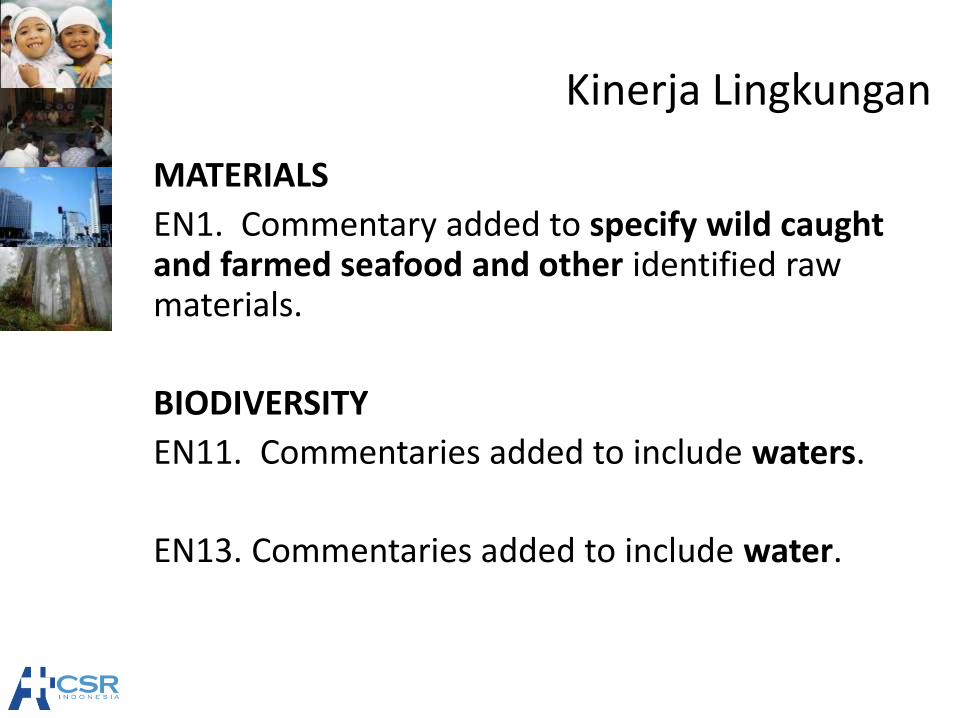
Kinerja Lingkungan
MATERIALS
EN1. Commentary added to specify wild caught and farmed seafood and other identified raw materials.
BIODIVERSITY
EN11. Commentaries added to include waters.
EN13. Commentaries added to include water.

Kinerja Sosial
LABOR/MANAGEMENT RELATIONS
DMA. Commentary added to invite reporting on dialogue between the reporting organization’s executive management team and the workers’ representatives.
FP3. Percentage of working time lost due to industrial disputes, strikes and/or lock-outs, by country.

HEALTHY AND AFFORDABLE FOOD
FP4. Nature, scope and effectiveness of any programs and practices (in-kind contributions, volunteer initiatives, knowledge transfer, partnerships and product development) that promote access to healthy lifestyles; the prevention of chronic disease; access to healthy, nutritious and affordable food; and improved welfare for communities in need.
PUBLIC POLICY
SO5. Commentary added to invite reporting on lobbying activities, and their context, related to the subsidized production of key product ingredients.
CUSTOMER HEALTH AND SAFETY PR1. Commentary added to include the assessment of significant environmental and social impacts across the life-cycle stages of products and services. Compilation added to report on the procedures, steps and results. PR2. This is considered a Core indicator for the sector. FP5. Percentage of production volume manufactured in sites certified by an independent third party according to internationally recognized food safety management system standards. FP6. Percentage of total sales volume of consumer products, by product category, that are lowered in saturated fat, trans fats, sodium and added sugars. FP7. Percentage of total sales volume of consumer products, by product category, that contain increased nutritious ingredients like fiber, vitamins, minerals, phytochemicals or functional food additives.

PRODUCT SERVICE AND LABELING PR3. Commentary added to describe the importance of social and environmental product information and its communication to consumers. Compilation added to report on the use of logos and the information that does not appear on packaging. FP8. Policies and practices on communication to consumers about ingredients and nutritional information beyond legal requirements. MARKETING COMMUNICATIONS PR6. Commentary added to describe the influence of food marketing on dietary habits. Commentary added to specify types of marketing communications. Commentary added to invite reporting on policies and guidelines relating to marketing to vulnerable groups. References added.

BREEDING AND GENETICS FP 9. Percentage and total of animals raised and/or processed, by species and breed type. ANIMAL HUSBANDRY FP10. Policies and practices, by species and breed type, related to physical alterations and the use of anaesthetic. FP11. Percentage and total of animals raised and/or processed, by species and breed type, per housing type. FP12. Policies and practices on antibiotic, anti-inflammatory, hormone, and/or growth promotion treatments, by species and breed type. TRANSPORTATION, HANDLING AND SLAUGHTER FP13. Total number of incidents of non-compliance with laws and regulations, and adherence with voluntary standards related to transportation, handling, and slaughter practices for live terrestrial and aquatic animals.
Terima Kasih Banyak!
Jalal
Lingkar Studi CSR/A+ CSR Indonesia www.csrindonesia.com
[email protected] +62-815-13803616