lecture 1o lbr mrkt
TRANSCRIPT

8/6/2019 Lecture 1o lBR Mrkt
http://slidepdf.com/reader/full/lecture-1o-lbr-mrkt 1/22
1
MS 201/401 - Principles of Macroeconomics
Lecture 10
Recommended books:
1 . Macroeconomics by N. G Mankiw
2. Mac« ««««««.by M Swann
8/6/2019 Lecture 1o lBR Mrkt
http://slidepdf.com/reader/full/lecture-1o-lbr-mrkt 2/22
2
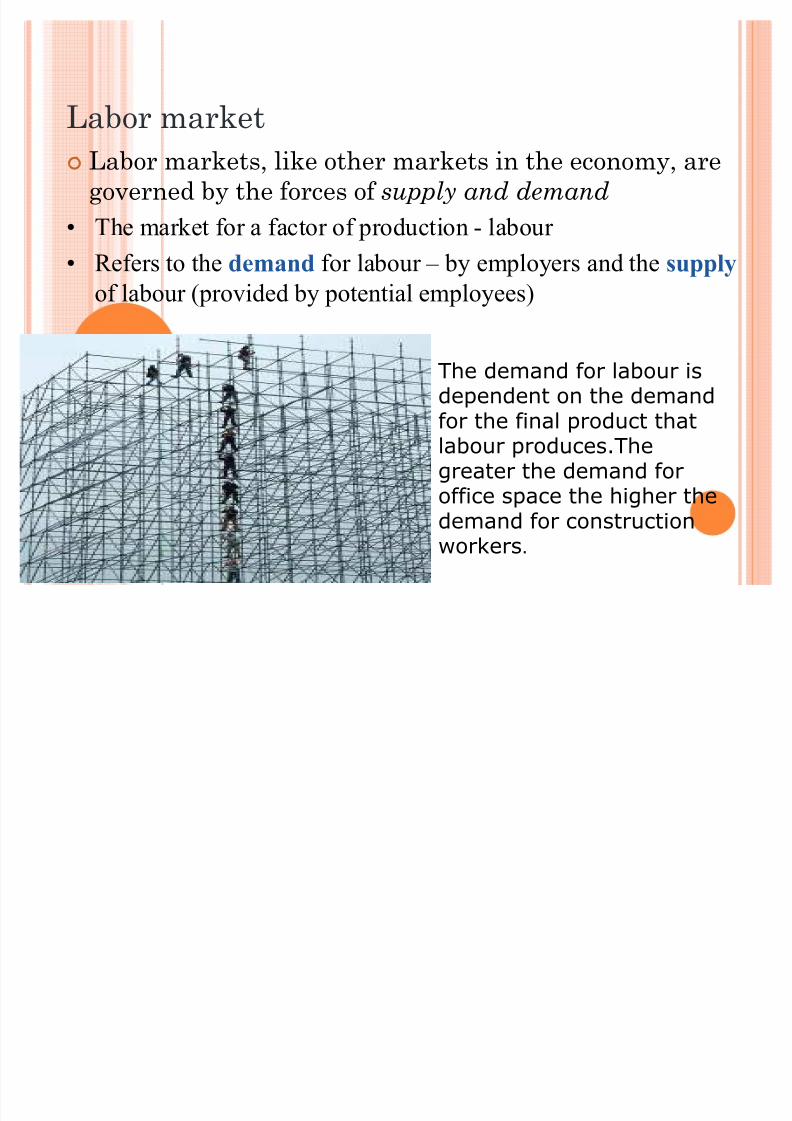
Labor marketLabor markets, like other markets in the economy, aregoverned by the forces of supply and demandThe market for a factor of production - labour
Refers to the demand for labour ± by employers and the supplyof labour (provided by potential employees)
The demand for labour isdependent on the demandfor the final product thatlabour produces.Thegreater the demand foroffice space the higher thedemand for construction
workers .

8/6/2019 Lecture 1o lBR Mrkt
http://slidepdf.com/reader/full/lecture-1o-lbr-mrkt 3/22
THE D E MAND FOR LABOR
Demand for labour is a derived demand -not wanted for its own sake but for whatit can contribute to production
D emand for Labour
Influenced by:y Cost of hiring laboury Wages/salariesy Administration costs associated with tax
payments and adhering to employment lawsand regulations
8/6/2019 Lecture 1o lBR Mrkt
http://slidepdf.com/reader/full/lecture-1o-lbr-mrkt 4/22
4
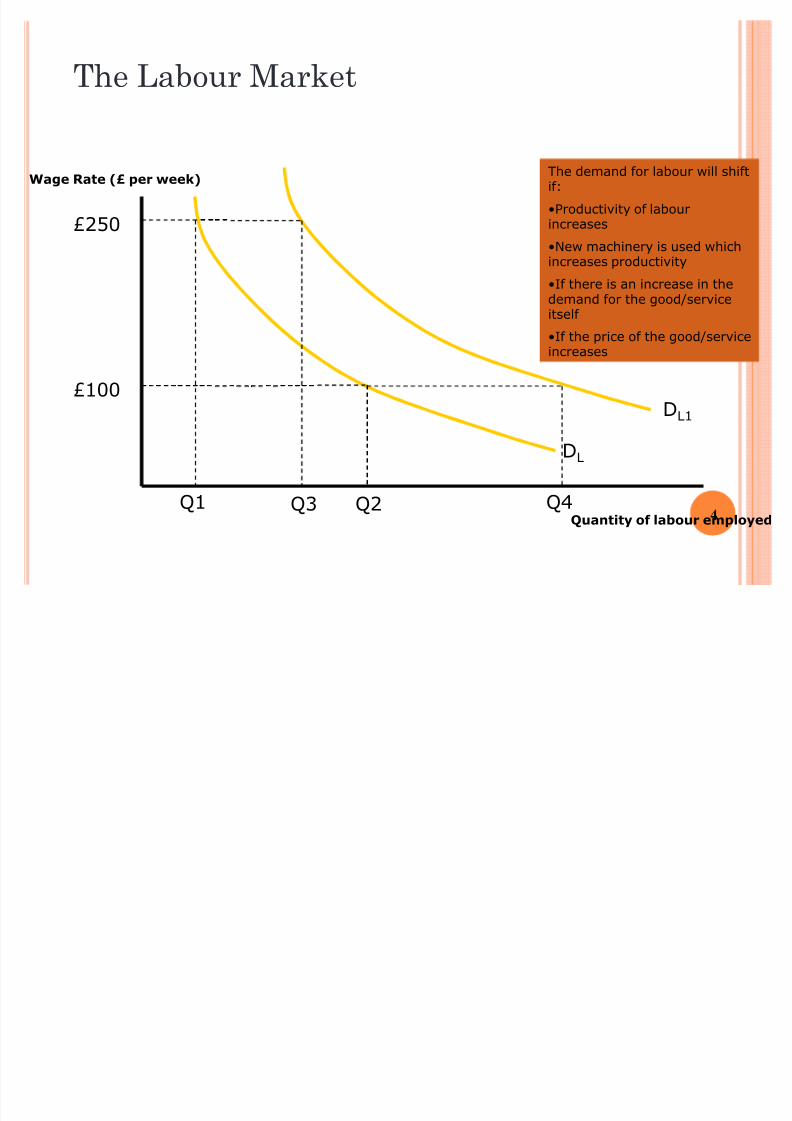
T he Labour Market
Wage Rate (£ per week)
Quantity of labour employed
D L
The demand for labouris downward slopingfrom left to right£250
Q1
At a relatively highwage rate of £250 perweek, the value addedby the worker must begreater to cover the costof hiring that labour.
D emand is likely to belower.
£100
Q2
At a lower wage rate thefirm can afford to take onmore workers. The demandfor labour is inverselyrelated to the wage rate
D L1
Q3 Q4
The demand for labour will shiftif:
Productivity of labourincreases
New machinery is used whichincreases productivity
If there is an increase in thedemand for the good/serviceitself
If the price of the good/serviceincreases
8/6/2019 Lecture 1o lBR Mrkt
http://slidepdf.com/reader/full/lecture-1o-lbr-mrkt 5/22
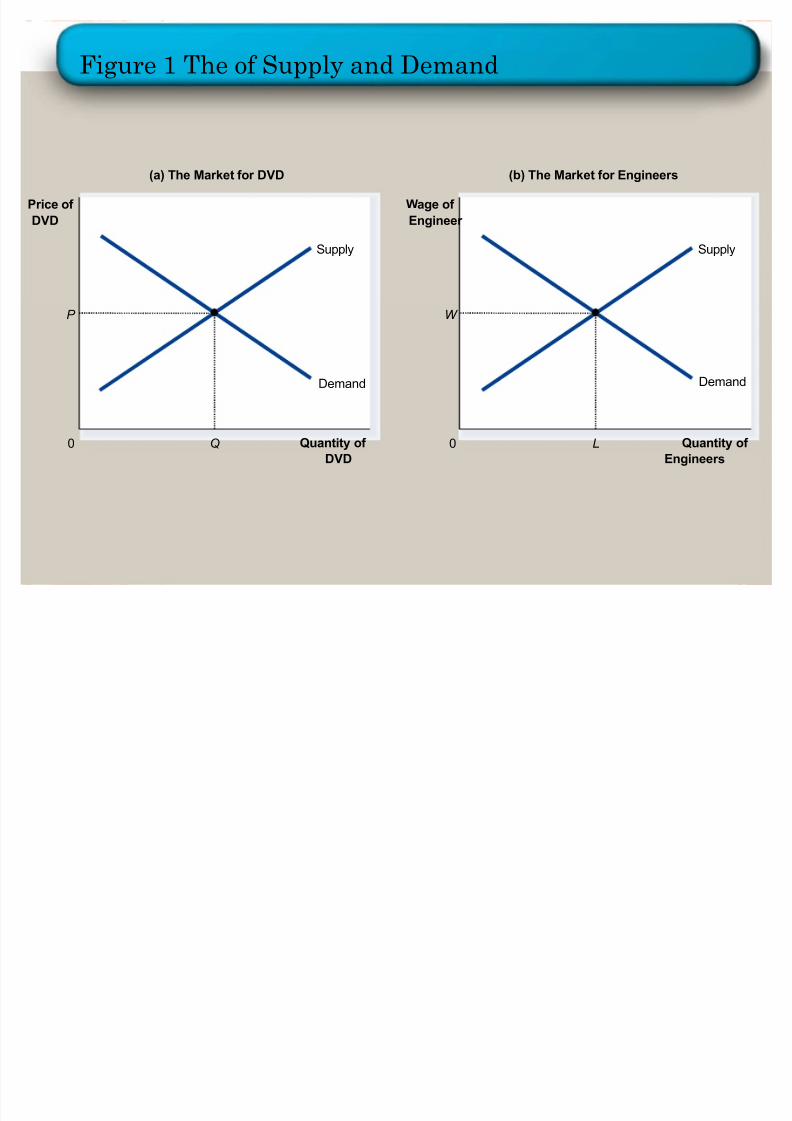
Figure 1 T he of Supply and Demand
Quantity of DVD
0
Pr ice of DVD
Demand
Supply
Demand
Supply
Quantity of Enginee rs
0
Wage of Enginee r
(a) The Ma rk et fo r DVD (b ) The Ma rk et fo r Enginee rs
P
Q L
W
8/6/2019 Lecture 1o lBR Mrkt
http://slidepdf.com/reader/full/lecture-1o-lbr-mrkt 6/22
8/6/2019 Lecture 1o lBR Mrkt
http://slidepdf.com/reader/full/lecture-1o-lbr-mrkt 7/22
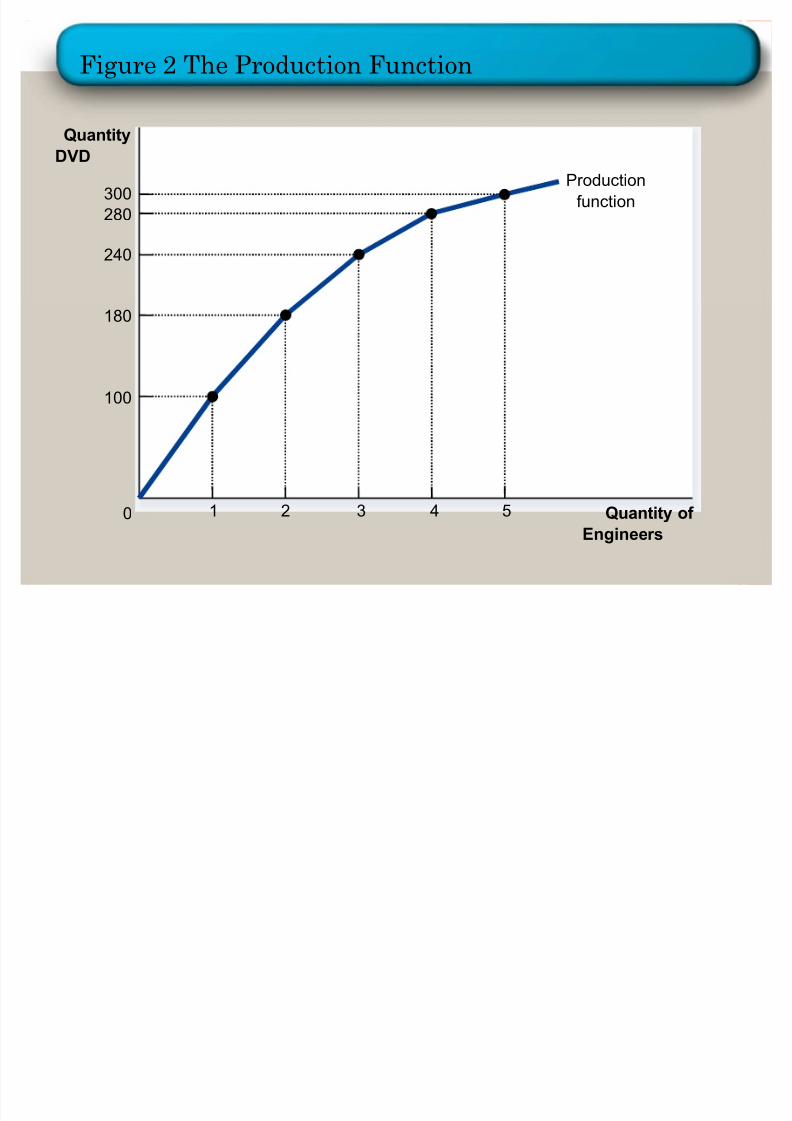
Figure 2 T he Production Function
Pro ducti onfuncti on
Quantity of Enginee rs
0
QuantityDVD
300280
240
180
100
1 2 3 4 5
8/6/2019 Lecture 1o lBR Mrkt
http://slidepdf.com/reader/full/lecture-1o-lbr-mrkt 8/22
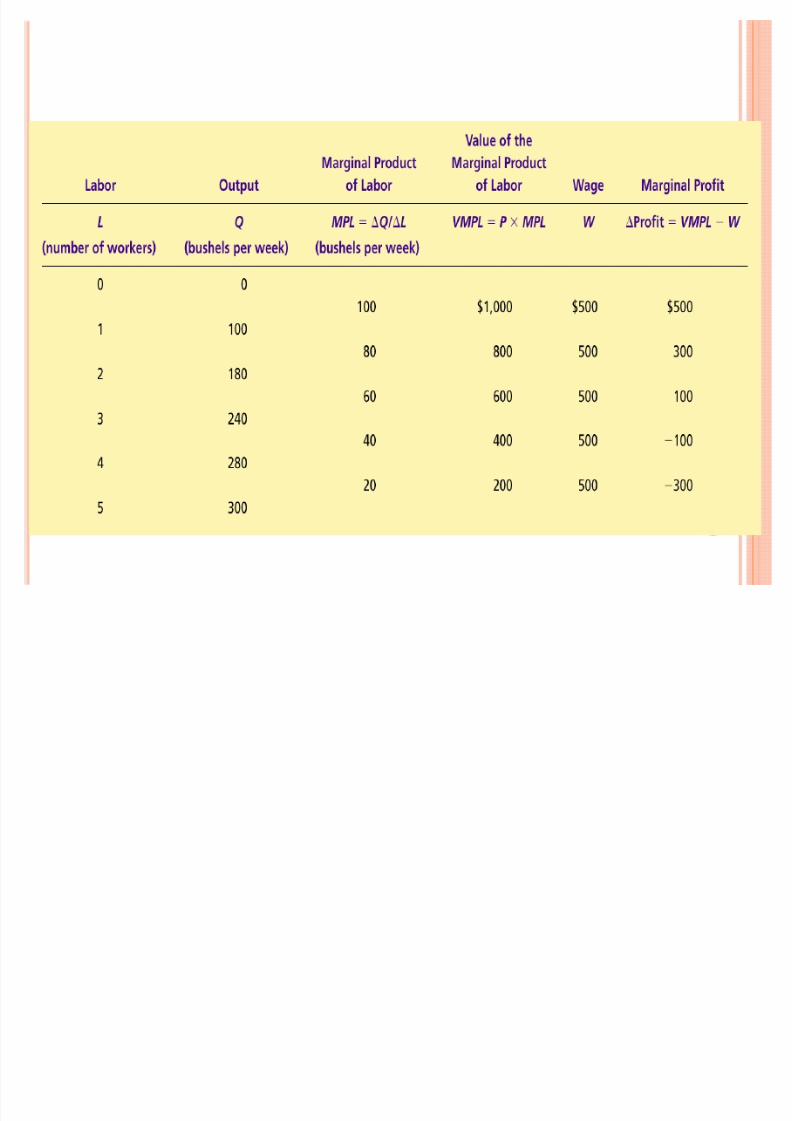
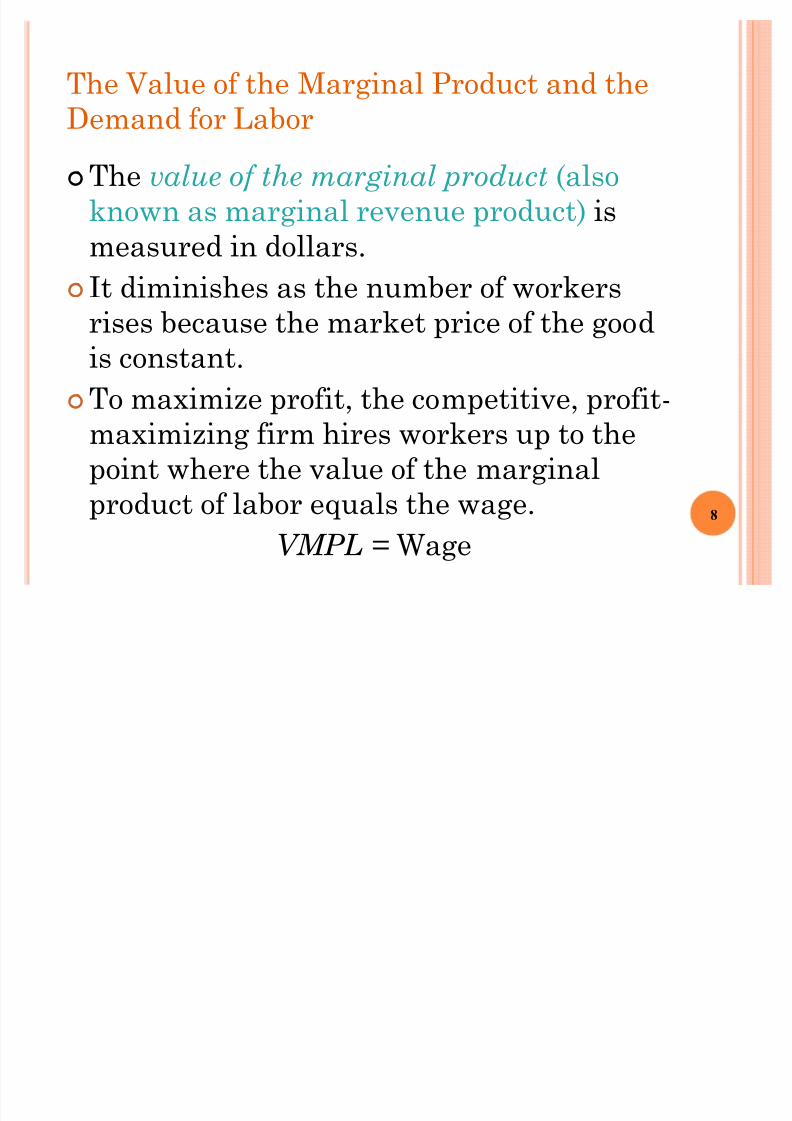
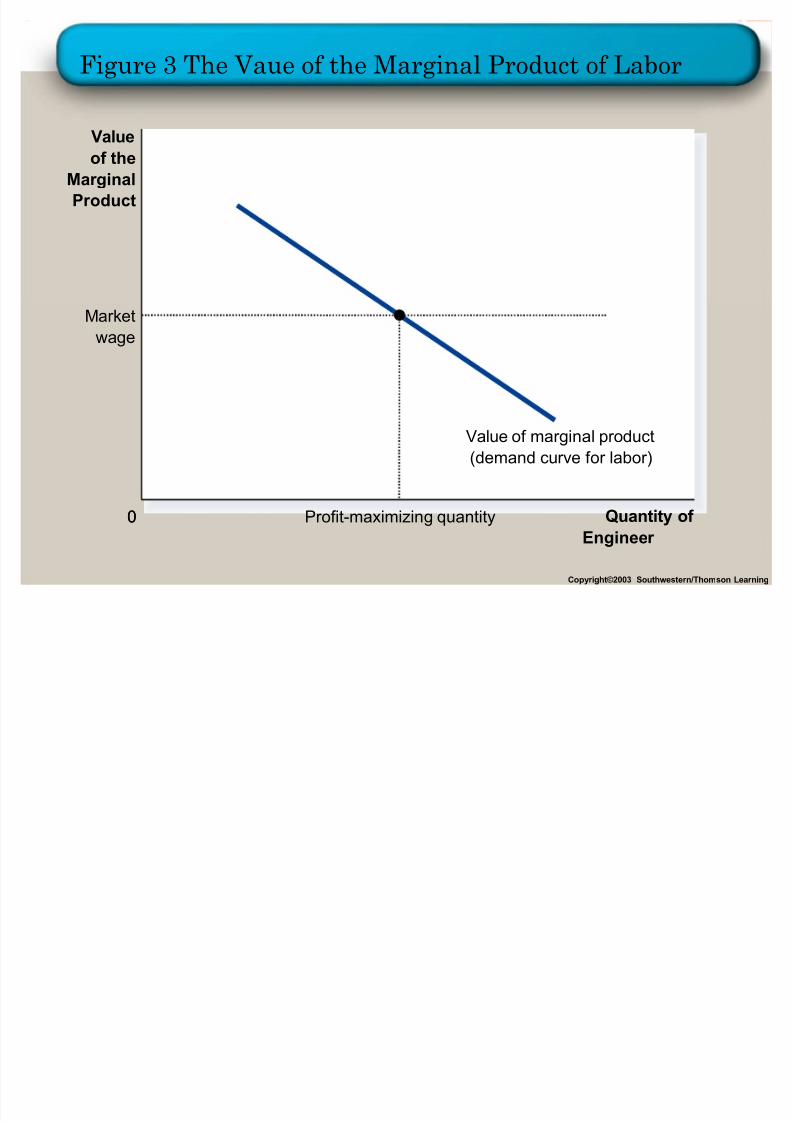
T he Value of the Marginal Product and theDemand for Labor
T he v alue of the marginal product (alsoknown as marginal revenue product) ismeasured in dollars.I t diminishes as the number of workersrises because the market price of the goodis constant.T o maximize profit, the competitive, profit-maximizing firm hires workers up to thepoint where the value of the marginalproduct of labor equals the wage.
VMPL = Wage
8
8/6/2019 Lecture 1o lBR Mrkt
http://slidepdf.com/reader/full/lecture-1o-lbr-mrkt 9/22
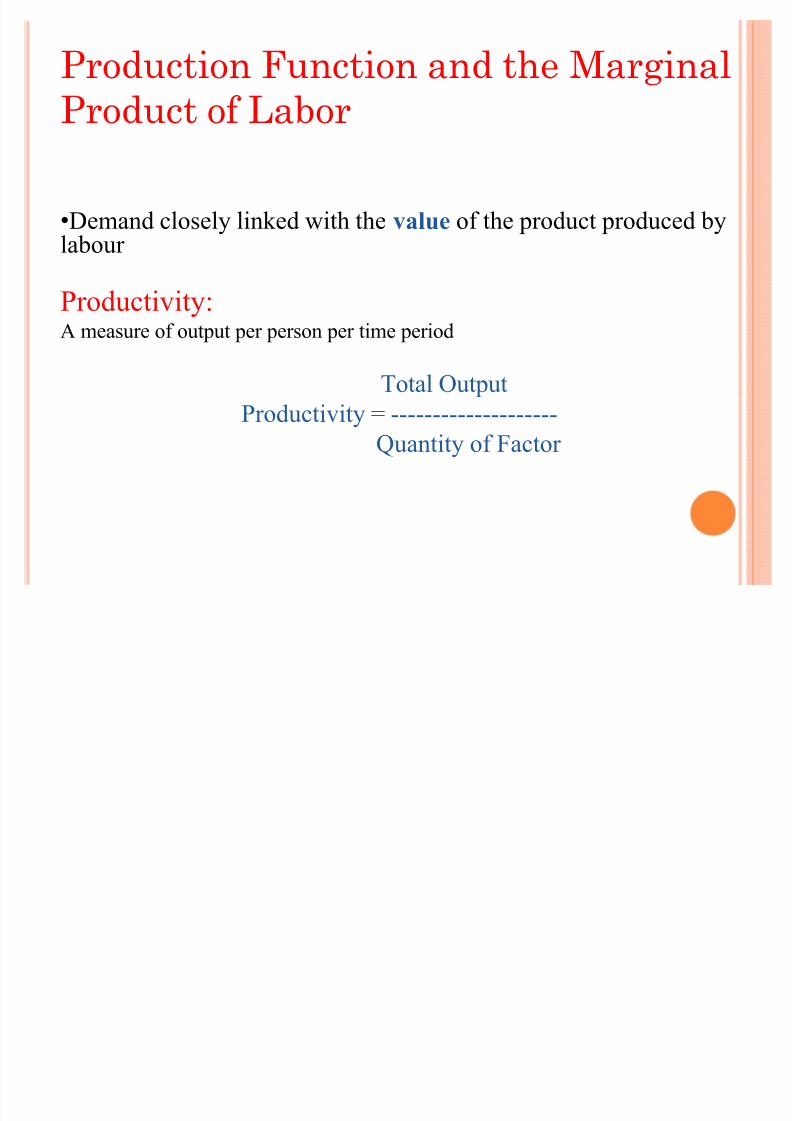
Production Function and the MarginalProduct of Labor
D emand closely linked with the v alue of the product produced bylabour
Productivity:A measure of output per person per time period
Total Output
Productivity = --------------------Quantity of Factor
8/6/2019 Lecture 1o lBR Mrkt
http://slidepdf.com/reader/full/lecture-1o-lbr-mrkt 10/22
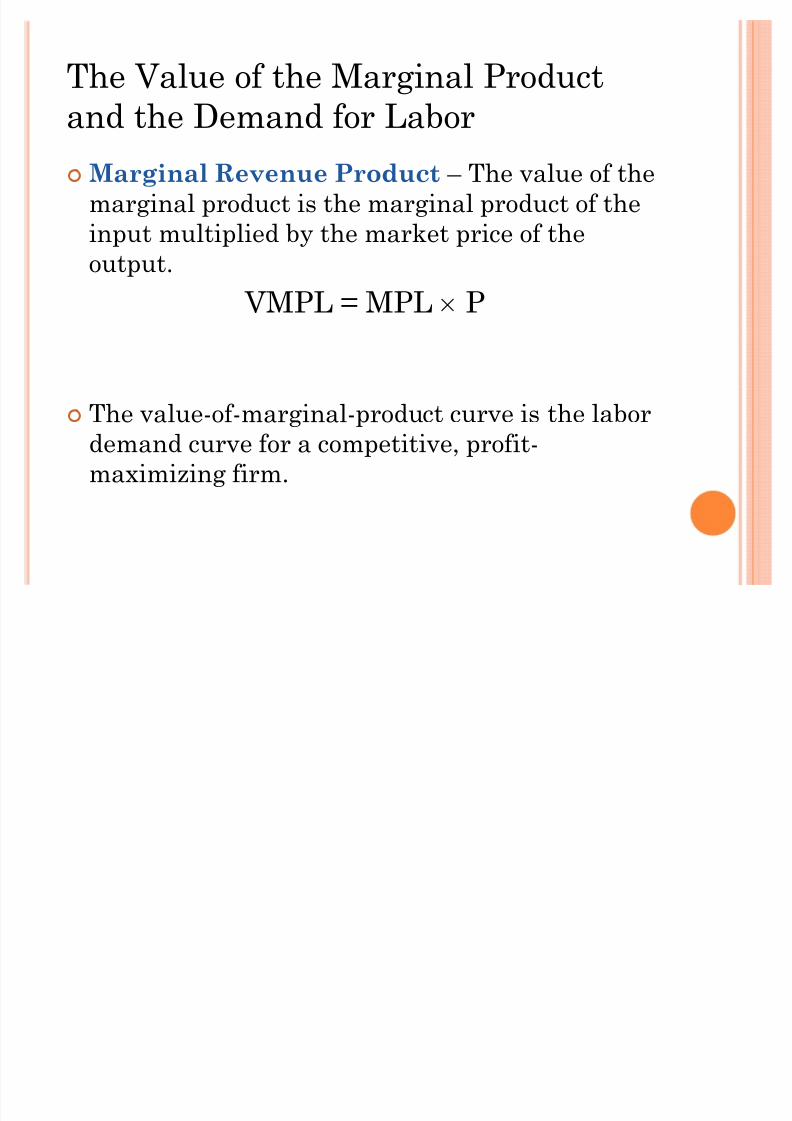
T he Value of the Marginal Productand the Demand for Labor
M arginal Revenue Product ² T he value of themarginal product is the marginal product of theinput multiplied by the market price of theoutput.
VMPL = MPL v P
T he value-of-marginal-product curve is the labordemand curve for a competitive, profit-maximizing firm.
8/6/2019 Lecture 1o lBR Mrkt
http://slidepdf.com/reader/full/lecture-1o-lbr-mrkt 11/22
Figure 3 T he Vaue of the Marginal Product of Labor
C opy r ight©2003 Southwe s te r n/Thom s on Lea r ning
0 Quantity of Enginee r
0
Valueof the
Ma r ginalPr oduct
Value of ma rg inal p roduct(demand cu rve f or lab or)
Ma rketwa ge
Pro fit-maximizin g quantity

8/6/2019 Lecture 1o lBR Mrkt
http://slidepdf.com/reader/full/lecture-1o-lbr-mrkt 12/22
8/6/2019 Lecture 1o lBR Mrkt
http://slidepdf.com/reader/full/lecture-1o-lbr-mrkt 13/22
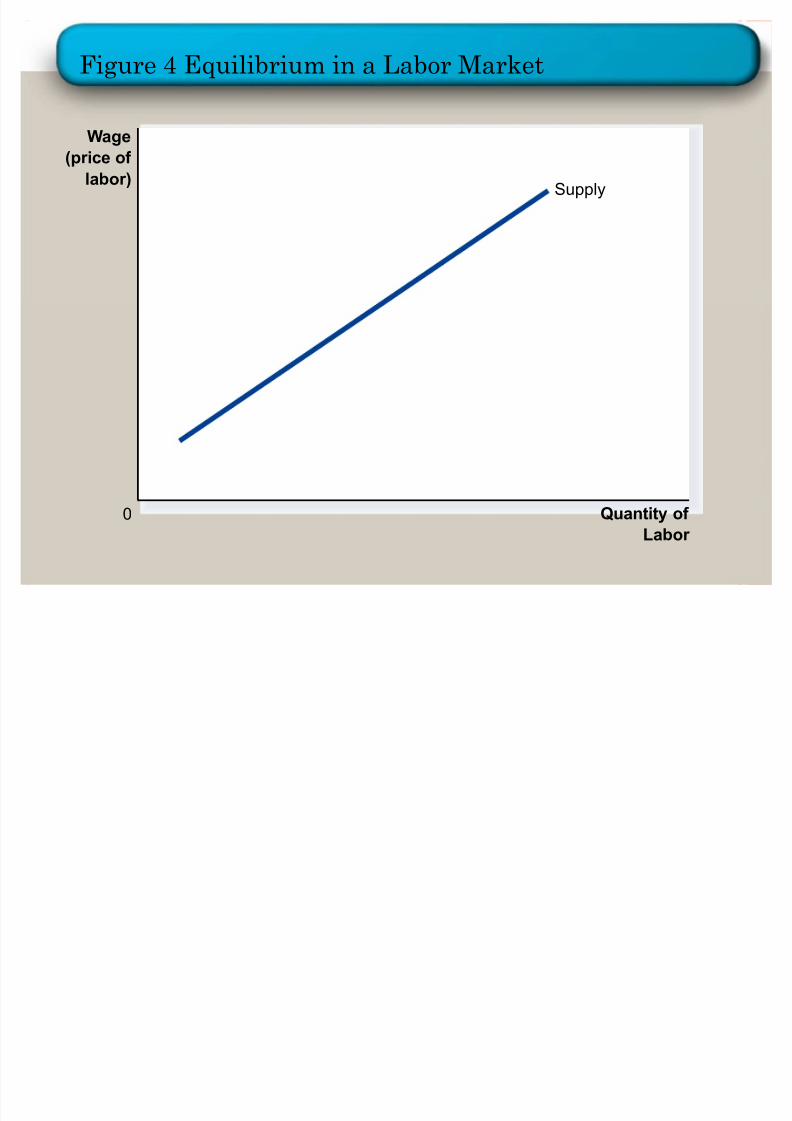
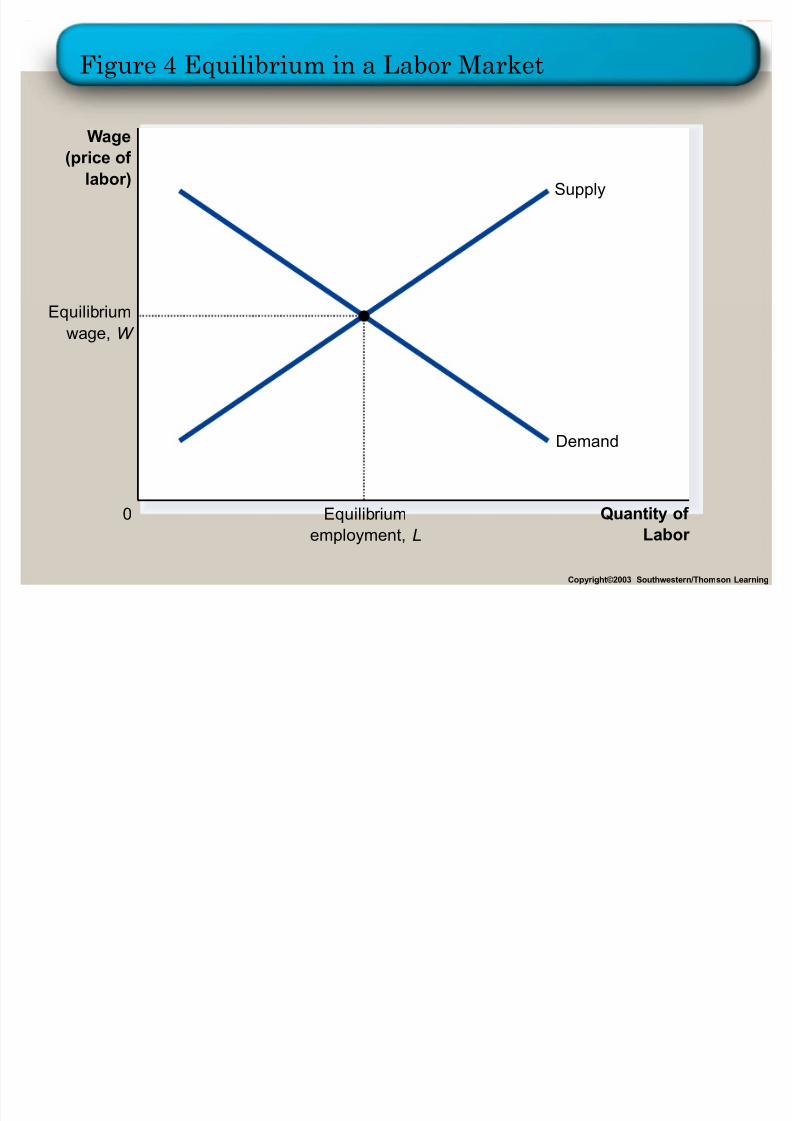
Figure 4 E quilibrium in a Labor Market
Wage(p r ice of
la b o r )
0 Quantity of La b o r
Supply

8/6/2019 Lecture 1o lBR Mrkt
http://slidepdf.com/reader/full/lecture-1o-lbr-mrkt 14/22
What cause Labour-Demand and Supplyto Shift
14
D emand Shifters1. Output Price2. Technological Change3. S upply of Other factors
Supply shifters1. Changes in Tastes2 . Changes in Alternative Opportunities3 . I mmigration
8/6/2019 Lecture 1o lBR Mrkt
http://slidepdf.com/reader/full/lecture-1o-lbr-mrkt 15/22
Figure 4 E quilibrium in a Labor Market
C opy r ight©2003 Southwe s te r n/Thom s on Lea r ning
Wage(p r ice of
la b o r )
0 Quantity of La b o r
Supply
Demand
Equilib r iumwa ge, W
Equilib r iumempl oyment, L

8/6/2019 Lecture 1o lBR Mrkt
http://slidepdf.com/reader/full/lecture-1o-lbr-mrkt 16/22
Shifts in Labor Supply
An increase in the supply of labor :y Results in a surplus of labor.y Puts downward pressure on wages.y
Makes it profitable for firms to hire more workers.y Results in diminishing marginal product.y Lowers the value of the marginal product.y Gives a new equilibrium.

8/6/2019 Lecture 1o lBR Mrkt
http://slidepdf.com/reader/full/lecture-1o-lbr-mrkt 17/22
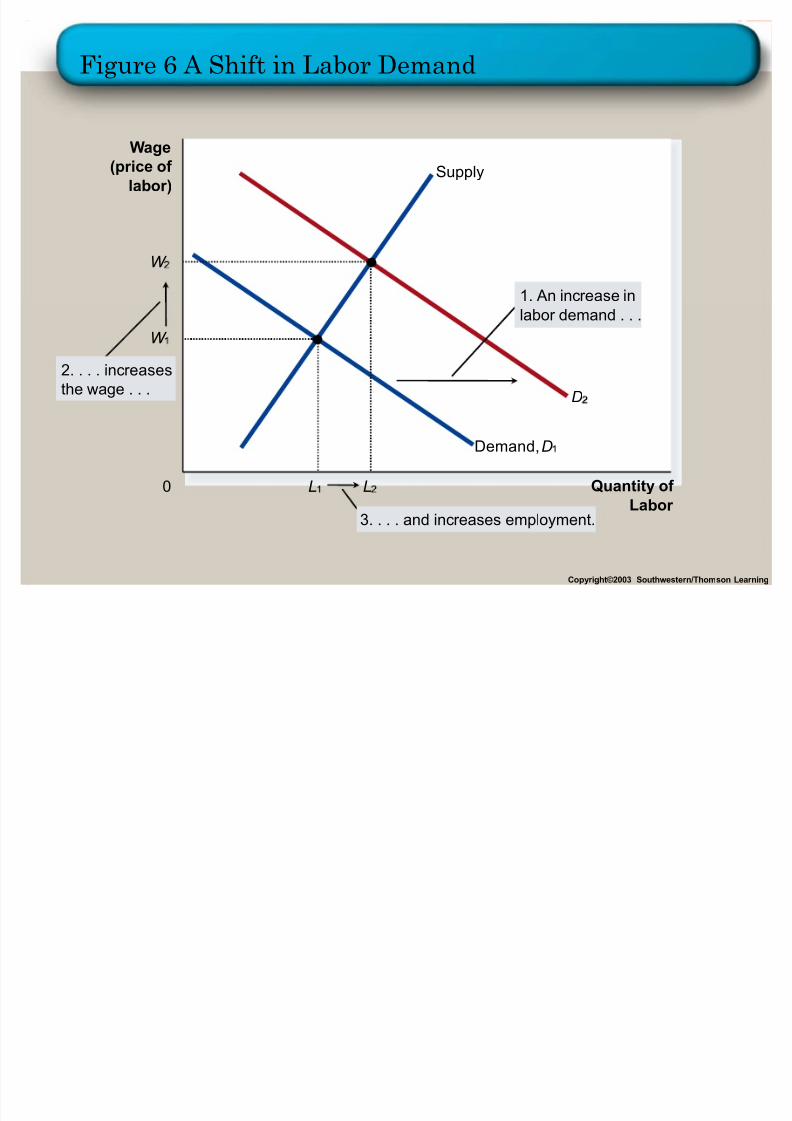
Shifts in Labor Demand
An increase in the demand for labor :y Makes it profitable for firms to hire more workers.y Puts upward pressure on wages.y
Raises the value of the marginal product.y Gives a new equilibrium.
8/6/2019 Lecture 1o lBR Mrkt
http://slidepdf.com/reader/full/lecture-1o-lbr-mrkt 18/22
Figure 6 A Shift in Labor Demand
C opy r ight©2003 Southwe s te r n/Thom s on Lea r ning
Wage(p r ice of
la b o r )
0 Quantity of La b o r
Supply
Demand, D
2. . . . inc r easesthe wa ge . . .
3. . . . and inc r eases empl oyment.
D
W
L
W
L
1. An inc r ease inlab or demand . . .
8/6/2019 Lecture 1o lBR Mrkt
http://slidepdf.com/reader/full/lecture-1o-lbr-mrkt 19/22
19
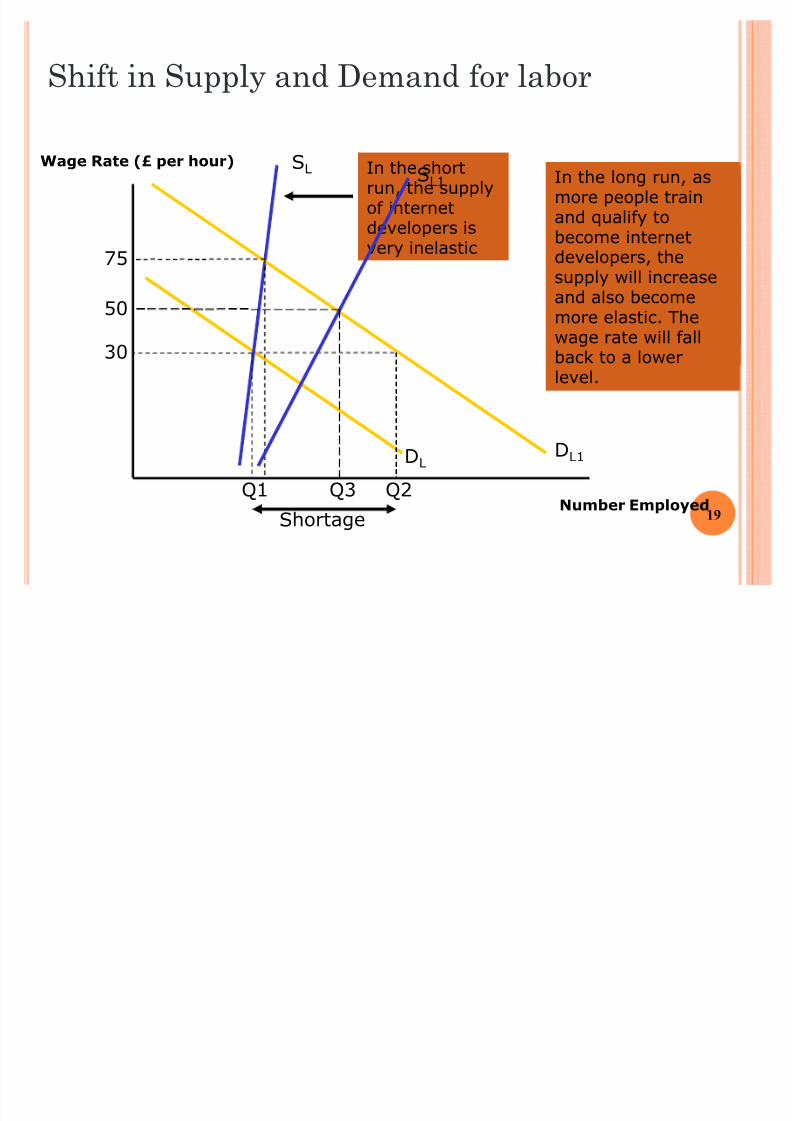
Shift in Supply and Demand for labor
Wage Rate (£ per hour)
Number Employed
D L
S L
30
Q1
Assume this isthe market forInternetdevelopers ± the
initial wage rate is£30 per hour
D L1
As businessesrecognise thepotential benefitsof having a Web
site, demand fortheir skillsincreases from D to D 1
Q2S hortage
The demand fordevelopers at awage rate of £30per hour is now Q2
but there are stillonly Q1 availablefor employment. Ashortage develops.
In the shortrun, the supplyof internetdevelopers isvery inelastic75
The shortage causesthe wage rate to beforced up to £75 perhour as firms competefor the skills of thoseavailable. In the shortrun there is not thetime for new workersto come onto themarket because of thetraining time needed.
S L1
50
Q3
In the long run, asmore people trainand qualify tobecome internetdevelopers, the
supply will increaseand also becomemore elastic. Thewage rate will fallback to a lowerlevel.
8/6/2019 Lecture 1o lBR Mrkt
http://slidepdf.com/reader/full/lecture-1o-lbr-mrkt 20/22
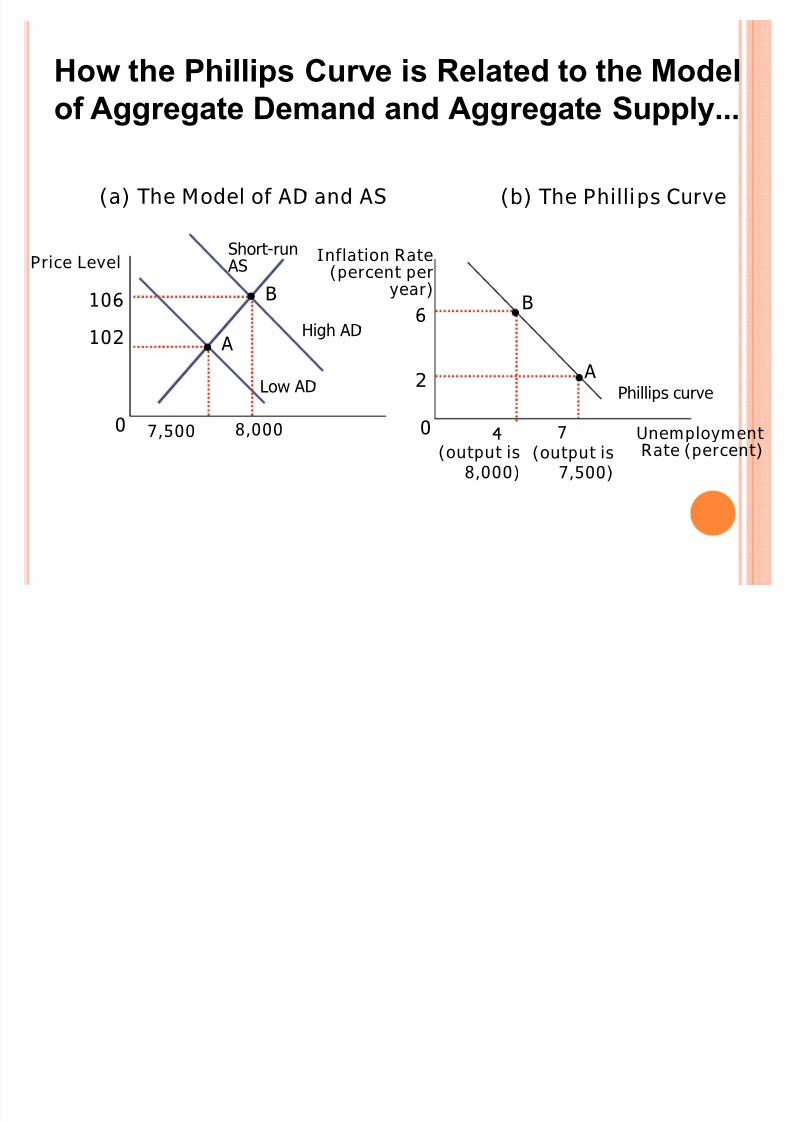
H ow the P hillip s C u rv e i s Related to the Modelof Agg r egate Demand and Agg r egate Supply...
Phillips curve
0
(b) The Phillips Curve
Inflation Rate
(percent peryear)
UnemploymentRate (percent)
0
(a) The Model of AD and AS
Price Level
Low AD
High AD
B
4
6
(output is8,000)
A
7
2
(output is7,500)
A
7,500
102
B
8,000
106
Sho rt-run AS
8/6/2019 Lecture 1o lBR Mrkt
http://slidepdf.com/reader/full/lecture-1o-lbr-mrkt 21/22
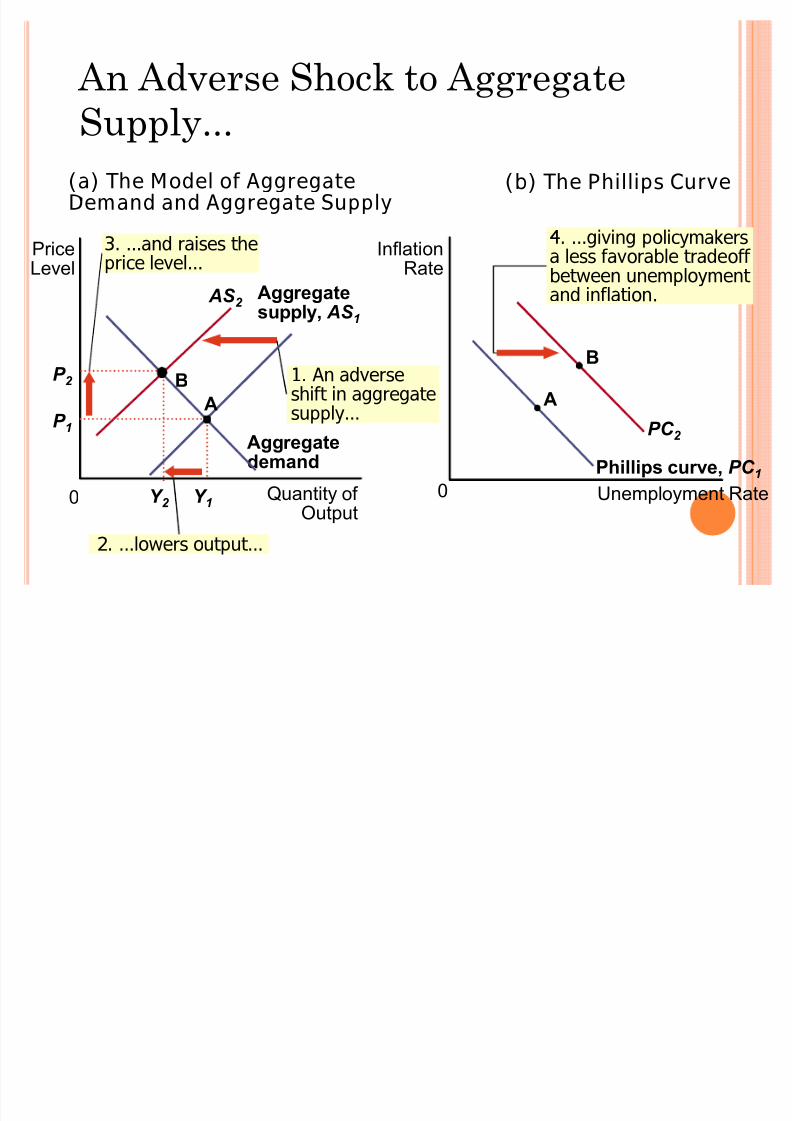
AS 2
1. An adverseshift in aggregate
supply
An Adverse Shock to Aggregate
Supply...
Q uantity of Output
0
Pr iceLevel
P 1
Agg r egatedemand
(a) The Model of AggregateDemand and Aggregate Supply
U nempl oyment Rate0
(b) The Phillips Curve
A
Inflati onRate
P hillip s cu rv e, PC 1
Agg r egates upply, AS 1
A
Y 1
P 2
3 . and raises theprice level
B
2. l ow ers o utput
Y 2
B
4 . giving p o licymakersa less fav o rable trade o ff
bet w een unempl o yment and inflati o n .
PC 2

8/6/2019 Lecture 1o lBR Mrkt
http://slidepdf.com/reader/full/lecture-1o-lbr-mrkt 22/22
Assignment 4
22
On the foundations of Aggregate demand ,Supply and labor market show:
y What will be the impact of Dimaer Dam labormarket?
y What will be the impact of coal reserves whenutilized for energy?
y Do you find any trade off between the above twokinds of energy production, which one is suitable tofor Pakistan and why ?
y What kind of additional cost these technologies canhave, if you have any other alternative way to reducecost and still production , explain it.