cover_fix skripsi print
DESCRIPTION
kkTRANSCRIPT
HUBUNGAN ANTARA INKLINASI INSISIF BAWAH TERHADAP BIDANG MANDIBULA DAN GARIS ESTETIK
WAJAH(Studi pada Populasi Jawa Mahasiswa Universitas Airlangga)
SKRIPSI
Oleh:
IYANDA VEMALA
NIM: 021011157
FAKULTAS KEDOKTERAN GIGI
UNIVERSITAS AIRLANGGA BHMN
SURABAYA
i

2013
LEMBAR PENGESAHAN
HUBUNGAN ANTARA INKLINASI INSISIF BAWAH TERHADAP BIDANG MANDIBULA DAN GARIS ESTETIK
WAJAH
SKRIPSI
Diajukan Sebagai Salah Satu Syarat Untuk Menyelesaikan Pendidikan Dokter
Gigi di Fakultas Kedokteran Gigi Universitas Airlangga
Oleh :
IYANDA VEMALA
NIM: 021011157
Pembimbing Utama Pembimbing Serta
ii

Jusuf Sjamsudin, drg., Sp.Ort (K) Dr. Ida Bagus Narmada,drg.,SpOrt.(K)
NIP. 195411261979011001 NIP. 195601071981031003
KATA PENGANTAR
Puji syukur penulis panjatkan ke hadirat Allah Yang Maha Kasih atas segala
rahmat dam karuniaNya sehingga penulis dapat menyelesaikan skripsi ini dengan
judul “Hubungan antara Inklinasi Insisif Bawah terhadap Bidang Mandibula dan
Garis Estetik Wajah”.
Dalam penulisan skripsi ini, penulis telah banyak mendapat bantuan,
bimbingan, saran maupun ide dan masukan serta pengarahan dari berbagai pihak.
Oleh karena itu dalam kesempatan ini penulis ingin mengucapkan terimakasih
sedalam-dalamnya kepada kedua orangtua serta keluarga yang sudah memberikan
motivasi, doa, bimbingan, perhatian, serta kasih sayang yang selalu tercurah
selama ini.
Ungkapan terimakasih yang sebesar-besarnya saya ucapkan kepada Jusuf
Sjamsudin,drg.,Sp.Ort(K) selaku dosen pembimbing I dan Dr. Ida Bagus
Narmada,drg.,SpOrt.(K) selaku dosen pembimbing II yang telah meluangkan
waktu dan bersedia membimbing serta mengararahkan penulis di dalam
menyelesaikan penulisan skripsi ini dengan baik.
Terimakasih yang sebesar-besarnya kepada seluruh staf pengajar dan pegawai
Departemen Ortodonti Universitas Airlangga yang telah memberikan saran dan
bantuan dalam menyempurnakan skripsi ini. Tidak lupa saya ucapkan terimakasih
kepada Dr. I.G.A. Wahju Ardani,drg.,M.Kes.,Sp.Ort; Achmad
iii
Sjafei,drg.,M.S.,Sp.Ort Prof. Dr. Mieke Sylvia A.R.,drg.,M.S.,Sp.Ort;
Ervina,drg.,Sp.Ort serta Daniel Haryono, drg., Sp. Ort yang turut serta
membimbing dalam penulisan skripsi.
Ucapan terimakasih sebesar-besarnya kepada Adithya Agung Winoto yang
telah membantu memberi semangat dan doa selama 1 tahun 3 bulan dan
seterusnya, serta ungkapan terimakasih sebangga-bangganya kepada sahabat
tercinta, Dina Swasti Prihatini, Small Ainy Fitri, Amel Rihanna, Salma Nur Hijab
Damayanti, Princess Intan dan Frinta, Dii, Nia, Lilis, Ranti, Komting 2013 serta
teman-teman terbaik yang sudah memberikan waktu dan tenaganya untuk
membantu penulis serta dukungan melalui doa dan pesan moril yang menguatkan.
Akhirnya penulis mengucapkan banyak terimakasih kepada semua pihak
yang telah turut membantu terselesaikannya skripsi ini dan memohon maaf
apabila ada kesalahan selama penyusunan skripsi. Oleh karena itu kritik dan saran
sangat penulis harapkan demi perbaikan – perbaikan ke depan.
Surabaya, Desember 2013
Penulis,
Iyanda Vemala
iv

DAFTAR ISI
Halaman Judul............................................................................................................ i
Lembar Pengesahan...................................................................................................ii
Kata Pengantar........................................................................................................... iii
Daftar Isi..................................................................................................................... v
Daftar Tabel............................................................................................................... vii
Daftar Gambar............................................................................................................ viii
BAB 1 PENDAHULUAN....................................................................................... 1
1.1 Latar Belakang..................................................................................................... 1
1.2 Rumusan Masalah................................................................................................ 4
1.3 Tujuan Penelitian................................................................................................. 4
1.4 Manfaat Penelitian............................................................................................... 5
BAB 2 TINJAUAN PUSTAKA.............................................................................. 6
2.1 Inklinasi Insisif Bawah terhadap Bidang Mandibula........................................
6
2.2 Bibir...................................................................................................................... 8
2.3 Radiografi Sefalometri......................................................................................... 9
2.4 Analisis Jaringan Lunak Wajah........................................................................... 11
v
2.5 Analisis Menurut Ricketts.................................................................................... 12
2.6 Suku Jawa............................................................................................................. 13
BAB 3 KERANGKA KONSEPTUAL...................................................................... 15
3.1 Penjelasan Kerangka Konsep............................................................................... 16
BAB 4 METODE PENELITIAN............................................................................... 17
4.1 Jenis Penelitian..................................................................................................... 17
4.2 Lokasi Penelitian.................................................................................................. 17
4.3 Waktu Penelitian.................................................................................................. 17
4.4 Subjek Penelitian.................................................................................................. 17
4.5 Sampel.................................................................................................................. 17
4.5.1 Kriteria Sampel................................................................................................. 17
4.5.2 Cara Pengambilan Sampel................................................................................ 18
4.6 Variabel dan Definisi Operasional ...................................................................... 18
4.6.1 Variabel Penelitian............................................................................................ 18
4.6.2 Definisi Operasional Variabel........................................................................... 18
4.7 Bahan dan Alat Penelitian.................................................................................... 19
4.8 Cara Kerja............................................................................................................ 19
4.9 Analisis Data Hasil Penelitian.............................................................................. 21
4.10 Alur Penelitian................................................................................................... 23
BAB 5 HASIL PENELITIAN ..................................................................................24
BAB 6 PEMBAHASAN ...........................................................................................28
BAB 7 KESIMPULAN .............................................................................................34
vi
DAFTAR PUSTAKA……….................................................................................... ix
LAMPIRAN............................................................................................................... xii
........................................................................................................................
........................................................................................................................
........................................................................................................................BAB 7 KESIMPULAN
34
DAFTAR TABEL
5.1 Pengukuran < L1 pada subyek laki-laki dan perempuan dengan uji t
berpasangan......................................................................................................... 24
5.2 Pengukuran Ls– E line dan Li– E line pada subyek laki-laki dan perempuan
dengan uji t berpasangan .................................................................................... 25
5.3 Hasil uji Kolmogorov-smirnov ...................................................................... 26
5.4 Hubungan antara <L1 ; Ls- E line ; dan Li- E line menggunakan uji korelasi
Pearson ............................................................................................................... 26
vii

DAFTAR GAMBAR
2.1 Sudut Inklinasi Insisif Bawah........................................................................... 7
2.2 Tweed’s Triangle.............................................................................................. 8
2.3 Sefalogram Frontal............................................................................................ 10
2.4 Sefalogram Lateral............................................................................................ 11
2.5 Titik – titik Analisis Jaringan Lunak................................................................. 12
2.6 Analisis Ricketts................................................................................................ 13
5.1 Ukuran < L1 pada subyek laki-laki dan perempuan......................................... 24
5.2 Ukuran Ls–E line dan Li–E line pada subyek laki-laki dan perempuan..........
25
viii
DAFTAR PUSTAKA
A.Al-Tamimy, Ebtisam. The reliability of Rickett’s Analysis Using Cephalometric Tracing on Iraqi Sample Aged 8-10 Year. Mustansiria DJ. 2006; 3(2): 1-10.
Agha, Ne'am F et al. Correlation of Incisors Inclination and Position with Facial Profile. Al – Rafidain Dent J; 2011; 11(1): 154-160.
Arnett, G. William. Original Article: Soft Tissue Cephalometric Analysis: Diagnosis and Treatment Planning of Dentofacial Deformitiy. Am J Orthod Dentofacial Orthop. 1999; 116(3): 239-253.
Arrietta, Rr. Ratna., Mindya Yuniatuti., & Lakshmi A. Leepel. Rahang dan Gigi Sebagai Saran Identifikasi Forensik untuk Menentukan Ras, Umur, dan Jenis Kelamin. IJD. 2003; 13(2): 99-102.
Asad, Saad. et al. Assesment of Antero-Posterior Position of Lips E-Line S-Line. Pakistan Oral & Dental Journal. 2011; 31(1): 84-87.
ix
Bhattarai, P dan RM Shrestha. Tweeds analysis of Nepalese people. Nepal Med Coll J. 2011; 13(2): 103-106.
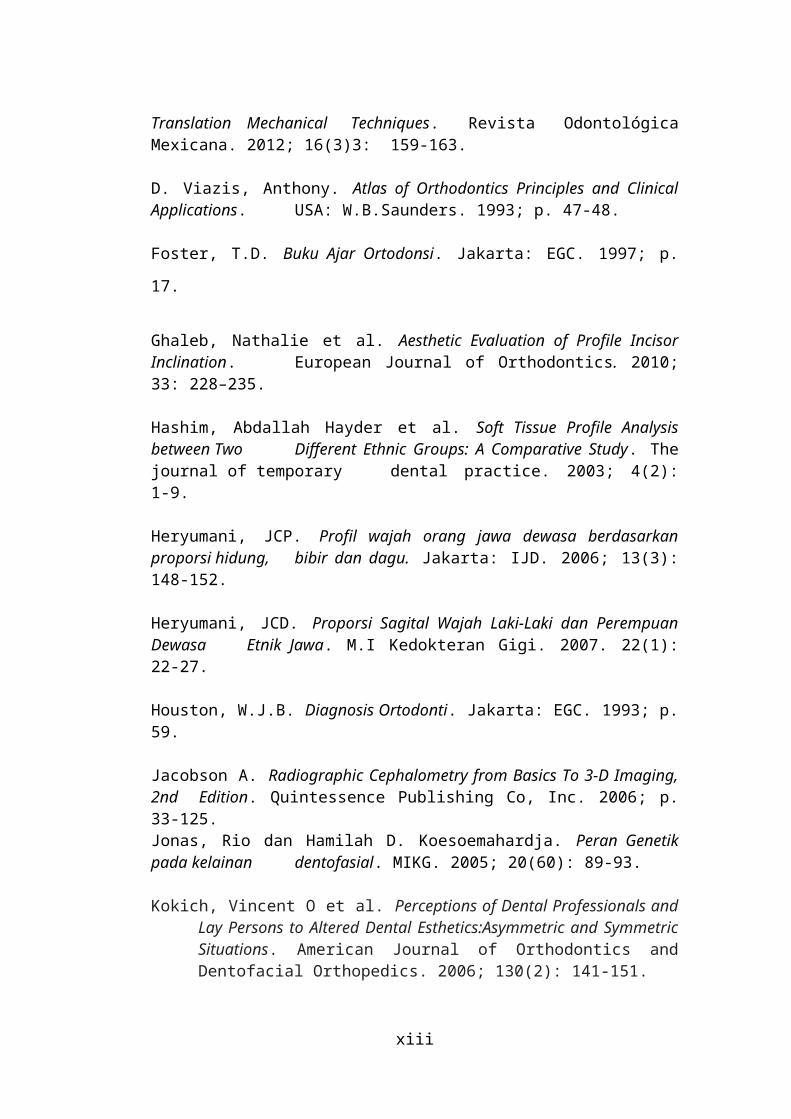
Cumba Morán, Aracely. Comparative Analysis of Final Inclination of Incisors After Space Closure. a Comparison between Sliding and Translation Mechanical Techniques. Revista Odontológica Mexicana. 2012; 16(3)3: 159-163.
D. Viazis, Anthony. Atlas of Orthodontics Principles and Clinical Applications. USA: W.B.Saunders. 1993; p. 47-48.
Foster, T.D. Buku Ajar Ortodonsi. Jakarta: EGC. 1997; p. 17.
Ghaleb, Nathalie et al. Aesthetic Evaluation of Profile Incisor Inclination. European Journal of Orthodontics. 2010; 33: 228–235.
Hashim, Abdallah Hayder et al. Soft Tissue Profile Analysis between Two Different Ethnic Groups: A Comparative Study. The journal of temporary dental practice. 2003; 4(2): 1-9.
Heryumani, JCP. Profil wajah orang jawa dewasa berdasarkan proporsi hidung, bibir dan dagu. Jakarta: IJD. 2006; 13(3): 148-152.
Heryumani, JCD. Proporsi Sagital Wajah Laki-Laki dan Perempuan Dewasa Etnik Jawa. M.I Kedokteran Gigi. 2007. 22(1): 22-27.
Houston, W.J.B. Diagnosis Ortodonti. Jakarta: EGC. 1993; p. 59.
Jacobson A. Radiographic Cephalometry from Basics To 3-D Imaging, 2nd Edition. Quintessence Publishing Co, Inc. 2006; p. 33-125.
Jonas, Rio dan Hamilah D. Koesoemahardja. Peran Genetik pada kelainan dentofasial. MIKG. 2005; 20(60): 89-93.
Kokich, Vincent O et al. Perceptions of Dental Professionals and Lay Persons to Altered Dental Esthetics:Asymmetric and Symmetric Situations. American Journal of Orthodontics and Dentofacial Orthopedics. 2006; 130(2): 141-151.
Korrodi A. The Use of Model Templates for Class ii Treatment. http://orthocj.com/2001/09 (mei 07.2013).
Kuramae, Mayury et al. Analysis of Tweed’s Facial Triangle in Black Brazilian Youngsters with Normal Occlusion. Braz J Oral Sci. 2004; 3: 401-403.
Q. Closs, Luciane. Changes in Lower Incisor Inclination and The Occurrenceo of Gingival Recession. R Dental Press Ortodon Ortop Facial. 2009; 14(4): 66-73.
x
Quartana, Ira Rahmayani., Prihandini., & Pinandi Sri Pudyani. Hubungan Antara Perubahan Kecembungan Profil Skeletal dan Jaringan Lunak Wajah pada Pasien Bimaksilar Protrusif. J. Ked. Gigi. 2010; 1(3): 192-198.
R. Al-Labban, Yasir. A Cephalometric Lips Analysis and Its Relation to OtherCephalometric Measurements in Iraqi Adult Individuals. J Bagh College Dentistry. 2011; 23(3): 156-159.
Rahardjo, Pambudi. Diagnosis Ortodontik. Surabaya: AUP. 2011; p. 40-41.
Rahardjo, Pambudi. Ortodonsi Dasar. Surabaya: UAP. 2012; p. 14-34.Singh, Gurkerat. Textbook of Orthodontics, 2nd edition. New Delhi: Jaypee. 2007; p. 119.
Susilowati. Hubungan Antara Sudut Interinsisal dengan Derajat Konveksitas Profil Haringan Lunak Wajah pada Suku bugis dan Makassar. Dentika Dental Journal. 2009; 14(2): 125-128.
Walianto, Surwandi. Berbagai Macam Metode untuk mendapatkan Gambar Sefalogram Digital. MIKG. 2005; 20(63); 146-153.
Yusra, Yohana., Widhayanti D., & Widijanto Sudana. Evaluasi Jaringan Lunak Fasial Finalis Abang-None Jakarta 2002. M.I Kedokteran gigi. 2005; 59: 5-13.
Zen, Yuniar. Pola Hubungan Antara Konfeksitas, Posisi Gigi Insisivus, dan Posisi bibir dalam Analisi Ricketts. M.I. Kedokteran gigi. 2003; 63: 160-168.
xi

LAMPIRAN
Lampiran 1
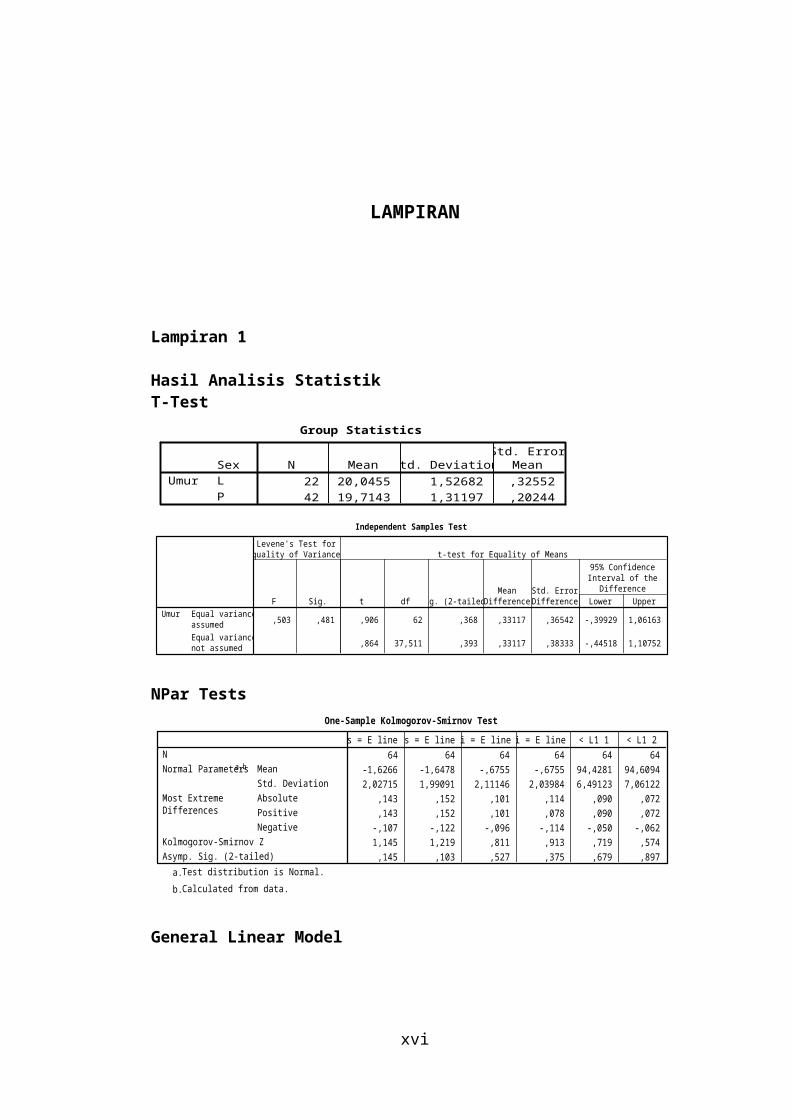
Hasil Analisis StatistikT-Test
Group Statistics
22 20,0455 1,52682 ,32552
42 19,7143 1,31197 ,20244
SexL
P
UmurN Mean Std. Deviation
Std. ErrorMean
Independent Samples Test
,503 ,481 ,906 62 ,368 ,33117 ,36542 -,39929 1,06163
,864 37,511 ,393 ,33117 ,38333 -,44518 1,10752
Equal variancesassumed
Equal variancesnot assumed
UmurF Sig.
Levene's Test forEquality of Variances
t df Sig. (2-tailed)Mean
DifferenceStd. ErrorDifference Lower Upper
95% ConfidenceInterval of the
Difference
t-test for Equality of Means
NPar Tests
xii
One-Sample Kolmogorov-Smirnov Test
64 64 64 64 64 64
-1,6266 -1,6478 -,6755 -,6755 94,4281 94,6094
2,02715 1,99091 2,11146 2,03984 6,49123 7,06122
,143 ,152 ,101 ,114 ,090 ,072
,143 ,152 ,101 ,078 ,090 ,072
-,107 -,122 -,096 -,114 -,050 -,062
1,145 1,219 ,811 ,913 ,719 ,574
,145 ,103 ,527 ,375 ,679 ,897
N
Mean
Std. Deviation
Normal Parameters a,b
Absolute
Positive
Negative
Most ExtremeDifferences
Kolmogorov-Smirnov Z
Asymp. Sig. (2-tailed)
Ls = E line 1 Ls = E line 2 Li = E line 1 Li = E line 2 < L1 1 < L1 2
Test distribution is Normal.a.
Calculated from data.b.
General Linear Model
Between-Subjects Factors
L 22
P 42
1,00
2,00
SexValue Label N
Descriptive StatisticsSex Mean Std. Deviation N
Ls – E line L P Total
-.6000-2.1643-1.6266
2.110861.780582.02715
2242
Li – E line L p Total
.2068-1.1376
-.6755
2.287151.880082.11146
2242
<L1 L P Total
93.072795.138194.4281
5.635536.853956.49123
2242
Multivariate Testsb
1,000 1E+009a 9,000 54,000 ,000
,000 1E+009a 9,000 54,000 ,000
2E+008 1E+009a 9,000 54,000 ,000
2E+008 1E+009a 9,000 54,000 ,000
,586 8,499a 9,000 54,000 ,000
,414 8,499a 9,000 54,000 ,000
1,416 8,499a 9,000 54,000 ,000
1,416 8,499a 9,000 54,000 ,000
Pillai's Trace
Wilks' Lambda
Hotelling's Trace
Roy's Largest Root
Pillai's Trace
Wilks' Lambda
Hotelling's Trace
Roy's Largest Root
EffectIntercept
Sex
Value F Hypothesis df Error df Sig.
Exact statistica.
Design: Intercept+Sexb.
Total
T-Test
xiii

Paired Samples Test
2,09844 12,10226 1,51278 -,92462 5,12149 1,387 63 ,170
-,87500 4,53732 ,56717 -2,00839 ,25839 -1,543 63 ,128
,18125 4,01287 ,50161 -,82114 1,18364 ,361 63 ,719
-,02125 ,52175 ,06522 -,15158 ,10908 -,326 63 ,746
,00000 ,54397 ,06800 -,13588 ,13588 ,000 63 1,000
,18125 4,01287 ,50161 -,82114 1,18364 ,361 63 ,719
,73328 4,69947 ,58743 -,44061 1,90717 1,248 63 ,217
,21469 1,68601 ,21075 -,20647 ,63584 1,019 63 ,312
,51875 5,08837 ,63605 -,75229 1,78979 ,816 63 ,418
-,00266 ,09143 ,01143 -,02549 ,02018 -,232 63 ,817
FMA2 - FMA1Pair 1
FMIA2 - FMIA1Pair 2
IMPA2 - IMPA1Pair 3
Ls = E line 2 - Ls = E line 1Pair 4
Li = E line 2 - Li = E line 1Pair 5
< L1 2 - < L1 1Pair 6
TAFH2 - TAFH1Pair 7
UAFH2 - UAFH1Pair 8
LAFH2 - LAFH1Pair 9
% 2 - % 1Pair 10
Mean Std. DeviationStd. Error
Mean Lower Upper
95% ConfidenceInterval of the
Difference
Paired Differences
t df Sig. (2-tailed)
Laki-laki
T-Test
xiv
Paired Samples Statistics
30,9297 64 11,55761 1,44470
28,8313 64 7,08667 ,88583
55,8672 64 5,40667 ,67583
56,7422 64 5,87434 ,73429
94,6094 64 7,06122 ,88265
94,4281 64 6,49123 ,81140
-1,6478 64 1,99091 ,24886
-1,6266 64 2,02715 ,25339
-,6755 64 2,03984 ,25498
-,6755 64 2,11146 ,26393
94,6094 64 7,06122 ,88265
94,4281 64 6,49123 ,81140
114,2413 64 7,87397 ,98425
113,5080 64 7,37688 ,92211
52,4022 64 3,07146 ,38393
52,1875 64 2,96272 ,37034
61,8397 64 6,46498 ,80812
61,3209 64 5,67494 ,70937
,8542 64 ,09273 ,01159
,8569 64 ,07451 ,00931
FMA2
FMA1
Pair1
FMIA2
FMIA1
Pair2
IMPA2
IMPA1
Pair3
Ls = E line 2
Ls = E line 1
Pair4
Li = E line 2
Li = E line 1
Pair5
< L1 2
< L1 1
Pair6
TAFH2
TAFH1
Pair7
UAFH2
UAFH1
Pair8
LAFH2
LAFH1
Pair9
% 2
% 1
Pair10
Mean N Std. DeviationStd. Error
Mean
Paired Samples Statistics
34,3636 22 17,14169 3,65462
28,2500 22 8,19807 1,74783
57,0227 22 7,04489 1,50197
58,6818 22 6,82877 1,45590
92,7045 22 7,07049 1,50743
93,0727 22 5,63553 1,20150
-,6823 22 2,10741 ,44930
-,6000 22 2,11086 ,45004
,1032 22 2,14088 ,45644
,2068 22 2,28715 ,48762
92,7045 22 7,07049 1,50743
93,0727 22 5,63553 1,20150
120,8468 22 6,85931 1,46241
120,3545 22 5,93276 1,26487
54,9432 22 2,76159 ,58877
54,2973 22 2,73120 ,58229
65,9045 22 6,94328 1,48031
66,0577 22 5,10046 1,08742
,8445 22 ,12550 ,02676
,8273 22 ,07376 ,01572
FMA2
FMA1
Pair1
FMIA2
FMIA1
Pair2
IMPA2
IMPA1
Pair3
Ls = E line 2
Ls = E line 1
Pair4
Li = E line 2
Li = E line 1
Pair5
< L1 2
< L1 1
Pair6
TAFH2
TAFH1
Pair7
UAFH2
UAFH1
Pair8
LAFH2
LAFH1
Pair9
% 2
% 1
Pair10
Mean N Std. DeviationStd. Error
Mean
Paired Samples Test
6,11364 19,18328 4,08989 -2,39176 14,61903 1,495 21 ,150
-1,65909 5,24719 1,11870 -3,98556 ,66738 -1,483 21 ,153
-,36818 3,77288 ,80438 -2,04098 1,30462 -,458 21 ,652
-,08227 ,41328 ,08811 -,26551 ,10096 -,934 21 ,361
-,10364 ,64256 ,13699 -,38853 ,18126 -,757 21 ,458
-,36818 3,77288 ,80438 -2,04098 1,30462 -,458 21 ,652
,49227 6,56036 1,39867 -2,41643 3,40097 ,352 21 ,728
,64591 1,68958 ,36022 -,10321 1,39503 1,793 21 ,087
-,15318 7,23933 1,54343 -3,36292 3,05656 -,099 21 ,922
,01727 ,13163 ,02806 -,04109 ,07563 ,616 21 ,545
FMA2 - FMA1Pair 1
FMIA2 - FMIA1Pair 2
IMPA2 - IMPA1Pair 3
Ls = E line 2 - Ls = E line 1Pair 4
Li = E line 2 - Li = E line 1Pair 5
< L1 2 - < L1 1Pair 6
TAFH2 - TAFH1Pair 7
UAFH2 - UAFH1Pair 8
LAFH2 - LAFH1Pair 9
% 2 - % 1Pair 10
Mean Std. DeviationStd. Error
Mean Lower Upper
95% ConfidenceInterval of the
Difference
Paired Differences
t df Sig. (2-tailed)
Perempuan
T-Test
xv
Paired Samples Statistics
29,1310 42 6,71643 1,03637
29,1357 42 6,51680 1,00556
55,2619 42 4,29014 ,66198
55,7262 42 5,10524 ,78776
95,6071 42 6,93131 1,06953
95,1381 42 6,85395 1,05759
-2,1536 42 1,74744 ,26964
-2,1643 42 1,78058 ,27475
-1,0833 42 1,88422 ,29074
-1,1376 42 1,88008 ,29010
95,6071 42 6,93131 1,06953
95,1381 42 6,85395 1,05759
110,7812 42 5,95746 ,91926
109,9217 42 5,22134 ,80567
51,0712 42 2,30445 ,35558
51,0824 42 2,45509 ,37883
59,7105 42 5,10102 ,78710
58,8398 42 4,22081 ,65128
,8593 42 ,07121 ,01099
,8724 42 ,07091 ,01094
FMA2
FMA1
Pair1
FMIA2
FMIA1
Pair2
IMPA2
IMPA1
Pair3
Ls = E line 2
Ls = E line 1
Pair4
Li = E line 2
Li = E line 1
Pair5
< L1 2
< L1 1
Pair6
TAFH2
TAFH1
Pair7
UAFH2
UAFH1
Pair8
LAFH2
LAFH1
Pair9
% 2
% 1
Pair10
Mean N Std. DeviationStd. Error
Mean
Paired Samples Test
-,00476 4,83594 ,74620 -1,51175 1,50222 -,006 41 ,995
-,46429 4,12664 ,63675 -1,75024 ,82167 -,729 41 ,470
,46905 4,14802 ,64005 -,82357 1,76166 ,733 41 ,468
,01071 ,57251 ,08834 -,16769 ,18912 ,121 41 ,904
,05429 ,48417 ,07471 -,09659 ,20516 ,727 41 ,472
,46905 4,14802 ,64005 -,82357 1,76166 ,733 41 ,468
,85952 3,44151 ,53104 -,21293 1,93197 1,619 41 ,113
-,01119 1,65944 ,25606 -,52831 ,50593 -,044 41 ,965
,87071 3,54574 ,54712 -,23422 1,97565 1,591 41 ,119
-,01310 ,06038 ,00932 -,03191 ,00572 -1,405 41 ,167
FMA2 - FMA1Pair 1
FMIA2 - FMIA1Pair 2
IMPA2 - IMPA1Pair 3
Ls = E line 2 - Ls = E line 1Pair 4
Li = E line 2 - Li = E line 1Pair 5
< L1 2 - < L1 1Pair 6
TAFH2 - TAFH1Pair 7
UAFH2 - UAFH1Pair 8
LAFH2 - LAFH1Pair 9
% 2 - % 1Pair 10
Mean Std. DeviationStd. Error
Mean Lower Upper
95% ConfidenceInterval of the
Difference
Paired Differences
t df Sig. (2-tailed)
xvi

Lampiran 2
Foto Profil Wajah
xvii
Correlations
1 ,828** -,111 -,105 -,046 -,029
,000 ,382 ,409 ,721 ,823
64 64 64 64 64 64
,828** 1 -,099 -,110 -,136 -,123
,000 ,435 ,386 ,283 ,332
64 64 64 64 64 64
-,111 -,099 1 ,966** ,827** ,783**
,382 ,435 ,000 ,000 ,000
64 64 64 64 64 64
-,105 -,110 ,966** 1 ,845** ,817**
,409 ,386 ,000 ,000 ,000
64 64 64 64 64 64
-,046 -,136 ,827** ,845** 1 ,966**
,721 ,283 ,000 ,000 ,000
64 64 64 64 64 64
-,029 -,123 ,783** ,817** ,966** 1
,823 ,332 ,000 ,000 ,000
64 64 64 64 64 64
Pearson Correlation
Sig. (2-tailed)
N
Pearson Correlation
Sig. (2-tailed)
N
Pearson Correlation
Sig. (2-tailed)
N
Pearson Correlation
Sig. (2-tailed)
N
Pearson Correlation
Sig. (2-tailed)
N
Pearson Correlation
Sig. (2-tailed)
N
< L1 1
< L1 2
Ls = E line 1
Ls = E line 2
Li = E line 1
Li = E line 2
< L1 1 < L1 2 Ls = E line 1 Ls = E line 2 Li = E line 1 Li = E line 2
Correlation is significant at the 0.01 level (2-tailed).**.
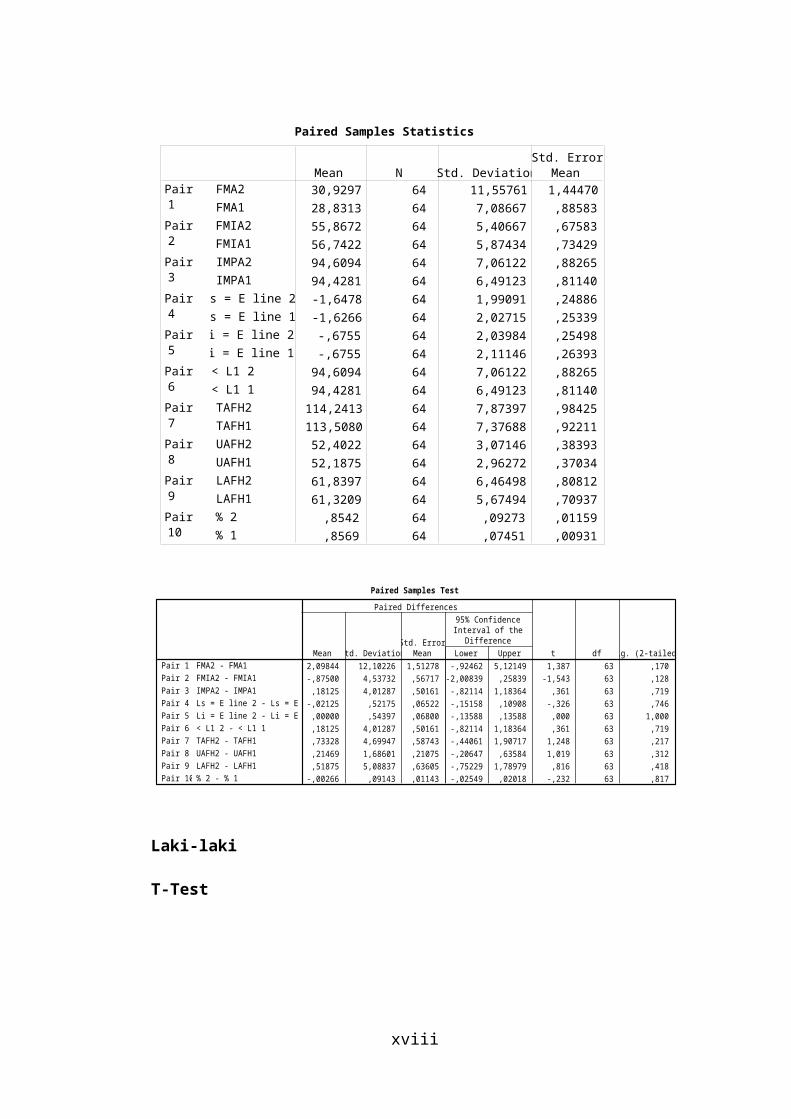
Foto Siluet
Tracing Sefalometri
xviii

xix