week 1 - industriuntarb17.files.wordpress.com · pengertian suatu teknik dan kegiatan untuk...
TRANSCRIPT

By : L.L.S
Week 1
1 PENGENDALIAN KUALITAS WEEK 1 & 2

Secara Umum:
a. Webster’s Dictionary
degree of excellence of a thing
b. American Society for Quality
totality of features and characteristics that satisfy needs
c. Consumer’s and Producer’s Perspective
2 PENGENDALIAN KUALITAS WEEK 1 & 2

Pengertian
Suatu teknik dan kegiatan untuk mencapai
keinginan yang berkelanjutan dan kualitas
produk atau jasa harus dibuktikan.
Tujuan :
Design, Kualitas
dan Harga
CUSTOMER
SATISFACTION
3 PENGENDALIAN KUALITAS WEEK 1 & 2

1. Spesifikasi baku
2. Desain yang sesuai spesifikasi
3. Produksi atau instalasi sesuai dengan
toleransi yang diizinkan
4. Adanya Inspeksi
5. Revisi
4 PENGENDALIAN KUALITAS WEEK 1 & 2

Fisik
- Panjang , Berat, …
Sensor
- Rasa, penampilan, warna,…
Orientasi waktu
- Keandalan, pemeliharaan, pelayanan
5 PENGENDALIAN KUALITAS WEEK 1 & 2

Fitness for
Consumer Use
Producer’s Perspective Consumer’s Perspective
Quality of Conformance
• Conformance to
specifications
• Cost
Quality of Design
• Quality characteristics
• Price
Marketing Production
Meaning of Quality
6 PENGENDALIAN KUALITAS WEEK 1 & 2
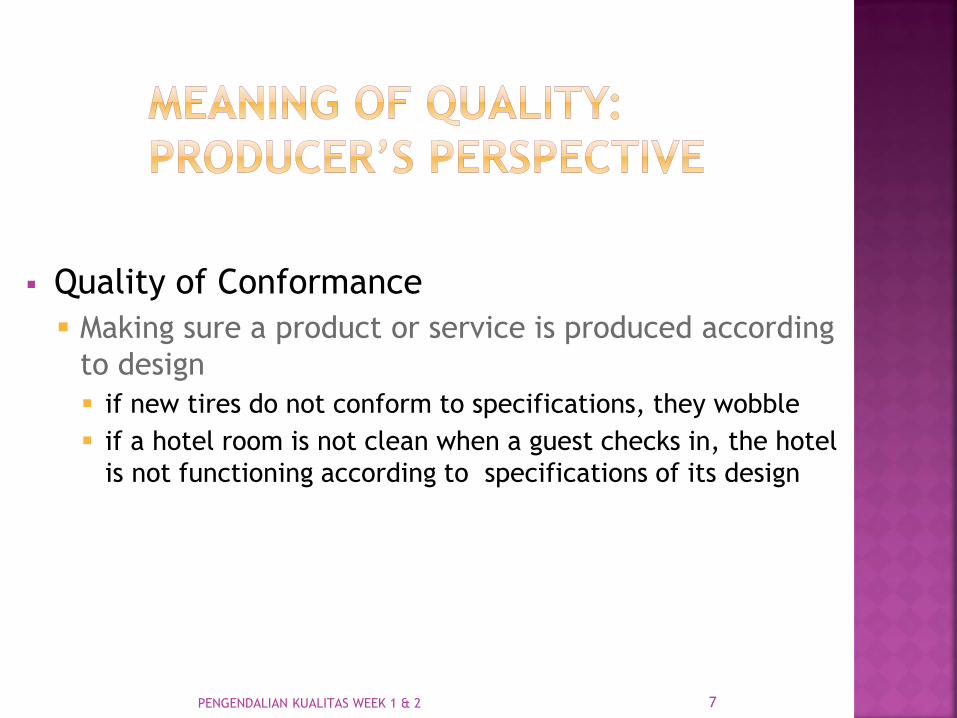
Quality of Conformance
Making sure a product or service is produced according
to design
if new tires do not conform to specifications, they wobble
if a hotel room is not clean when a guest checks in, the hotel
is not functioning according to specifications of its design
7 PENGENDALIAN KUALITAS WEEK 1 & 2

Fitness for use
how well product or service
does what it is supposed to
Quality of design
designing quality characteristics
into a product or service
A Mercedes and a Ford are
equally “fit for use,” but with
different design dimensions
3-8 PENGENDALIAN KUALITAS WEEK 1 & 2

Consumer’s and producer’s perspectives
depend on each other
Consumer’s perspective: PRICE
Producer’s perspective: COST
Consumer’s view must dominate
9 PENGENDALIAN KUALITAS WEEK 1 & 2

Manufacturing Dimensions Performance Features Reliability Conformance Durability Serviceability Aesthetics Perceived quality
Service Dimensions Reliability Responsiveness Assurance Empathy Tangibles
10 PENGENDALIAN KUALITAS WEEK 1 & 2

Performance basic operating characteristics of a product; how
well a car is handled or its gas mileage
Features “extra” items added to basic features, such as a
stereo CD or a leather interior in a car
Reliability probability that a product will operate properly
within an expected time frame; that is, a TV will work without repair for about seven years
11 PENGENDALIAN KUALITAS WEEK 1 & 2

Conformance degree to which a product meets pre–established
standards
Durability how long product lasts before replacement
Serviceability ease of getting repairs, speed of repairs,
courtesy and competence of repair person
12 PENGENDALIAN KUALITAS WEEK 1 & 2

Aesthetics how a product looks, feels, sounds,
smells, or tastes
Safety assurance that customer will not suffer
injury or harm from a product; an especially important consideration for automobiles
Perceptions subjective perceptions based on brand
name, advertising, and the like
13 PENGENDALIAN KUALITAS WEEK 1 & 2

Time and Timeliness
How long must a customer wait for service,
and is it completed on time?
Is an overnight package delivered overnight?
Completeness:
Is everything customer asked for provided?
Is a mail order from a catalogue company
complete when delivered?
14 PENGENDALIAN KUALITAS WEEK 1 & 2

Courtesy: How are customers treated by employees?
Are catalogue phone operators nice and are their voices pleasant?
Consistency Is the same level of service provided to each
customer each time?
Is your newspaper delivered on time every morning?
15 PENGENDALIAN KUALITAS WEEK 1 & 2

Accessibility and convenience How easy is it to obtain service?
Does a service representative answer you calls quickly?
Accuracy Is the service performed right every time?
Is your bank or credit card statement correct every month?
Responsiveness How well does the company react to unusual situations?
How well is a telephone operator able to respond to a customer’s questions?
16 PENGENDALIAN KUALITAS WEEK 1 & 2

Consumer’s and producer’s perspectives
depend on each other
Consumer’s perspective: PRICE
Producer’s perspective: COST
Consumer’s view must dominate
17 PENGENDALIAN KUALITAS WEEK 1 & 2

18 PENGENDALIAN KUALITAS WEEK 1 & 2

19 PENGENDALIAN KUALITAS WEEK 1 & 2

Customer
Marketing
Rekayasa Desain
Pengadaan
Proses Desain Produksi Inspeksi dan
Pengujian
Pengepakan dan
Gudang
Pelayanan
Produk
Kualitas
Produk
20 PENGENDALIAN KUALITAS WEEK 1 & 2
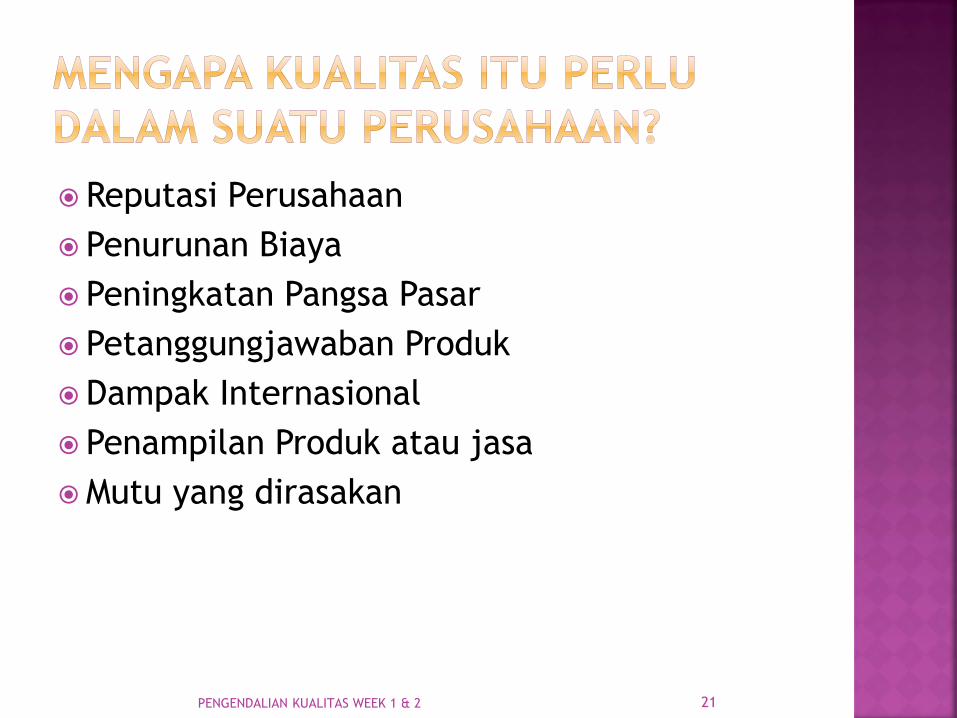
Reputasi Perusahaan
Penurunan Biaya
Peningkatan Pangsa Pasar
Petanggungjawaban Produk
Dampak Internasional
Penampilan Produk atau jasa
Mutu yang dirasakan
21 PENGENDALIAN KUALITAS WEEK 1 & 2

Walter Shewart In 1920s, developed control charts
Introduced the term “quality assurance”
W. Edwards Deming
Developed courses during World War II to teach statistical quality-control techniques to engineers and executives of companies that were military suppliers
After the war, began teaching statistical quality control to Japanese companies
Joseph M. Juran Followed Deming to Japan in 1954
Focused on strategic quality planning
22 PENGENDALIAN KUALITAS WEEK 1 & 2

Armand V. Feigenbaum In 1951, introduced concepts of total quality control
and continuous quality improvement
Philip Crosby In 1979, emphasized that costs of poor quality far
outweigh the cost of preventing poor quality
In 1984, defined absolutes of quality management—conformance to requirements, prevention, and “zero defects”
Kaoru Ishikawa Promoted use of quality circles
Developed “fishbone” diagram
Emphasized importance of internal customer
23 PENGENDALIAN KUALITAS WEEK 1 & 2

Tahun 1920 :
Pengendalian mutu dimulai di Amerika Serikat yang
terbatas pada Dept Produksi atau pembuatan barang
Tahun 1924 :
Diperkenalkan Control atau bagan kontrol dan
dikembangkan oleh Doktor WA Stuwart dari USA
24 PENGENDALIAN KUALITAS WEEK 1 & 2

Tahun 1940 :
Dimulai pengendalian mutu yang menggunakan
metode statistik dan dipelopori oleh Prof.Dr.JM.Juran
dan Prof. Deming
Tahun 1945-1950 :
Statistical Quality Control (SQC) diperkenalkan di
AS terutama di kalangan angkatan bersenjata
Tahun 1949 :
SQC masuk Jepang untuk memperbaiki mutu produk
di Jepang pada waktu itu masih rendah
25 PENGENDALIAN KUALITAS WEEK 1 & 2

Tahun 1951-1954 :
SQC dikembangkan secara masal di Jepang dan diadakan semacam penghargaan bagi yang mencapai derajat mutu yang tinggi dengan pemberian DEMING PRICE
Tahun 1955 :
Peter Drucker mengembangkan Management By Objective (MBO) yang memberikan penekanan pada “Strategic Planning Management Development”
26 PENGENDALIAN KUALITAS WEEK 1 & 2

Tahun 1960 :
Dikembangkan Company Wide Quality Control
(CWQC) yang mengharuskan semua karyawan
belajar metode statistic dan ikut berpartisipasi dlm
menggalakkan TQC
Tahun 1962 :
Pelaksanaan pengendalian mutu dan digunakan
Cause & Effect Diagram pada pelaksanaan QCC.
27 PENGENDALIAN KUALITAS WEEK 1 & 2

Tahun 1978 :
TQC masuk ke Indonesia bermula dari perusahaan-perusahaan Jepang yang menanamkan modalnya di Indonesia
Tahun 1980 :
TQC masuk ke Dept Perindustrian RI dan diakui oleh Dept Perhub RI.
Tahun 1988 :
Tepatnya tgl 28 Oktober 1988 dikeluarkan SK No : DZ/SKEP/5040/88 ttg Pelaksanaan Kegiatan Pengendalian Mutu Terpadu di Lingk. PT GARUDA Indonesia
28 PENGENDALIAN KUALITAS WEEK 1 & 2

EVOLUSI DARI TQM Inspection
Quality
Control
Quality
Assurance
QM & TQM
29 PENGENDALIAN KUALITAS WEEK 1 & 2

1. W. Edward Deming
2. Philip B Crosby
3. Joseph M Juran PhD
30 PENGENDALIAN KUALITAS WEEK 1 & 2

Deming’s 14 Point
1. Create constancy of purpose
2. Adopt philosophy of prevention
3. Cease mass inspection
4. Select a few suppliers based on quality
5. Constantly improve system and workers
6. Institute worker training
7. Instill leadership among supervisors
8. Eliminate fear among employees
9. Eliminate barriers between departments
10. Eliminate slogans
31 PENGENDALIAN KUALITAS WEEK 1 & 2

11. Remove numerical quotas
12. Enhance worker pride
13. Institute vigorous training and education
programs
14. Develop a commitment from top
management to implement above 13 points
32 PENGENDALIAN KUALITAS WEEK 1 & 2

14 Langkah Perbaikan Mutu
1. Komitmen Manajemen
2. Tim Perbaikan Mutu
3. Pengukuran Mutu
4. Biaya Evaluasi Mutu
5. Kesadaran Mutu
6. Tindakan Koreksi
7. Zero Defect
8. Training for Supervisor
9. Zero Defect day
10. Make a Target n purpose
11. Kesalahan berakibat fatal
12. Pengenalan
13. Dewan Mutu
14. Pengulangan 33 PENGENDALIAN KUALITAS WEEK 1 & 2

Quality Planning
Quality Control
Quality Improvement
34 PENGENDALIAN KUALITAS WEEK 1 & 2

Metode Grafis
- Flowchart
- Diagram Sebab Akibat
- Diagram Pareto
- Time Series
- Check sheet
- Histogram
- Run chart
- Scattered Diagram
- Control Chart
35 PENGENDALIAN KUALITAS WEEK 1 & 2

Analisa Matriks
- Biasanya digunakan untuk membandingkan
kelompok kategori.
- Sederhana dan efektif
36 PENGENDALIAN KUALITAS WEEK 1 & 2

Data Verbal
- Flowchart
- Brainstorming
- Affinity Diagram
- Cause Effect Diagram
Data numerik
37 PENGENDALIAN KUALITAS WEEK 1 & 2

0
5
1
0
15
20
1 2 6 13 10 16 19 17 12 16 2017 13 5 6 2 1
38 PENGENDALIAN KUALITAS WEEK 1 & 2

COMPONENTS REPLACED BY LAB
TIME PERIOD: 22 Feb to 27 Feb 2002
REPAIR TECHNICIAN: Bob
TV SET MODEL 1013
Integrated Circuits ||||
Capacitors |||| |||| |||| |||| |||| ||
Resistors ||
Transformers ||||
Commands
CRT |
39 PENGENDALIAN KUALITAS WEEK 1 & 2

NUMBER OF CAUSE DEFECTS PERCENTAGE
Poor design 80 64 %
Wrong part dimensions 16 13
Defective parts 12 10
Incorrect machine calibration 7 6
Operator errors 4 3
Defective material 3 2
Surface abrasions 3 2
125 100 %
40 PENGENDALIAN KUALITAS WEEK 1 & 2

Perc
en
t fr
om
each
cau
se
Causes of poor quality
0
10
20
30
40
50
60
70 (64)
(13) (10)
(6) (3) (2) (2)
41 PENGENDALIAN KUALITAS WEEK 1 & 2
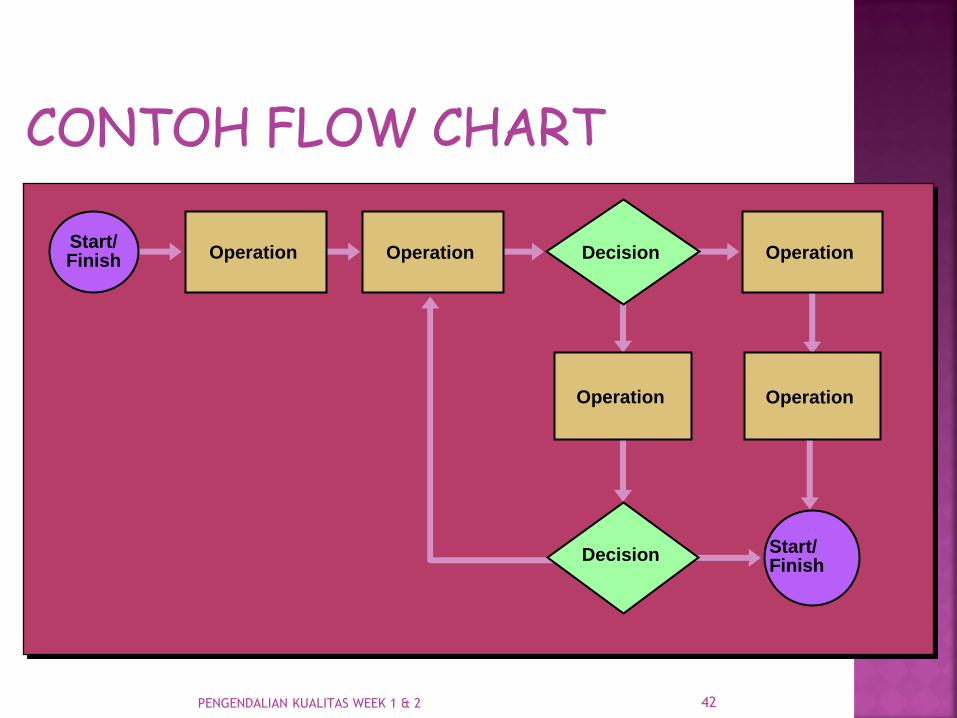
Operation Decision Start/ Finish
Start/ Finish
Operation
Operation Operation
Operation
Decision
42 PENGENDALIAN KUALITAS WEEK 1 & 2

PENGENDALIAN KUALITAS WEEK 1 & 2
Y
X

Quality
Problem
Out of adjustment
Tooling problems
Old / worn
Machines
Faulty
testing equipment
Incorrect specifications
Improper methods
Measurement
Poor supervision
Lack of concentration
Inadequate training
Human
Deficiencies
in product design
Ineffective quality
management
Poor process design
Process
Inaccurate
temperature
control
Dust and Dirt
Environment
Defective from vendor
Not to specifications
Material-
handling problems
Materials
44 PENGENDALIAN KUALITAS WEEK 1 & 2

18
12
6
3
9
15
21
24
2 4 6 8 10 12 14 16
Sample number
Nu
mb
er
of
defe
cts
UCL = 23.35
LCL = 1.99
c = 12.67
45 PENGENDALIAN KUALITAS WEEK 1 & 2

“C U NEXT WEEK”
46 PENGENDALIAN KUALITAS WEEK 1 & 2