riwayat hidup - repository.maranatha.edu filedosis 5% = 5 gr daun leunca kering dilarutkan dalam 100...
TRANSCRIPT
54
RIWAYAT HIDUP
Nama : Hengky Fernando D
Tempat tanggal lahir : Curup, 18 Januari 1985
Alamat : Jl M. Hasan No 39
Curup – 39116 – Bengkulu
Pendidikan :
1. 1996, lulus SD Xaverius 20 Curup
2. 1999, lulus SMP Xaverius 20 Curup
3. 2002, lulus SMUN 1 Curup
4. 2002, Mahasiswa Fakultas Kedokteran Universitas Kristen Maranatha
Bandung
44
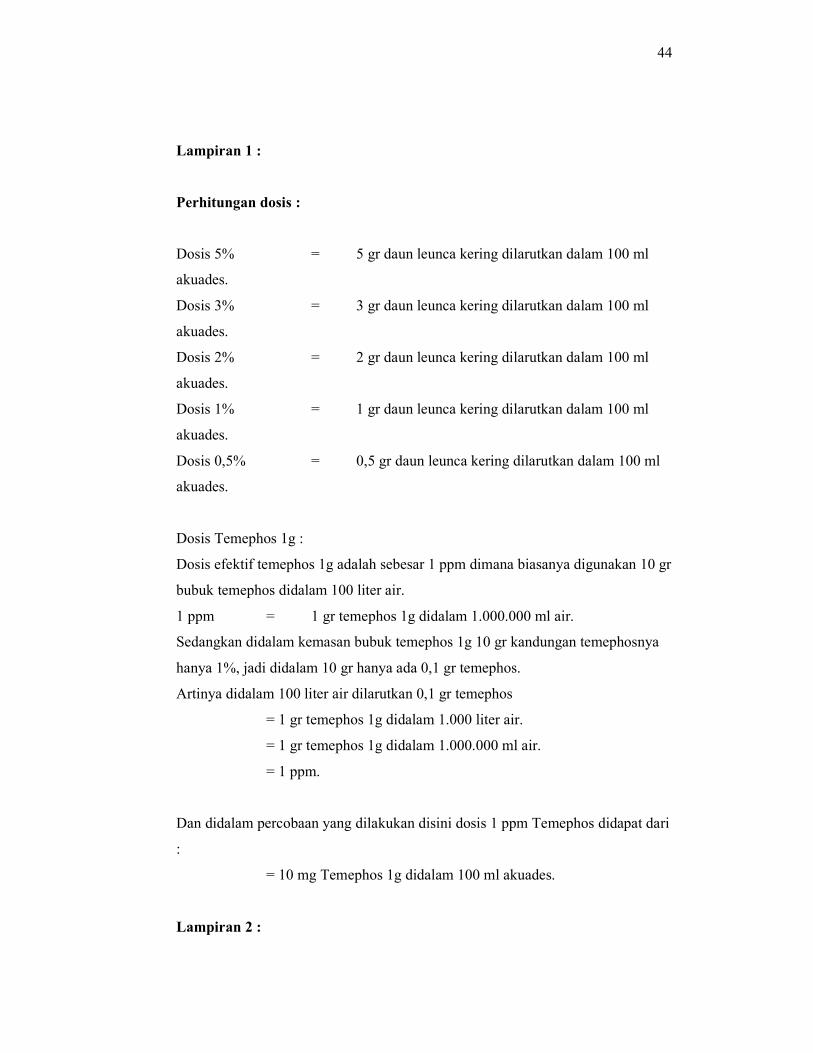
Lampiran 1 :
Perhitungan dosis :
Dosis 5% = 5 gr daun leunca kering dilarutkan dalam 100 ml
akuades.
Dosis 3% = 3 gr daun leunca kering dilarutkan dalam 100 ml
akuades.
Dosis 2% = 2 gr daun leunca kering dilarutkan dalam 100 ml
akuades.
Dosis 1% = 1 gr daun leunca kering dilarutkan dalam 100 ml
akuades.
Dosis 0,5% = 0,5 gr daun leunca kering dilarutkan dalam 100 ml
akuades.
Dosis Temephos 1g :
Dosis efektif temephos 1g adalah sebesar 1 ppm dimana biasanya digunakan 10 gr
bubuk temephos didalam 100 liter air.
1 ppm = 1 gr temephos 1g didalam 1.000.000 ml air.
Sedangkan didalam kemasan bubuk temephos 1g 10 gr kandungan temephosnya
hanya 1%, jadi didalam 10 gr hanya ada 0,1 gr temephos.
Artinya didalam 100 liter air dilarutkan 0,1 gr temephos
= 1 gr temephos 1g didalam 1.000 liter air.
= 1 gr temephos 1g didalam 1.000.000 ml air.
= 1 ppm.
Dan didalam percobaan yang dilakukan disini dosis 1 ppm Temephos didapat dari
:
= 10 mg Temephos 1g didalam 100 ml akuades.
Lampiran 2 :
45
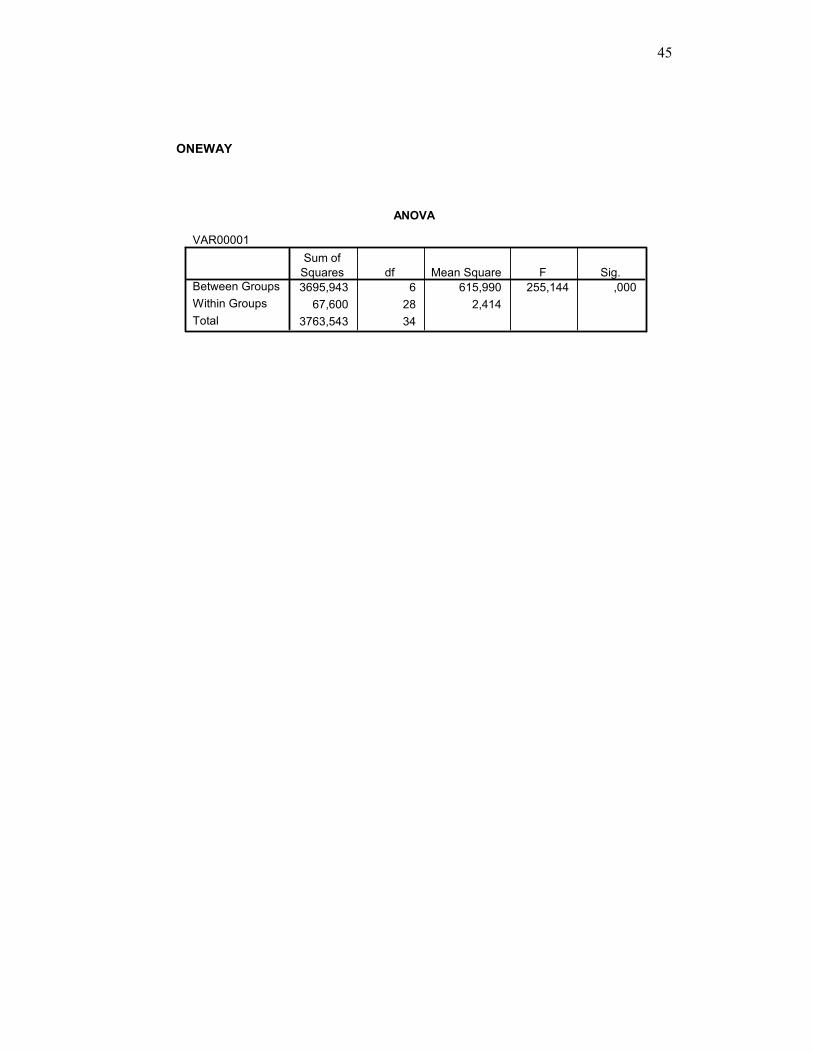
ANOVA
VAR00001
3695,943 6 615,990 255,144 ,000
67,600 28 2,414
3763,543 34
Between Groups
Within Groups
Total
Sum of
Squares df Mean Square F Sig.
ONEWAY
46
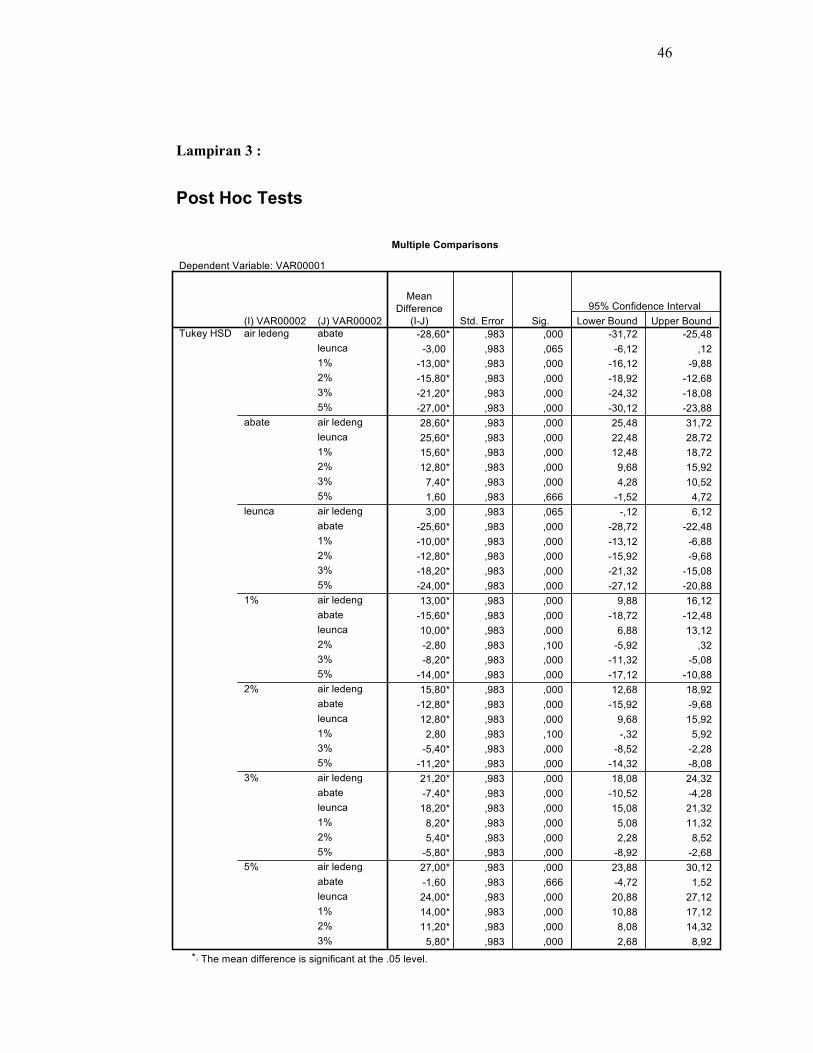
Lampiran 3 :
Post Hoc Tests
Multiple Comparisons
Dependent Variable: VAR00001
-28,60* ,983 ,000 -31,72 -25,48
-3,00 ,983 ,065 -6,12 ,12
-13,00* ,983 ,000 -16,12 -9,88
-15,80* ,983 ,000 -18,92 -12,68
-21,20* ,983 ,000 -24,32 -18,08
-27,00* ,983 ,000 -30,12 -23,88
28,60* ,983 ,000 25,48 31,72
25,60* ,983 ,000 22,48 28,72
15,60* ,983 ,000 12,48 18,72
12,80* ,983 ,000 9,68 15,92
7,40* ,983 ,000 4,28 10,52
1,60 ,983 ,666 -1,52 4,72
3,00 ,983 ,065 -,12 6,12
-25,60* ,983 ,000 -28,72 -22,48
-10,00* ,983 ,000 -13,12 -6,88
-12,80* ,983 ,000 -15,92 -9,68
-18,20* ,983 ,000 -21,32 -15,08
-24,00* ,983 ,000 -27,12 -20,88
13,00* ,983 ,000 9,88 16,12
-15,60* ,983 ,000 -18,72 -12,48
10,00* ,983 ,000 6,88 13,12
-2,80 ,983 ,100 -5,92 ,32
-8,20* ,983 ,000 -11,32 -5,08
-14,00* ,983 ,000 -17,12 -10,88
15,80* ,983 ,000 12,68 18,92
-12,80* ,983 ,000 -15,92 -9,68
12,80* ,983 ,000 9,68 15,92
2,80 ,983 ,100 -,32 5,92
-5,40* ,983 ,000 -8,52 -2,28
-11,20* ,983 ,000 -14,32 -8,08
21,20* ,983 ,000 18,08 24,32
-7,40* ,983 ,000 -10,52 -4,28
18,20* ,983 ,000 15,08 21,32
8,20* ,983 ,000 5,08 11,32
5,40* ,983 ,000 2,28 8,52
-5,80* ,983 ,000 -8,92 -2,68
27,00* ,983 ,000 23,88 30,12
-1,60 ,983 ,666 -4,72 1,52
24,00* ,983 ,000 20,88 27,12
14,00* ,983 ,000 10,88 17,12
11,20* ,983 ,000 8,08 14,32
5,80* ,983 ,000 2,68 8,92
(J) VAR00002
abate
leunca
1%
2%
3%
5%
air ledeng
leunca
1%
2%
3%
5%
air ledeng
abate
1%
2%
3%
5%
air ledeng
abate
leunca
2%
3%
5%
air ledeng
abate
leunca
1%
3%
5%
air ledeng
abate
leunca
1%
2%
5%
air ledeng
abate
leunca
1%
2%
3%
(I) VAR00002
air ledeng
abate
leunca
1%
2%
3%
5%
Tukey HSD
Mean
Difference
(I-J) Std. Error Sig. Lower Bound Upper Bound
95% Confidence Interval
The mean difference is significant at the .05 level.*.
47
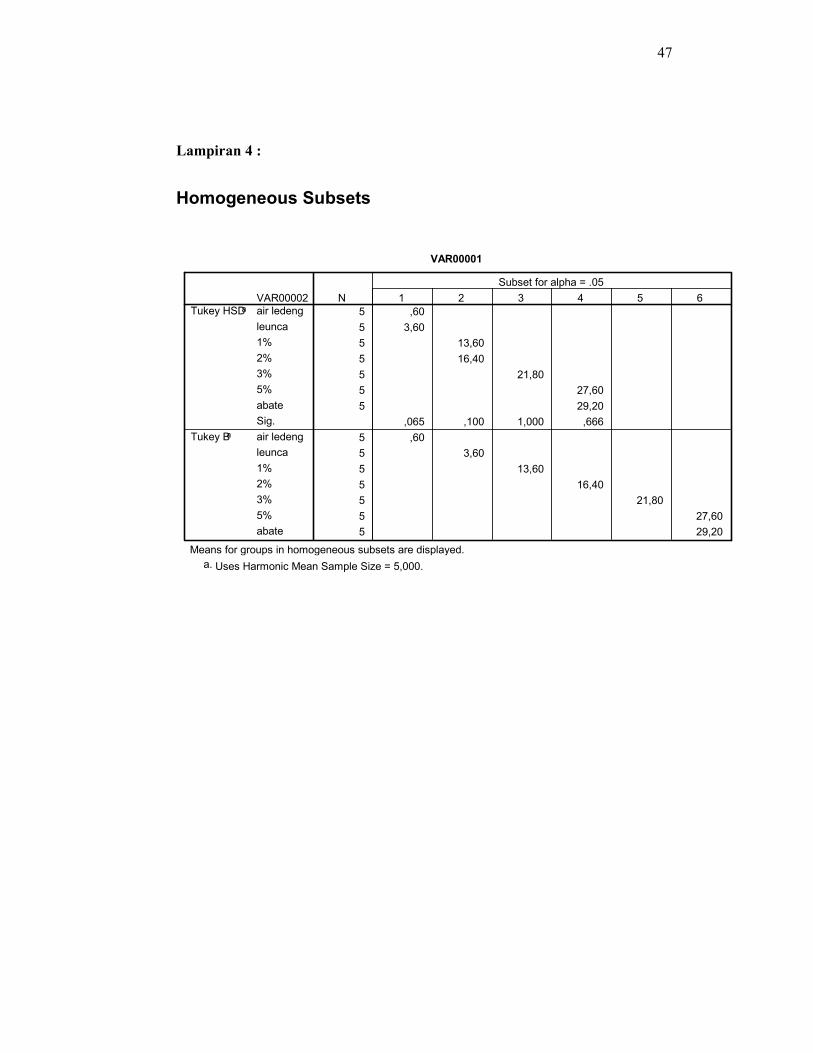
Lampiran 4 :
Homogeneous Subsets
VAR00001
5 ,60
5 3,60
5 13,60
5 16,40
5 21,80
5 27,60
5 29,20
,065 ,100 1,000 ,666
5 ,60
5 3,60
5 13,60
5 16,40
5 21,80
5 27,60
5 29,20
VAR00002
air ledeng
leunca
1%
2%
3%
5%
abate
Sig.
air ledeng
leunca
1%
2%
3%
5%
abate
Tukey HSDa
Tukey Ba
N 1 2 3 4 5 6
Subset for alpha = .05
Means for groups in homogeneous subsets are displayed.
Uses Harmonic Mean Sample Size = 5,000.a.
48
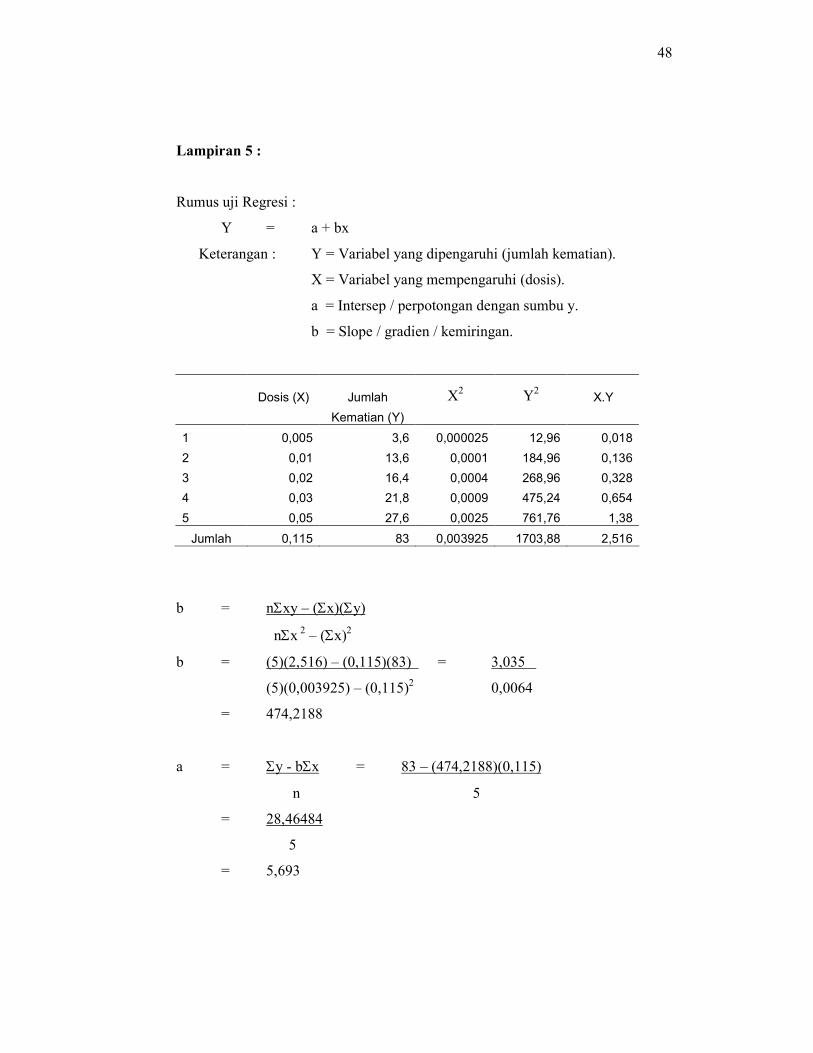
Lampiran 5 :
Rumus uji Regresi :
Y = a + bx
Keterangan : Y = Variabel yang dipengaruhi (jumlah kematian).
X = Variabel yang mempengaruhi (dosis).
a = Intersep / perpotongan dengan sumbu y.
b = Slope / gradien / kemiringan.
Dosis (X) Jumlah X2 Y
2 X.Y
Kematian (Y)
1 0,005 3,6 0,000025 12,96 0,018
2 0,01 13,6 0,0001 184,96 0,136
3 0,02 16,4 0,0004 268,96 0,328
4 0,03 21,8 0,0009 475,24 0,654
5 0,05 27,6 0,0025 761,76 1,38
Jumlah 0,115 83 0,003925 1703,88 2,516
b = nΣxy – (Σx)(Σy)qqqqq
nΣx 2 – (Σx)
2
b = (5)(2,516) – (0,115)(83) = 3,035
(5)(0,003925) – (0,115)2 0,0064
= 474,2188
a = Σy - bΣx = 83 – (474,2188)(0,115)
n 5
= 28,46484
5
= 5,693
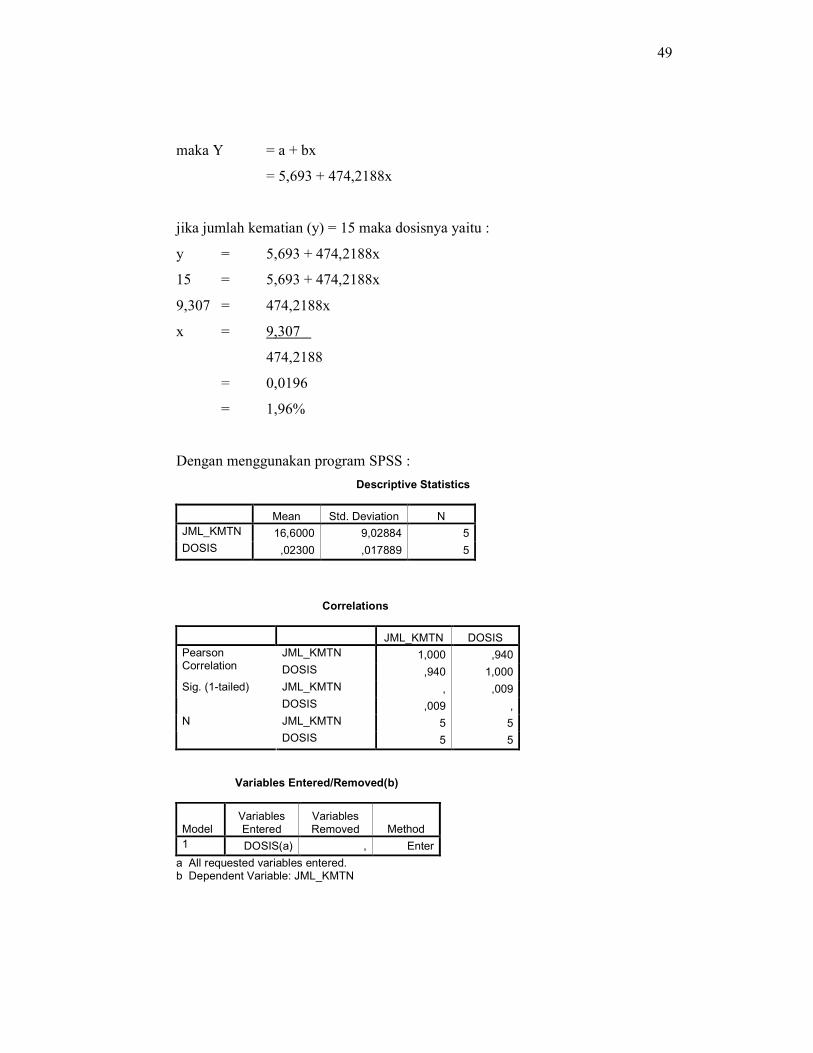
49
maka Y = a + bx
= 5,693 + 474,2188x
jika jumlah kematian (y) = 15 maka dosisnya yaitu :
y = 5,693 + 474,2188x
15 = 5,693 + 474,2188x
9,307 = 474,2188x
x = 9,307
474,2188
= 0,0196
= 1,96%
Dengan menggunakan program SPSS :
Descriptive Statistics
Mean Std. Deviation N
JML_KMTN 16,6000 9,02884 5
DOSIS ,02300 ,017889 5
Correlations
JML_KMTN DOSIS
JML_KMTN 1,000 ,940 Pearson Correlation DOSIS ,940 1,000
JML_KMTN , ,009 Sig. (1-tailed)
DOSIS ,009 ,
JML_KMTN 5 5 N
DOSIS 5 5
Variables Entered/Removed(b)
Model Variables Entered
Variables Removed Method
1 DOSIS(a) , Enter
a All requested variables entered. b Dependent Variable: JML_KMTN
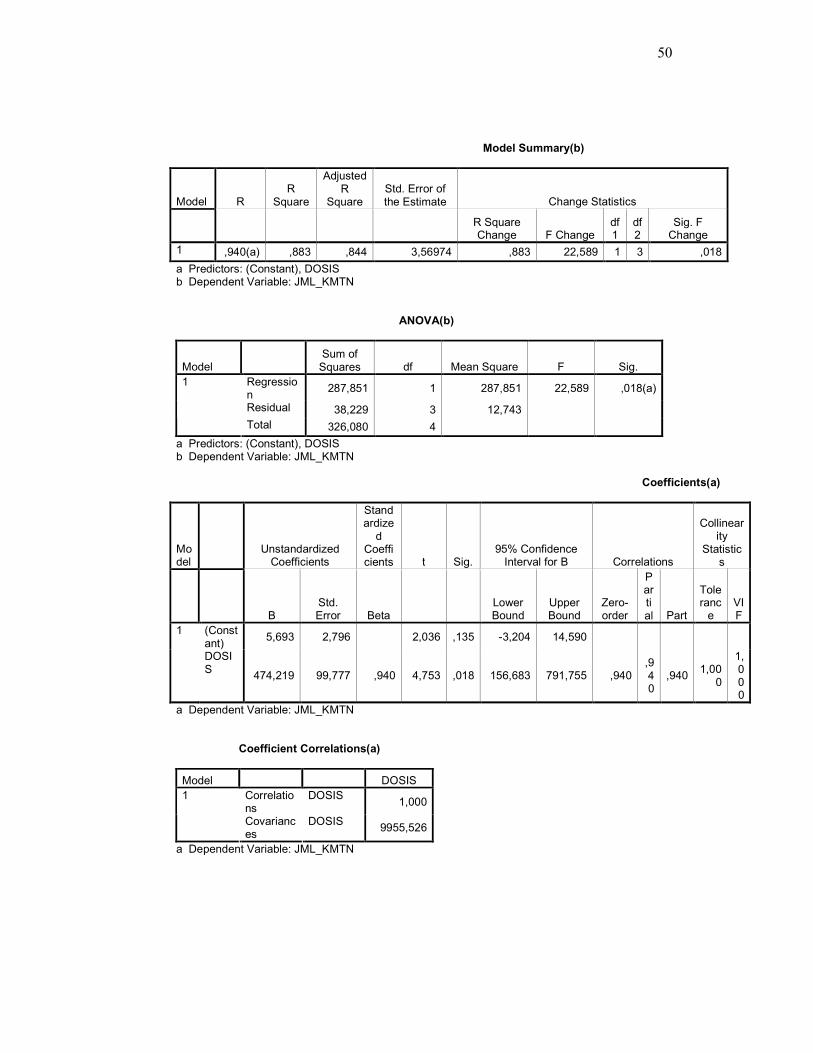
50
Model Summary(b)
Model R R
Square
Adjusted R
Square Std. Error of the Estimate Change Statistics
R Square Change F Change
df1
df2
Sig. F Change
1 ,940(a) ,883 ,844 3,56974 ,883 22,589 1 3 ,018
a Predictors: (Constant), DOSIS b Dependent Variable: JML_KMTN ANOVA(b)
Model Sum of Squares df Mean Square F Sig.
Regression
287,851 1 287,851 22,589 ,018(a)
Residual 38,229 3 12,743
1
Total 326,080 4
a Predictors: (Constant), DOSIS b Dependent Variable: JML_KMTN Coefficients(a)
Model
Unstandardized Coefficients
Standardize
d Coefficients t Sig.
95% Confidence Interval for B Correlations
Collinearity
Statistics
B Std. Error Beta
Lower Bound
Upper Bound
Zero-order
Partial Part
Tolerance
VIF
1 (Constant)
5,693 2,796 2,036 ,135 -3,204 14,590
DOSIS
474,219 99,777 ,940 4,753 ,018 156,683 791,755 ,940 ,940
,940 1,00
0
1,000
a Dependent Variable: JML_KMTN Coefficient Correlations(a)
Model DOSIS
Correlations
DOSIS 1,000
1
Covariances
DOSIS 9955,526
a Dependent Variable: JML_KMTN
51
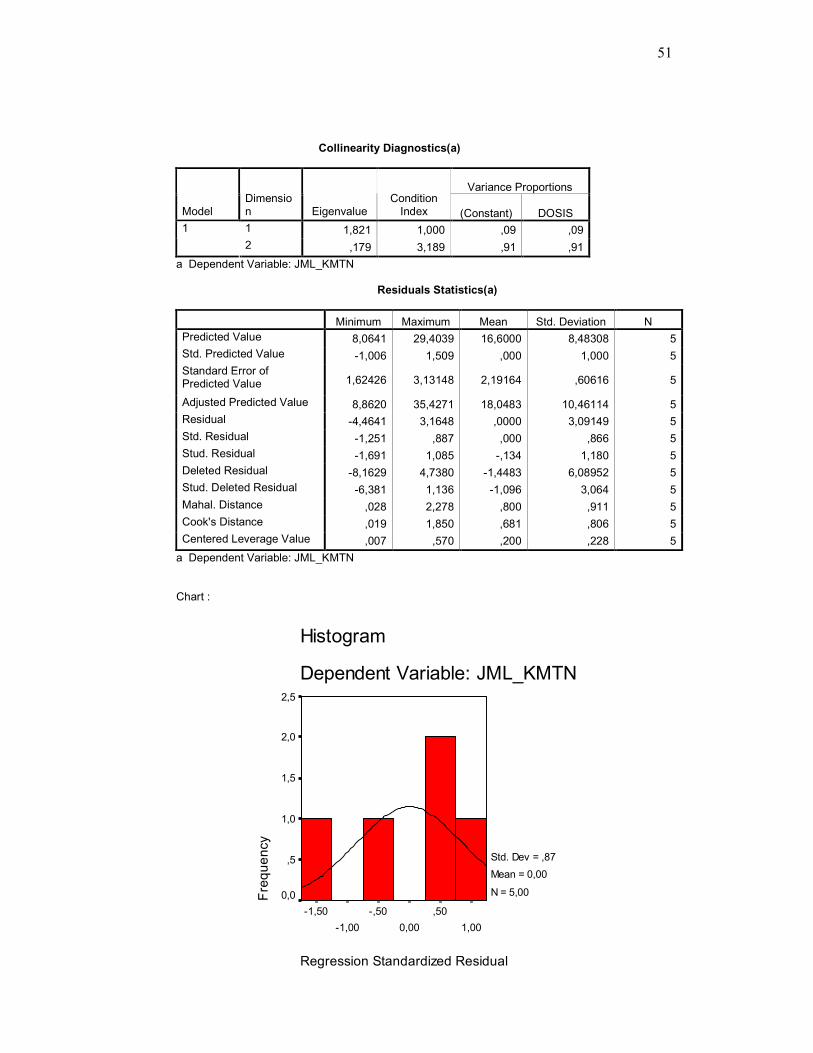
Collinearity Diagnostics(a)
Variance Proportions
Model Dimension Eigenvalue
Condition Index (Constant) DOSIS
1 1,821 1,000 ,09 ,09 1
2 ,179 3,189 ,91 ,91
a Dependent Variable: JML_KMTN Residuals Statistics(a)
Minimum Maximum Mean Std. Deviation N
Predicted Value 8,0641 29,4039 16,6000 8,48308 5
Std. Predicted Value -1,006 1,509 ,000 1,000 5
Standard Error of Predicted Value 1,62426 3,13148 2,19164 ,60616 5
Adjusted Predicted Value 8,8620 35,4271 18,0483 10,46114 5
Residual -4,4641 3,1648 ,0000 3,09149 5
Std. Residual -1,251 ,887 ,000 ,866 5
Stud. Residual -1,691 1,085 -,134 1,180 5
Deleted Residual -8,1629 4,7380 -1,4483 6,08952 5
Stud. Deleted Residual -6,381 1,136 -1,096 3,064 5
Mahal. Distance ,028 2,278 ,800 ,911 5
Cook's Distance ,019 1,850 ,681 ,806 5
Centered Leverage Value ,007 ,570 ,200 ,228 5
a Dependent Variable: JML_KMTN Chart :
Regression Standardized Residual
1,00
,50
0,00
-,50
-1,00
-1,50
Histogram
Dependent Variable: JML_KMTN
Frequency
2,5
2,0
1,5
1,0
,5
0,0
Std. Dev = ,87
Mean = 0,00
N = 5,00
52
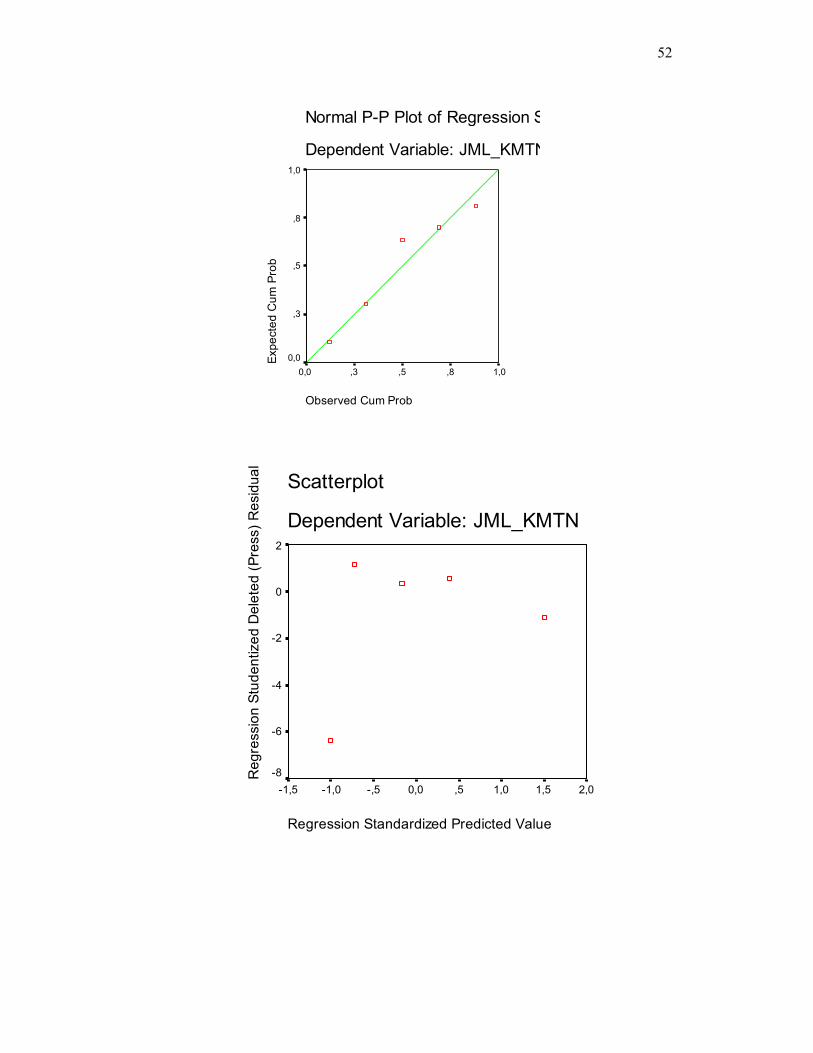
Normal P-P Plot of Regression Standardized Residual
Dependent Variable: JML_KMTN
Observed Cum Prob
1,0,8,5,30,0
Expected C
um Prob
1,0
,8
,5
,3
0,0
Scatterplot
Dependent Variable: JML_KMTN
Regression Standardized Predicted Value
2,01,51,0,50,0-,5-1,0-1,5
Regression Studentized Deleted (Press) Residual
2
0
-2
-4
-6
-8
53
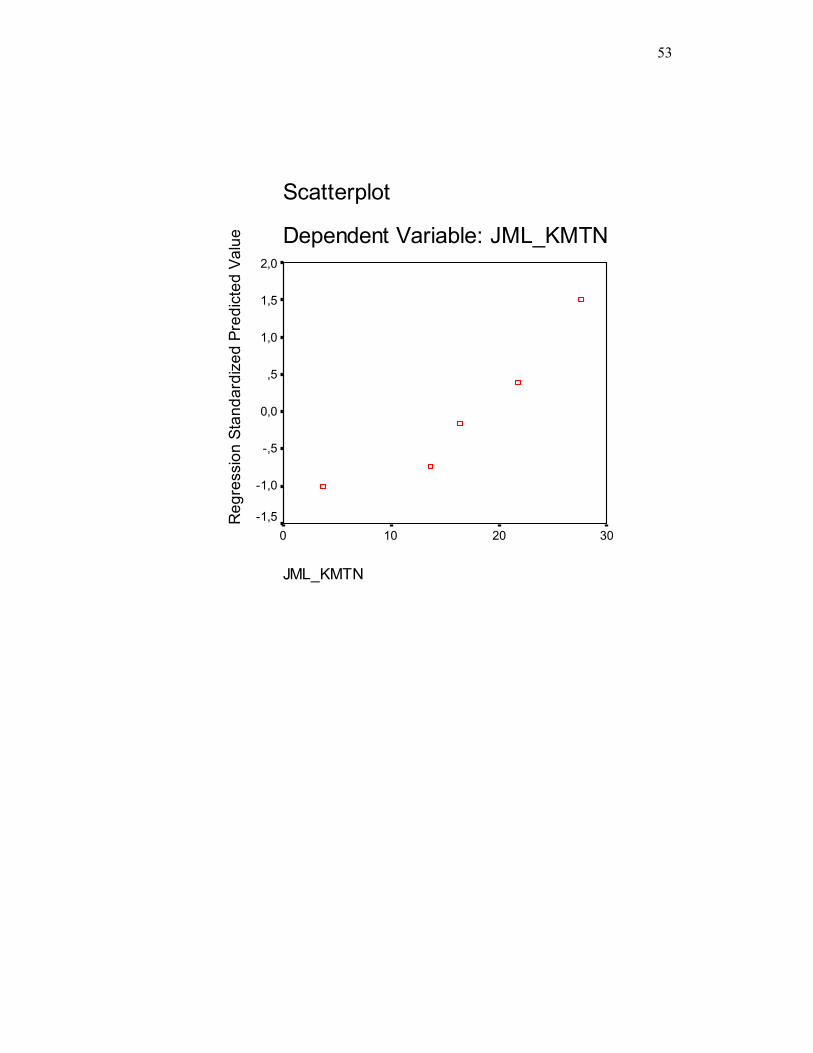
Scatterplot
Dependent Variable: JML_KMTN
JML_KMTN
3020100
Regression Standardized Predicted Value
2,0
1,5
1,0
,5
0,0
-,5
-1,0
-1,5