perindustrian, pertambangan dan · pdf fileindustri pengolahan besar dan ... 26 barang galian...
TRANSCRIPT


PERINDUSTRIAN, PERTAMBANGAN DAN ENERGI
346 Jambi Dalam Angka 2010
MANUFACTURING, MINING AND ENERGY
Jambi in Figures 2010 347
BAB 6 PERINDUSTRIAN, PERTAMBANGAN DAN ENERGI
6.1. Perindustrian
Perindustrian di Provinsi Jambi dari tahun 1997-2010 mengalami peningkatan baik dari unit usaha, tenaga kerja, investasi dan produksinya. Jumlah Perusahaan Industri Pengolahan Besar dan Sedang di Provinsi Jambi pada Tahun 2010 sebanyak 86 dan angka ini menunjukkan peningkatan sebesar 2,38 % dari tahun sebelumnya. Jumlah tenaga kerja sebesar 17.005 orang. 6.2. Pertambangan & Energi
Pertambangan adalah suatu kegiatan pengambilan endapan bahan galian berharga dan bernilai ekonomis dari dalam kulit bumi, di bawah permukaan bumi, dan di bawah permukaan air. 6.3. Listrik, Gas dan Air Minum Perkembangan perlistrikan di Provinsi Jambi juga meningkat sesuai dengan laju perkembangan pembangunan. Data secara rinci dapat dilihat pada tabel 6.3.
CHAPTER 6 MANUFACTURING, ENERGY AND MINERAL RESOURCES 6.1. Manufacturing
Manufacturing sectors in Jambi Province shows good improvement on during 1997-2010 based on number of large/medium manufacturing establishment, workers, investment and production. The number of manufacturing in 2010 was 86 unit decreased 2,38 % from the last year. Number of workers in 2010 was 17.005 person.
6.2. Energy and Mineral Resources
Mining is an activiting of taking deposits of precious and economically valuable minerals from the earth’s crust, below the earth’s surfaces and below the water surfaces.
6.3. Electricity, Gas and Water Supply
The growth of electricity in Jambi Province rise equally with development growth. See on table 6.3.

PERINDUSTRIAN, PERTAMBANGAN DAN ENERGI
348 Jambi Dalam Angka 2010
Gambar 6.1 Jumlah Industri Pengolahan Besar dan Sedang di Provinsi Jambi Tahun 2006 - 2010 Figure Number of Large/Medium Manufacturing Industry in Jambi Province , 2010
Gambar 6.2
Produksi Pertambangan Minyak Bumi di Provinsi Jambi Tahun 2006-2010 (000 barel) Figure Mining Production of Petroleum in Jambi Province, 2006-2010 (000 barrel)

MANUFACTURING, MINING, AND ENERGY
6.1. PERINDUSTRIAN MANUFACTURING
Tabel 6.1.1 Jumlah Perusahaan menurut Kode Industri dan Golongan IndustriTable di Provinsi Jambi Tahun 2006-2010
Number of Establishment by Classification of Manufacturing in Jambi Province, 2006-2010
JumlahSedang / Medium Besar / Large Total
(20-99) ( ≥ 100 )(2) (3) (4)
15 Makanan dan Minuman 12 24 36 Food and Beverage16 Tembakau / Tobacco - - -17 Tekstil / Textile 6 - 620 Kayu dan barang dari kayu 12 6 18 Wood and Product21 Kertas dan barang dari kertas - 1 1 Paper and Product22 Penerbitan / Publication 1 - 124 Kimia dan barang dari bahan kimia - 1 1 Chemical and Product25 Karet dan barang dari bahan karet 2 10 12 Rubber and Product26 Barang galian bukan logam 2 - 2 Non Metalic Product35 Alat angkutan 1 2 3 Transportation Equipment36 Furnitur dan Pengolahan Lainnya 6 - 6 Furniture and Product37 Daur Ulang / Recycle - - -
2009* 42 44 862008 39 45 842007 53 40 932006 61 44 105
Sumber : Badan Pusat Statistik Provinsi JambiSource : BPS - Statistics of Jambi Province *) : Angka sementara / Preliminary figures**) : Angka sangat sementara / Very Preliminary figures
Jumlah/Total 2010 **
Klasifikasi Lapangan Usaha
Indonesian Standard of Industry Classification (ISIC)
(1)
Indonesia (KLUI)
42 44 86
Penggolongan IndustriClassification of Industry
Jambi In Figures 2010 349

PERINDUSTRIAN, PERTAMBANGAN, DAN ENERGI
Tabel 6.1.2 Jumlah Tenaga Kerja menurut Kode Industri dan Golongan Table Industri di Provinsi Jambi Tahun 2006-2010
Number of Workers Engaged by Classification of Manufacturing in Jambi Province, 2006-2010
JumlahSedang / Medium Besar / Large Total
(20-99) ( ≥ 100 )(2) (3) (4)
15 Makanan dan Minuman 788 10 387 11 175 Food and Beverage16 Tembakau / Tobacco - - -17 Tekstil / Textile 182 - 18220 Kayu dan barang dari kayu 344 3 419 3 763 Wood and Product21 Kertas dan barang dari kertas - 2 268 2 268 Paper and Product 22 Penerbitan / Publication 25 - 2524 Kimia dan barang dari bahan kimia - 146 146 Chemical and Product25 Karet dan barang dari bahan karet 145 3 212 3 357 Rubber and Product26 Barang galian bukan logam 42 - 42 Non Metalic Product35 Alat angkutan 42 348 390 Transportation Equipment36 Furnitur dan Pengolahan Lainnya 270 - 270 Furniture and Product37 Daur Ulang / Recycle - - -
2009* 1 973 19 909 21 8822008 1 612 24 523 26 1352007 2 391 25 362 27 7532006 2 502 28 744 31 246
Sumber : Badan Pusat Statistik Provinsi JambiSource : BPS - Statistics of Jambi Province *) : Angka sementara / Preliminary figures
**) : Angka sangat sementara / Very Preliminary figures
Penggolongan IndustriClassification of Industry
Klasifikasi Lapangan Usaha Indonesia (KLUI)
Indonesian Standard of Industry Classification (ISIC)
(1)
21 618Jumlah/Total 2010 ** 1 838 19 780
350 Jambi Dalam Angka 2010

MANUFACTURING, MINING, AND ENERGY
Tabel 6.1.3 Jumlah Perusahaan dan Tenaga Kerja Produksi menurut GolonganTable Industri di Provinsi Jambi Tahun 2006-2010 Number of Establishment and Workers Engaged of Product by Classification of Manufacturing in Jambi Province, 2006-2010
Jumlah Perusahaan JumlahNumber of Laki-Laki Perempuan Total
Establishment Male Female
(2) (3) (4) (5)
15. Industri Makanan dan Minuman Manufacture of Food Products 36 5 613 2 209 7 822 and Beverages
17. Industri Tekstil / Manufacture of Textile 6 40 130 170
20. Industri Kayu, Barang dari Kayu (tidak termasuk Furniture) dan Barang-barang Anyaman 18 1 948 1 454 3 402 Manufacture of Wood & Products of Wood Except Furniture and Plaiting Materials
21. Industri Kertas dan Barang dari Kertas Manufacture of Paper and Paper Products; dan
2 2 033 60 2 09322. Industri Penerbitan, percetakan dan Reproduksi Media Rekaman Manufacture of Publication, Process of Printing and Reproduction of Recording Medium
25. Industri Barang dari Karet dan Plastik Manufacture of Rubber & 12 2 557 203 2 760 Plastics Products
Indonesian Standard of
Klasifikasi Lapangan Usaha Indonesia (KLUI)
Industry Classification (ISIC)
(1)
Tenaga Kerja ProduksiWorkers Engaged
Jambi In Figures 2010 351

PERINDUSTRIAN, PERTAMBANGAN, DAN ENERGI
Lanjutan Tabel / Continued Table 6.1.3
Klasifikasi Lapangan Usaha Jumlah Indonesia (KLUI) Perusahaan
Indonesian Standard of Number of JumlahIndustry Classification (ISIC) Establishment Laki-Laki Perempuan Total
Male Female(1) (2) (3) (4) (5)
24. Industri Kimia dan Barang-barang dari Kimia Manufacture of Chemicals and Chemical Products.
3 132 17 14926. Industri barang galian bukan logam Manufacture of Other Non Metallic Mineral Products
35. Industri Alat Angkutan, selain Kendaraan bermotor Roda Empat atau lebih 3 363 27 390 Manufacture of Other Transport Equipment
36. Industri Furniture dan Pengolahan Lainnya Manufacture of Furniture and 6 158 61 219 Manufacturing n.e.c.
2009* 86 12 750 4 295 17 0452008 84 14 482 6 553 21 0352007 93 15 100 3 580 18 6802006 105 15 874 8 223 24 097
Sumber : Badan Pusat Statistik Provinsi JambiSource : BPS - Statistics of Jambi Province *) : Angka sementara / Preliminary figures**) : Angka sangat sementara / Very Preliminary figures
86 12 844 17 005
Tenaga Kerja ProduksiWorkers Engaged
4 161Jumlah/Total 2010 **
352 Jambi Dalam Angka 2010
MANUFACTURING, MINING, AND ENERGY
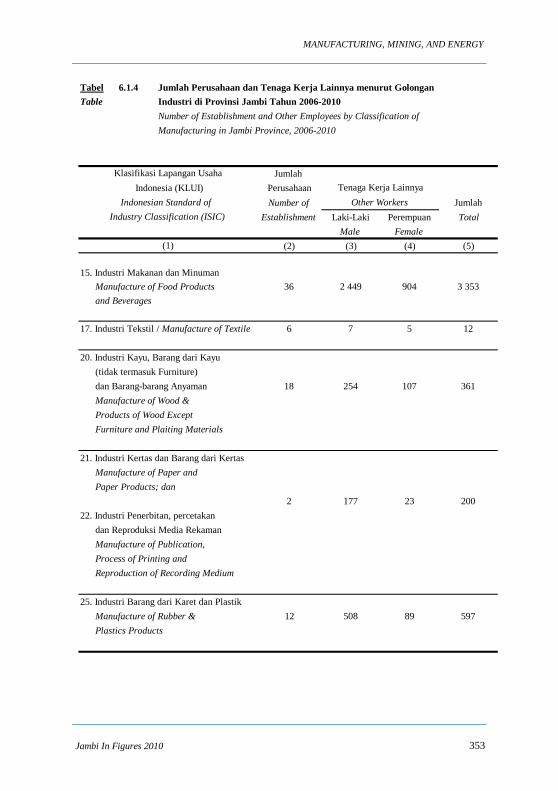
Tabel 6.1.4 Jumlah Perusahaan dan Tenaga Kerja Lainnya menurut GolonganTable Industri di Provinsi Jambi Tahun 2006-2010 Number of Establishment and Other Employees by Classification of Manufacturing in Jambi Province, 2006-2010
Jumlah PerusahaanNumber of Jumlah
Establishment Laki-Laki Perempuan TotalMale Female
(2) (3) (4) (5)
15. Industri Makanan dan Minuman Manufacture of Food Products 36 2 449 904 3 353 and Beverages
17. Industri Tekstil / Manufacture of Textile 6 7 5 12
20. Industri Kayu, Barang dari Kayu (tidak termasuk Furniture) dan Barang-barang Anyaman 18 254 107 361 Manufacture of Wood & Products of Wood Except Furniture and Plaiting Materials
21. Industri Kertas dan Barang dari Kertas Manufacture of Paper and Paper Products; dan
2 177 23 20022. Industri Penerbitan, percetakan dan Reproduksi Media Rekaman Manufacture of Publication, Process of Printing and Reproduction of Recording Medium
25. Industri Barang dari Karet dan Plastik Manufacture of Rubber & 12 508 89 597 Plastics Products
Klasifikasi Lapangan Usaha Indonesia (KLUI)
Indonesian Standard of Industry Classification (ISIC)
(1)
Tenaga Kerja LainnyaOther Workers
Jambi In Figures 2010 353

PERINDUSTRIAN, PERTAMBANGAN, DAN ENERGI
Lanjutan Tabel / Continued Table 6.1.4
Klasifikasi Lapangan Usaha Jumlah Indonesia (KLUI) Perusahaan
Indonesian Standard of Number of Jumlah Industry Classification (ISIC) Establishment Laki-Laki Perempuan Total
Male Female(1) (2) (3) (4) (5)
24. Industri Kimia dan Barang-barang dari Kimia Manufacture of Chemicals and Chemical Products.
3 32 7 3926. Industri barang galian bukan logam Manufacture of Other Non Metallic Mineral Products
35. Industri Alat Angkutan, selain Kendaraan bermotor Roda Empat 3 0 0 0 atau lebih / Manufacture of Other Transport Equipment
36. Industri Furniture dan Pengolahan Lainnya Manufacture of Furniture and 6 40 11 51 Manufacturing n.e.c.
2009* 86 3 672 1 165 4 8372008 84 3 402 1 698 5 1002007 93 7 395 1 678 9 0732006 105 4 843 2 306 7 149
Sumber : Badan Pusat Statistik Provinsi JambiSource : BPS - Statistics of Jambi Province *) : Angka sementara / Preliminary figures**) : Angka sangat sementara / Very Preliminary figures
Tenaga Kerja LainnyaOther Workers
4 613Jumlah/Total 2010 ** 86 3 467 1 146
354 Jambi Dalam Angka 2010

MANUFACTURING, MINING, AND ENERGY
Tabel 6.1.5 Jumlah Perusahaan Industri di Provinsi Jambi Tahun 1986 – 2010Table Number of Manufacturing Industry in Jambi Province, 1986 – 2010
Tahun Jumlah Perusahaan Investasi Tenaga Kerja Nilai ProduksiYear Number of Investment (orang) (Production Value)
Establishments (Rp.000) Labor Force (Rp.000)(person)
(1) (2) (3) (4) (5)
1986 5 889 124 526 045 26 395 174 043 4831987 6 233 141 189 996 30 238 270 629 0701988 6 683 221 633 286 33 861 304 032 5051989 7 047 357 723 394 35 860 394 213 6431990 7 345 719 342 975 37 693 482 012 5051991 7 592 754 104 364 42 603 501 117 0221992 7 940 1 652 165 206 50 336 660 896 0001993 8 467 1 911 358 000 52 528 736 135 0001994 8 835 2 185 989 000 54 528 857 320 0001995 8 968 2 222 687 671 56 356 1 817 588 9101996 9 100 3 325 614 790 57 420 1 818 257 9101997 6 869 8 204 490 874 52 766 1 279 845 6891998 7 429 8 342 228 946 52 827 1 280 316 7621999 16 934 9 729 610 53 867 1 622 342 0002000 17 928 9 829 610 55 256 1 947 315 0002001 19 348 9 967 310 58 019 2 044 680 7502002 20 070 11 962 312 58 599 2 321 980 4732003 20 698 11 862 312 58 642 2 324 861 0002004 20 894 11 891 468 58 682 2 364 821 0002005 21 151 11 957 125 64 182 2 455 866 6092006 21 534 12 435 410 65 530 2 607 147 9922007 22 113 12 886 815 67 181 2 684 085 8582008 22 476 13 050 478 68 766 2 750 355 1122009 23 554 13 676 900 71 264 2 882 372 1632010 24 685 14 333 392 74 684 3 020 726 030
Sumber : Dinas Perindustrian dan Perdagangan Provinsi JambiSource : Industrial and Trading Service of Jambi Province
Jambi In Figures 2010 355

PERINDUSTRIAN, PERTAMBANGAN, DAN ENERGI
Tabel 6.1.6 Jumlah Perusahaan Industri Menurut Kabupaten/Kota Tahun 2006-2010Table Number of Manufacturing Industry by Regency/Municipality, 2006-2010
Industri Hasil Industri Logam,Pertanian & Kehutanan Aneka Industri Mesin, Kimia Jumlah
Manufacturing of Miscellaneous Manufacturing of Total Agriculture Manufacturing Metal, Machine, and Forestry Chemistry
(2) (3) (4) (5)
1. Kerinci 1 - - 1
2. Merangin 3 - - 3
3. Sarolangun 1 1 - 2
4. Batang Hari 3 4 - 7
5. Muaro Jambi 7 11 - 18
6. Tanjab Timur 2 - 1 3
7. Tanjab Barat 8 4 - 12
8. Tebo 3 2 - 5
9. Bungo 8 1 - 9
10. Kota Jambi 12 14 - 26
11. Kota Sungai Penuh - - - -
50 35 1 8645 38 1 8449 43 1 9349 55 1 105
Sumber : BPS Provinsi Jambi Source : BPS - Statistics of Jambi Province *) : Angka sementara / Preliminary figures**) : Angka sangat sementara / Very Preliminary figures
1
Regency/Municipality
(1)
2008
2006
Kabupaten/Kota
2007
Jumlah/Total 2010 **
2009*
48 37 86
356 Jambi Dalam Angka 2010
MANUFACTURING, MINING, AND ENERGY
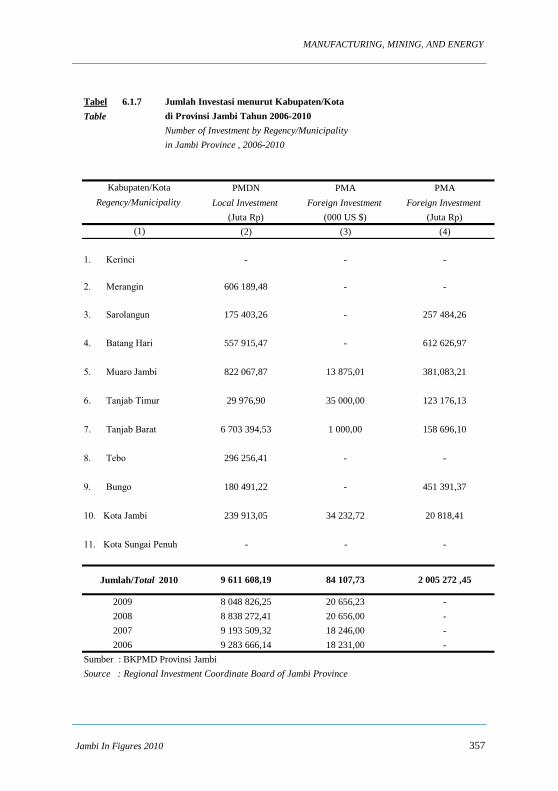
Tabel 6.1.7 Jumlah Investasi menurut Kabupaten/KotaTable di Provinsi Jambi Tahun 2006-2010
Number of Investment by Regency/Municipalityin Jambi Province , 2006-2010
PMDN PMA PMALocal Investment Foreign Investment Foreign Investment
(Juta Rp) (000 US $) (Juta Rp)(2) (3) (4)
1. Kerinci - - -
2. Merangin 606 189,48 - -
3. Sarolangun 175 403,26 - 257 484,26
4. Batang Hari 557 915,47 - 612 626,97
5. Muaro Jambi 822 067,87 13 875,01 381,083,21
6. Tanjab Timur 29 976,90 35 000,00 123 176,13
7. Tanjab Barat 6 703 394,53 1 000,00 158 696,10
8. Tebo 296 256,41 - -
9. Bungo 180 491,22 - 451 391,37
10. Kota Jambi 239 913,05 34 232,72 20 818,41
11. Kota Sungai Penuh - - -
2009 8 048 826,25 20 656,23 -2008 8 838 272,41 20 656,00 -2007 9 193 509,32 18 246,00 -2006 9 283 666,14 18 231,00 -
Sumber : BKPMD Provinsi JambiSource : Regional Investment Coordinate Board of Jambi Province
Kabupaten/KotaRegency/Municipality
(1)
Jumlah/Total 2010 9 611 608,19 84 107,73 2 005 272 ,45
Jambi In Figures 2010 357

PERINDUSTRIAN, PERTAMBANGAN, DAN ENERGI
Tabel 6.1.8 Jumlah Perusahaan Penanam Modal Dalam Negeri (PMDN),Table Realisasi Investasi dan Tenaga Kerja Menurut Kabupaten/Kota
di Provinsi Jambi Tahun 2006-2010Number of Domestic Investor, Realization, and Labourby Regency/Municipality in Jambi Province, 2006-2010
Jumlah Realisasi Perusahaan InvestasiNumber of Invesment Indonesia Asing Jumlah
Establishment Realization (Rp Juta) Indonesian Foreign Total(2) (3) (4) (5) (6)
1. Kerinci - - - - -
2. Merangin 3 606 189,48 2 948 - 2 948
3. Sarolangun 3 175 403,26 204 - 204
4. Batang Hari 10 557 915,47 1 761 1 1 762
5. Muaro Jambi 10 822 067,87 5 857 3 5 860
6. Tanjab Timur 1 29 976,90 204 - 204
7. Tanjab Barat 10 6 703 394,53 8 193 32 8 225
8. Tebo 4 296 256,41 769 - 769
9. Bungo 2 180 491,22 893 2 895
10. Kota Jambi 8 239 913,05 1 420 - 1 420
11. Kota Sungai Penuh - - - - -
2009 47 8 048 826,25 22 394 39 22 4432008 126 8 838 272,41 28 546 34 28 5802007 124 9 193 509,32 39 576 23 39 5992006 124 9 144 985,14 39 576 23 39 599
Sumber : BKPMD Provinsi JambiSource : Regional Investment Coordinate Board of Jambi Province
Regency/Municipality
(1)
Jumlah/Total 2010
Kabupaten/Kota
9 611 608,1951 22 249 38
Tenaga Kerja/Labour
22 287
358 Jambi Dalam Angka 2010

MANUFACTURING, MINING, AND ENERGY
Tabel 6.1.9 Jumlah Perusahaan Penanaman Modal Asing (PMA), Realisasi Investasi Table dan Tenaga Kerja menurut Kabupaten/Kota di Provinsi Jambi
Tahun 2006-2010 (000 US$)Number of Foreign Investor, Realization, and Labour by Regency/Municipality in Jambi Province, 2006-2010 (000 US$)
Jumlah Realisasi Perusahaan InvestasiNumber of Realization Indonesia Asing Jumlah
Establishment (000 US$) Indonesian Foreign Total(2) (3) (4) (5) (6)
1. Kerinci - - - - -
2. Merangin - - - - -
3. Sarolangun - - - - -
4. Batang Hari - - - - -
5. Muaro Jambi 3 13 875,01 201 2 203
6. Tanjab Timur - 35 000 - - -
7. Tanjab Barat - 1 000 - - -
8. Tebo - - - - -
9. Bungo - - - - -
10. Kota Jambi 4 34 232,72 434 434
11. Kota Sungai Penuh - - - - -
2009 6 18 525,01 247 - 2472008 58 5 370,23 955 2 3632007 40 78 425,00 1 815 9 1 8242006 40 78 425,00 1 815 9 1 824
Sumber : BKPMD Provinsi JambiSource : Regional Investment Coordinate Board of Jambi Province
7 84 107,73 635 2
Regency/Municipality
(1)
Jumlah/Total 2010
Kabupaten/Kota
637
Tenaga Kerja/Labour
Jambi In Figures 2010 359
PERINDUSTRIAN, PERTAMBANGAN, DAN ENERGI
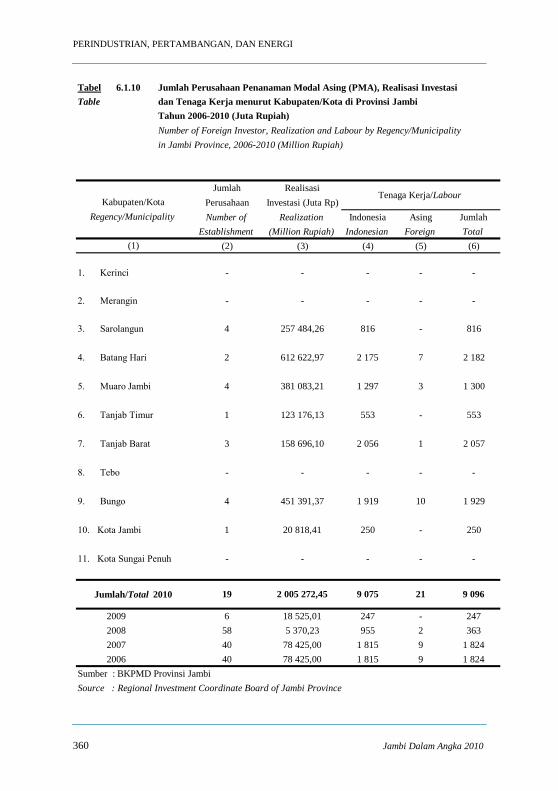
Tabel 6.1.10 Jumlah Perusahaan Penanaman Modal Asing (PMA), Realisasi Investasi Table dan Tenaga Kerja menurut Kabupaten/Kota di Provinsi Jambi
Tahun 2006-2010 (Juta Rupiah)Number of Foreign Investor, Realization and Labour by Regency/Municipality in Jambi Province, 2006-2010 (Million Rupiah)
Jumlah Realisasi Perusahaan Investasi (Juta Rp)Number of Realization Indonesia Asing Jumlah
Establishment (Million Rupiah) Indonesian Foreign Total(2) (3) (4) (5) (6)
1. Kerinci - - - - -
2. Merangin - - - - -
3. Sarolangun 4 257 484,26 816 - 816
4. Batang Hari 2 612 622,97 2 175 7 2 182
5. Muaro Jambi 4 381 083,21 1 297 3 1 300
6. Tanjab Timur 1 123 176,13 553 - 553
7. Tanjab Barat 3 158 696,10 2 056 1 2 057
8. Tebo - - - - -
9. Bungo 4 451 391,37 1 919 10 1 929
10. Kota Jambi 1 20 818,41 250 - 250
11. Kota Sungai Penuh - - - - -
2009 6 18 525,01 247 - 2472008 58 5 370,23 955 2 3632007 40 78 425,00 1 815 9 1 8242006 40 78 425,00 1 815 9 1 824
Sumber : BKPMD Provinsi JambiSource : Regional Investment Coordinate Board of Jambi Province
Regency/Municipality
(1)
Tenaga Kerja/Labour
19 2 005 272,45 9 075 21 9 096Jumlah/Total 2010
Kabupaten/Kota
360 Jambi Dalam Angka 2010
MANUFACTURING, MINING, AND ENERGY
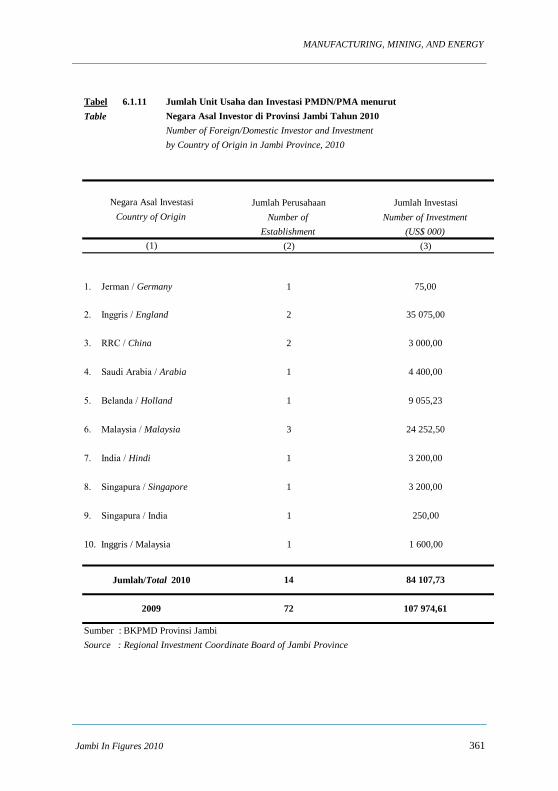
Tabel 6.1.11 Jumlah Unit Usaha dan Investasi PMDN/PMA menurut Table Negara Asal Investor di Provinsi Jambi Tahun 2010
Number of Foreign/Domestic Investor and Investmentby Country of Origin in Jambi Province, 2010
Jumlah Perusahaan Jumlah InvestasiNumber of Number of Investment
Establishment (US$ 000)(2) (3)
1. Jerman / Germany 1 75,00
2. Inggris / England 2 35 075,00
3. RRC / China 2 3 000,00
4. Saudi Arabia / Arabia 1 4 400,00
5. Belanda / Holland 1 9 055,23
6. Malaysia / Malaysia 3 24 252,50
7. India / Hindi 1 3 200,00
8. Singapura / Singapore 1 3 200,00
9. Singapura / India 1 250,00
10. Inggris / Malaysia 1 1 600,00
Sumber : BKPMD Provinsi JambiSource : Regional Investment Coordinate Board of Jambi Province
(1)
Jumlah/Total 2010
Negara Asal InvestasiCountry of Origin
2009 107 974,6172
14 84 107,73
Jambi In Figures 2010 361

PERINDUSTRIAN, PERTAMBANGAN, DAN ENERGI
Tabel 6.1.12 Jumlah Perusahaan Crumb Rubber di Provinsi Jambi Table Tahun 1986 - 2010
Number of Crumb Rubber Establishments in Jambi Province, 1986-2010
TahunYear Aktif Non Aktif Jumlah Aktif Non Aktif Jumlah
Active Non Active Total Active Non Active Total(1) (2) (3) (4) (5)
I. Pelita IV1986 5 1 6 87 600 18 000 105 6001987 5 1 6 87 600 18 000 106 6001988 5 1 6 87 600 18 000 107 600
II. Pelita V1989 5 1 6 87 000 18 000 105 6001990 5 1 6 105 600 - 105 6001991 5 1 6 105 600 - 105 6001992 5 1 6 87 600 - 105 6001993 6 2 8 116 200 18 000 116 200
III. Pelita I PJP II1994 6 2 8 116 200 - 116 2001995 6 2 8 116 200 - 116 2001996 7 2 8 116 200 - 116 2001997 7 3 10 94 200 - 94 2001998 7 3 10 94 200 - 94 2001999 7 3 10 100 200 - 100 2002000 7 3 10 100 200 - 100 2002001 7 3 10 100 200 - 100 2002002 7 3 10 100 200 - 100 2002003 7 3 10 100 200 - 100 2002004 7 3 10 180 600 - 180 6002005 8 3 11 204 302 - 204 3022006 8 3 11 204 302 - 204 3022007 8 3 11 252 300 - 252 3002008 8 3 11 252 300 - 252 3002009 9 2 11 252 300 - 252 3002010 9 0 9 234 180 - 234 180
Sumber : Dinas Perindustrian dan Perdagangan Provinsi Jambi Source : Industrial and Trading Service of Jambi Province
Perusahaan Kapasitas (Ton)Establishment Capacity (Ton)
362 Jambi Dalam Angka 2010

MANUFACTURING, MINING, AND ENERGY
Tabel 6.1.13 Kapasitas Produksi Pabrik Crumb RubberTable di Provinsi Jambi Tahun 2010 ( Ton/ Tahun)
Production Capacity of Crumb Rubber Factoryin Jambi Province, 2010 (Ton/Year)
Jumlah PerusahaanNumber of Izin Terpasang Terpakai
Establishment License Attached Used up
(2) (3) (4) (5)
1. Kerinci - - - -
2. Merangin - - - -
3. Sarolangun 1 15 000 - -
4. Batang Hari 1 72 000 - -
5. Muaro Jambi - - - -
6. Tanjab Timur - - - -
7. Tanjab Barat - - - -
8. Tebo - - - -
9. Bungo 2 84 000 - -
10. Kota Jambi 5 63 180 - -
11. Kota Sungai Penuh - - - -
Sumber : Dinas Perindustrian dan Perdagangan Provinsi Jambi Source : Industrial and Trading Service of Jambi Province
234 180 -
11 252 300 252 300 252 300
-
2009
Kapasitas / Capacity
9
Regency/Municipality
(1)
Kabupaten/Kota
Jumlah/Total 2010
Jambi In Figures 2010 363

PERINDUSTRIAN, PERTAMBANGAN, DAN ENERGI
Tabel 6.1.14 Jumlah Perusahaan Vulkanisir Ban di Provinsi Jambi Tahun 2010Table Number of Retread Tires in Jambi Province, 2010
Nilai ProduksiJumlah Unit Usaha Kapasitas (ton) (Ribu Rp)
Unit Capacity (ton) Value of Production(Thousand Rp)
(2) (3) (4)
1. Kerinci 2 19 800 2 970 000
2. Merangin 1 3 600 125 690
3. Sarolangun - - -
4. Batang Hari 1 250 6 250
5. Muaro Jambi - - -
6. Tanjab Timur - - -
7. Tanjab Barat - - -
8. Tebo - - -
9. Bungo 1 1 080 11 200
10. Kota Jambi 3 12 000 22 500
11. Kota Sungai Penuh - - -
7 36 480 3 529 390
8
Kabupaten/KotaRegency/Municipality
(1)
Jumlah/Total 2010
2009
36 730 3 135 640
364 Jambi Dalam Angka 2010

MANUFACTURING, MINING, AND ENERGY
Lanjutan Tabel / Continued Table 6.1.14
Nilai Bahan Baku (Ribu Rp)
InvestasiKabupaten/Kota (Ribu Rp) Tenaga Kerja (Ribu Rp)
Regency/Municipality Value of Raw Material Labour Investment(Thousand Rp) (Thousand Rp)
(1) (2) (3) (4)
1. Kerinci 433 350 9 140 000
2. Merangin 25 000 2 105 300
3. Sarolangun - - -
4. Batang Hari 2 500 4 12 000
5. Muaro Jambi - - -
6. Tanjab Timur - - -
7. Tanjab Barat - - -
8. Tebo - - -
9. Bungo 7 200 4 25 000
10. Kota Jambi 225 550 18 104 450
11. Kota Sungai Penuh - - -
Sumber : Dinas Perindustrian dan Perdagangan Provinsi Jambi Source : Industrial and Trading Service of Jambi Province
693 600 37 246 750
2009
Jumlah/Total 2010
691 100 33 374 750
Jambi In Figures 2010 365

PERINDUSTRIAN, PERTAMBANGAN, DAN ENERGI
Tabel 6.1.15 Jumlah Perusahaan yang Wajib dan Telah Memiliki Table Dokumen AMDAL di Provinsi Jambi Tahun 2006-2010
Number of Establishments Already Have a Document AMDAL in Jambi Province, 2006-2010
Wajib RealisasiObligation Realization
(2) (3)
1. Perkebunan / Plantation 93 85
2. HPH/HTI 14 12 Forest Consessions
3. Pertambangan/Migas/Listrik 52 26 Mining/Electricity
4. Industri / Manufacturing 5 4
5. Pertanian / Agriculture 1 1
6. Perhubungan 7 5 Transportation
7. Irigasi PU / State Irrigation 2 2
2009 143 1262008 116 1092007 121 1162006 121 91
Sumber : Badan Lingkungan Hidup Daerah Provinsi JambiSource : Environmental Board of Jambi Province
Jenis Kegiatan Kind of Activity
Jumlah/Total 2010
(1)
174 135
366 Jambi Dalam Angka 2010
MANUFACTURING, MINING, AND ENERGY
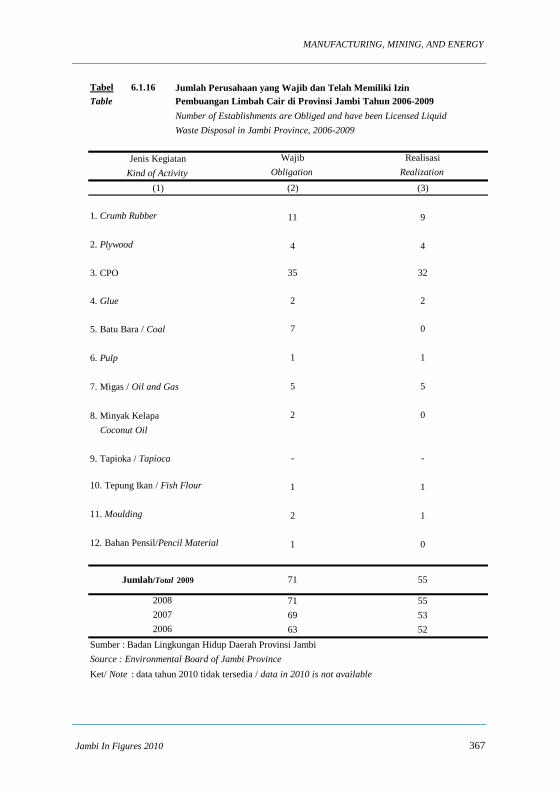
Tabel 6.1.16 Jumlah Perusahaan yang Wajib dan Telah Memiliki Izin Table Pembuangan Limbah Cair di Provinsi Jambi Tahun 2006-2009
Number of Establishments are Obliged and have been Licensed LiquidWaste Disposal in Jambi Province, 2006-2009
Wajib RealisasiObligation Realization
(2) (3)
1. Crumb Rubber 11 9
2. Plywood 4 4
3. CPO 35 32
4. Glue 2 2
5. Batu Bara / Coal 7 0
6. Pulp 1 1
7. Migas / Oil and Gas 5 5
8. Minyak Kelapa 2 0 Coconut Oil
9. Tapioka / Tapioca - -
10. Tepung Ikan / Fish Flour 1 1
11. Moulding 2 1
12. Bahan Pensil/Pencil Material 1 0
2008 71 552007 69 532006 63 52
Sumber : Badan Lingkungan Hidup Daerah Provinsi JambiSource : Environmental Board of Jambi ProvinceKet/ Note : data tahun 2010 tidak tersedia / data in 2010 is not available
71 55
(1)
Jumlah/Total 2009
Jenis Kegiatan Kind of Activity
Jambi In Figures 2010 367
PERINDUSTRIAN, PERTAMBANGAN, DAN ENERGI
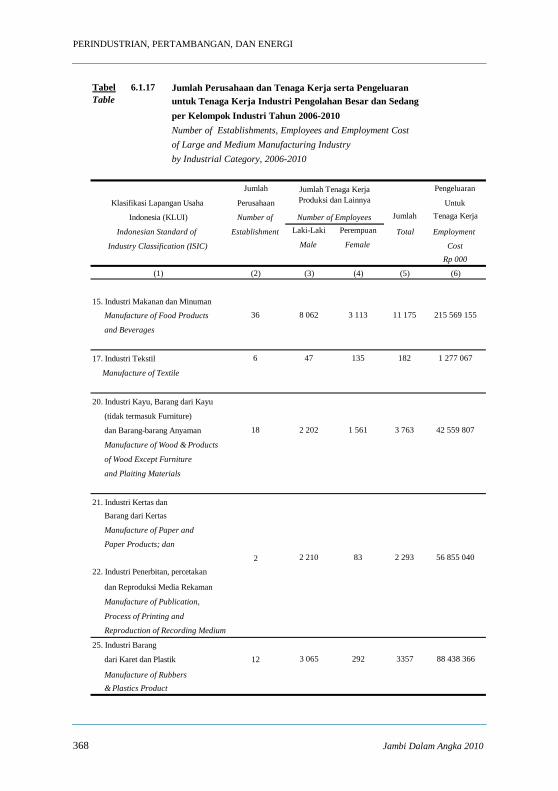
Tabel 6.1.17 Jumlah Perusahaan dan Tenaga Kerja serta Pengeluaran Table untuk Tenaga Kerja Industri Pengolahan Besar dan Sedang per Kelompok Industri Tahun 2006-2010 Number of Establishments, Employees and Employment Cost of Large and Medium Manufacturing Industry by Industrial Category, 2006-2010
Jumlah Pengeluaran
Perusahaan Untuk
Number of Jumlah Tenaga Kerja
Establishment Laki-Laki Perempuan Total Employment Male Female Cost
Rp 000
(2) (3) (4) (5) (6)
15. Industri Makanan dan Minuman
Manufacture of Food Products 36 8 062 3 113 11 175 215 569 155
and Beverages
17. Industri Tekstil 6 47 135 182 1 277 067
Manufacture of Textile
20. Industri Kayu, Barang dari Kayu
(tidak termasuk Furniture)
dan Barang-barang Anyaman 18 2 202 1 561 3 763 42 559 807
Manufacture of Wood & Products
of Wood Except Furniture
and Plaiting Materials
21. Industri Kertas dan Barang dari Kertas
Manufacture of Paper and
Paper Products; dan
2 2 210 83 2 293 56 855 040
22. Industri Penerbitan, percetakan
dan Reproduksi Media Rekaman
Manufacture of Publication,
Process of Printing and
Reproduction of Recording Medium
25. Industri Barang
dari Karet dan Plastik 12 3 065 292 3357 88 438 366
Manufacture of Rubbers & Plastics Product
Number of Employees
Jumlah Tenaga Kerja Produksi dan Lainnya
Indonesian Standard of
Industry Classification (ISIC)
Klasifikasi Lapangan Usaha
Indonesia (KLUI)
(1)
368 Jambi Dalam Angka 2010
MANUFACTURING, MINING, AND ENERGY
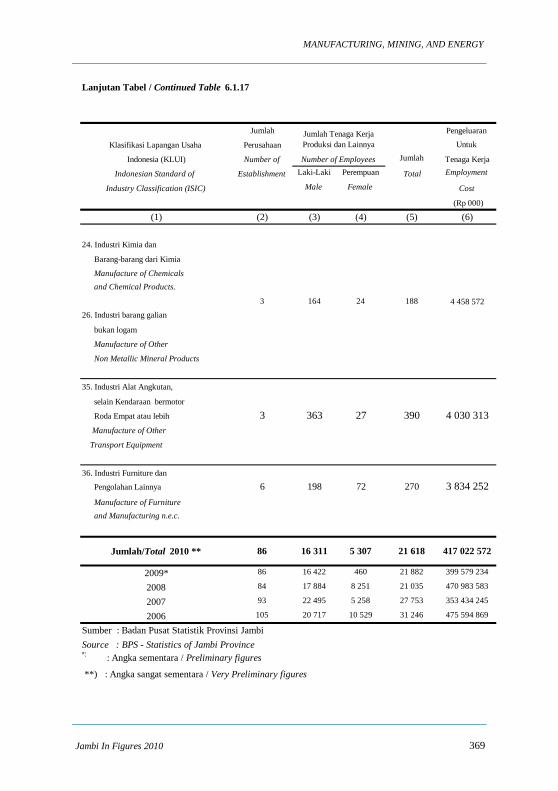
Lanjutan Tabel / Continued Table 6.1.17
Jumlah Pengeluaran
Klasifikasi Lapangan Usaha Perusahaan Untuk
Indonesia (KLUI) Number of Jumlah Tenaga Kerja
Indonesian Standard of Establishment Laki-Laki Perempuan Total Employment
Industry Classification (ISIC) Male Female Cost
(Rp 000)
(1) (2) (3) (4) (5) (6)
24. Industri Kimia dan
Barang-barang dari Kimia
Manufacture of Chemicals and Chemical Products.
3 164 24 188 4 458 57226. Industri barang galian
bukan logam
Manufacture of Other
Non Metallic Mineral Products
35. Industri Alat Angkutan,
selain Kendaraan bermotor
Roda Empat atau lebih 3 363 27 390 4 030 313 Manufacture of Other
Transport Equipment
36. Industri Furniture dan
Pengolahan Lainnya 6 198 72 270 3 834 252 Manufacture of Furniture and Manufacturing n.e.c.
2009* 86 16 422 460 21 882 399 579 234
2008 84 17 884 8 251 21 035 470 983 583
2007 93 22 495 5 258 27 753 353 434 245
2006 105 20 717 10 529 31 246 475 594 869
Sumber : Badan Pusat Statistik Provinsi JambiSource : BPS - Statistics of Jambi Province *) : Angka sementara / Preliminary figures
**) : Angka sangat sementara / Very Preliminary figures
21 618
Number of Employees
16 311 5 307
Jumlah Tenaga Kerja Produksi dan Lainnya
86Jumlah/Total 2010 ** 417 022 572
Jambi In Figures 2010 369
PERINDUSTRIAN, PERTAMBANGAN, DAN ENERGI
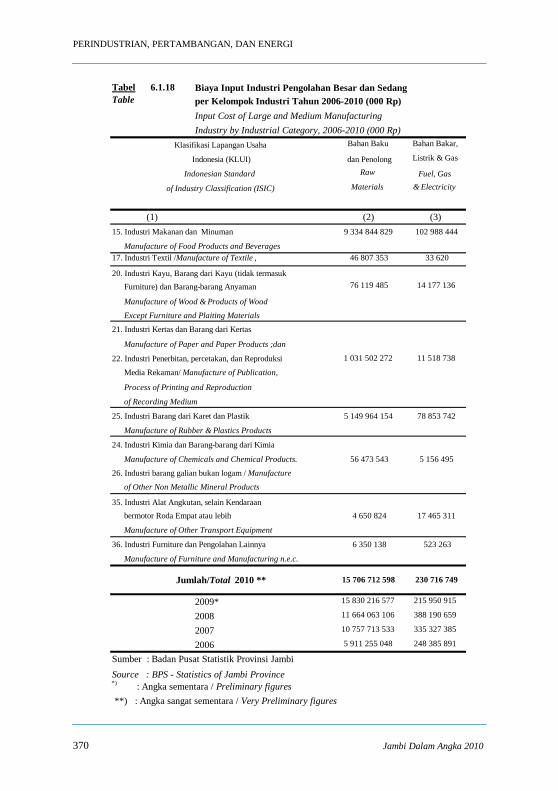
Tabel 6.1.18 Biaya Input Industri Pengolahan Besar dan SedangTable per Kelompok Industri Tahun 2006-2010 (000 Rp) Input Cost of Large and Medium Manufacturing Industry by Industrial Category, 2006-2010 (000 Rp)
Bahan Baku Bahan Bakar,
dan Penolong Listrik & Gas
Raw Fuel, GasMaterials & Electricity
(1) (2) (3)15. Industri Makanan dan Minuman 9 334 844 829 102 988 444
Manufacture of Food Products and Beverages17. Industri Textil /Manufacture of Textile , 46 807 353 33 620
20. Industri Kayu, Barang dari Kayu (tidak termasuk Furniture) dan Barang-barang Anyaman 76 119 485 14 177 136
Manufacture of Wood & Products of Wood
Except Furniture and Plaiting Materials
21. Industri Kertas dan Barang dari Kertas
Manufacture of Paper and Paper Products ;dan
22. Industri Penerbitan, percetakan, dan Reproduksi 1 031 502 272 11 518 738
Media Rekaman/ Manufacture of Publication,
Process of Printing and Reproduction
of Recording Medium
25. Industri Barang dari Karet dan Plastik 5 149 964 154 78 853 742
Manufacture of Rubber & Plastics Products
24. Industri Kimia dan Barang-barang dari Kimia
Manufacture of Chemicals and Chemical Products. 56 473 543 5 156 495
26. Industri barang galian bukan logam / Manufacture
of Other Non Metallic Mineral Products
35. Industri Alat Angkutan, selain Kendaraan bermotor Roda Empat atau lebih 4 650 824 17 465 311
Manufacture of Other Transport Equipment
36. Industri Furniture dan Pengolahan Lainnya 6 350 138 523 263
Manufacture of Furniture and Manufacturing n.e.c.
2009* 15 830 216 577 215 950 915
2008 11 664 063 106 388 190 659
2007 10 757 713 533 335 327 385
2006 5 911 255 048 248 385 891
Sumber : Badan Pusat Statistik Provinsi JambiSource : BPS - Statistics of Jambi Province *) : Angka sementara / Preliminary figures **) : Angka sangat sementara / Very Preliminary figures
230 716 749
Indonesia (KLUI)
15 706 712 598
Klasifikasi Lapangan Usaha
of Industry Classification (ISIC)
Indonesian Standard
Jumlah/Total 2010 **
370 Jambi Dalam Angka 2010

MANUFACTURING, MINING, AND ENERGY
Lanjutan Tabel / Continued Table 6.1.18
Sewa Gedung, Mesin,
Klasifikasi Lapangan Usaha Indonesia (KLUI) Pengeluaran utk Alat-alat Listrik,
Indonesian Standard Jasa Industri dan Lainnya
of Industry Classification (ISIC) Expenditure for Rent of Building,
Service Industry Machinery, Equipment
Another Materials
(1) (4) (5)15. Industri Makanan dan Minuman 6 354 612 2 345 945
Manufacture of Food Products and Beverages17. Industri Textil /Manufacture of Textile , 2 987 0
20. Industri Kayu, Barang dari Kayu (tidak termasuk Furniture) dan Barang-barang Anyaman 10 892 181 636
Manufacture of Wood & Products of Wood
Except Furniture and Plaiting Materials
21. Industri Kertas dan Barang dari Kertas
Manufacture of Paper and Paper Products ;dan
22. Industri Penerbitan, percetakan, dan Reproduksi 4 200 10 000
Media Rekaman/ Manufacture of Publication,
Process of Printing and Reproduction
of Recording Medium
25. Industri Barang dari Karet dan Plastik 2 536 900 144 616 493
Manufacture of Rubber & Plastics Products
24. Industri Kimia dan Barang-barang dari Kimia
Manufacture of Chemicals and Chemical Products. 0 0
26. Industri barang galian bukan logam / Manufacture
of Other Non Metallic Mineral Products
35. Industri Alat Angkutan, selain Kendaraan bermotor Roda Empat atau lebih 16 032 0
Manufacture of Other Transport Equipment36. Industri Furniture dan Pengolahan Lainnya 0 47 912
Manufacture of Furniture and Manufacturing n.e.c.
2009* 8 030 323 138 032 597
2008 6 694 150 2 323 430
2007 26 677 422 23 050 581
2006 16 822 503 588 222
Sumber : Badan Pusat Statistik Provinsi JambiSource : BPS - Statistics of Jambi Province *) : Angka sementara / Preliminary figures **) : Angka sangat sementara / Very Preliminary figures
8 925 623 147 201 986Jumlah/Total 2010 **
Jambi In Figures 2010 371
PERINDUSTRIAN, PERTAMBANGAN, DAN ENERGI
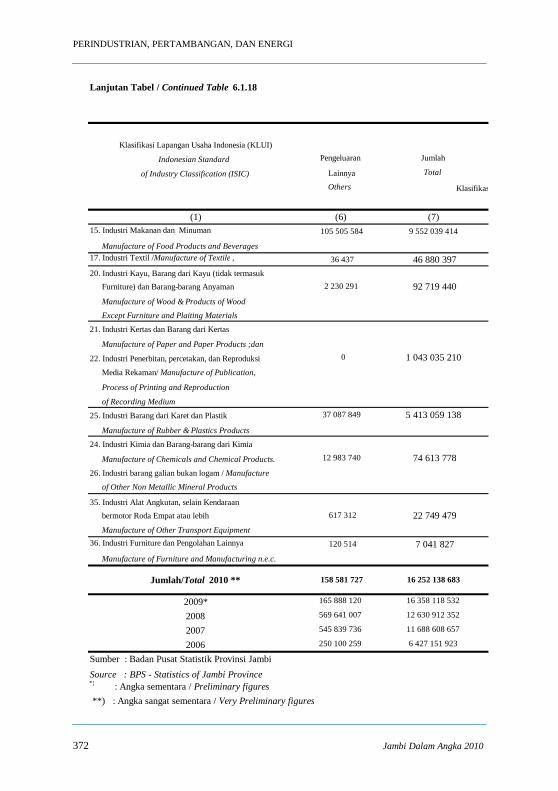
Lanjutan Tabel / Continued Table 6.1.18
Klasifikasi Lapangan Usaha Indonesia (KLUI)
Indonesian Standard Pengeluaran Jumlah
of Industry Classification (ISIC) Lainnya Total
Others Klasifikasi Lapangan Usaha Indonesia (KLUI)
(1) (6) (7)15. Industri Makanan dan Minuman 105 505 584 9 552 039 414
Manufacture of Food Products and Beverages17. Industri Textil /Manufacture of Textile , 36 437 46 880 39720. Industri Kayu, Barang dari Kayu (tidak termasuk Furniture) dan Barang-barang Anyaman 2 230 291 92 719 440 Manufacture of Wood & Products of Wood
Except Furniture and Plaiting Materials
21. Industri Kertas dan Barang dari Kertas
Manufacture of Paper and Paper Products ;dan
22. Industri Penerbitan, percetakan, dan Reproduksi 0 1 043 035 210 Media Rekaman/ Manufacture of Publication,
Process of Printing and Reproduction
of Recording Medium
25. Industri Barang dari Karet dan Plastik 37 087 849 5 413 059 138 Manufacture of Rubber & Plastics Products
24. Industri Kimia dan Barang-barang dari Kimia
Manufacture of Chemicals and Chemical Products. 12 983 740 74 613 77826. Industri barang galian bukan logam / Manufacture
of Other Non Metallic Mineral Products
35. Industri Alat Angkutan, selain Kendaraan bermotor Roda Empat atau lebih 617 312 22 749 479 Manufacture of Other Transport Equipment36. Industri Furniture dan Pengolahan Lainnya 120 514 7 041 827 Manufacture of Furniture and Manufacturing n.e.c.
2009* 165 888 120 16 358 118 532
2008 569 641 007 12 630 912 352
2007 545 839 736 11 688 608 657
2006 250 100 259 6 427 151 923
Sumber : Badan Pusat Statistik Provinsi JambiSource : BPS - Statistics of Jambi Province *) : Angka sementara / Preliminary figures **) : Angka sangat sementara / Very Preliminary figures
Jumlah/Total 2010 ** 158 581 727 16 252 138 683
372 Jambi Dalam Angka 2010
MANUFACTURING, MINING, AND ENERGY
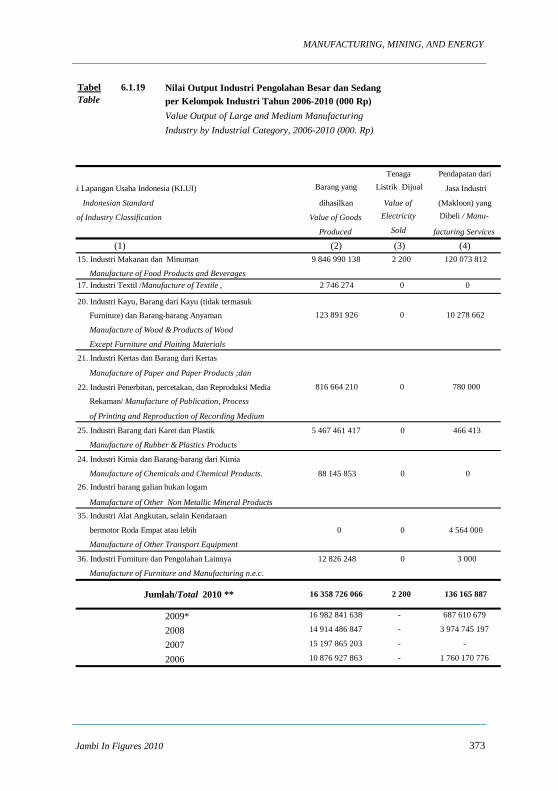
Tabel 6.1.19 Nilai Output Industri Pengolahan Besar dan SedangTable per Kelompok Industri Tahun 2006-2010 (000 Rp) Value Output of Large and Medium Manufacturing Industry by Industrial Category, 2006-2010 (000. Rp)
Tenaga Pendapatan dari
Klasifikasi Lapangan Usaha Indonesia (KLUI) Barang yang Listrik Dijual Jasa Industri
Indonesian Standard dihasilkan Value of (Makloon) yang
of Industry Classification Value of Goods Electricity Dibeli / Manu-
Produced Sold facturing Services
(1) (2) (3) (4)15. Industri Makanan dan Minuman 9 846 990 138 2 200 120 073 812
Manufacture of Food Products and Beverages17. Industri Textil /Manufacture of Textile , 2 746 274 0 0
20. Industri Kayu, Barang dari Kayu (tidak termasuk
Furniture) dan Barang-barang Anyaman 123 891 926 0 10 278 662
Manufacture of Wood & Products of Wood
Except Furniture and Plaiting Materials
21. Industri Kertas dan Barang dari Kertas
Manufacture of Paper and Paper Products ;dan
22. Industri Penerbitan, percetakan, dan Reproduksi Media 816 664 210 0 780 000
Rekaman/ Manufacture of Publication, Process
of Printing and Reproduction of Recording Medium
25. Industri Barang dari Karet dan Plastik 5 467 461 417 0 466 413
Manufacture of Rubber & Plastics Products
24. Industri Kimia dan Barang-barang dari Kimia
Manufacture of Chemicals and Chemical Products. 88 145 853 0 026. Industri barang galian bukan logam
Manufacture of Other Non Metallic Mineral Products35. Industri Alat Angkutan, selain Kendaraan
bermotor Roda Empat atau lebih 0 0 4 564 000
Manufacture of Other Transport Equipment
36. Industri Furniture dan Pengolahan Lainnya 12 826 248 0 3 000
Manufacture of Furniture and Manufacturing n.e.c.
2009* 16 982 841 638 - 687 610 679
2008 14 914 486 847 - 3 974 745 197
2007 15 197 865 203 - -
2006 10 876 927 863 - 1 760 170 776
Jumlah/Total 2010 ** 2 200 136 165 88716 358 726 066
Jambi In Figures 2010 373

PERINDUSTRIAN, PERTAMBANGAN, DAN ENERGI
Lanjutan Tabel / Continued Table 6.1.19
Selisih nilai Penerimaan lain
Klasifikasi Lapangan Usaha Indonesia (KLUI) stok barang dari jasa
Indonesian Standard setengah jadi non industri Jumlah
of Industry Classification Increase in Receipts from Total
stock of semi non industrial
finished goods service rendered
(1) (5) (6) (7)15. Industri Makanan dan Minuman 3 048 770 35 596 576 10 005 711 496
Manufacture of Food Products and Beverages17. Industri Textil /Manufacture of Textile , - 9 209 0 2 737 06520. Industri Kayu, Barang dari Kayu (tidak termasuk
Furniture) dan Barang-barang Anyaman 6 689 267 900 000 141 759 855 Manufacture of Wood & Products of Wood
Except Furniture and Plaiting Materials 21. Industri Kertas dan Barang dari Kertas
Manufacture of Paper and Paper Products;dan
22. Industri Penerbitan, percetakan, dan Reproduksi 0 0 817 444 210
Media Rekaman/Manufacture of Publication,
Process of Printing and Reproduction
of Recording Medium
25. Industri Barang dari Karet dan Plastik 29 669 393 628 276 576 6 125 873 799
Manufacture of Rubber & Plastics Products
24. Industri Kimia dan Barang-barang dari Kimia
Manufacture of Chemicals and Chemical Products. 0 0 88 145 853
26. Industri barang galian bukan logam/Manufacture
of Other Non Metallic Mineral Products35. Industri Alat Angkutan, selain Kendaraan
bermotor Roda Empat atau lebih 0 43 501 314 48 065 314 Manufacture of Other Transport Equipment36. Industri Furniture dan Pengolahan Lainnya 62 346 1 000 12 892 594
Manufacture of Furniture and Manufacturing n.e.c.
2009* 147 522 236 22 812 023 17 789 638 604
2008 279 343 127 61 371 748 19 229 946 919
2007 (156 973 750) 3 329 706 142 18 370 597 595
2006 205 063 590 (175 112 641) 12 667 049 588
Sumber : Badan Pusat Statistik Provinsi JambiSource : BPS - Statistics of Jambi Province *) : Angka sementara / Preliminary figures **) : Angka sangat sementara / Very Preliminary figures
Jumlah/Total 2010 ** 39 460 567 17 242 630 186 708 275 466
374 Jambi Dalam Angka 2010

MANUFACTURING, MINING, AND ENERGY
Tabel 6.1.20 Jumlah Perusahaan Industri Kecil dan Kerajinan Rumah TanggaTable di Provinsi Jambi Tahun 2005 – 2010
Number of Small Industrial Establishments in Jambi Province, 2005 – 2010
Tahun Jumlah Perusahaan Investasi Tenaga Kerja Nilai ProduksiYear Number of Investment (orang) (Production Value)
Establishments (Rp.000) Labor Force (Rp.000)(person)
(1) (2) (3) (4) (5)
2005 14 245 49 493 010 44 656 166 844 656
2006 15 245 50 731 679 44 695 167 104 984
2007 15 720 51 252 830 46 036 172 118 126
2008 16 169 51 147 861 46 338 177 491 381
2009 16 318 53 916 545 47 823 186 365 650
2010* 17 800 54 967 075 48 400 192 865 650
Sumber : Dinas Perindustrian dan Perdagangan Provinsi JambiSource : Trade &Industrial and Trading Service of Jambi Province*) : Angka sementara / Preliminary figures
Jambi In Figures 2010 375
PERINDUSTRIAN, PERTAMBANGAN, DAN ENERGI
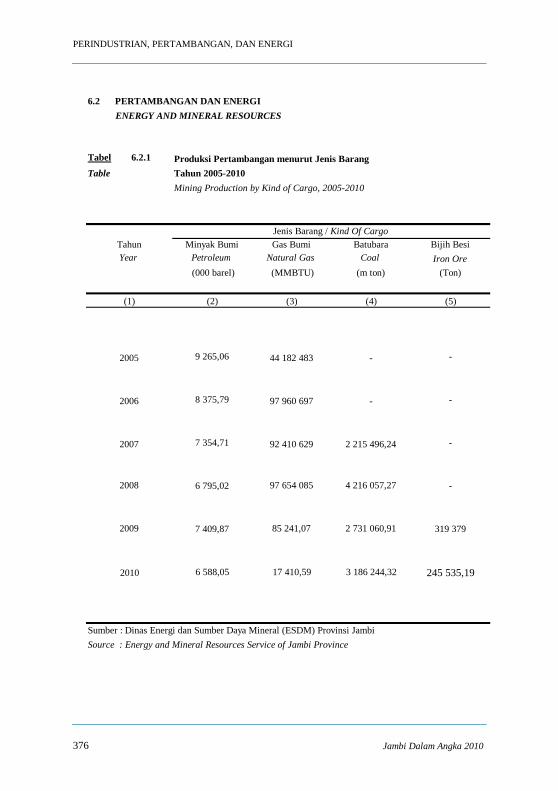
6.2 PERTAMBANGAN DAN ENERGI ENERGY AND MINERAL RESOURCES
Tabel 6.2.1 Produksi Pertambangan menurut Jenis Barang Table Tahun 2005-2010
Mining Production by Kind of Cargo, 2005-2010
Tahun Minyak Bumi Gas Bumi Batubara Bijih BesiYear Petroleum Natural Gas Coal Iron Ore
(000 barel) (MMBTU) (m ton) (Ton)
(1) (2) (3) (4) (5)
2005 9 265,06 44 182 483 - -
2006 8 375,79 97 960 697 - -
2007 7 354,71 92 410 629 2 215 496,24 -
2008 6 795,02 97 654 085 4 216 057,27 -
2009 7 409,87 85 241,07 2 731 060,91 319 379
2010 6 588,05 17 410,59 3 186 244,32 245 535,19
Sumber : Dinas Energi dan Sumber Daya Mineral (ESDM) Provinsi JambiSource : Energy and Mineral Resources Service of Jambi Province
Jenis Barang / Kind Of Cargo
376 Jambi Dalam Angka 2010
MANUFACTURING, MINING, AND ENERGY
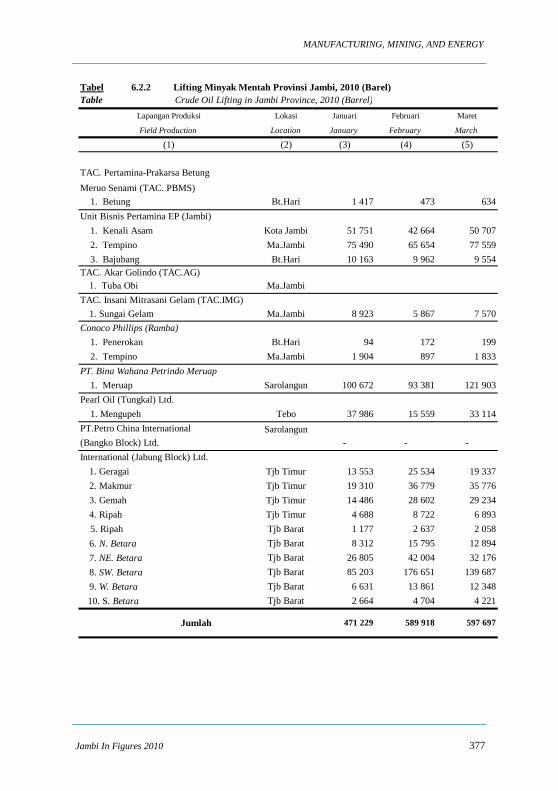
Tabel 6.2.2 Lifting Minyak Mentah Provinsi Jambi, 2010 (Barel) Table Crude Oil Lifting in Jambi Province, 2010 (Barrel)
Lapangan Produksi Lokasi Januari Februari Maret
Field Production Location January February March
(1) (2) (3) (4) (5)
TAC. Pertamina-Prakarsa Betung Meruo Senami (TAC. PBMS) 1. Betung Bt.Hari 1 417 473 634Unit Bisnis Pertamina EP (Jambi) 1. Kenali Asam Kota Jambi 51 751 42 664 50 707 2. Tempino Ma.Jambi 75 490 65 654 77 559 3. Bajubang Bt.Hari 10 163 9 962 9 554TAC. Akar Golindo (TAC.AG)1. Tuba Obi Ma.Jambi
TAC. Insani Mitrasani Gelam (TAC.IMG)1. Sungai Gelam Ma.Jambi 8 923 5 867 7 570
Conoco Phillips (Ramba) 1. Penerokan Bt.Hari 94 172 199 2. Tempino Ma.Jambi 1 904 897 1 833PT. Bina Wahana Petrindo Meruap 1. Meruap Sarolangun 100 672 93 381 121 903Pearl Oil (Tungkal) Ltd. 1. Mengupeh Tebo 37 986 15 559 33 114PT.Petro China International Sarolangun(Bangko Block) Ltd. - - -International (Jabung Block) Ltd.
1. Geragai Tjb Timur 13 553 25 534 19 3372. Makmur Tjb Timur 19 310 36 779 35 7763. Gemah Tjb Timur 14 486 28 602 29 2344. Ripah Tjb Timur 4 688 8 722 6 893
5. Ripah Tjb Barat 1 177 2 637 2 0586. N. Betara Tjb Barat 8 312 15 795 12 8947. NE. Betara Tjb Barat 26 805 42 004 32 1768. SW. Betara Tjb Barat 85 203 176 651 139 6879. W. Betara Tjb Barat 6 631 13 861 12 348
10. S. Betara Tjb Barat 2 664 4 704 4 221
597 697 589 918 471 229Jumlah
Jambi In Figures 2010 377

PERINDUSTRIAN, PERTAMBANGAN, DAN ENERGI
Lanjutan Tabel / Continued Table 6.2.2
Lapangan Produksi Lokasi April Mei JuniField Production Location April May June
(1) (2) (6) (7) (8)
TAC. Pertamina-Prakarsa Betung Meruo Senami (TAC. PBMS) 1. Betung Bt.Hari 1 656 1 333 1 225Unit Bisnis Pertamina EP (Jambi) 1. Kenali Asam Kota Jambi 48 030 50 686 49 979 2. Tempino Ma.Jambi 70 519 72 378 70 897 3. Bajubang Bt.Hari 8 633 8 717 8 867TAC. Akar Golindo (TAC.AG)1. Tuba Obi Ma.Jambi
TAC. Insani Mitrasani Gelam (TAC.IMG)1. Sungai Gelam Ma.Jambi 10 051 9 364 8 087
Conoco Phillips (Ramba) 1. Penerokan Bt.Hari 115 261 176 2. Tempino Ma.Jambi 2 003 1 559 1 582PT. Bina Wahana Petrindo Meruap 1. Meruap Sarolangun 101 109 105 756 86 672Pearl Oil (Tungkal) Ltd. 1. Mengupeh Tebo 28 289 28 721 27 177PT.Petro China International Sarolangun(Bangko Block) Ltd. - - -International (Jabung Block) Ltd.
1. Geragai Tjb Timur 12 486 14 173 8 6082. Makmur Tjb Timur 26 739 30 009 18 3803. Gemah Tjb Timur 20 228 23 385 14 1834. Ripah Tjb Timur 4 197 4 688 3 143
5. Ripah Tjb Barat 1 295 1 397 8586. N. Betara Tjb Barat 10 175 11 706 5 1077. NE. Betara Tjb Barat 19 819 24 121 15 4578. SW. Betara Tjb Barat 91 319 104 233 63 6449. W. Betara Tjb Barat 8 292 11 244 8 875
10. S. Betara Tjb Barat 4 601 4 631 2 154
Jumlah 469 556 395 071 508 362
378 Jambi Dalam Angka 2010

MANUFACTURING, MINING, AND ENERGY
Lanjutan Tabel / Continued Table 6.2.2
Lapangan Produksi Lokasi Juli Agustus SeptemberField Production Location July August September
(1) (2) (9) (10) (11)
TAC. Pertamina-Prakarsa Betung Meruo Senami (TAC. PBMS) 1. Betung Bt.Hari 1 409 1 018 1 574Unit Bisnis Pertamina EP (Jambi) 1. Kenali Asam Kota Jambi 48 952 49 617 46 211 2. Tempino Ma.Jambi 74 157 72 037 69 461 3. Bajubang Bt.Hari 8 211 7 557 7 909TAC. Akar Golindo (TAC.AG)1. Tuba Obi Ma.Jambi
TAC. Insani Mitrasani Gelam (TAC.IMG)1. Sungai Gelam Ma.Jambi 7 633 8 064 6 738
Conoco Phillips (Ramba) 1. Penerokan Bt.Hari 121 128 270 2. Tempino Ma.Jambi 1 308 1 887 1 751PT. Bina Wahana Petrindo Meruap 1. Meruap Sarolangun 104 493 98 106 116 165Pearl Oil (Tungkal) Ltd. 1. Mengupeh Tebo 28 692 24 004 29 005PT.Petro China International Sarolangun(Bangko Block) Ltd. - - 22 261International (Jabung Block) Ltd.
1. Geragai Tjb Timur 20 030 18 949 41 6132. Makmur Tjb Timur 39 698 34 372 62 5973. Gemah Tjb Timur 31 455 27 489 52 7984. Ripah Tjb Timur 6 831 5 968 12 332
5. Ripah Tjb Barat 1 887 1 640 3 4876. N. Betara Tjb Barat 8 456 5 797 9 7297. NE. Betara Tjb Barat 34 332 30 561 65 5238. SW. Betara Tjb Barat 134 615 115 140 227 8229. W. Betara Tjb Barat 22 758 21 894 48 239
10. S. Betara Tjb Barat 4 093 3 256 6 178
831 663 527 484 579 131Jumlah
Jambi In Figures 2010 379

PERINDUSTRIAN, PERTAMBANGAN, DAN ENERGI
Lanjutan Tabel / Continued Table 6.2.2
Lapangan Produksi Lokasi Oktober November Desember Jumlah
Field Production Location October November December Total
(1) (2) (12) (13) (14) (15)
TAC. Pertamina-Prakarsa Betung Meruo Senami (TAC. PBMS) 1. Betung Bt.Hari 1 288 646 751 13 424Unit Bisnis Pertamina EP (Jambi) 1. Kenali Asam Kota Jambi 50 171 48 085 53 715 590 568 2. Tempino Ma.Jambi 74 458 68 562 73 376 864 548 3. Bajubang Bt.Hari 6 549 6 268 10 715 103 105TAC. Akar Golindo (TAC.AG)1. Tuba Obi Ma.Jambi
TAC. Insani Mitrasani Gelam (TAC.IMG)1. Sungai Gelam Ma.Jambi 6 611 7 467 9 313 95 688
Conoco Phillips (Ramba) 1. Penerokan Bt.Hari 105 - 169 1 810 2. Tempino Ma.Jambi 700 - 1 923 17 347PT. Bina Wahana Petrindo Meruap 1. Meruap Sarolangun 114 676 118 542 111 171 1 272 646Pearl Oil (Tungkal) Ltd. 1. Mengupeh Tebo 27 889 25 652 20 913 327 001PT.Petro China International Sarolangun(Bangko Block) Ltd. 738 - - 22 999International (Jabung Block) Ltd.
1. Geragai Tjb Timur 19 899 27 548 19 810 241 5402. Makmur Tjb Timur 21 898 27 000 28 919 381 4773. Gemah Tjb Timur 20 252 26 705 22 563 311 3804. Ripah Tjb Timur 5 189 7 381 7 437 77 469
5. Ripah Tjb Barat 1 286 949 1 405 20 0766. N. Betara Tjb Barat 3 503 4 598 11 889 107 9617. NE. Betara Tjb Barat 31 046 42 998 46 038 410 8808. SW. Betara Tjb Barat 89 417 118 296 133 309 1 479 3369. W. Betara Tjb Barat 15 971 19 438 10 202 199 753
10. S. Betara Tjb Barat 2 369 4 275 5 898 49 044
Sumber : Dinas Energi dan Sumber Daya Mineral (ESDM) Provinsi JambiSource : Energy and Mineral Resources Service of Jambi Province
494 015 554 410 569 516 6 588 052Jumlah
380 Jambi Dalam Angka 2010

MANUFACTURING, MINING, AND ENERGY
Tabel 6.2.3 Perkembangan Izin Usaha Pertambangan Tahun 2006-2010Table Growth of Mining Permission Effort, 2006-2010
TahunYear Penyelidikan Pengangkutan
Umum Eksplorasi Eksploitasi dan PenjualanGeneral Exploration Exploitation Transportation
Investigation & Sale(1) (2) (3) (4) (5) (6) (7)
2006 3 20 9 - 12 -
2007 10 49 12 3 38 -
2008 8 73 18 9 103 -
2009 7 203 70 24 99 -
2010 - 244 92 - - -
Sumber : Dinas Energi dan Sumber Daya Mineral (ESDM) Provinsi JambiSource : Energy and Mineral Resources Service of Jambi Province
Mining RightsKuasa Pertambangan
SIPD SIPR
Jambi In Figures 2010 381

PERINDUSTRIAN, PERTAMBANGAN, DAN ENERGI
Tabel 6.2.4 Volume Penjualan BBM Menurut Jenis Per Bulan Table Di Provinsi Jambi Tahun 2008-2010 (Kilo Liter)
Volume of Marketing Oil by Month in Jambi Province, 2008-2010 (Kilo Litre)
Premium Minyak TanahPremium Kerosene
(2) (3) (4) (5)
Januari/January - 106 27 497 6 235
Februari/February - 172 25 095 5 865
Maret/March - 120 28 221 6 165
April/April - 170 27 348 5 935
Mei/May - 190 29 419 5 930
Juni/June - 230 28 506 5 915
Juli/July - 270 29 211 6 220
Agustus/August - 240 29 251 6 250
September/September - 320 30 463 6 210
Oktober/October - 260 30 105 5 500
November/November - 260 29 541 5 880
Desember/December - 360 32 098 5 895
2008
BulanMonth
(1)
Jumlah / Total 2010
2009 282 120
Pertamax
9 780 1 568 72 915
- 2 698
Avtur
346 755 72 000
9 575 766 244 061 77 837
382 Jambi Dalam Angka 2010
MANUFACTURING, MINING, AND ENERGY
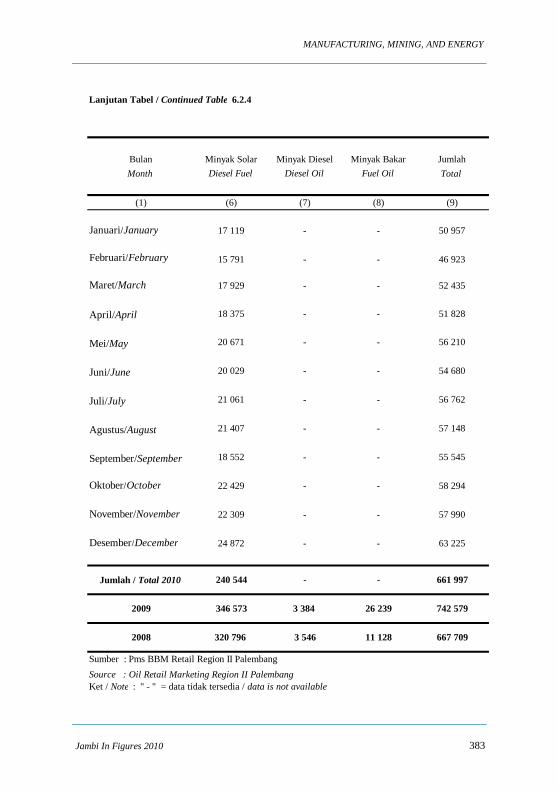
Lanjutan Tabel / Continued Table 6.2.4
Bulan Minyak Solar Minyak Diesel Minyak Bakar JumlahMonth Diesel Fuel Diesel Oil Fuel Oil Total
(1) (6) (7) (8) (9)
Januari/January 17 119 - - 50 957
Februari/February 15 791 - - 46 923
Maret/March 17 929 - - 52 435
April/April 18 375 - - 51 828
Mei/May 20 671 - - 56 210
Juni/June 20 029 - - 54 680
Juli/July 21 061 - - 56 762
Agustus/August 21 407 - - 57 148
September/September 18 552 - - 55 545
Oktober/October 22 429 - - 58 294
November/November 22 309 - - 57 990
Desember/December 24 872 - - 63 225
Sumber : Pms BBM Retail Region II PalembangSource : Oil Retail Marketing Region II PalembangKet / Note : " - " = data tidak tersedia / data is not available
Jumlah / Total 2010 661 997
667 70911 128
2009 346 573 3 384 26 239 742 579
240 544 - -
3 5462008 320 796
Jambi In Figures 2010 383
PERINDUSTRIAN, PERTAMBANGAN, DAN ENERGI
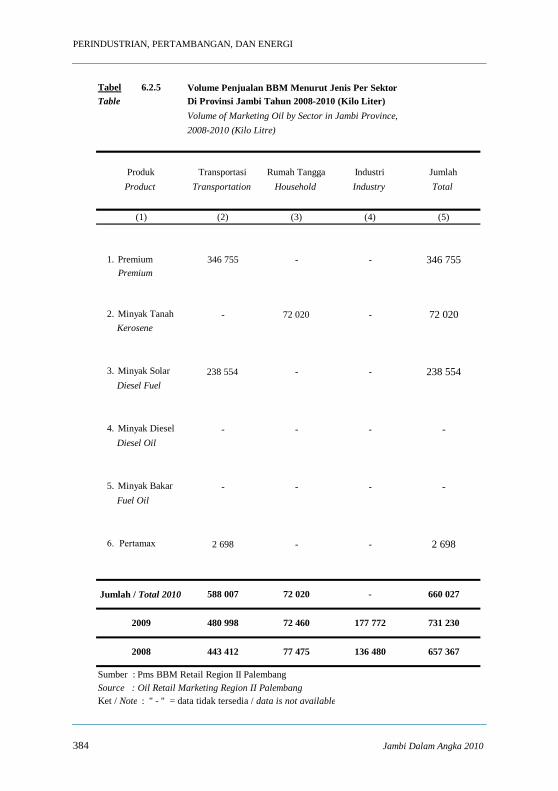
Tabel 6.2.5 Volume Penjualan BBM Menurut Jenis Per Sektor Table Di Provinsi Jambi Tahun 2008-2010 (Kilo Liter)
Volume of Marketing Oil by Sector in Jambi Province, 2008-2010 (Kilo Litre)
Produk Transportasi Rumah Tangga Industri JumlahProduct Transportation Household Industry Total
(1) (2) (3) (4) (5)
1. Premium 346 755 - - 346 755 Premium
2. Minyak Tanah - 72 020 - 72 020 Kerosene
3. Minyak Solar 238 554 - - 238 554 Diesel Fuel
4. Minyak Diesel - - - - Diesel Oil
5. Minyak Bakar - - - - Fuel Oil
6. Pertamax 2 698 - - 2 698
Sumber : Pms BBM Retail Region II PalembangSource : Oil Retail Marketing Region II PalembangKet / Note : " - " = data tidak tersedia / data is not available
177 772 731 230
Jumlah / Total 2010 588 007 72 020 - 660 027
480 9982009
2008
72 460
443 412 77 475 136 480 657 367
384 Jambi Dalam Angka 2010

MANUFACTURING, MINING, AND ENERGY
6.3 LISTRIK, GAS DAN AIR MINUM ELECTRICITY, GAS AND WATER SUPLLY
Tabel 6.3.1 Penjualan Tenaga Listrik menurut Kabupaten/Kota Tahun 2010Table Electricity Sold by Regency/Municipality, 2010
Pelanggan Daya Tersambung TerjualCustomer Connected Trick (VA) Out of Stock (KWH)
(2) (3) (4)
1. Kerinci 41 513 - 50 809 023
2. Merangin 38 971 45 744 300 67 497 343
3. Sarolangun 27 776 28 311 960 34 759 486
4. Batang Hari 36 972 27 097 465 80 540 689
5. Muaro Jambi 14 360 51 851 200 38 962 979
6. Tanjab Timur 16 450 15 548 900 23 083 075
7. Tanjab Barat 16 078 16 664 265 38 634 189
8. Tebo * 25 715 29 556 875 49 113 215
9. Bungo 36 231 69 099 998 61 671 953
10. Kota Jambi 160 900 176 904 700 640 787 366
Sumber : PLN Regional S2JB Cabang Jambi, Bungo dan Sungai PenuhSource : Public Electricity Service of Regional S2JB Branche of Jambi, Bungo and Sungai PenuhKet : * = data pada tahun 2009 / data in 2009
345 268
460 779 663 414 966
452 005 021 807 772 984
1 085 859 318
Kabupaten/KotaRegency/Municipality
(1)
Jumlah/ Total 2010
2009
Jambi In Figures 2010 385

PERINDUSTRIAN, PERTAMBANGAN, DAN ENERGI
Tabel 6.3.2 Jumlah Mesin dan Kekuatan Tenaga ListrikTable di Provinsi Jambi Tahun 2006-2010
Number of Electrical Machinery and Electrical Power in Jambi Province, 2006-2010
Jumlah Mesin Daya TerpasangNumber of Machines Power (Kw)
(2) (3)
1. Kerinci NA NA
2. Merangin 2 285
3. Sarolangun 10 2 400
4. Batang Hari - -
5. Muaro Jambi - -
6. Tanjab Timur 8 1 245
7. Tanjab Barat 19 9 405
8. Tebo 3 420
9. Bungo 9 260
10. Kota Jambi - -
2009 43 14 8762008 54 103 0992007 61 102 8342006 86 117 679
Sumber : PLN Regional S2JB Cabang Jambi dan BungoSource : Public Electricity Service of Regional S2JB Branche of Jambi and BungoKet/Note : NA = data tidak tersedia/ data is not available
51 14 015
Kabupaten/KotaRegency/Municipality
(1)
Jumlah/ Total 2010
386 Jambi Dalam Angka 2010

MANUFACTURING, MINING, AND ENERGY
Tabel 6.3.3 Jumlah Desa yang Berlistrik dan Belum Berlistrik Table Di Provinsi Jambi Tahun 2010
Number of Electrical Village and Unelectrical Villagein Jambi Province, 2010
PersentaseBerlistrik Belum Berlistrik Jumlah Desa BerlistrikElectrical Unelectrical Total Percentage
(2) (3) (4) (5)
1. Kerinci NA NA NA NA
2. Merangin 179 24 203 88,18
3. Sarolangun 88 37 125 70,40
4. Batang Hari 86 27 113 76,11
5. Muaro Jambi 121 30 151 80,13
6. Tanjab Timur 64 12 76 84,21
7. Tanjab Barat 25 32 57 43,86
8. Tebo 87 13 100 87,00
9. Bungo 105 26 131 80,15
10. Kota Jambi 62 - 62 100,00
Sumber : PLN Regional S2JB Cabang Jambi dan BungoSource : Public Electricity Service of Regional S2JB Branche of Jambi and BungoKet/Note : * = data tahun 2009 / data in 2009
817Jumlah/ Total 2010 201 1 018 80,26
Kabupaten/KotaRegency/Municipality
(1)
Jambi In Figures 2010 387

PERINDUSTRIAN, PERTAMBANGAN, DAN ENERGI
Tabel 6.3.4 Perkembangan Pengusahaan Listrik di Provinsi Jambi Table Tahun 2006-2010
Growth of Electricity Effort in Jambi Province, 2006-2010
SatuanUnit
(2) (3) (4) (5) (6) (7)
1. Energi Jual GWH 578 655 740 808 1 085 Energy Sold
2. Harga jual rata-rata Rp/kwh 624 646 670 703 623 Average Selling Price
3. Pendapatan Penjualan Juta Rp 358 346 417 214 495 677 567 880 676 679 Sales Revenue
4. Daya tersambung MVA 317 356 411 452 460 Connected Power
5. Jumlah pelanggan Plg 272 378 289 875 333 515 345 268 414 966 Number of Customers
6. Susut distribusi % 11,71 11,66 8,91 9,59 8,20 Decrease
Sumber : PLN Regional S2JB Cabang Jambi, Bungo dan Sungai PenuhSource : Public Electricity Service of Regional S2JB Branche of Jambi, Bungo and Sungai Penuh
2007 2008 20092006 2010Uraian
Explanations
(1)
388 Jambi Dalam Angka 2010
MANUFACTURING, MINING, AND ENERGY
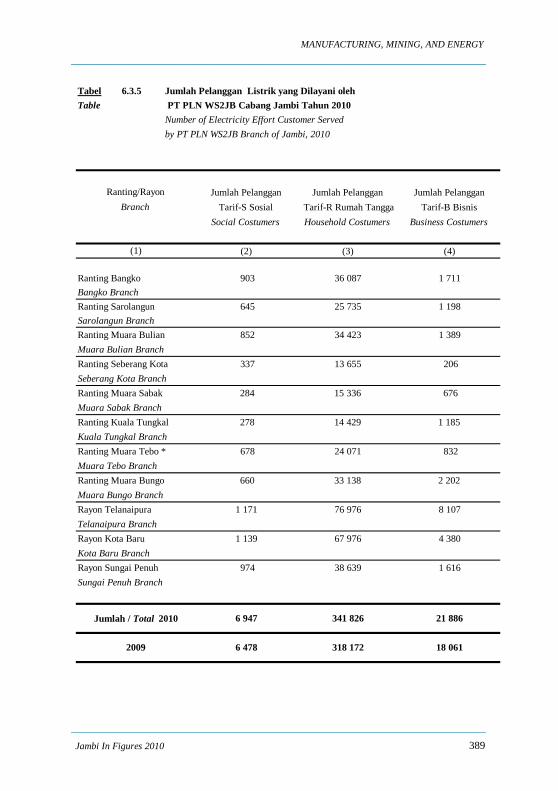
Tabel 6.3.5 Jumlah Pelanggan Listrik yang Dilayani olehTable PT PLN WS2JB Cabang Jambi Tahun 2010
Number of Electricity Effort Customer Served by PT PLN WS2JB Branch of Jambi, 2010
Jumlah Pelanggan Jumlah Pelanggan Jumlah PelangganTarif-S Sosial Tarif-R Rumah Tangga Tarif-B Bisnis
Social Costumers Household Costumers Business Costumers
(2) (3) (4)
Ranting Bangko 903 36 087 1 711Bangko BranchRanting Sarolangun 645 25 735 1 198Sarolangun BranchRanting Muara Bulian 852 34 423 1 389Muara Bulian BranchRanting Seberang Kota 337 13 655 206Seberang Kota BranchRanting Muara Sabak 284 15 336 676Muara Sabak BranchRanting Kuala Tungkal 278 14 429 1 185Kuala Tungkal BranchRanting Muara Tebo * 678 24 071 832Muara Tebo BranchRanting Muara Bungo 660 33 138 2 202Muara Bungo BranchRayon Telanaipura 1 171 76 976 8 107Telanaipura BranchRayon Kota Baru 1 139 67 976 4 380Kota Baru BranchRayon Sungai Penuh 974 38 639 1 616Sungai Penuh Branch
Jumlah / Total 2010 341 826 21 8866 947
318 172 18 0616 478
Ranting/RayonBranch
(1)
2009
Jambi In Figures 2010 389
PERINDUSTRIAN, PERTAMBANGAN, DAN ENERGI
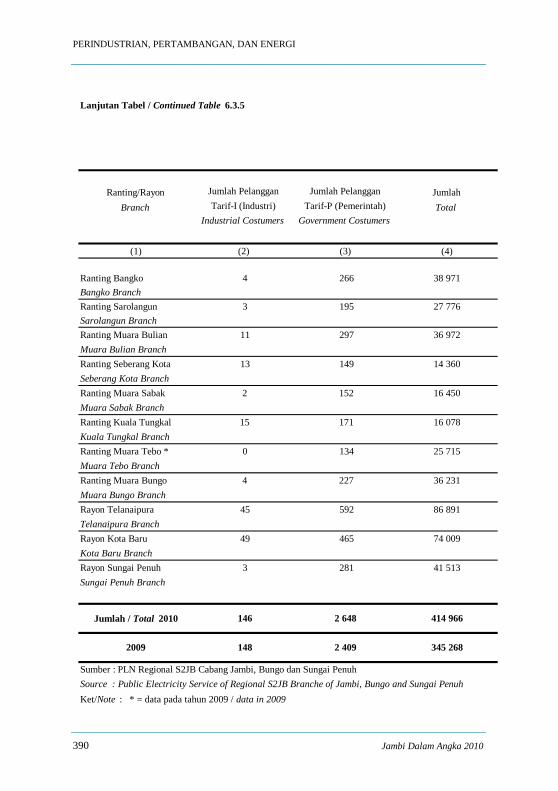
Lanjutan Tabel / Continued Table 6.3.5
Ranting/Rayon Jumlah Pelanggan Jumlah Pelanggan JumlahBranch Tarif-I (Industri) Tarif-P (Pemerintah) Total
Industrial Costumers Government Costumers
(1) (2) (3) (4)
Ranting Bangko 4 266 38 971Bangko BranchRanting Sarolangun 3 195 27 776Sarolangun BranchRanting Muara Bulian 11 297 36 972Muara Bulian BranchRanting Seberang Kota 13 149 14 360Seberang Kota BranchRanting Muara Sabak 2 152 16 450Muara Sabak BranchRanting Kuala Tungkal 15 171 16 078Kuala Tungkal BranchRanting Muara Tebo * 0 134 25 715Muara Tebo BranchRanting Muara Bungo 4 227 36 231Muara Bungo BranchRayon Telanaipura 45 592 86 891Telanaipura BranchRayon Kota Baru 49 465 74 009Kota Baru BranchRayon Sungai Penuh 3 281 41 513Sungai Penuh Branch
Sumber : PLN Regional S2JB Cabang Jambi, Bungo dan Sungai PenuhSource : Public Electricity Service of Regional S2JB Branche of Jambi, Bungo and Sungai PenuhKet/Note : * = data pada tahun 2009 / data in 2009
Jumlah / Total 2010
345 268
146 2 648 414 966
2009 148 2 409
390 Jambi Dalam Angka 2010
MANUFACTURING, MINING, AND ENERGY
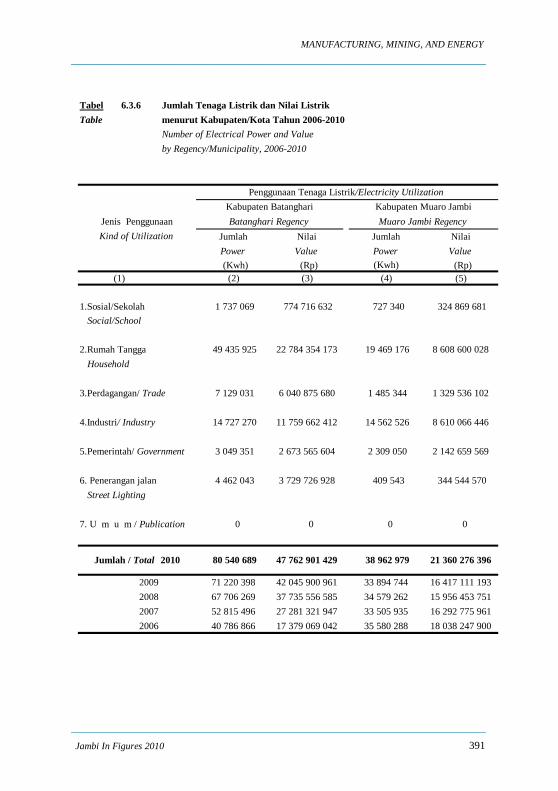
Tabel 6.3.6 Jumlah Tenaga Listrik dan Nilai ListrikTable menurut Kabupaten/Kota Tahun 2006-2010
Number of Electrical Power and Value by Regency/Municipality, 2006-2010
Jumlah Nilai Jumlah Nilai Power Value Power Value (Kwh) (Rp) (Kwh) (Rp)
(1) (2) (3) (4) (5)
1.Sosial/Sekolah 1 737 069 774 716 632 727 340 324 869 681 Social/School
2.Rumah Tangga 49 435 925 22 784 354 173 19 469 176 8 608 600 028 Household
3.Perdagangan/ Trade 7 129 031 6 040 875 680 1 485 344 1 329 536 102 4.Industri/ Industry 14 727 270 11 759 662 412 14 562 526 8 610 066 446
5.Pemerintah/ Government 3 049 351 2 673 565 604 2 309 050 2 142 659 569
6. Penerangan jalan 4 462 043 3 729 726 928 409 543 344 544 570 Street Lighting
7. U m u m / Publication 0 0 0 0
2009 71 220 398 42 045 900 961 33 894 744 16 417 111 1932008 67 706 269 37 735 556 585 34 579 262 15 956 453 7512007 52 815 496 27 281 321 947 33 505 935 16 292 775 9612006 40 786 866 17 379 069 042 35 580 288 18 038 247 900
38 962 979 21 360 276 39647 762 901 429
Kabupaten BatanghariPenggunaan Tenaga Listrik/Electricity Utilization
Batanghari RegencyKabupaten Muaro JambiMuaro Jambi RegencyJenis Penggunaan
Kind of Utilization
Jumlah / Total 2010 80 540 689
Jambi In Figures 2010 391
PERINDUSTRIAN, PERTAMBANGAN, DAN ENERGI
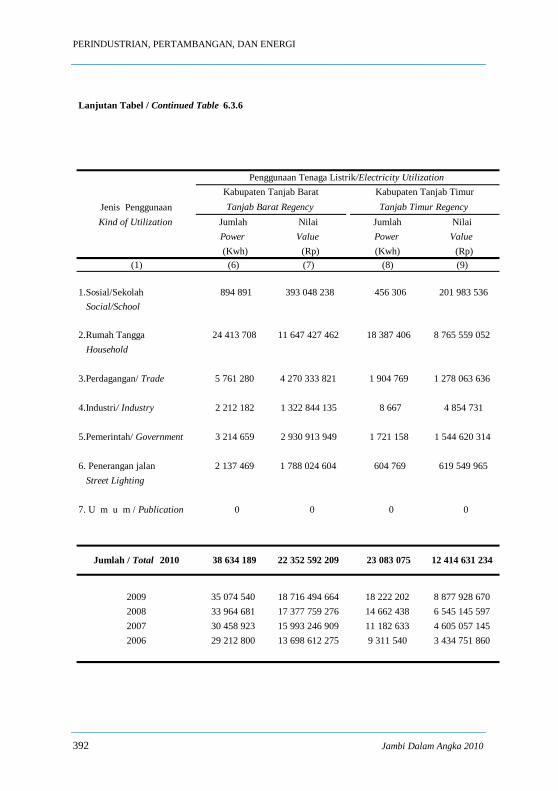
Lanjutan Tabel / Continued Table 6.3.6
Jenis PenggunaanKind of Utilization Jumlah Nilai Jumlah Nilai
Power Value Power Value (Kwh) (Rp) (Kwh) (Rp)
(1) (6) (7) (8) (9)
1.Sosial/Sekolah 894 891 393 048 238 456 306 201 983 536 Social/School
2.Rumah Tangga 24 413 708 11 647 427 462 18 387 406 8 765 559 052 Household
3.Perdagangan/ Trade 5 761 280 4 270 333 821 1 904 769 1 278 063 636 4.Industri/ Industry 2 212 182 1 322 844 135 8 667 4 854 731
5.Pemerintah/ Government 3 214 659 2 930 913 949 1 721 158 1 544 620 314
6. Penerangan jalan 2 137 469 1 788 024 604 604 769 619 549 965 Street Lighting 7. U m u m / Publication 0 0 0 0
2009 35 074 540 18 716 494 664 18 222 202 8 877 928 6702008 33 964 681 17 377 759 276 14 662 438 6 545 145 5972007 30 458 923 15 993 246 909 11 182 633 4 605 057 1452006 29 212 800 13 698 612 275 9 311 540 3 434 751 860
Penggunaan Tenaga Listrik/Electricity Utilization
Jumlah / Total 2010 38 634 189 22 352 592 209 12 414 631 234 23 083 075
Kabupaten Tanjab Barat Kabupaten Tanjab TimurTanjab Barat Regency Tanjab Timur Regency
392 Jambi Dalam Angka 2010
MANUFACTURING, MINING, AND ENERGY
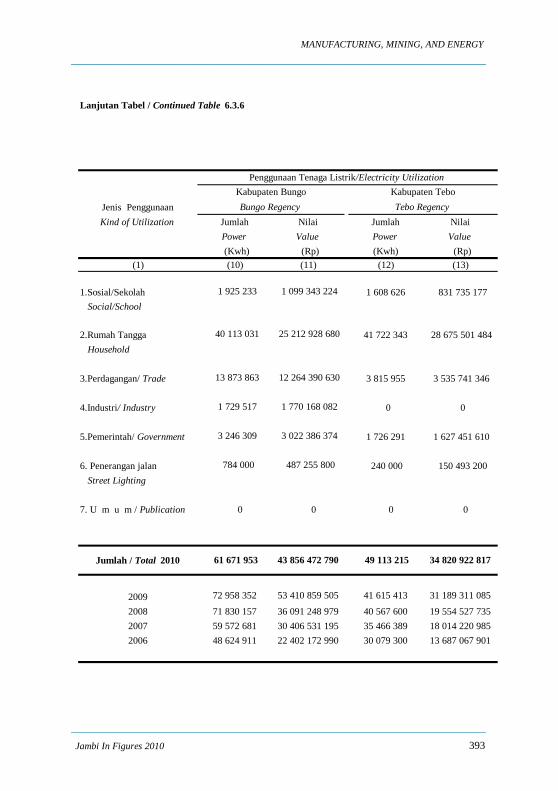
Lanjutan Tabel / Continued Table 6.3.6
Jenis PenggunaanKind of Utilization Jumlah Nilai Jumlah Nilai
Power Value Power Value (Kwh) (Rp) (Kwh) (Rp)
(1) (10) (11) (12) (13)
1.Sosial/Sekolah 1 925 233 1 099 343 224 1 608 626 831 735 177 Social/School
2.Rumah Tangga 40 113 031 25 212 928 680 41 722 343 28 675 501 484 Household
3.Perdagangan/ Trade 13 873 863 12 264 390 630 3 815 955 3 535 741 346 4.Industri/ Industry 1 729 517 1 770 168 082 0 0
5.Pemerintah/ Government 3 246 309 3 022 386 374 1 726 291 1 627 451 610
6. Penerangan jalan 784 000 487 255 800 240 000 150 493 200 Street Lighting 7. U m u m / Publication 0 0 0 0
2009 72 958 352 53 410 859 505 41 615 413 31 189 311 085
2008 71 830 157 36 091 248 979 40 567 600 19 554 527 7352007 59 572 681 30 406 531 195 35 466 389 18 014 220 9852006 48 624 911 22 402 172 990 30 079 300 13 687 067 901
49 113 215 34 820 922 81743 856 472 790
Kabupaten TeboBungo Regency Tebo Regency
Jumlah / Total 2010 61 671 953
Penggunaan Tenaga Listrik/Electricity UtilizationKabupaten Bungo
Jambi In Figures 2010 393
PERINDUSTRIAN, PERTAMBANGAN, DAN ENERGI
Lanjutan Tabel / Continued Table 6.3.6
Jenis PenggunaanKind of Utilization Jumlah Nilai Jumlah Nilai
Power Value Power Value (Kwh) (Rp) (Kwh) (Rp)
(1) (14) (15) (16) (17)
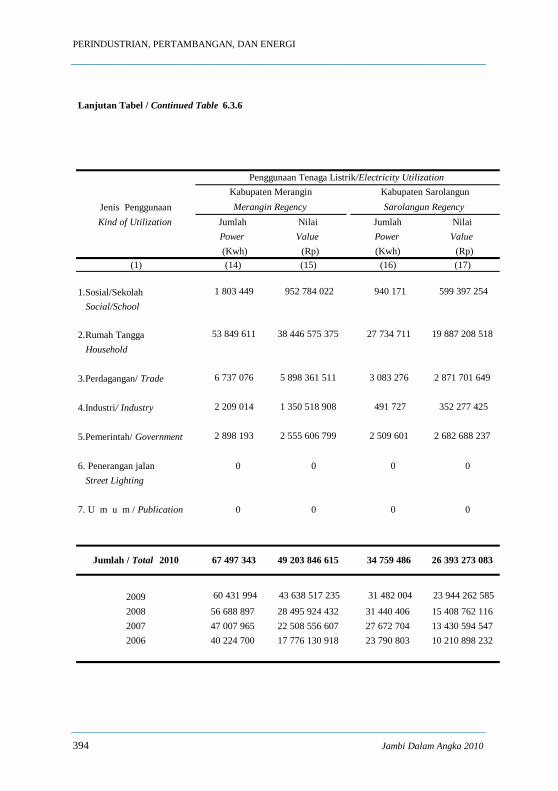
1.Sosial/Sekolah 1 803 449 952 784 022 940 171 599 397 254 Social/School
2.Rumah Tangga 53 849 611 38 446 575 375 27 734 711 19 887 208 518 Household
3.Perdagangan/ Trade 6 737 076 5 898 361 511 3 083 276 2 871 701 649 4.Industri/ Industry 2 209 014 1 350 518 908 491 727 352 277 425
5.Pemerintah/ Government 2 898 193 2 555 606 799 2 509 601 2 682 688 237
6. Penerangan jalan 0 0 0 0 Street Lighting 7. U m u m / Publication 0 0 0 0
2009 60 431 994 43 638 517 235 31 482 004 23 944 262 585
2008 56 688 897 28 495 924 432 31 440 406 15 408 762 1162007 47 007 965 22 508 556 607 27 672 704 13 430 594 5472006 40 224 700 17 776 130 918 23 790 803 10 210 898 232
34 759 486 26 393 273 083Jumlah / Total 2010
Kabupaten Sarolangun Merangin Regency Sarolangun Regency
49 203 846 615
Kabupaten Merangin Penggunaan Tenaga Listrik/Electricity Utilization
67 497 343
394 Jambi Dalam Angka 2010

MANUFACTURING, MINING, AND ENERGY
Lanjutan Tabel / Continued Table 6.3.6
Jenis PenggunaanKind of Utilization Jumlah Nilai Jumlah Nilai
Power Value Power Value (Kwh) (Rp) (Kwh) (Rp)
(1) (18) (19) (20) (21)
1.Sosial/Sekolah 17 030 601 8 097 101 051 1 701 936 887 951 069 Social/School
2.Rumah Tangga 391 142 357 196 110 186 273 39 977 605 20 734 384 833 Household
3.Perdagangan/ Trade 133 053 219 111 601 754 037 5 120 362 3 352 403 409 4.Industri/ Industry 64 926 573 42 978 032 815 499 620 322 974 353
5.Pemerintah/ Government 34 634 616 30 980 545 291 629 020 410 976 507
6. Penerangan jalan 0 0 1 255 760 787 713 133 Street Lighting 7. U m u m / Publication 0 0 1 624 720 2 050 234 168
2009 278 900 555 163 730 166 194 49 844 855 28 424 088 148
2008 381 344 161 202 397 700 9912007 349 239 863 174 088 497 8542006 51 746 981 24 450 254 673
Penggunaan Tenaga Listrik/Electricity Utilization
50 809 023 28 546 637 472Jumlah / Total 2010 640 787 366 389 767 619 467
Kota JambiJambi Municipality
Kabupaten KerinciKerinci Regency
Jambi In Figures 2010 395
PERINDUSTRIAN, PERTAMBANGAN, DAN ENERGI
Lanjutan Tabel / Continued Table 6.3.6
Jenis PenggunaanKind of Utilization Jumlah Nilai
Power Value(Kwh) (Rp)
(1) (20) (21)
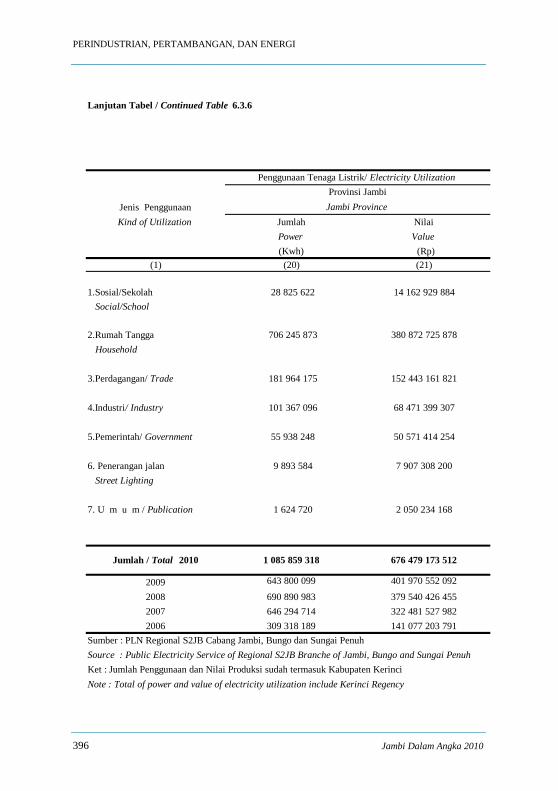
1.Sosial/Sekolah 28 825 622 14 162 929 884 Social/School
2.Rumah Tangga 706 245 873 380 872 725 878 Household
3.Perdagangan/ Trade 181 964 175 152 443 161 821 4.Industri/ Industry 101 367 096 68 471 399 307
5.Pemerintah/ Government 55 938 248 50 571 414 254
6. Penerangan jalan 9 893 584 7 907 308 200 Street Lighting 7. U m u m / Publication 1 624 720 2 050 234 168
2009 643 800 099 401 970 552 092
2008 690 890 983 379 540 426 4552007 646 294 714 322 481 527 9822006 309 318 189 141 077 203 791
Sumber : PLN Regional S2JB Cabang Jambi, Bungo dan Sungai PenuhSource : Public Electricity Service of Regional S2JB Branche of Jambi, Bungo and Sungai PenuhKet : Jumlah Penggunaan dan Nilai Produksi sudah termasuk Kabupaten KerinciNote : Total of power and value of electricity utilization include Kerinci Regency
Penggunaan Tenaga Listrik/ Electricity Utilization
676 479 173 5121 085 859 318Jumlah / Total 2010
Provinsi JambiJambi Province
396 Jambi Dalam Angka 2010

MANUFACTURING, MINING, AND ENERGY
Tabel 6.3.7 Jumlah Tenaga Listrik dan Nilai Listrik menurutTable Jenis Tarif di Provinsi Jambi Tahun 2006-2010
Number of Electrical Power Consumption and Valueby Rate Group in Jambi Province, 2006-2010
Penggunaan NilaiConsumption Value
(Kwh) (Rp)(2) (3)
I. Sekolah/Sosial 17 030 601 8 097 101 051 School/Social S-1 : 220 VA 0 0 S-2 : 450 VA 1 436 458 400 718 467 S-2 : 900 VA 2 104 918 586 084 214 S-2 : 1300 1 515 131 718 436 950 S-2 : 2200 816 856 410 857 507 S-2 : >2200 s/d 200 kVA 7 203 238 3 973 089 207 S-3 : 200 kVA 3 954 000 2 007 914 706
II. Rumah Tangga / Household 391 142 357 196 110 186 273 R-1: 450 VA 89 259 086 33 333 406 233 R-1: 900 VA 138 794 034 62 209 039 375 R-1 : 1300 VA 112 647 782 67 460 723 358 R-1: 2200 VA 31 650 548 18 675 821 740 R-2: >2200 s/d 6600 VA 13 603 378 9 239 085 220 R-3: >6600 VA 5 187 529 5 192 110 347
III. Perdagangan / Trade 133 053 219 111 601 754 037 B-1: 450 VA 1 750 401 566 327 287 B-1: 900 VA 3 942 629 1 554 068 888 B-1: 1300 VA 11 142 121 6 785 615 203 B-2: 2200 VA 19 681 453 13 922 656 628 B-2: >2200 VA s/d 200 kVA 66 057 775 66 167 276 068 B-3: > 200 kVA 30 478 840 22 605 809 963
Kota Jambi /Jambi MunicipalityGolongan Tarif
Rate Group
(1)
Jambi In Figures 2010 397

PERINDUSTRIAN, PERTAMBANGAN, DAN ENERGI
Lanjutan Tabel / Continued Table 6.3.7
Golongan Tarif Penggunaan NilaiRate Group Consumption Value
(Kwh) (Rp)(1) (2) (3)
IV. Industri / Industry 64 926 573 42 978 032 815 I-1: 450 VA 0 0 I-1: 900 VA 0 0 I-1: 1300 VA 6 236 3 494 385 I-2: 2200 VA 31 633 17 100 339 I-1: >2200 VA s/d 14 kVA 294 454 189 374 722 I-2: 14 s/d 200 kVA 11 787 210 7 292 623 332 I-3: >200 kVA 52 807 040 35 475 440 037 I-4: >30000 kVA
V. Pemerintahan / Government 34 634 616 30 980 545 291 P-1 : 450 VA 102 869 59 161 600 P-1 : 900 VA 258 394 155 031 757 P-1 : 1300 VA 775 772 543 427 001 P-2: 2200 VA 745 247 564 214 993 P-1: >2200 VA s/d 200 kVA 11 742 625 12 030 332 008 P-2: >200 kVA 1 410 600 874 432 276 P-3 (Lampu Jalan) 19 599 109 16 753 945 656
VI. Penerangan Jalan 0 0 Street Lighting
T : > 200 kVA 0 0 C : > 200 kVA 0 0 M 0 0
2009 278 900 565 163 730 166 1942008 381 344 161 202 397 700 9912007 349 239 863 174 088 497 8542006 51 746 980 24 450 254 673
Kota Jambi /Jambi Municipality
Jumlah / Total 2010 640 787 366 389 767 619 467
398 Jambi Dalam Angka 2010

MANUFACTURING, MINING, AND ENERGY
Lanjutan Tabel / Continued Table 6.3.7
Golongan Tarif Penggunaan NilaiRate Group Consumption Value
(Kwh) (Rp)(1) (2) (3)
I. Sekolah/Sosial 1 737 069 774 716 632 School/Social S-1 : 220 VA 0 0 S-2 : 450 VA 287 515 75 870 692 S-2 : 900 VA 359 480 113 889 349 S-2 : 1300 328 560 155 525 042 S-2 : 2200 128 368 64 251 236 S-2 : >2200 s/d 200 kVA 633 146 365 180 313 S-3 : 200 kVA 0 0
II. Rumah Tangga / Household 49 435 925 22 784 354 173 R-1: 450 VA 16 643 682 6 222 671 722 R-1: 900 VA 19 904 917 8 884 074 477 R-1 : 1300 VA 11 517 269 6 940 810 859 R-1: 2200 VA 720 070 428 858 342 R-2: >2200 s/d 6600 VA 319 117 133 298 255 R-3: >6600 VA 330 870 174 640 518
III. Perdagangan / Trade 7 129 031 6 040 875 680 B-1: 450 VA 328 041 120 257 210 B-1: 900 VA 927 025 388 389 182 B-1: 1300 VA 1 006 208 579 476 918 B-2: 2200 VA 634 704 450 376 100 B-2: >2200 VA s/d 200 kVA 4 233 053 4 502 376 270 B-3: > 200 kVA 0 0
Kab. Batang Hari / Batang Hari Regency
Jambi In Figures 2010 399

PERINDUSTRIAN, PERTAMBANGAN, DAN ENERGI
Lanjutan Tabel / Continued Table 6.3.7
Golongan Tarif Penggunaan NilaiRate Group Consumption Value
(Kwh) (Rp)(1) (2) (3)
IV. Industri / Industry 14 727 270 11 759 662 412 I-1: 450 VA 0 0 I-1: 900 VA 0 0 I-1: 1300 VA 0 0 I-2: 2200 VA 0 0 I-1: >2200 VA s/d 14 kVA 7 181 4 549 917 I-2: 14 s/d 200 kVA 1 638 249 888 284 871 I-3: >200 kVA 13 081 840 10 866 827 624 I-4: >30000 kVA
V. Pemerintahan / Government 3 049 351 2 673 565 604 P-1 : 450 VA 24 681 14 191 575 P-1 : 900 VA 68 309 40 985 400 P-1 : 1300 VA 163 101 115 726 832 P-2: 2200 VA 101 592 77 609 208 P-1: >2200 VA s/d 200 kVA 890 846 846 620 865 P-2: >200 kVA P-3 1 800 822 1 578 431 724
VI. Penerangan Jalan 4 462 043 3 729 726 928Street Lighting
T : > 200 kVA 0 0 C : > 200 kVA 356 644 178 753 750 M 4 105 399 3 550 973 178
2009 71 220 398 42 045 900 9612008 67 706 269 37 735 556 5852007 52 815 496 27 281 321 9472006 40 786 866 17 379 069 042
47 762 901 429
Kab. Batang Hari / Batang Hari Regency
Jumlah / Total 2010 80 540 689
400 Jambi Dalam Angka 2010

MANUFACTURING, MINING, AND ENERGY
Lanjutan Tabel / Continued Table 6.3.7
Golongan Tarif Penggunaan NilaiRate Group Consumption Value
(Kwh) (Rp)(1) (2) (3)
I. Sekolah/Sosial 727 340 324 869 681 School/Social S-1 : 220 VA 0 0 S-2 : 450 VA 107 073 29 010 170 S-2 : 900 VA 159 764 50 815 145 S-2 : 1300 89 952 42 590 381 S-2 : 2200 87 222 43 749 288 S-2 : >2200 s/d 200 kVA 283 329 158 704 697 S-3 : 200 kVA
II. Rumah Tangga / Household 19 469 176 8 608 600 028 R-1: 450 VA 6 712 128 2 493 362 615 R-1: 900 VA 9 589 142 4 238 633 137 R-1 : 1300 VA 2 750 655 1 631 592 964 R-1: 2200 VA 298 341 159 763 285 R-2: >2200 s/d 6600 VA 42 056 21 784 761 R-3: >6600 VA 76 854 63 463 266
III. Perdagangan / Trade 1 485 344 1 329 536 102 B-1: 450 VA 30 791 6 540 076 B-1: 900 VA 66 845 18 521 640 B-1: 1300 VA 117 837 67 630 539 B-2: 2200 VA 128 018 88 268 559 B-2: >2200 VA s/d 200 kVA 1 141 853 1 148 575 288 B-3: > 200 kVA 0 0
Kab. Muaro Jambi/ Muaro Jambi Regency
Jambi In Figures 2010 401
PERINDUSTRIAN, PERTAMBANGAN, DAN ENERGI
Lanjutan Tabel / Continued Table 6.3.7
Golongan Tarif Penggunaan NilaiRate Group Consumption Value
(Kwh) (Rp)(1) (2) (3)
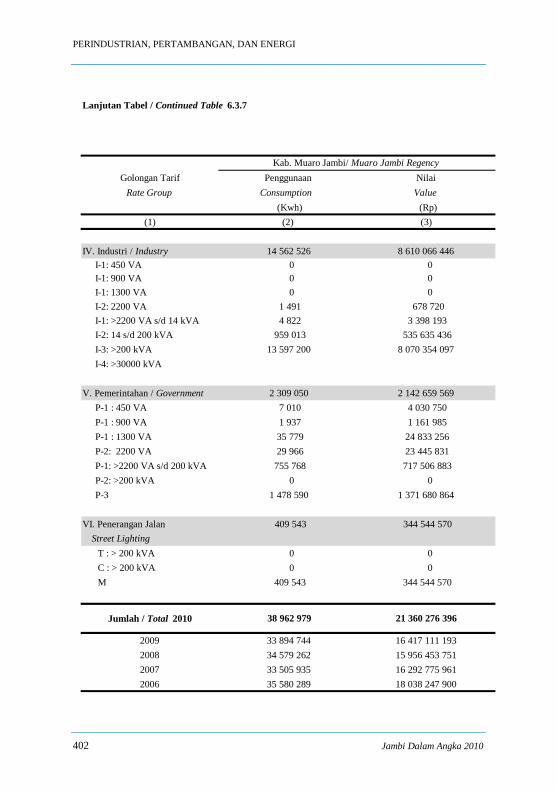
IV. Industri / Industry 14 562 526 8 610 066 446 I-1: 450 VA 0 0 I-1: 900 VA 0 0 I-1: 1300 VA 0 0 I-2: 2200 VA 1 491 678 720 I-1: >2200 VA s/d 14 kVA 4 822 3 398 193 I-2: 14 s/d 200 kVA 959 013 535 635 436 I-3: >200 kVA 13 597 200 8 070 354 097 I-4: >30000 kVA
V. Pemerintahan / Government 2 309 050 2 142 659 569 P-1 : 450 VA 7 010 4 030 750 P-1 : 900 VA 1 937 1 161 985 P-1 : 1300 VA 35 779 24 833 256 P-2: 2200 VA 29 966 23 445 831 P-1: >2200 VA s/d 200 kVA 755 768 717 506 883 P-2: >200 kVA 0 0 P-3 1 478 590 1 371 680 864
VI. Penerangan Jalan 409 543 344 544 570Street Lighting
T : > 200 kVA 0 0 C : > 200 kVA 0 0 M 409 543 344 544 570
2009 33 894 744 16 417 111 1932008 34 579 262 15 956 453 7512007 33 505 935 16 292 775 9612006 35 580 289 18 038 247 900
Kab. Muaro Jambi/ Muaro Jambi Regency
Jumlah / Total 2010 38 962 979 21 360 276 396
402 Jambi Dalam Angka 2010

MANUFACTURING, MINING, AND ENERGY
Lanjutan Tabel / Continued Table 6.3.7
Golongan Tarif Penggunaan NilaiRate Group Consumption Value
(Kwh) (Rp)(1) (2) (3)
I. Sekolah/Sosial 1 925 233 1 099 343 224 School/Social S-1 : 220 VA 0 0 S-2 : 450 VA 119 152 39 435 221 S-2 : 900 VA 215 797 87 941 990 S-2 : 1300 355 098 199 407 769 S-2 : 2200 116 309 67 030 889 S-2 : >2200 s/d 200 kVA 1 118 877 705 527 355 S-3 : 200 kVA 0 0
II. Rumah Tangga / Household 40 113 031 25 212 928 680 R-1: 450 VA 6 992 880 3 112 654 398 R-1: 900 VA 10 647 429 5 929 845 948 R-1 : 1300 VA 20 469 050 14 695 234 835 R-1: 2200 VA 1 250 134 828 402 349 R-2: >2200 s/d 6600 VA 603 860 462 573 343 R-3: >6600 VA 149 678 184 217 807
III. Perdagangan / Trade 13 873 863 12 264 390 630 B-1: 450 VA 140 764 66 142 525 B-1: 900 VA 412 399 265 861 710 B-1: 1300 VA 3 040 169 2 002 928 560 B-2: 2200 VA 2 646 306 1 958 562 097 B-2: >2200 VA s/d 200 kVA 7 634 225 7 970 895 738 B-3: > 200 kVA 0 0
Kab. Bungo/ Bungo Regency
Jambi In Figures 2010 403

PERINDUSTRIAN, PERTAMBANGAN, DAN ENERGI
Lanjutan Tabel / Continued Table 6.3.7
Golongan Tarif Penggunaan NilaiRate Group Consumption Value
(Kwh) (Rp)(1) (2) (3)
IV. Industri / Industry 1 729 517 1 770 168 082 I-1: 450 VA 0 0 I-1: 900 VA 0 0 I-1: 1300 VA 0 0 I-2: 2200 VA 6 168 3 909 185 I-1: >2200 VA s/d 14 kVA 14 047 9 694 852 I-2: 14 s/d 200 kVA 99 702 92 027 400 I-3: >200 kVA 1 609 600 1 664 536 645 I-4: >30000 kVA
V. Pemerintahan / Government 3 246 309 3 022 386 374 P-1 : 450 VA 10 634 6 654 553 P-1 : 900 VA 32 141 22 251 360 P-1 : 1300 VA 117 750 91 170 207 P-2: 2200 VA 131 952 103 698 015 P-1: >2200 VA s/d 200 kVA 901 743 1 008 445 662 P-2: >200 kVA 0 0 P-3 2 052 089 1 790 166 577
VI. Penerangan Jalan 784 000 487 255 800Street Lighting
T : > 200 kVA 0 0 C : > 200 kVA 784 000 487 255 800 M 0 0
2009 72 958 352 53 410 862 5052008 71 830 157 36 091 248 9792007 59 572 681 30 406 531 1952006 48 624 911 22 402 172 990
Jumlah / Total 2010 61 671 953 43 856 472 790
Kab. Bungo/ Bungo Regency
404 Jambi Dalam Angka 2010
MANUFACTURING, MINING, AND ENERGY
Lanjutan Tabel / Continued Table 6.3.7
Golongan Tarif Penggunaan NilaiRate Group Consumption Value
(Kwh) (Rp)(1) (2) (3)
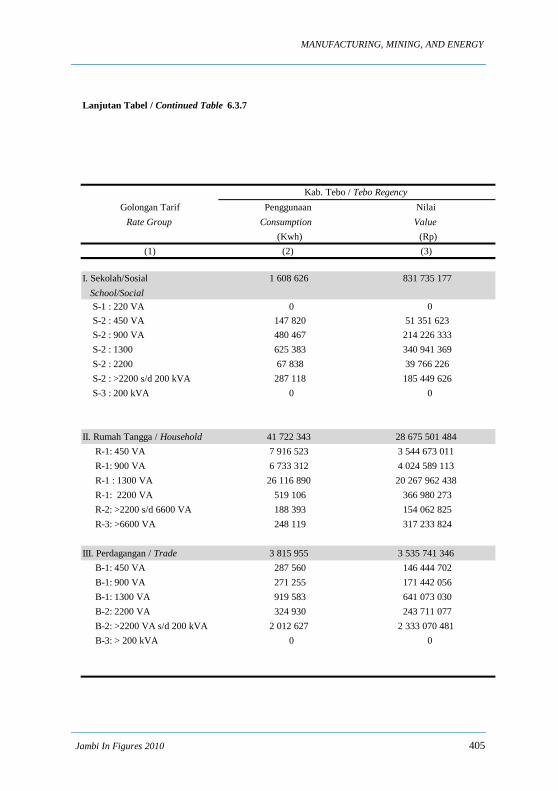
I. Sekolah/Sosial 1 608 626 831 735 177 School/Social S-1 : 220 VA 0 0 S-2 : 450 VA 147 820 51 351 623 S-2 : 900 VA 480 467 214 226 333 S-2 : 1300 625 383 340 941 369 S-2 : 2200 67 838 39 766 226 S-2 : >2200 s/d 200 kVA 287 118 185 449 626 S-3 : 200 kVA 0 0
II. Rumah Tangga / Household 41 722 343 28 675 501 484 R-1: 450 VA 7 916 523 3 544 673 011 R-1: 900 VA 6 733 312 4 024 589 113 R-1 : 1300 VA 26 116 890 20 267 962 438 R-1: 2200 VA 519 106 366 980 273 R-2: >2200 s/d 6600 VA 188 393 154 062 825 R-3: >6600 VA 248 119 317 233 824
III. Perdagangan / Trade 3 815 955 3 535 741 346 B-1: 450 VA 287 560 146 444 702 B-1: 900 VA 271 255 171 442 056 B-1: 1300 VA 919 583 641 073 030 B-2: 2200 VA 324 930 243 711 077 B-2: >2200 VA s/d 200 kVA 2 012 627 2 333 070 481 B-3: > 200 kVA 0 0
Kab. Tebo / Tebo Regency
Jambi In Figures 2010 405
PERINDUSTRIAN, PERTAMBANGAN, DAN ENERGI
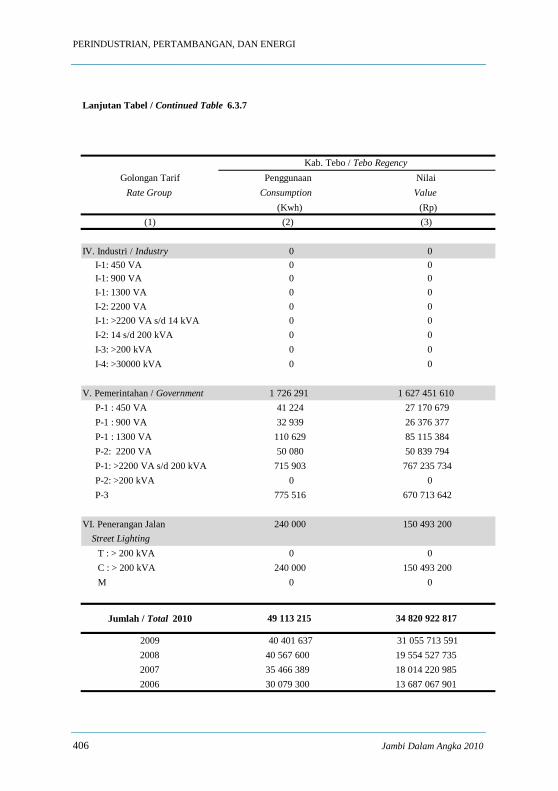
Lanjutan Tabel / Continued Table 6.3.7
Golongan Tarif Penggunaan NilaiRate Group Consumption Value
(Kwh) (Rp)(1) (2) (3)
IV. Industri / Industry 0 0 I-1: 450 VA 0 0 I-1: 900 VA 0 0 I-1: 1300 VA 0 0 I-2: 2200 VA 0 0 I-1: >2200 VA s/d 14 kVA 0 0 I-2: 14 s/d 200 kVA 0 0 I-3: >200 kVA 0 0 I-4: >30000 kVA 0 0
V. Pemerintahan / Government 1 726 291 1 627 451 610 P-1 : 450 VA 41 224 27 170 679 P-1 : 900 VA 32 939 26 376 377 P-1 : 1300 VA 110 629 85 115 384 P-2: 2200 VA 50 080 50 839 794 P-1: >2200 VA s/d 200 kVA 715 903 767 235 734 P-2: >200 kVA 0 0 P-3 775 516 670 713 642
VI. Penerangan Jalan 240 000 150 493 200Street Lighting
T : > 200 kVA 0 0 C : > 200 kVA 240 000 150 493 200 M 0 0
2009 40 401 637 31 055 713 5912008 40 567 600 19 554 527 7352007 35 466 389 18 014 220 9852006 30 079 300 13 687 067 901
Kab. Tebo / Tebo Regency
Jumlah / Total 2010 49 113 215 34 820 922 817
406 Jambi Dalam Angka 2010

MANUFACTURING, MINING, AND ENERGY
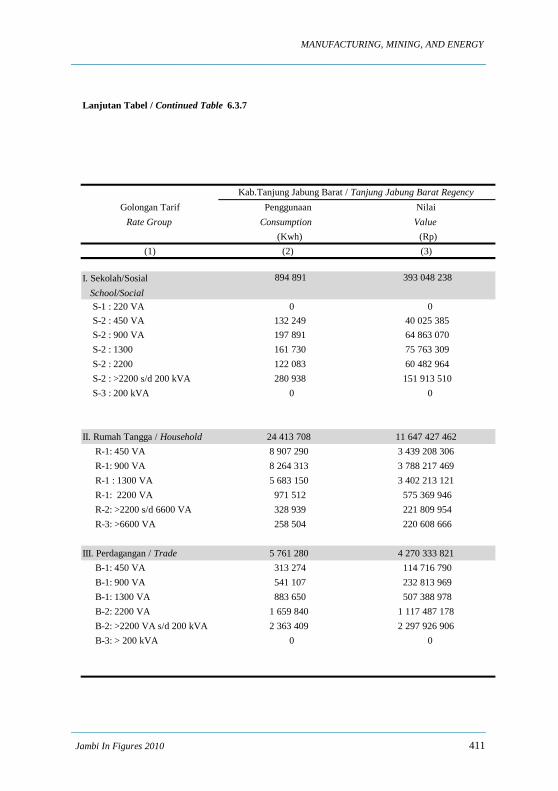
Lanjutan Tabel / Continued Table 6.3.7
Golongan Tarif Penggunaan NilaiRate Group Consumption Value
(Kwh) (Rp)(1) (2) (3)
I. Sekolah/Sosial 1 803 449 952 784 022 School/Social S-1 : 220 VA 0 0 S-2 : 450 VA 346 875 124 508 310 S-2 : 900 VA 377 573 172 465 471 S-2 : 1300 628 625 379 870 179 S-2 : 2200 72 738 42 741 636 S-2 : >2200 s/d 200 kVA 377 638 233 198 426 S-3 : 200 kVA 0 0
II. Rumah Tangga / Household 53 849 611 38 446 575 375 R-1: 450 VA 12 094 857 5 638 764 974 R-1: 900 VA 8 418 313 5 240 892 760 R-1 : 1300 VA 32 059 965 26 499 863 355 R-1: 2200 VA 865 683 635 474 464 R-2: >2200 s/d 6600 VA 293 480 271 049 170 R-3: >6600 VA 117 313 160 530 652
III. Perdagangan / Trade 6 737 076 5 898 361 511 B-1: 450 VA 245 051 127 580 781 B-1: 900 VA 309 470 198 535 195 B-1: 1300 VA 1 658 661 1 211 590 090 B-2: 2200 VA 1 734 748 1 160 579 055 B-2: >2200 VA s/d 200 kVA 2 789 146 3 200 076 390 B-3: > 200 kVA 0 0
Kab. Merangin / Merangin Regency
Jambi In Figures 2010 407

PERINDUSTRIAN, PERTAMBANGAN, DAN ENERGI
Lanjutan Tabel / Continued Table 6.3.7
Golongan Tarif Penggunaan NilaiRate Group Consumption Value
(Kwh) (Rp)(1) (2) (3)
IV. Industri / Industry 2 209 014 1 350 518 908 I-1: 450 VA 0 0 I-1: 900 VA 0 0 I-1: 1300 VA 0 0 I-2: 2200 VA 0 0 I-1: >2200 VA s/d 14 kVA 1 203 814 808 828 716 I-2: 14 s/d 200 kVA 0 0 I-3: >200 kVA 1 005 200 541 690 192 I-4: >30000 kVA 0 0
V. Pemerintahan / Government 2 898 193 2 555 606 799 P-1 : 450 VA 37 033 23 780 691 P-1 : 900 VA 126 916 89 298 486 P-1 : 1300 VA 227 193 173 372 112 P-2: 2200 VA 82 873 69 675 657 P-1: >2200 VA s/d 200 kVA 1 047 344 1 120 624 207 P-2: >200 kVA 0 0 P-3 1 376 834 1 078 855 646
VI. Penerangan Jalan 0 0Street Lighting
T : > 200 kVA 0 0 C : > 200 kVA 0 0 M 0 0
2009 60 431 994 43 638 517 235
2008 56 688 897 28 495 924 4322007 47 007 965 22 508 556 6072006 40 224 700 17 776 130 918
Kab. Merangin / Merangin Regency
Jumlah / Total 2010 67 497 343 49 203 846 615
408 Jambi Dalam Angka 2010
MANUFACTURING, MINING, AND ENERGY
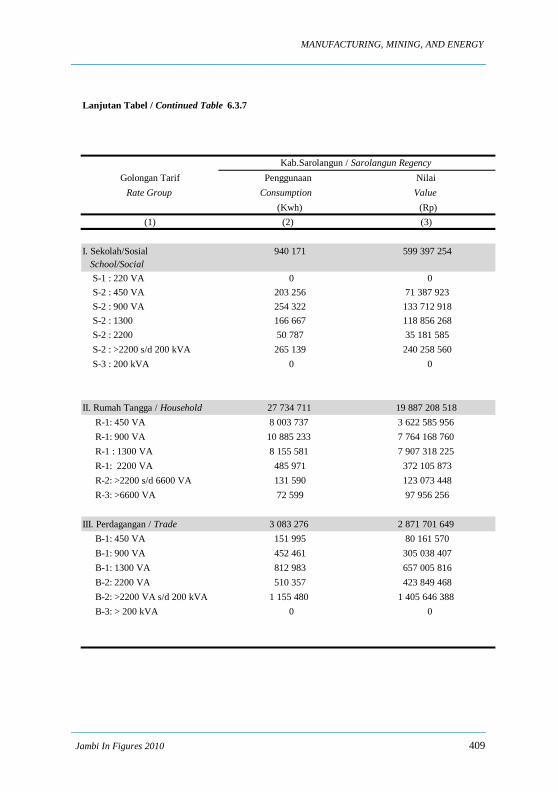
Lanjutan Tabel / Continued Table 6.3.7
Golongan Tarif Penggunaan NilaiRate Group Consumption Value
(Kwh) (Rp)(1) (2) (3)
I. Sekolah/Sosial 940 171 599 397 254 School/Social S-1 : 220 VA 0 0 S-2 : 450 VA 203 256 71 387 923 S-2 : 900 VA 254 322 133 712 918 S-2 : 1300 166 667 118 856 268 S-2 : 2200 50 787 35 181 585 S-2 : >2200 s/d 200 kVA 265 139 240 258 560 S-3 : 200 kVA 0 0
II. Rumah Tangga / Household 27 734 711 19 887 208 518 R-1: 450 VA 8 003 737 3 622 585 956 R-1: 900 VA 10 885 233 7 764 168 760 R-1 : 1300 VA 8 155 581 7 907 318 225 R-1: 2200 VA 485 971 372 105 873 R-2: >2200 s/d 6600 VA 131 590 123 073 448 R-3: >6600 VA 72 599 97 956 256
III. Perdagangan / Trade 3 083 276 2 871 701 649 B-1: 450 VA 151 995 80 161 570 B-1: 900 VA 452 461 305 038 407 B-1: 1300 VA 812 983 657 005 816 B-2: 2200 VA 510 357 423 849 468 B-2: >2200 VA s/d 200 kVA 1 155 480 1 405 646 388 B-3: > 200 kVA 0 0
Kab.Sarolangun / Sarolangun Regency
Jambi In Figures 2010 409
PERINDUSTRIAN, PERTAMBANGAN, DAN ENERGI
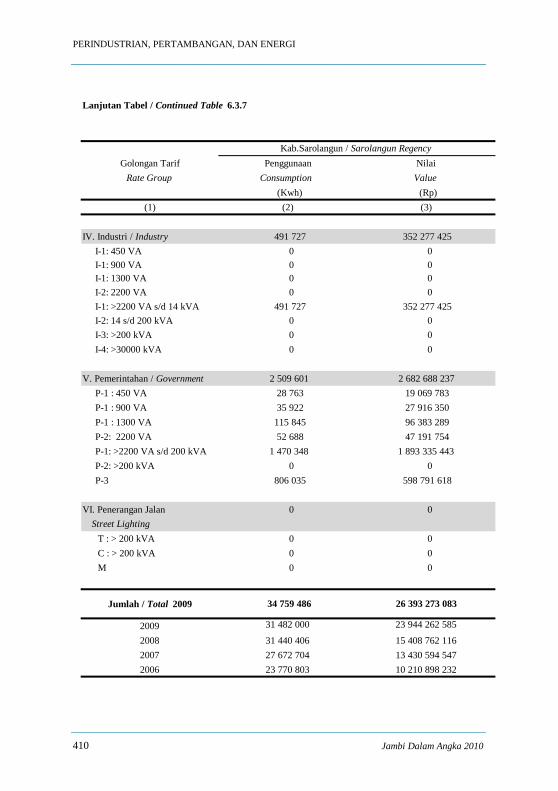
Lanjutan Tabel / Continued Table 6.3.7
Golongan Tarif Penggunaan NilaiRate Group Consumption Value
(Kwh) (Rp)(1) (2) (3)
IV. Industri / Industry 491 727 352 277 425 I-1: 450 VA 0 0 I-1: 900 VA 0 0 I-1: 1300 VA 0 0 I-2: 2200 VA 0 0 I-1: >2200 VA s/d 14 kVA 491 727 352 277 425 I-2: 14 s/d 200 kVA 0 0 I-3: >200 kVA 0 0 I-4: >30000 kVA 0 0
V. Pemerintahan / Government 2 509 601 2 682 688 237 P-1 : 450 VA 28 763 19 069 783 P-1 : 900 VA 35 922 27 916 350 P-1 : 1300 VA 115 845 96 383 289 P-2: 2200 VA 52 688 47 191 754 P-1: >2200 VA s/d 200 kVA 1 470 348 1 893 335 443 P-2: >200 kVA 0 0 P-3 806 035 598 791 618
VI. Penerangan Jalan 0 0Street Lighting
T : > 200 kVA 0 0 C : > 200 kVA 0 0 M 0 0
2009 31 482 000 23 944 262 585
2008 31 440 406 15 408 762 1162007 27 672 704 13 430 594 5472006 23 770 803 10 210 898 232
Kab.Sarolangun / Sarolangun Regency
Jumlah / Total 2009 34 759 486 26 393 273 083
410 Jambi Dalam Angka 2010
MANUFACTURING, MINING, AND ENERGY
Lanjutan Tabel / Continued Table 6.3.7
Golongan Tarif Penggunaan NilaiRate Group Consumption Value
(Kwh) (Rp)(1) (2) (3)
I. Sekolah/Sosial 894 891 393 048 238 School/Social S-1 : 220 VA 0 0 S-2 : 450 VA 132 249 40 025 385 S-2 : 900 VA 197 891 64 863 070 S-2 : 1300 161 730 75 763 309 S-2 : 2200 122 083 60 482 964 S-2 : >2200 s/d 200 kVA 280 938 151 913 510 S-3 : 200 kVA 0 0
II. Rumah Tangga / Household 24 413 708 11 647 427 462 R-1: 450 VA 8 907 290 3 439 208 306 R-1: 900 VA 8 264 313 3 788 217 469 R-1 : 1300 VA 5 683 150 3 402 213 121 R-1: 2200 VA 971 512 575 369 946 R-2: >2200 s/d 6600 VA 328 939 221 809 954 R-3: >6600 VA 258 504 220 608 666
III. Perdagangan / Trade 5 761 280 4 270 333 821 B-1: 450 VA 313 274 114 716 790 B-1: 900 VA 541 107 232 813 969 B-1: 1300 VA 883 650 507 388 978 B-2: 2200 VA 1 659 840 1 117 487 178 B-2: >2200 VA s/d 200 kVA 2 363 409 2 297 926 906 B-3: > 200 kVA 0 0
Kab.Tanjung Jabung Barat / Tanjung Jabung Barat Regency
Jambi In Figures 2010 411

PERINDUSTRIAN, PERTAMBANGAN, DAN ENERGI
Lanjutan Tabel / Continued Table 6.3.7
Golongan Tarif Penggunaan NilaiRate Group Consumption Value
(Kwh) (Rp)(1) (2) (3)
IV. Industri / Industry 2 212 182 1 322 844 135 I-1: 450 VA 0 0 I-1: 900 VA 0 0 I-1: 1300 VA 0 0 I-2: 2200 VA 0 0 I-1: >2200 VA s/d 14 kVA 72 148 41 157 422 I-2: 14 s/d 200 kVA 2 140 034 1 281 686 713 I-3: >200 kVA 0 0 I-4: >30000 kVA 0 0
V. Pemerintahan / Government 3 214 659 2 930 913 949 P-1 : 450 VA 24 746 14 225 350 P-1 : 900 VA 60 648 36 384 372 P-1 : 1300 VA 131 518 90 761 793 P-2: 2200 VA 109 711 83 618 275 P-1: >2200 VA s/d 200 kVA 1 089 484 1 112 055 131 P-2: >200 kVA 0 0 P-3 1 798 552 1 593 869 028
VI. Penerangan Jalan 2 137 469 1 788 024 604Street Lighting
T : > 200 kVA 0 0 C : > 200 kVA 0 0 M 2 137 469 1 788 024 604
2009 35 073 462 18 715 747 6092008 33 964 681 17 377 759 2762007 30 458 923 15 993 246 9092006 29 212 800 13 698 612 275
Kab.Tanjung Jabung Barat / Tanjung Jabung Barat Regency
Jumlah / Total 2010 38 634 189 22 352 592 209
412 Jambi Dalam Angka 2010
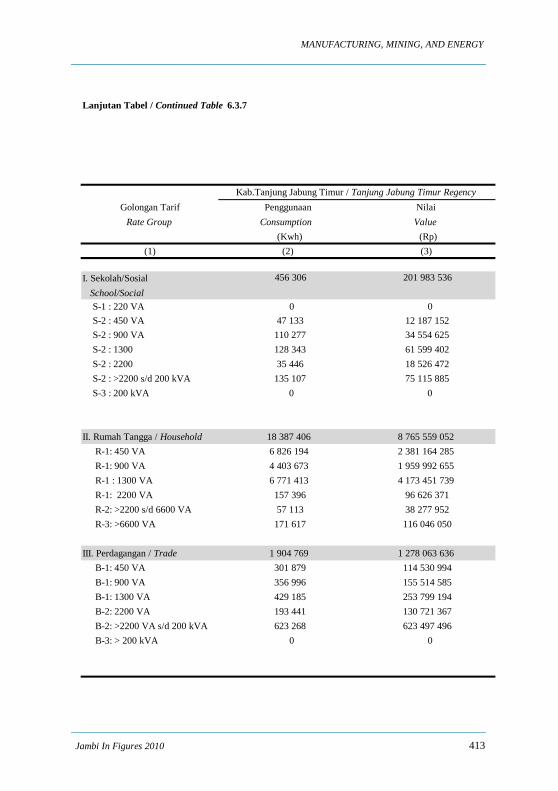
MANUFACTURING, MINING, AND ENERGY
Lanjutan Tabel / Continued Table 6.3.7
Golongan Tarif Penggunaan NilaiRate Group Consumption Value
(Kwh) (Rp)(1) (2) (3)
I. Sekolah/Sosial 456 306 201 983 536 School/Social S-1 : 220 VA 0 0 S-2 : 450 VA 47 133 12 187 152 S-2 : 900 VA 110 277 34 554 625 S-2 : 1300 128 343 61 599 402 S-2 : 2200 35 446 18 526 472 S-2 : >2200 s/d 200 kVA 135 107 75 115 885 S-3 : 200 kVA 0 0
II. Rumah Tangga / Household 18 387 406 8 765 559 052 R-1: 450 VA 6 826 194 2 381 164 285 R-1: 900 VA 4 403 673 1 959 992 655 R-1 : 1300 VA 6 771 413 4 173 451 739 R-1: 2200 VA 157 396 96 626 371 R-2: >2200 s/d 6600 VA 57 113 38 277 952 R-3: >6600 VA 171 617 116 046 050
III. Perdagangan / Trade 1 904 769 1 278 063 636 B-1: 450 VA 301 879 114 530 994 B-1: 900 VA 356 996 155 514 585 B-1: 1300 VA 429 185 253 799 194 B-2: 2200 VA 193 441 130 721 367 B-2: >2200 VA s/d 200 kVA 623 268 623 497 496 B-3: > 200 kVA 0 0
Kab.Tanjung Jabung Timur / Tanjung Jabung Timur Regency
Jambi In Figures 2010 413
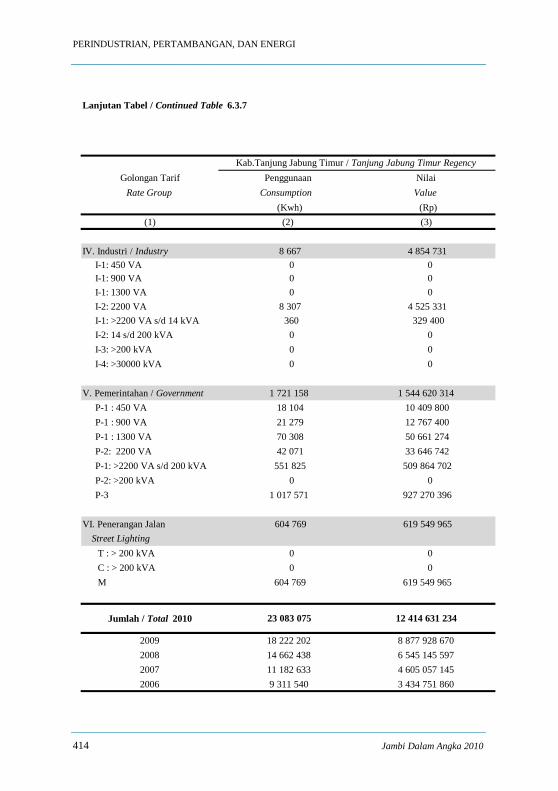
PERINDUSTRIAN, PERTAMBANGAN, DAN ENERGI
Lanjutan Tabel / Continued Table 6.3.7
Golongan Tarif Penggunaan NilaiRate Group Consumption Value
(Kwh) (Rp)(1) (2) (3)
IV. Industri / Industry 8 667 4 854 731 I-1: 450 VA 0 0 I-1: 900 VA 0 0 I-1: 1300 VA 0 0 I-2: 2200 VA 8 307 4 525 331 I-1: >2200 VA s/d 14 kVA 360 329 400 I-2: 14 s/d 200 kVA 0 0 I-3: >200 kVA 0 0 I-4: >30000 kVA 0 0
V. Pemerintahan / Government 1 721 158 1 544 620 314 P-1 : 450 VA 18 104 10 409 800 P-1 : 900 VA 21 279 12 767 400 P-1 : 1300 VA 70 308 50 661 274 P-2: 2200 VA 42 071 33 646 742 P-1: >2200 VA s/d 200 kVA 551 825 509 864 702 P-2: >200 kVA 0 0 P-3 1 017 571 927 270 396
VI. Penerangan Jalan 604 769 619 549 965Street Lighting
T : > 200 kVA 0 0 C : > 200 kVA 0 0 M 604 769 619 549 965
2009 18 222 202 8 877 928 6702008 14 662 438 6 545 145 5972007 11 182 633 4 605 057 1452006 9 311 540 3 434 751 860
Kab.Tanjung Jabung Timur / Tanjung Jabung Timur Regency
Jumlah / Total 2010 23 083 075 12 414 631 234
414 Jambi Dalam Angka 2010

MANUFACTURING, MINING, AND ENERGY
Lanjutan Tabel / Continued Table 6.3.7
Golongan Tarif Penggunaan NilaiRate Group Consumption Value
(Kwh) (Rp)(1) (2) (3)
I. Sekolah/Sosial 27 123 686 13 274 978 815 School/Social S-1 : 220 VA 0 0 S-2 : 450 VA 2 827 531 844 494 943 S-2 : 900 VA 4 260 489 1 458 553 115 S-2 : 1300 3 999 489 2 092 990 669 S-2 : 2200 1 497 647 782 587 803 S-2 : >2200 s/d 200 kVA 10 584 530 6 088 437 579 S-3 : 200 kVA 3 954 000 2 007 914 706
II. Rumah Tangga / Household 666 268 268 360 138 341 045 R-1: 450 VA 163 356 377 63 788 491 500 R-1: 900 VA 217 640 366 104 039 453 694 R-1 : 1300 VA 226 171 755 152 979 170 894 R-1: 2200 VA 36 918 761 22 139 402 643 R-2: >2200 s/d 6600 VA 15 567 926 10 665 014 928 R-3: >6600 VA 6 613 083 6 526 807 386
III. Perdagangan / Trade 176 843 813 149 090 758 412 B-1: 450 VA 3 549 756 1 342 701 935 B-1: 900 VA 7 280 187 3 290 185 632 B-1: 1300 VA 20 010 397 12 706 508 328 B-2: 2200 VA 27 513 797 19 496 211 529 B-2: >2200 VA s/d 200 kVA 88 010 836 89 649 341 025 B-3: > 200 kVA 0 0
Provinsi Jambi / Jambi Province
Jambi In Figures 2010 415

PERINDUSTRIAN, PERTAMBANGAN, DAN ENERGI
Lanjutan Tabel / Continued Table 6.3.7
Golongan Tarif Penggunaan NilaiRate Group Consumption Value
(Kwh) (Rp)(1) (2) (3)
IV. Industri / Industry 100 867 476 68 148 424 954 I-1: 450 VA 0 0 I-1: 900 VA 0 0 I-1: 1300 VA 6 236 3 494 385 I-2: 2200 VA 47 599 26 213 575 I-1: >2200 VA s/d 14 kVA 2 088 553 1 409 610 647 I-2: 14 s/d 200 kVA 16 624 208 10 090 257 752 I-3: >200 kVA 82 100 880 56 618 848 595 I-4: >30000 kVA 0 0
V. Pemerintahan / Government 55 309 228 50 160 437 747 P-1 : 450 VA 295 064 178 694 781 P-1 : 900 VA 638 485 412 173 487 P-1 : 1300 VA 1 747 895 1 271 451 148 P-2: 2200 VA 1 346 180 1 053 940 269 P-1: >2200 VA s/d 200 kVA 19 165 886 20 006 020 635 P-2: >200 kVA 1 410 600 874 432 276 P-3 30 705 118 26 363 725 151
VI. Penerangan Jalan 8 637 824 7 119 595 067 Street Lighting
T : > 200 kVA 0 0 C : > 200 kVA 1 380 644 816 502 750 M 7 257 180 6 303 092 317
2009 595 950 905 336 785 590 6872008 731 307 562 375 516 458 6442007 646 294 714 322 481 527 9822006 349 673 285 141 009 812 141
Sumber : PLN Regional S2JB Cabang Jambi dan BungoSource : Public Electricity Service of Regional S2JB Branche of Jambi and BungoKet : Jumlah Penggunaan dan Nilai Produksi belum termasuk Kabupaten KerinciNote : Total of power and value of electricity utilization exclude Kerinci Regency
Provinsi Jambi / Jambi Province
Jumlah / Total 2010 1 035 050 295 647 932 536 040
416 Jambi Dalam Angka 2010

MANUFACTURING, MINING, AND ENERGY
Tabel 6.3.8 Produksi Tenaga Listrik yang Dibangkitkan, DisalurkanTable dan yang Terjual pada Cabang PLN Jambi Tahun 1996-2010
Electricity Produced, Distributed and Sold by StateElectrical Company in Jambi, 1996- 2010
NilaiTahun Produksi Disalurkan Dijual PenjualanYear Production Distributed Sold Value
(Kwh) (Kwh) (Kwh) (Rp.000)(1) (2) (3) (4) (5)
1996 235 314 444 233 660 540 194 329 475 33 787 579
1997 305 645 354 296 827 350 252 384 948 43 466 726
1998 347 730 700 325 232 397 273 819 723 56 696 963
1999 366 748 658 363 812 420 302 713 204 65 435 350
2000 403 987 564 401 385 032 338 127 133 87 139 847
2001 451 845 057 449 335 316 385 744 900 119 019 109
2002 465 335 961 462 359 226 388 216 790 172 555 839
2003 504 722 176 504 722 176 420 188 268 237 457 704
2004 564 091 566 547 809 415 469 821 450 281 458 597
2005 599 894 854 598 285 204 525 755 808 318 433 377
2006 657 378 149 655 801 947 578 407 677 358 345 727
2007 742 574 034 741 010 496 654 553 848 417 214 140
2008 813 987 762 812 395 310 739 960 164 495 677 576
2009 652 884 402 652 402 419 599 189 857 421 821 390
2010 757 409 430 757 144 423 685 769 127 514 421 428Sumber : PLN Regional S2JB Cabang JambiSource : Public Electricity Service of Regional S2JB Branche of Jambi
Jumlah Tenaga Listrik / Number of Electrical
Jambi In Figures 2010 417
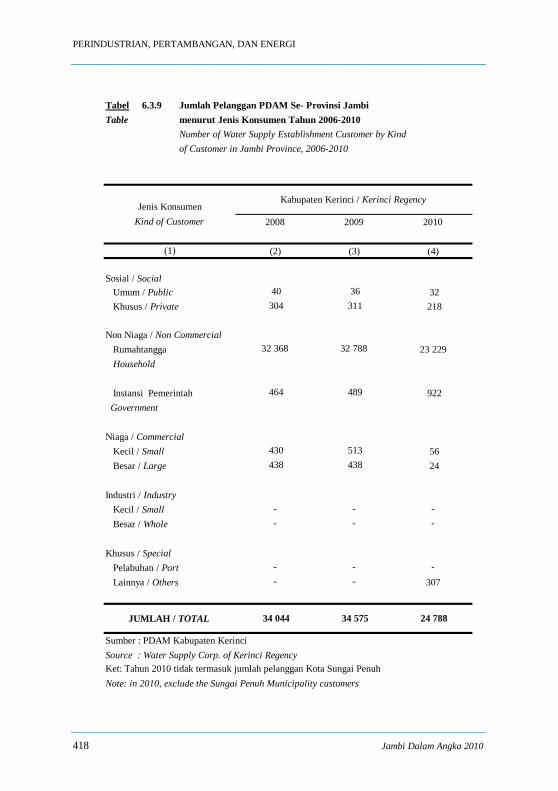
PERINDUSTRIAN, PERTAMBANGAN, DAN ENERGI
Tabel 6.3.9 Jumlah Pelanggan PDAM Se- Provinsi Jambi Table menurut Jenis Konsumen Tahun 2006-2010
Number of Water Supply Establishment Customer by Kind of Customer in Jambi Province, 2006-2010
2008 2009 2010
(2) (3) (4)
Sosial / Social Umum / Public 40 36 32 Khusus / Private 304 311 218
Non Niaga / Non Commercial Rumahtangga 32 368 32 788 23 229 Household
Instansi Pemerintah 464 489 922 Government
Niaga / Commercial Kecil / Small 430 513 56 Besar / Large 438 438 24
Industri / Industry Kecil / Small - - - Besar / Whole - - -
Khusus / Special Pelabuhan / Port - - - Lainnya / Others - - 307
Sumber : PDAM Kabupaten KerinciSource : Water Supply Corp. of Kerinci RegencyKet: Tahun 2010 tidak termasuk jumlah pelanggan Kota Sungai PenuhNote: in 2010, exclude the Sungai Penuh Municipality customers
JUMLAH / TOTAL
Jenis KonsumenKind of Customer
(1)
Kabupaten Kerinci / Kerinci Regency
34 044 34 575 24 788
418 Jambi Dalam Angka 2010

MANUFACTURING, MINING, AND ENERGY
Lanjutan Tabel / Continued Table 6.3.9
Jenis KonsumenKind of Customer 2008 2009 2010
(1) (2) (3) (4)
Sosial / Social Umum / Public 46 46 Khusus / Private 62 61
Non Niaga / Non Commercial Rumahtangga 5 391 5 519 5 559 Household
Instansi Pemerintah - 31 78 Government
Niaga / Commercial Kecil / Small 434 487 Besar / Large 3 3
Industri / Industry Kecil / Small - - - Besar / Whole - - -
Khusus / Special Pelabuhan / Port - - - Lainnya / Others - 6 -
Sumber : PDAM Kabupaten MeranginSource : Water Supply Corp. of Merangin Regency
JUMLAH / TOTAL 5 936 6 153 6 244
107
500
Kabupaten Merangin / Merangin Regency
Jambi In Figures 2010 419
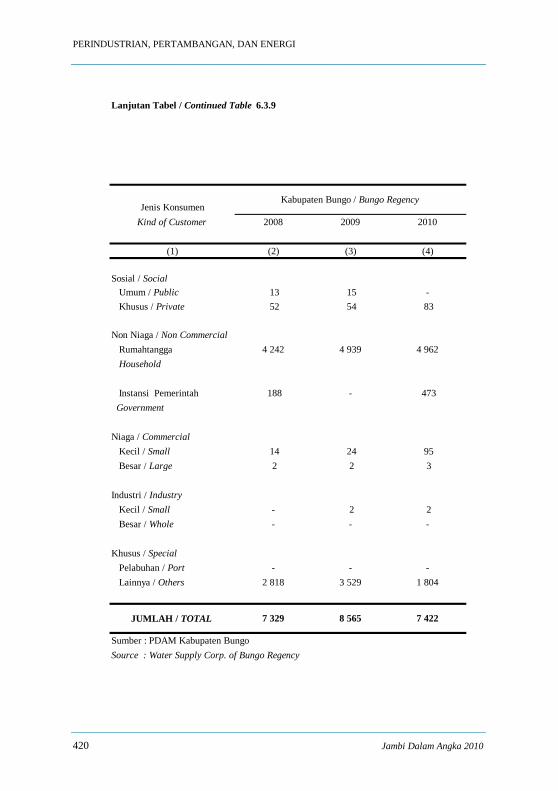
PERINDUSTRIAN, PERTAMBANGAN, DAN ENERGI
Lanjutan Tabel / Continued Table 6.3.9
Jenis KonsumenKind of Customer 2008 2009 2010
(1) (2) (3) (4)
Sosial / Social Umum / Public 13 15 - Khusus / Private 52 54 83
Non Niaga / Non Commercial Rumahtangga 4 242 4 939 4 962 Household
Instansi Pemerintah 188 - 473 Government
Niaga / Commercial Kecil / Small 14 24 95 Besar / Large 2 2 3
Industri / Industry Kecil / Small - 2 2 Besar / Whole - - -
Khusus / Special Pelabuhan / Port - - - Lainnya / Others 2 818 3 529 1 804
Sumber : PDAM Kabupaten BungoSource : Water Supply Corp. of Bungo Regency
Kabupaten Bungo / Bungo Regency
JUMLAH / TOTAL 7 329 8 565 7 422
420 Jambi Dalam Angka 2010

MANUFACTURING, MINING, AND ENERGY
Lanjutan Tabel / Continued Table 6.3.9
Jenis KonsumenKind of Customer 2008 2009 2010
(1) (2) (3) (4)
Sosial / Social Umum / Public - - - Khusus / Private 48 49 53
Non Niaga / Non Commercial Rumahtangga 1 897 2 025 2 154 Household
Instansi Pemerintah - - - Government
Niaga / Commercial Kecil / Small 41 40 38 Besar / Large 2 2 -
Industri / Industry Kecil / Small - - - Besar / Whole 2 1 1
Khusus / Special Pelabuhan / Port - - - Lainnya / Others - - -
Sumber : PDAM Kabupaten TeboSource : Water Supply Corp. of Tebo Regency
Kabupaten Tebo / Tebo Regency
JUMLAH / TOTAL 1 990 2 117 2 246
Jambi In Figures 2010 421

PERINDUSTRIAN, PERTAMBANGAN, DAN ENERGI
Lanjutan Tabel / Continued Table 6.3.9
Jenis KonsumenKind of Customer 2008 2009 2010
(1) (2) (3) (4)
Sosial / Social Umum / Public 14 14 Khusus / Private 50 48
Non Niaga / Non Commercial Rumahtangga 3 478 3 405 3 433 Household
Instansi Pemerintah 85 95 84 Government
Niaga / Commercial Kecil / Small 76 61 Besar / Large 204 193
Industri / Industry Kecil / Small - - - Besar / Whole - - -
Khusus / Special Pelabuhan / Port - 1 - Lainnya / Others 8 - 10
Sumber : PDAM Kabupaten Batang HariSource : Water Supply Corp. of Batang Hari Regency
64
Kabupaten Batang Hari / Batang Hari Regency
JUMLAH / TOTAL 3 915 3 817 3 836
245
422 Jambi Dalam Angka 2010

MANUFACTURING, MINING, AND ENERGY
Lanjutan Tabel / Continued Table 6.3.9
Jenis KonsumenKind of Customer 2008 2009 2010
(1) (2) (3) (4)
Sosial / Social Umum / Public 25 21 19 Khusus / Private 93 112
Non Niaga / Non Commercial Rumahtangga 3 626 4 358 4 866 Household
Instansi Pemerintah 132 138 144 Government
Niaga / Commercial Kecil / Small 503 582 Besar / Large - 1
Industri / Industry Kecil / Small - - - Besar / Whole - - -
Khusus / Special Pelabuhan / Port - - - Lainnya / Others - 74 138
Sumber : PDAM Kabupaten SarolangunSource : Water Supply Corp. of Sarolangun Regency
721
JUMLAH / TOTAL 4 379 5 286 5 888
Kabupaten Sarolangun / Sarolangun Regency
Jambi In Figures 2010 423

PERINDUSTRIAN, PERTAMBANGAN, DAN ENERGI
Lanjutan Tabel / Continued Table 6.3.9
Jenis KonsumenKind of Customer 2008 2009 2010
(1) (4) (5) (6)
Sosial / Social Umum / Public 558 577 581 Khusus / Private 36
Non Niaga / Non Commercial Rumahtangga 25 131 25 335 44 792 Household
Instansi Pemerintah - - 366 Government
Niaga / Commercial Kecil / Small 25 909 26 570 9 944 Besar / Large 419
Industri / Industry Kecil / Small 1 312 1435 134 Besar / Whole
Khusus / Special Pelabuhan / Port 284 353 2 Lainnya / Others 304
Sumber : PDAM Kota JambiSource : Water Supply Corp. of Jambi Municipality
JUMLAH / TOTAL 53 194 54 270 56 578
Kota Jambi / Jambi Municipality
424 Jambi Dalam Angka 2010

MANUFACTURING, MINING, AND ENERGY
Lanjutan Tabel / Continued Table 6.3.9
Jenis KonsumenKind of Customer 2008 2009 2010
(1) (4) (5) (6)
Sosial / Social Umum / Public 6 7 Khusus / Private 33 38
Non Niaga / Non Commercial Rumahtangga 2 793 3 226 3 988 Household
Instansi Pemerintah 62 72 76 Government
Niaga / Commercial Kecil / Small 90 33 Besar / Large 29 104
Industri / Industry Kecil / Small 1 - - Besar / Whole 3 3 2
Khusus / Special Pelabuhan / Port 1 1 1 Lainnya / Others - 2 -
Sumber : PDAM Kabupaten Muaro JambiSource : Water Supply Corp. of Muaro Jambi Regency
4 141
46
Kabupaten Muaro Jambi / Muaro Jambi Regency
3 018 3 486JUMLAH / TOTAL
28
Jambi In Figures 2010 425

PERINDUSTRIAN, PERTAMBANGAN, DAN ENERGI
Lanjutan Tabel / Continued Table 6.3.9
Jenis KonsumenKind of Customer 2008 2009 2010
(1) (4) (5) (6)
Sosial / Social Umum / Public - - 13 Khusus / Private - - -
Non Niaga / Non Commercial Rumahtangga - - 423 Household
Instansi Pemerintah - - - Government
Niaga / Commercial Kecil / Small - - Besar / Large - -
Industri / Industry Kecil / Small - - - Besar / Whole - - -
Khusus / Special Pelabuhan / Port - - - Lainnya / Others - - -
Sumber : PDAM Kabupaten Tanjab TimurSource : Water Supply Corp. of Tanjab Timur Regency
-
Kabupaten Tanjab Timur / Tanjab Timur Regency
451JUMLAH / TOTAL -
15
426 Jambi Dalam Angka 2010

MANUFACTURING, MINING, AND ENERGY
Lanjutan Tabel / Continued Table 6.3.9
Jenis KonsumenKind of Customer 2008 2009 2010
(1) (4) (5) (6)
Sosial / Social Umum / Public 1 - - Khusus / Private 18 25 28
Non Niaga / Non Commercial Rumahtangga 2 051 2 206 2 135 Household
Instansi Pemerintah - - 178 Government
Niaga / Commercial Kecil / Small 67 62 14 Besar / Large 1 1 1
Industri / Industry Kecil / Small - - - Besar / Whole - - -
Khusus / Special Pelabuhan / Port - - - Lainnya / Others - - -
Sumber : PDAM Kabupaten Tanjab BaratSource : Water Supply Corp. of Tanjab Barat Regency
Kabupaten Tanjab Barat / Tanjab Barat Regency
2 294 2 356JUMLAH / TOTAL 2 138
Jambi In Figures 2010 427

PERINDUSTRIAN, PERTAMBANGAN, DAN ENERGI
Tabel 6.3.10 Jumlah Air Minum yang Disalurkan menurut Jenis Table Konsumen di Kota Jambi Tahun 2008-2010
Number of Water Supply Distributed by Kind of Customerin Jambi Municipality, 2008-2010
2008 2009 2010
(2) (3) (4)
Sosial / Social Umum / Public 213 162 387 657 362 127 Khusus / Private 504 861 - 25 289
Non Niaga / Non Commercial Rumahtangga 9 130 930 5 714 655 9 898 210 Household
Instansi Pemerintah 558 283 - 592 221 Government
Niaga / Commercial Kecil / Small 31 140 6 588 154 2 121 862 Besar / Large 470 133 - 837 021
Industri / Industry Kecil / Small 2 081 318 1 231 783 33 705 Besar / Whole - - -
Khusus / Special Pelabuhan / Port 1 271 100 130 2 257 Lainnya / Others 217 178 - 255 996
Sumber : PDAM Kota JambiSource : Water Supply Corp. of Jambi Municipality
JUMLAH / TOTAL 13 208 276 14 022 379 14 128 688
Jenis KonsumenKind of Customer
(1)
Kota Jambi / Jambi Municipality
428 Jambi Dalam Angka 2010

MANUFACTURING, MINING, AND ENERGY
Lanjutan Tabel / Continued Table 6.3.10
Jenis KonsumenKind of Customer 2008 2009 2010
(1) (2) (3) (4)
Sosial / Social Umum / Public 14 888 18 359 Khusus / Private 98 010 91 747
Non Niaga / Non Commercial Rumahtangga 4 105 280 4 551 985 2 819 284 Household
Instansi Pemerintah 247 490 296 410 70 114 Government
Niaga / Commercial Kecil / Small 83 841 104 470 Besar / Large 92 806 99 769
Industri / Industry Kecil / Small - - - Besar / Whole - - -
Khusus / Special Pelabuhan / Port - - - Lainnya / Others 3 117 354 1 292 2 655 535
Sumber : PDAM Kabupaten KerinciSource : Water Supply Corp. of Kerinci Regency
72 913
14 326
5 632 1727 759 669 5 164 032
Kabupaten Kerinci / Kerinci Regency
JUMLAH / TOTAL
Jambi In Figures 2010 429
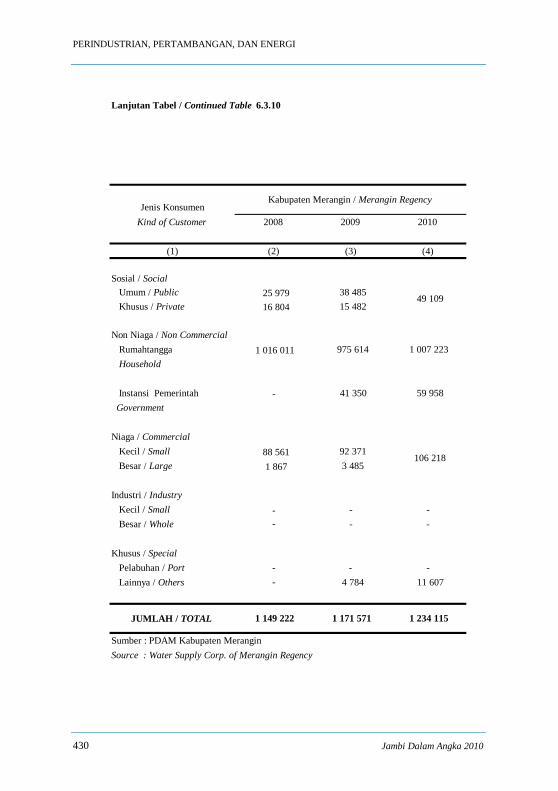
PERINDUSTRIAN, PERTAMBANGAN, DAN ENERGI
Lanjutan Tabel / Continued Table 6.3.10
Jenis KonsumenKind of Customer 2008 2009 2010
(1) (2) (3) (4)
Sosial / Social Umum / Public 25 979 38 485 Khusus / Private 16 804 15 482
Non Niaga / Non Commercial Rumahtangga 1 016 011 975 614 1 007 223 Household
Instansi Pemerintah - 41 350 59 958 Government
Niaga / Commercial Kecil / Small 88 561 92 371 Besar / Large 1 867 3 485
Industri / Industry Kecil / Small - - - Besar / Whole - - -
Khusus / Special Pelabuhan / Port - - - Lainnya / Others - 4 784 11 607
Sumber : PDAM Kabupaten MeranginSource : Water Supply Corp. of Merangin Regency
49 109
106 218
JUMLAH / TOTAL 1 149 222 1 171 571 1 234 115
Kabupaten Merangin / Merangin Regency
430 Jambi Dalam Angka 2010
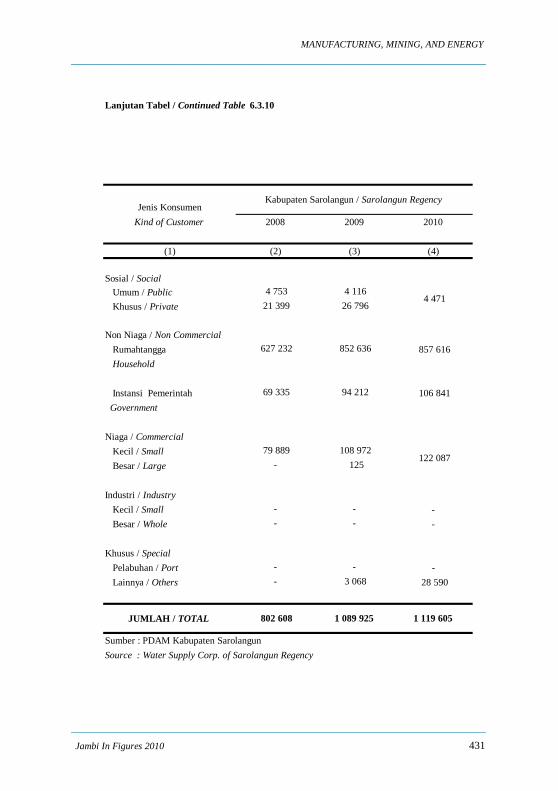
MANUFACTURING, MINING, AND ENERGY
Lanjutan Tabel / Continued Table 6.3.10
Jenis KonsumenKind of Customer 2008 2009 2010
(1) (2) (3) (4)
Sosial / Social Umum / Public 4 753 4 116 Khusus / Private 21 399 26 796
Non Niaga / Non Commercial Rumahtangga 627 232 852 636 857 616 Household
Instansi Pemerintah 69 335 94 212 106 841 Government
Niaga / Commercial Kecil / Small 79 889 108 972 Besar / Large - 125
Industri / Industry Kecil / Small - - - Besar / Whole - - -
Khusus / Special Pelabuhan / Port - - - Lainnya / Others - 3 068 28 590
Sumber : PDAM Kabupaten SarolangunSource : Water Supply Corp. of Sarolangun Regency
Kabupaten Sarolangun / Sarolangun Regency
122 087
4 471
JUMLAH / TOTAL 802 608 1 089 925 1 119 605
Jambi In Figures 2010 431

PERINDUSTRIAN, PERTAMBANGAN, DAN ENERGI
Lanjutan Tabel / Continued Table 6.3.10
Jenis KonsumenKind of Customer 2008 2009 2010
(1) (2) (3) (4)
Sosial / Social Umum / Public 5 592 4 266 Khusus / Private 15 845 15 881
Non Niaga / Non Commercial Rumahtangga 681 950 671 414 62 413 Household
Instansi Pemerintah 107 710 105 336 9 001 Government
Niaga / Commercial Kecil / Small 14 715 16 305 Besar / Large 36 542 40 905
Industri / Industry Kecil / Small - - - Besar / Whole - - -
Khusus / Special Pelabuhan / Port - 2 - Lainnya / Others 4 329 - 1 814
Sumber : PDAM Kabupaten Batang HariSource : Water Supply Corp. of Batang Hari Regency
1 692
Kabupaten Batang Hari / Batang Hari Regency
4 574
854 109 79 494JUMLAH / TOTAL 866 683
432 Jambi Dalam Angka 2010

MANUFACTURING, MINING, AND ENERGY
Lanjutan Tabel / Continued Table 6.3.10
Jenis KonsumenKind of Customer 2008 2009 2010
(1) (2) (3) (4)
Sosial / Social Umum / Public 4 668 5 702 Khusus / Private 69 408 58 085
Non Niaga / Non Commercial Rumahtangga 937 303 1 076 703 1 146 496 Household
Instansi Pemerintah - - - Government
Niaga / Commercial Kecil / Small 1 450 2 417 Besar / Large 621 11 126
Industri / Industry Kecil / Small 1 040 1 136 Besar / Whole - -
Khusus / Special Pelabuhan / Port - - - Lainnya / Others 8 454 10 137 5 412
Sumber : PDAM Kabupaten BungoSource : Water Supply Corp. of Bungo Regency
81 654
34 610
832
JUMLAH / TOTAL 1 022 944
Kabupaten Bungo / Bungo Regency
1 165 306 1 269 004
Jambi In Figures 2010 433
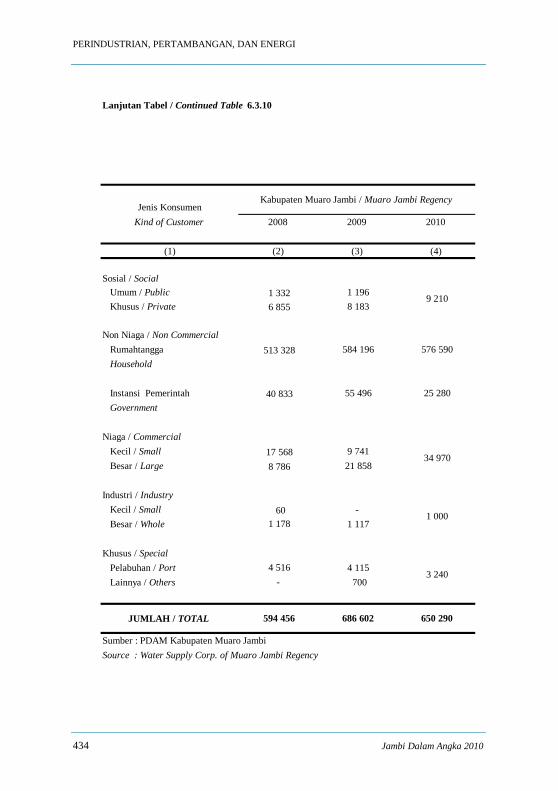
PERINDUSTRIAN, PERTAMBANGAN, DAN ENERGI
Lanjutan Tabel / Continued Table 6.3.10
Jenis KonsumenKind of Customer 2008 2009 2010
(1) (2) (3) (4)
Sosial / Social Umum / Public 1 332 1 196 Khusus / Private 6 855 8 183
Non Niaga / Non Commercial Rumahtangga 513 328 584 196 576 590 Household
Instansi Pemerintah 40 833 55 496 25 280 Government
Niaga / Commercial Kecil / Small 17 568 9 741 Besar / Large 8 786 21 858
Industri / Industry Kecil / Small 60 - Besar / Whole 1 178 1 117
Khusus / Special Pelabuhan / Port 4 516 4 115 Lainnya / Others - 700
Sumber : PDAM Kabupaten Muaro JambiSource : Water Supply Corp. of Muaro Jambi Regency
1 000
3 240
Kabupaten Muaro Jambi / Muaro Jambi Regency
9 210
34 970
JUMLAH / TOTAL 650 290 594 456 686 602
434 Jambi Dalam Angka 2010

MANUFACTURING, MINING, AND ENERGY
Lanjutan Tabel / Continued Table 6.3.10
Jenis KonsumenKind of Customer 2008 2009 2010
(1) (2) (3) (4)
Sosial / Social Umum / Public - - Khusus / Private - -
Non Niaga / Non Commercial Rumahtangga - - - Household
Instansi Pemerintah - - - Government
Niaga / Commercial Kecil / Small - - Besar / Large - -
Industri / Industry Kecil / Small - - - Besar / Whole - - -
Khusus / Special Pelabuhan / Port - - - Lainnya / Others - - -
Sumber : PDAM Kabupaten Tanjab TimurSource : Water Supply Corp. of Tanjab Timur Regency
2 055
Kabupaten Tanjab Timur / Tanjab Timur Regency
2 371
JUMLAH / TOTAL - - 4 426
Jambi In Figures 2010 435

PERINDUSTRIAN, PERTAMBANGAN, DAN ENERGI
Lanjutan Tabel / Continued Table 6.3.10
Jenis KonsumenKind of Customer 2008 2009 2010
(1) (2) (3) (4)
Sosial / Social Umum / Public 122 - - Khusus / Private 3 070 3 576 -
Non Niaga / Non Commercial Rumahtangga 307 985 346 588 384 692 Household
Instansi Pemerintah - - - Government
Niaga / Commercial Kecil / Small 8 465 8 232 Besar / Large 127 144
Industri / Industry Kecil / Small - - - Besar / Whole - - -
Khusus / Special Pelabuhan / Port - - Lainnya / Others - -
Sumber : PDAM Kabupaten Tanjab BaratSource : Water Supply Corp. of Tanjab Barat Regency
Kabupaten Tanjab Barat / Tanjab Barat Regency
319 769 358 540 391 803
2 310
4 801
JUMLAH / TOTAL
436 Jambi Dalam Angka 2010
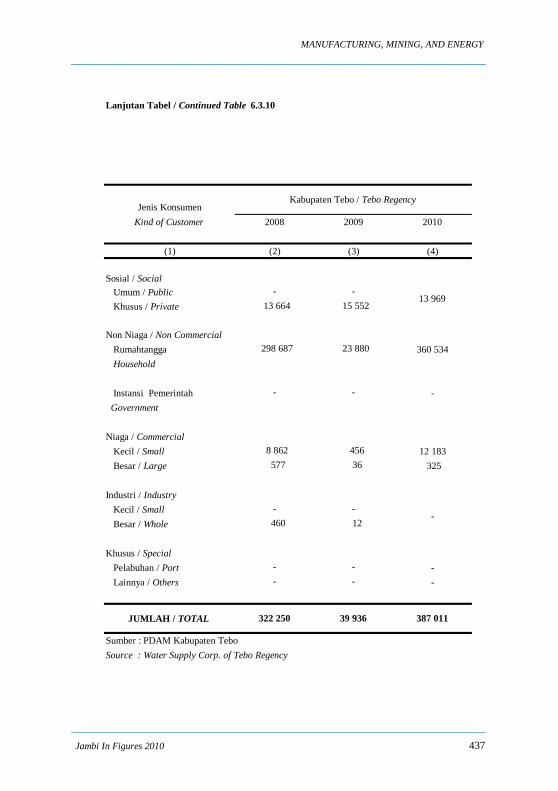
MANUFACTURING, MINING, AND ENERGY
Lanjutan Tabel / Continued Table 6.3.10
Jenis KonsumenKind of Customer 2008 2009 2010
(1) (2) (3) (4)
Sosial / Social Umum / Public - - Khusus / Private 13 664 15 552
Non Niaga / Non Commercial Rumahtangga 298 687 23 880 360 534 Household
Instansi Pemerintah - - - Government
Niaga / Commercial Kecil / Small 8 862 456 12 183 Besar / Large 577 36 325
Industri / Industry Kecil / Small - - Besar / Whole 460 12
Khusus / Special Pelabuhan / Port - - - Lainnya / Others - - -
Sumber : PDAM Kabupaten TeboSource : Water Supply Corp. of Tebo Regency
Kabupaten Tebo / Tebo Regency
JUMLAH / TOTAL 322 250 39 936 387 011
13 969
-
Jambi In Figures 2010 437
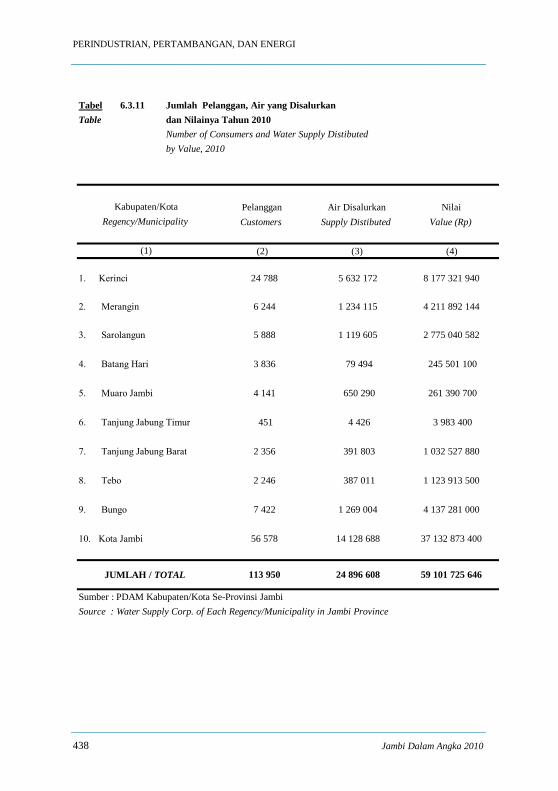
PERINDUSTRIAN, PERTAMBANGAN, DAN ENERGI
Tabel 6.3.11 Jumlah Pelanggan, Air yang Disalurkan Table dan Nilainya Tahun 2010
Number of Consumers and Water Supply Distibuted by Value, 2010
Pelanggan Air Disalurkan NilaiCustomers Supply Distibuted Value (Rp)
(2) (3) (4)
1. Kerinci 24 788 5 632 172 8 177 321 940
2. Merangin 6 244 1 234 115 4 211 892 144
3. Sarolangun 5 888 1 119 605 2 775 040 582
4. Batang Hari 3 836 79 494 245 501 100
5. Muaro Jambi 4 141 650 290 261 390 700
6. Tanjung Jabung Timur 451 4 426 3 983 400
7. Tanjung Jabung Barat 2 356 391 803 1 032 527 880
8. Tebo 2 246 387 011 1 123 913 500
9. Bungo 7 422 1 269 004 4 137 281 000
10. Kota Jambi 56 578 14 128 688 37 132 873 400
Sumber : PDAM Kabupaten/Kota Se-Provinsi JambiSource : Water Supply Corp. of Each Regency/Municipality in Jambi Province
Kabupaten/KotaRegency/Municipality
(1)
JUMLAH / TOTAL 113 950 24 896 608 59 101 725 646
438 Jambi Dalam Angka 2010

MANUFACTURING, MINING, AND ENERGY
Tabel 6.3.12 Jumlah Konsumen dan Produksi Air Minum Table di Kota Jambi Tahun 1997-2010
Number of Consumers and Water Supply Product in Jambi Municipality, 1997-2010
Produksi Banyak Langganan Produksi NilaiTahun Production Number of yang Dikonsumsi ValueYear (M3) Consumer Consumption (Rp)
(M3)(1) (2) (3) (4) (5)
1997 12 570 592 32 278 8 485 745 7 579 067 090
1999 12 630 071 34 201 8 830 918 8 025 191 020
1998 12 949 196 35 733 8 819 492 9 434 837 260
2000 13 756 982 36 694 10 033 461 11 248 057 600
2001 17 214 339 38 120 9 883 959 14 648 008 300
2002 18 201 122 39 828 10 266 964 15 442 087 960
2003 19 020 801 42 332 8 880 913 12 735 531 581
2004 12 235 450 43 229 12 242 015 29 904 159 810
2005 11 944 784 47 425 11 951 382 27 763 649 800
2006 21 298 548 49 816 13 496 296 27 758 244 900
2007 23 620 902 51 435 13 202 788 30 479 332 000
2008 22 374 384 53 408 13 208 276 34 524 761 600
2009 23 753 162 55 270 14 022 373 37 027 904 200
2010 23 354 375 56 578 14 128 688 37 132 873 400
Sumber : PDAM Kota JambiSource : Water Supply Corp. of Jambi Municipality
Jambi In Figures 2010 439
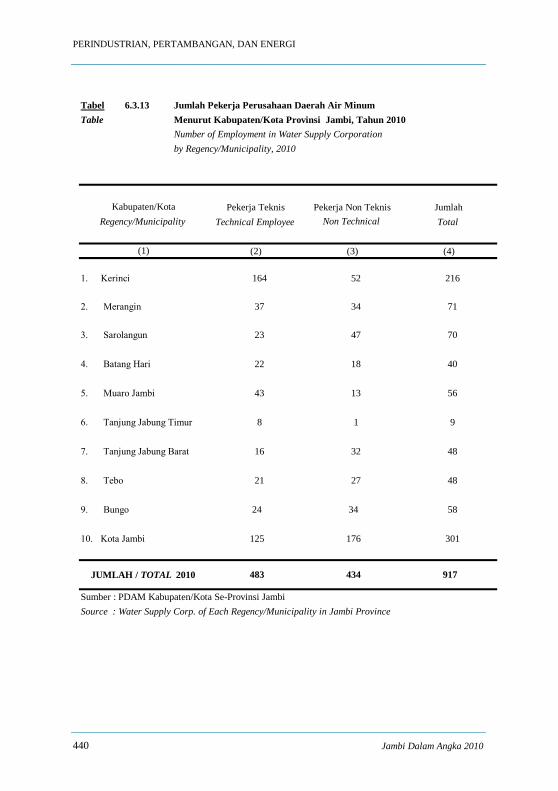
PERINDUSTRIAN, PERTAMBANGAN, DAN ENERGI
Tabel 6.3.13 Jumlah Pekerja Perusahaan Daerah Air Minum Table Menurut Kabupaten/Kota Provinsi Jambi, Tahun 2010
Number of Employment in Water Supply Corporation by Regency/Municipality, 2010
Pekerja Teknis Pekerja Non Teknis JumlahTechnical Employee Non Technical
EmployeeTotal
(2) (3) (4)
1. Kerinci 164 52 216
2. Merangin 37 34 71
3. Sarolangun 23 47 70
4. Batang Hari 22 18 40
5. Muaro Jambi 43 13 56
6. Tanjung Jabung Timur 8 1 9
7. Tanjung Jabung Barat 16 32 48
8. Tebo 21 27 48
9. Bungo 24 34 58
10. Kota Jambi 125 176 301
Sumber : PDAM Kabupaten/Kota Se-Provinsi JambiSource : Water Supply Corp. of Each Regency/Municipality in Jambi Province
Kabupaten/KotaRegency/Municipality
(1)
JUMLAH / TOTAL 2010 483 434 917
440 Jambi Dalam Angka 2010
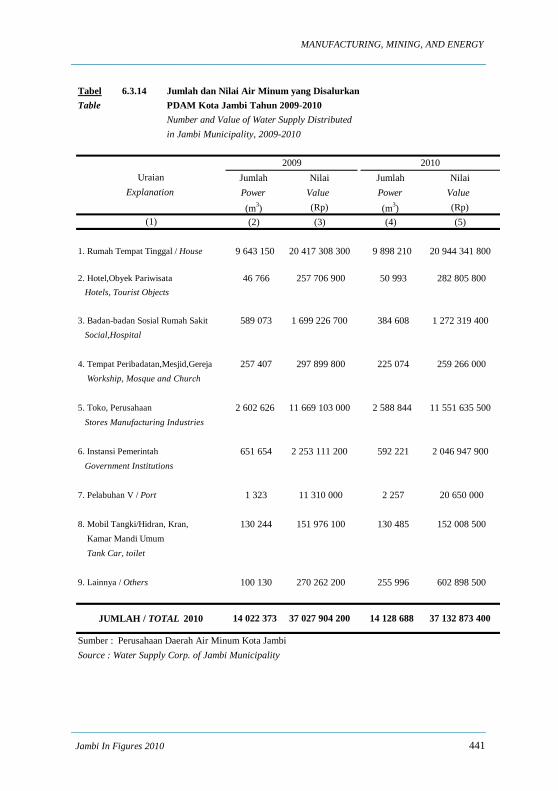
MANUFACTURING, MINING, AND ENERGY
Tabel 6.3.14 Jumlah dan Nilai Air Minum yang Disalurkan Table PDAM Kota Jambi Tahun 2009-2010
Number and Value of Water Supply Distributed in Jambi Municipality, 2009-2010
Jumlah Nilai Jumlah Nilai Power Value Power Value (m3) (Rp) (m3) (Rp)(2) (3) (4) (5)
1. Rumah Tempat Tinggal / House 9 643 150 20 417 308 300 9 898 210 20 944 341 800
2. Hotel,Obyek Pariwisata 46 766 257 706 900 50 993 282 805 800 Hotels, Tourist Objects
3. Badan-badan Sosial Rumah Sakit 589 073 1 699 226 700 384 608 1 272 319 400 Social,Hospital
4. Tempat Peribadatan,Mesjid,Gereja 257 407 297 899 800 225 074 259 266 000 Workship, Mosque and Church
5. Toko, Perusahaan 2 602 626 11 669 103 000 2 588 844 11 551 635 500 Stores Manufacturing Industries
6. Instansi Pemerintah 651 654 2 253 111 200 592 221 2 046 947 900 Government Institutions
7. Pelabuhan V / Port 1 323 11 310 000 2 257 20 650 000
8. Mobil Tangki/Hidran, Kran, 130 244 151 976 100 130 485 152 008 500 Kamar Mandi Umum Tank Car, toilet
9. Lainnya / Others 100 130 270 262 200 255 996 602 898 500
Sumber : Perusahaan Daerah Air Minum Kota JambiSource : Water Supply Corp. of Jambi Municipality
14 022 373 37 027 904 200 14 128 688 37 132 873 400JUMLAH / TOTAL 2010
20102009Uraian
Explanation
(1)
Jambi In Figures 2010 441

COMPARISON
646 Jambi Dalam Angka 2009/Jambi in Figures 2009