lampiran - digilib.esaunggul.ac.id · lakukan dalam rangka penyusunan tesis untuk program s2 dalam...
TRANSCRIPT

113
LAMPIRAN

114
Universitas Esa Unggul
Lampiran 1
Kuesioner Pretest
KUESIONER PENELITIAN
LABEL HALAL, ATTENTION TO INGREDIENTS INFORMATION,
RELIGIOSITY, COUNTERFACTUAL THINKING TERHADAP INTENSI
PEMBELIAN
(STUDI PADA MINUMAN LIANG TEH CAP PANDA)
Sehubungan dengan penelitian tentang “Persepsi Label Halal, Religiosity,
Attention to Ingredients Information, Counterfactual Thinking Terhadap Intensi
Pembelian (Study Pada Minuman Liang Teh Cap Panda)” yang sedang saya
lakukan dalam rangka penyusunan tesis untuk program S2 dalam bidang
pemasaran, dengan ini saya mohon kesediaan Bapak / Ibu / Saudara / Saudari
untuk meluangkan waktu beberapa menit untuk mengisi kuesioner terlampir.
Kerahasiaan data Bapak / Ibu / Saudara / Saudari adalah prioritas saya sehingga
dimohonkan untuk mengisi kuisioner ini dengan sejujur-jujurnya.
Hormat saya,
Firgosti Flamboyant

115
Universitas Esa Unggul
Lampiran 1
Kuesioner Pre-test (lanjutan)
A. IDENTITAS RESPONDEN
1. Nama : _______________________________________
2. Usia : (1) < 20 tahun
(2) 20 – 29 tahun
(3) 30 – 39 tahun
(4) 40 – 49 tahun
(5) >50 tahun
3. Jenis Kelamin : __ Perempuan __ Laki-laki
4. Tingkat Pendidikan : ___ SMU/Sederajat ___ D3 ___ S1___ S2
5. Agama : (1) Islam (4) Hindu
(2) Kristen Khatolik (5) Budha
(3) Kristen Protestan (6) Lainnya
6. Pekerjaan : (1) Pelajar (4) Wiraswasta
(2) Pegawai Negeri (5) Lainnya
(3) Karyawan Swasta
7. Rata-rata konsumsi : (1) < 1 juta (4) 5 juta – 7.9 juta
(2) 1 juta – 2.9 juta (3) 3 juta – 4.9 juta
(5) >= 8 juta
8. Apakah anda pernah mengkonsumsi Liang Teh : ______ Ya ______ Tidak
9. Jika Anda mengkonsumsi Liang Teh brand apakah yang anda pilih ?
___________

116
Universitas Esa Unggul
Lampiran 1
Kuesioner Pre-test (lanjutan)
B. KUESIONER
Berilah tanda silang (X) pada pilihan jawaban sesuai kenyataan yang
Bapak/Ibu yang rasakan selama ini, serta tambahkan penjelasan mengenai
jawaban tersebut jika Bapak/Ibu anggap diperlukan. Angka 1 (satu) hingga 5
(lima) menunjukan kecenderungan jawaban.
SS = Sangat Setuju (5)
S = Setuju (4)
N = Netral (3)
TS = Tidak Setuju (2)
STS = Sangat Tidak Setuju (1)
No. Pernyataan SS S N TS STS
5 4 3 2 1
1. VARIABEL PERSEPSI LABEL HALAL
1
Saya selalu mengecek ada atau tidak logo halal yang ada
pada kemasan produk sebelum melakukan pembelian.
2
Menurut saya semua produk makanan dan minuman
seharusnya mendapatkan sertifikasi halal dari LPPOM
MUI.
3
Sistem/motode yang digunakan oleh produsen dalam
proses produksi berpengaruh penting dalam menentukan
status halal.
4
Saya akan segera melaporkan ke pihak yang terkait jika
menemukan label produk halal yang palsu.
5
Produk minuman halal harus dipisahkan untuk muslim
dan non-muslim dalam penempatannya.
6
Yang berhak untuk mengeluarkan logo halal adalah
LPPOM MUI

117
Universitas Esa Unggul
Lampiran 1
Kuesioner Pre-test (lanjutan)
No. Pernyataan SS S N TS STS
5 4 3 2 1
1. VARIABEL PERSEPSI LABEL HALAL
7
LPPOM MUI wajib mengambil tindakan kepada semua
produsen yang tidak mengikuti standar halal.
8
Saya memilih minuman karena halal, tidak hanya
didasarkan pada "rasa" produk saja.
2. VARIABEL ATTENTION TO INGREDIENTS INFORMATION
9
Saya akan memilih minuman yang memiliki kandungan
bahan yang baik meskipun tidak memiliki logo halal.
10
Saya memperhatikan informasi ingredients pada
kemasan produk minuman yang saya beli.
11
Informasi Ingredients pada kemasan produk minuman
sangat penting bagi konsumen.
12 Tanggal kadaluwarsa produk adalah penting.
13
Minuman yang mengandung bahan pengawet kurang
disukai oleh konsumen.
3. VARIABEL RELIGIOSITY
14
Saya mempercayakan diri saya sepenuhnya hanya
kepada Tuhan.
15
Agama yang saya yakini memperkuat harga diri dan
identitas saya.
16
Mengetahui kasih Tuhan adalah fundamental bagi
kehidupan saya.
17
Saya percaya bahwa hal yang paling penting adalah
hubungan saya dengan Tuhan.
18
Pengalaman bersama Tuhan dalam hidup saya
memotivasi saya untuk hidup dalam kebaikan, meskipun
ini sulit.
19
Saya percaya kepada Tuhan dengan tulus, bukan bagian
dari kewajiban atau ketakutan.
20
Dalam berbagai pencobaan dan kesusahan, saya hanya
percaya pada Tuhan.
118
Universitas Esa Unggul
Lampiran 1
Kuesioner Pre-test (lanjutan)
No. Pernyataan SS S N TS STS
5 4 3 2 1
3. VARIABEL RELIGIOSITY
21
Saya bersedia untuk bertanggung jawab kepada Tuhan
dan sesama manusia tentang cara kehidupan saya.
22
Iman saya berorientasi pada nilai-nilai yang melampaui
kebutuhan fisik dan sosial.
23
Di luar pemikiran saya bahwa Tuhan mencintai manusia,
saya mengejar untuk mencintai sesama manusia
24 Iman saya mempengaruhi semua aspek kehidupan saya.
25
Perkembangan kepribadian saya dan iman saling
mempengaruhi satu sama lain.
26
Sebagai seseorang, saya hanya merasa sepenuhnya
lengkap dalam hubungan dengan Tuhan.
27
Bagi saya, berdoa dan melakukan keadilan adalah saling
berkaitan.
28
Saya mengejar nilai yang lebih tinggi seperti kasih,
kebenaran dan keadilan.
29
Rasa harga diri saya adalah berhubungan dengan siapa
saya dan bukan terhadap berapa banyak yang saya miliki.
4. VARIABEL COUNTERFACTUAL THINKING (CFT)
30
Sikap saya di masa sekarang akan mempengaruhi masa
depan saya.
31
Saya sering terlibat di dalam perilaku tertentu untuk
mencapai suatu hasil yang mungkin tidak dapat diraih
dalam waktu bertahun-tahun.
32
Saya hanya memikirkan kebutuhan-kebutuhan sekarang
dan saya percaya bahwa kebutuhan masa depan akan
terpenuhi dengan sendirinya.

119
Universitas Esa Unggul
Lampiran 1
Kuesioner Pre-test (lanjutan)
No. Pernyataan SS S N TS STS
5 4 3 2 1
4. VARIABEL COUNTERFACTUAL THINKING (CFT)
33
Tindakan saya dipengaruhi oleh apa yang saya lakukan
saat ini.
34
Pengambilan keputusan bisa diambil dengan baik apabila
saya merasa nyaman.
35
Saya bersedia untuk melakukan apa saja untuk
kesejahteraan di masa yang akan datang.
36
Saya berpikir bahwa penting mendapatkan peringatan
untuk hasil yang negatif meskipun hasil yang negatif itu
belum tentu akan terjadi selama bertahun-tahun.
37
Saya akan menjaga kelakuan saya terutama untuk
kebaikan di masa yang akan datang.
38
Saya terbiasa untuk mengabaikan saran untuk
kemungkinan masalah yang dapat timbul di masa depan.
39
Saya tidak ingin bekerja keras untuk mempersiapkan
masa depan karena masa depan bisa ditangani dengan
berjalannya waktu.
40
Saya hanya akan melakukan sesuatu yang penting saat
ini dengan pertimbangan bahwa saya akan dapat
mengatasi masalah di masa depan yang dapat terjadi
pada kemudian hari.
41
Selama hari yang saya gunakan untuk bekerja memiliki
penghasilan yang jelas, hal ini jauh lebih penting
daripada melakukan sesuatu yang belum jelas.
5. VARIABEL INTENSI PEMBELIAN PRODUK HALAL
42
Saya cenderung untuk membeli produk dengan logo
halal yang diterbitkan oleh LPPOM MUI dibandingkan
membeli produk lain dengan logo Halal yang
diterbitkan oleh produsen.
43
Saya berencana untuk membeli produk minuman halal
di bulan yang akan datang.
44
Saya cenderung akan membeli produk minuman halal
di masa yang akan datang.
45 Saya akan memilih produk halal.
Terima kasih atas kesediaannya untuk mengisi kuesioner ini.

120
Universitas Esa Unggul
Lampiran 2
Data Kuesioner Pre-test
TABULASI DATA KUESIONER PRE-TEST
LH1 LH2 LH3 LH4 LH5 LH6 LH7 LH8 AI1 AI2 AI3 AI4 AI5
1 5 5 5 5 5 5 4 5 5 5 5 5 5
2 5 5 5 5 5 5 4 5 5 5 5 5 5
3 3 2 2 3 4 3 2 3 2 3 3 3 2
4 4 4 3 4 4 4 3 3 4 4 5 4 4
5 5 5 5 5 5 5 4 5 5 5 5 5 5
6 4 4 4 4 4 4 2 2 4 4 4 4 4
7 5 5 5 5 5 5 5 5 5 5 5 5 5
8 5 5 5 5 5 5 5 4 5 5 5 5 5
9 3 3 3 5 5 5 3 3 3 5 5 3 3
10 3 3 3 4 4 4 4 4 5 5 5 3 3
11 3 3 3 3 3 3 3 3 5 5 5 3 3
12 2 2 3 3 3 3 3 3 4 4 4 2 2
13 3 3 3 3 5 4 3 3 3 3 3 3 3
14 4 3 4 4 5 4 4 4 5 5 5 4 3
15 3 4 4 3 4 4 4 3 4 5 5 3 4
16 5 5 4 5 5 5 4 4 5 5 5 5 5
17 5 5 5 4 5 5 4 3 5 5 5 5 5
18 4 4 3 4 4 4 3 3 4 4 5 4 4
19 3 3 3 3 3 3 3 3 4 4 4 3 3
20 5 5 5 5 5 5 4 5 5 5 5 5 5
21 3 5 5 5 5 5 4 5 5 5 5 3 5
22 5 5 5 5 5 5 4 5 4 4 4 5 5
23 4 5 5 5 5 5 5 4 5 5 5 4 5
24 5 5 5 4 4 5 4 5 5 5 5 5 5
25 5 5 5 5 5 5 4 5 5 5 5 5 5
26 5 5 5 5 5 5 4 5 5 5 5 5 5
27 5 5 5 5 5 5 4 5 5 5 5 5 5
28 5 5 5 5 5 5 4 5 5 5 5 5 5
29 5 5 5 5 5 5 4 5 5 5 5 5 5
30 5 5 5 5 5 5 4 5 5 5 5 5 5
No.Persepsi Label Halal Attention to Ingredients Information

121
Universitas Esa Unggul
Lampiran 2
Data Kuesioner Pre-test (lanjutan)
R1 R2 R3 R4 R5 R6 R7 R8 R9 R10 R11 R12 R13 R14 R15 R16
1 5 5 5 5 5 5 5 4 5 5 5 4 5 5 5 4
2 5 5 5 5 5 5 5 4 5 5 5 4 5 5 5 4
3 3 2 2 5 3 4 3 2 3 3 4 4 3 4 3 2
4 4 4 3 5 4 4 4 3 3 3 3 3 3 4 3 3
5 5 5 5 5 5 5 5 4 5 5 5 4 5 5 5 4
6 4 4 4 5 4 4 4 2 2 4 4 4 4 4 4 4
7 5 5 5 5 5 5 5 5 5 5 5 5 5 5 4 5
8 5 5 5 5 5 5 5 5 4 5 4 4 5 5 3 5
9 3 3 3 5 5 5 5 3 3 3 3 3 3 5 3 3
10 3 3 3 4 4 4 4 4 4 4 4 4 4 4 3 2
11 3 3 3 5 3 3 3 3 3 3 3 3 3 3 3 3
12 2 2 3 5 3 3 3 3 3 3 3 3 2 4 2 2
13 3 3 3 5 3 5 4 3 3 3 3 4 3 4 4 4
14 4 3 4 4 4 5 4 4 4 4 4 4 4 4 5 5
15 3 4 4 5 3 4 4 4 3 3 3 3 3 5 3 4
16 5 5 4 5 5 5 5 4 4 4 4 4 4 3 2 2
17 5 5 5 5 4 5 5 4 3 4 4 3 4 3 3 4
18 4 4 3 5 4 4 4 3 3 3 3 3 3 4 3 3
19 3 3 3 5 3 3 3 3 3 3 3 3 3 3 3 3
20 5 5 5 5 5 5 5 4 5 5 5 4 5 5 5 4
21 3 5 5 4 5 5 5 4 5 5 5 4 5 5 5 4
22 5 5 5 5 5 5 5 4 5 5 5 4 5 5 5 4
23 4 5 5 5 5 5 5 5 4 5 4 5 5 5 5 4
24 5 5 5 5 4 4 5 4 5 5 5 4 5 5 5 4
25 5 5 5 5 5 5 5 4 5 5 5 4 5 5 5 4
26 5 5 5 5 5 5 5 4 5 5 5 4 5 5 5 4
27 5 5 5 5 5 5 5 4 5 5 5 4 5 5 5 4
28 5 5 5 5 5 5 5 4 5 5 5 4 5 5 5 4
29 5 5 5 5 5 5 5 4 5 5 5 4 5 5 5 4
30 5 5 5 5 5 5 5 4 5 5 4 5 5 5 5 4
No.Religiosity

122
Universitas Esa Unggul
Lampiran 2
Data Kuesioner Pre-test (lanjutan)
CFT1 CFT2 CFT3 CFT4 CFT5 CFT6 CFT7 CFT8 CFT9 CFT10 CFT11 CFT12 IH1 IH2 IH3 IH4
1 5 5 5 5 5 5 4 5 5 5 4 5 5 5 5 5
2 5 5 5 5 5 5 4 5 5 5 4 5 5 5 5 5
3 3 2 2 3 4 3 2 3 3 4 4 3 3 2 2 3
4 4 4 3 4 4 4 3 3 3 3 3 3 4 4 3 4
5 5 5 5 5 5 5 4 5 5 5 4 5 5 5 5 5
6 4 4 4 4 4 4 2 2 4 4 4 4 4 4 4 4
7 5 5 5 5 5 5 5 5 5 5 5 5 5 5 5 5
8 5 5 5 5 5 5 5 4 5 4 4 5 5 5 5 5
9 3 3 3 5 5 5 3 3 3 3 3 3 3 3 3 5
10 3 3 3 4 4 4 4 4 4 4 4 4 3 3 3 4
11 3 3 3 3 3 3 3 3 3 3 3 3 3 3 3 3
12 2 2 3 3 3 3 3 3 3 3 3 2 2 2 3 3
13 3 3 3 3 5 4 3 3 3 3 4 3 3 3 3 3
14 4 3 4 4 5 4 4 4 4 4 4 4 4 3 4 4
15 3 4 4 3 4 4 4 3 3 3 3 3 3 4 4 3
16 5 5 4 5 5 5 4 4 4 4 4 4 5 5 4 5
17 5 5 5 4 5 5 4 3 4 4 3 4 5 5 5 4
18 4 4 3 4 4 4 3 3 3 3 3 3 4 4 3 4
19 3 3 3 3 3 3 3 3 3 3 3 3 3 3 3 3
20 5 5 5 5 5 5 4 5 5 5 4 5 5 5 5 5
21 3 5 5 5 5 5 4 5 5 5 4 5 3 5 5 5
22 5 5 5 5 5 5 4 5 5 5 4 5 5 5 5 5
23 4 5 5 5 5 5 5 4 5 4 5 5 4 5 5 5
24 5 5 5 4 4 5 4 5 5 5 4 5 5 5 5 4
25 5 5 5 5 5 5 4 5 5 5 4 5 5 5 5 5
26 5 5 5 5 5 5 4 5 5 5 4 5 5 5 5 5
27 5 5 5 5 5 5 4 5 5 5 4 5 5 5 5 5
28 5 5 5 5 5 5 4 5 5 5 4 5 5 5 5 5
29 5 5 5 5 5 5 4 5 5 5 4 5 5 5 5 5
30 5 5 5 5 5 5 4 5 5 4 5 5 5 5 5 5
No.Intensi Pembelian Produk HalalCFT

123
Universitas Esa Unggul
Lampiran 3
Hasil Uji Pre-test
1. Factor Analysis Variabel Persepsi Label Halal
KMO and Bartlett's Test
Kaiser-Meyer-Olkin Measure of Sampling Adequacy. .876
Bartlett's Test of Sphericity
Approx. Chi-Square 261.948
df 28
Sig. .000
Anti-image Matrices
LH1 LH2 LH3 LH4 LH5 LH6 LH7 LH8
Anti-image Covariance
LH1 .221 -.068 -.001 -.011 -.049 .017 .057 -.045
LH2 -.068 .078 -.049 -.006 .051 -.032 -.009 .029
LH3 -.001 -.049 .113 .023 -.009 -.007 -.055 -.066
LH4 -.011 -.006 .023 .152 -.012 -.046 .019 -.080
LH5 -.049 .051 -.009 -.012 .192 -.070 -.013 .011
LH6 .017 -.032 -.007 -.046 -.070 .061 -.015 .012
LH7 .057 -.009 -.055 .019 -.013 -.015 .369 -.084
LH8 -.045 .029 -.066 -.080 .011 .012 -.084 .292
Anti-image Correlation
LH1 .900a -.516 -.005 -.058 -.237 .147 .198 -.179
LH2 -.516 .821a -.528 -.057 .414 -.460 -.052 .191
LH3 -.005 -.528 .895a .172 -.061 -.082 -.270 -.361
LH4 -.058 -.057 .172 .909a -.072 -.476 .081 -.379
LH5 -.237 .414 -.061 -.072 .843a -.640 -.048 .046
LH6 .147 -.460 -.082 -.476 -.640 .840a -.096 .087
LH7 .198 -.052 -.270 .081 -.048 -.096 .940a -.256
LH8 -.179 .191 -.361 -.379 .046 .087 -.256 .894a
a. Measures of Sampling Adequacy(MSA)

124
Universitas Esa Unggul
Lampiran 3
Hasil Uji Pre-test (lanjutan)
Component Matrixa
Component
1
LH1 .866
LH2 .930
LH3 .929
LH4 .908
LH5 .834
LH6 .953
LH7 .792
LH8 .840
Extraction Method: Principal Component Analysis.
a. 1 components extracted.
2. Factor Analysis Variabel Attention to Ingredients Information
3. KMO and Bartlett's Test
Kaiser-Meyer-Olkin Measure of Sampling Adequacy. .774
Bartlett's Test of Sphericity
Approx. Chi-Square 132.033
df 10
Sig. .000
Anti-image Matrices
AI1 AI2 AI3 AI4 AI5
Anti-image Covariance
AI1 .249 -.080 -.013 -.025 -.041
AI2 -.080 .135 -.112 .013 -.006
AI3 -.013 -.112 .168 .006 -.016
AI4 -.025 .013 .006 .251 -.176
AI5 -.041 -.006 -.016 -.176 .201
Anti-image Correlation
AI1 .900a -.434 -.064 -.101 -.183
AI2 -.434 .737a -.744 .072 -.036
AI3 -.064 -.744 .780a .031 -.087
AI4 -.101 .072 .031 .710a -.782
AI5 -.183 -.036 -.087 -.782 .746a
a. Measures of Sampling Adequacy(MSA)

125
Universitas Esa Unggul
Lampiran 3
Hasil Uji Pre-test (lanjutan)
Component Matrixa
Component
1
AI1 .908
AI2 .892
AI3 .877
AI4 .774
AI5 .860
Extraction Method: Principal Component Analysis.
a. 1 components extracted.
3. Factor Analysis Variabel Religiosity
Tahap 1
KMO and Bartlett's Test
Kaiser-Meyer-Olkin Measure of Sampling Adequacy. .812
Bartlett's Test of Sphericity
Approx. Chi-Square 624.542
df 120
Sig. .000
Lampiran 3

126
Universitas Esa Unggul
Hasil Uji Pre-test (lanjutan)
Anti-image Matrices
R1 R2 R3 R4 R5 R6 R7 R8
Anti-image
Covariance
R1 .099 -.018 .011 -.117 -.003 -.011 -.008 .007
R2 -.018 .044 -.017 -.006 -.013 .018 -.007 .008
R3 .011 -.017 .015 -.019 .012 -.003 -.008 -.013
R4 -.117 -.006 -.019 .354 .010 .016 .014 .048
R5 -.003 -.013 .012 .010 .088 -.032 -.017 .017
R6 -.011 .018 -.003 .016 -.032 .099 -.040 -.010
R7 -.008 -.007 -.008 .014 -.017 -.040 .042 -.002
R8 .007 .008 -.013 .048 .017 -.010 -.002 .114
R9 -.020 -.006 .006 .007 -.007 .002 .004 -.064
R10 -.004 .009 -.008 .005 -.010 .007 .003 .002
R11 -.009 .006 -.003 .021 .027 -.026 .006 .046
R12 .025 -.016 .025 -.070 .041 -.067 .012 -.023
R13 -.001 -.013 .008 .005 .003 .000 -.004 -.008
R14 .075 -.008 .020 -.130 -.012 .025 -.039 -.013
R15 .009 .013 -.013 .024 .012 -.016 .009 .075
R16 -.049 .024 -.025 .053 .003 -.027 .028 -.020
Anti-image
Correlation
R1 .847a -.271 .279 -.627 -.034 -.107 -.131 .062
R2 -.271 .828a -.664 -.046 -.206 .274 -.166 .120
R3 .279 -.664 .754a -.263 .331 -.077 -.301 -.303
R4 -.627 -.046 -.263 .169a .058 .085 .115 .238
R5 -.034 -.206 .331 .058 .897a -.338 -.276 .172
R6 -.107 .274 -.077 .085 -.338 .843a -.623 -.096
R7 -.131 -.166 -.301 .115 -.276 -.623 .880a -.023
R8 .062 .120 -.303 .238 .172 -.096 -.023 .774a
R9 -.233 -.110 .181 .045 -.090 .019 .074 -.681
R10 -.154 .577 -.820 .112 -.448 .276 .180 .080
R11 -.118 .114 -.093 .141 .353 -.329 .108 .536
R12 .185 -.179 .461 -.269 .314 -.485 .136 -.155
R13 -.036 -.609 .628 .091 .116 .011 -.204 -.252
R14 .553 -.090 .379 -.509 -.095 .187 -.440 -.088
R15 .093 .194 -.327 .126 .125 -.162 .137 .701
R16 -.431 .320 -.565 .248 .024 -.239 .382 -.168
a. Measures of Sampling Adequacy(MSA)
Lampiran 3

127
Universitas Esa Unggul
Hasil Uji Pre-test (lanjutan)
Anti-image Matrices
R9 R10 R11 R12 R13 R14 R15 R16
Anti-image
Covariance
R1 -.020 -.004 -.009 .025 -.001 .075 .009 -.049
R2 -.006 .009 .006 -.016 -.013 -.008 .013 .024
R3 .006 -.008 -.003 .025 .008 .020 -.013 -.025
R4 .007 .005 .021 -.070 .005 -.130 .024 .053
R5 -.007 -.010 .027 .041 .003 -.012 .012 .003
R6 .002 .007 -.026 -.067 .000 .025 -.016 -.027
R7 .004 .003 .006 .012 -.004 -.039 .009 .028
R8 -.064 .002 .046 -.023 -.008 -.013 .075 -.020
R9 .077 -.003 -.031 .015 .006 -.022 -.052 .032
R10 -.003 .006 -.004 -.017 -.006 -.010 .005 .011
R11 -.031 -.004 .064 .028 -.006 -.015 .023 .013
R12 .015 -.017 .028 .191 .002 .015 -.015 -.009
R13 .006 -.006 -.006 .002 .010 .011 -.013 -.014
R14 -.022 -.010 -.015 .015 .011 .185 -.033 -.081
R15 -.052 .005 .023 -.015 -.013 -.033 .101 -.020
R16 .032 .011 .013 -.009 -.014 -.081 -.020 .129
Anti-image
Correlation
R1 -.233 -.154 -.118 .185 -.036 .553 .093 -.431
R2 -.110 .577 .114 -.179 -.609 -.090 .194 .320
R3 .181 -.820 -.093 .461 .628 .379 -.327 -.565
R4 .045 .112 .141 -.269 .091 -.509 .126 .248
R5 -.090 -.448 .353 .314 .116 -.095 .125 .024
R6 .019 .276 -.329 -.485 .011 .187 -.162 -.239
R7 .074 .180 .108 .136 -.204 -.440 .137 .382
R8 -.681 .080 .536 -.155 -.252 -.088 .701 -.168
R9 .846a -.149 -.436 .128 .234 -.186 -.589 .324
R10 -.149 .780a -.193 -.507 -.763 -.286 .220 .404
R11 -.436 -.193 .875a .254 -.222 -.134 .292 .142
R12 .128 -.507 .254 .809a .053 .080 -.109 -.059
R13 .234 -.763 -.222 .053 .823a .247 -.425 -.378
R14 -.186 -.286 -.134 .080 .247 .766a -.243 -.524
R15 -.589 .220 .292 -.109 -.425 -.243 .805a -.174
R16 .324 .404 .142 -.059 -.378 -.524 -.174 .732a
a. Measures of Sampling Adequacy(MSA)

128
Universitas Esa Unggul
Lampiran 3
Hasil Uji Pre-test (lanjutan)
Rotated Component Matrixa
Component
1 2
R1 .786 .480
R2 .852 .403
R3 .921 .212
R4 -.081 .891
R5 .863 .172
R6 .803 .089
R7 .882 .271
R8 .759 .015
R9 .892 -.079
R10 .969 .023
R11 .884 -.035
R12 .728 -.210
R13 .974 .036
R14 .731 -.040
R15 .822 -.164
R16 .687 .059
Extraction Method: Principal Component Analysis.
Rotation Method: Varimax with Kaiser Normalization.
a. Rotation converged in 3 iterations.
Tahap 2
4. KMO and Bartlett's Test
Kaiser-Meyer-Olkin Measure of Sampling Adequacy. .823
Bartlett's Test of Sphericity
Approx. Chi-Square 609.633
df 105
Sig. .000

129
Universitas Esa Unggul
Lampiran 3
Hasil Uji Pre-test (lanjutan)
Anti-image Matrices
R1 R2 R3 R5 R6 R7 R8
Anti-image
Covariance
R1 .163 -.033 .008 .000 -.009 -.006 .039
R2 -.033 .044 -.019 -.013 .018 -.007 .010
R3 .008 -.019 .016 .014 -.002 -.007 -.011
R5 .000 -.013 .014 .089 -.032 -.018 .017
R6 -.009 .018 -.002 -.032 .100 -.042 -.013
R7 -.006 -.007 -.007 -.018 -.042 .043 -.004
R8 .039 .010 -.011 .017 -.013 -.004 .121
R9 -.029 -.006 .007 -.008 .001 .004 -.069
R10 -.003 .010 -.008 -.011 .007 .003 .002
R11 -.004 .007 -.002 .027 -.028 .005 .046
R12 .004 -.019 .024 .046 -.069 .016 -.015
R13 .001 -.013 .009 .003 8.810E-05 -.004 -.010
R14 .070 -.014 .019 -.011 .042 -.046 .007
R15 .029 .013 -.012 .011 -.018 .008 .077
R16 -.055 .027 -.025 .001 -.032 .028 -.031
Anti-image
Correlation
R1 .911a -.385 .152 .003 -.069 -.076 .280
R2 -.385 .812a -.702 -.204 .279 -.162 .135
R3 .152 -.702 .764a .360 -.057 -.282 -.257
R5 .003 -.204 .360 .892a -.345 -.286 .163
R6 -.069 .279 -.057 -.345 .834a -.639 -.120
R7 -.076 -.162 -.282 -.286 -.639 .881a -.053
R8 .280 .135 -.257 .163 -.120 -.053 .768a
R9 -.263 -.108 .200 -.092 .015 .070 -.713
R10 -.108 .587 -.824 -.458 .270 .170 .055
R11 -.038 .122 -.059 .349 -.346 .093 .522
R12 .022 -.198 .420 .343 -.482 .174 -.097
R13 .026 -.608 .679 .111 .003 -.217 -.283
R14 .349 -.132 .296 -.076 .269 -.446 .040
R15 .222 .201 -.307 .119 -.175 .124 .696
R16 -.365 .343 -.534 .010 -.270 .368 -.241
a. Measures of Sampling Adequacy(MSA)

130
Universitas Esa Unggul
Lampiran 3
Hasil Uji Pre-test (lanjutan)
Anti-image Matrices
R9 R10 R11 R12 R13 R14 R15 R16
Anti-image
Covariance
R1 -.029 -.003 -.004 .004 .001 .070 .029 -.055
R2 -.006 .010 .007 -.019 -.013 -.014 .013 .027
R3 .007 -.008 -.002 .024 .009 .019 -.012 -.025
R5 -.008 -.011 .027 .046 .003 -.011 .011 .001
R6 .001 .007 -.028 -.069 8.810E-05 .042 -.018 -.032
R7 .004 .003 .005 .016 -.004 -.046 .008 .028
R8 -.069 .002 .046 -.015 -.010 .007 .077 -.031
R9 .077 -.003 -.032 .018 .006 -.026 -.053 .033
R10 -.003 .006 -.004 -.018 -.006 -.010 .005 .011
R11 -.032 -.004 .066 .036 -.006 -.009 .023 .011
R12 .018 -.018 .036 .206 .004 -.016 -.011 .001
R13 .006 -.006 -.006 .004 .010 .017 -.014 -.015
R14 -.026 -.010 -.009 -.016 .017 .250 -.034 -.089
R15 -.053 .005 .023 -.011 -.014 -.034 .102 -.025
R16 .033 .011 .011 .001 -.015 -.089 -.025 .138
Anti-image
Correlation
R1 -.263 -.108 -.038 .022 .026 .349 .222 -.365
R2 -.108 .587 .122 -.198 -.608 -.132 .201 .343
R3 .200 -.824 -.059 .420 .679 .296 -.307 -.534
R5 -.092 -.458 .349 .343 .111 -.076 .119 .010
R6 .015 .270 -.346 -.482 .003 .269 -.175 -.270
R7 .070 .170 .093 .174 -.217 -.446 .124 .368
R8 -.713 .055 .522 -.097 -.283 .040 .696 -.241
R9 .837a -.155 -.448 .145 .231 -.189 -.601 .323
R10 -.155 .780a -.213 -.499 -.781 -.268 .209 .391
R11 -.448 -.213 .877a .306 -.238 -.073 .279 .112
R12 .145 -.499 .306 .823a .081 -.069 -.079 .008
R13 .231 -.781 -.238 .081 .808a .342 -.442 -.415
R14 -.189 -.268 -.073 -.069 .342 .829a -.210 -.477
R15 -.601 .209 .279 -.079 -.442 -.210 .803a -.214
R16 .323 .391 .112 .008 -.415 -.477 -.214 .747a
a. Measures of Sampling Adequacy(MSA)

131
Universitas Esa Unggul
Lampiran 3
Hasil Uji Pre-test (lanjutan)
Component Matrixa
Component
1
R1 .832
R2 .889
R3 .938
R5 .877
R6 .808
R7 .905
R8 .756
R9 .879
R10 .966
R11 .875
R12 .701
R13 .973
R14 .723
R15 .800
R16 .689
Extraction Method: Principal Component Analysis.
a. 1 components extracted.
4. Factor Analysis Variabel CFT
KMO and Bartlett's Test
Kaiser-Meyer-Olkin Measure of Sampling Adequacy. .836
Bartlett's Test of Sphericity
Approx. Chi-Square 510.200
df 66
Sig. .000

132
Universitas Esa Unggul
Lampiran 3
Hasil Uji Pre-test (lanjutan)
Anti-image Matrices
CFT1 CFT2 CFT3 CFT4 CFT5 CFT6
Anti-image
Covariance
CFT1 .211 -.048 .007 .000 -.029 .014
CFT2 -.048 .056 -.025 -.019 .042 -.022
CFT3 .007 -.025 .031 .031 -.027 -.002
CFT4 .000 -.019 .031 .090 -.034 -.027
CFT5 -.029 .042 -.027 -.034 .116 -.047
CFT6 .014 -.022 -.002 -.027 -.047 .056
CFT7 .019 .001 -.015 .020 -.011 -.012
CFT8 .001 -.004 .014 -.006 -.001 3.633E-05
CFT9 -.001 .010 -.012 -.016 .017 -.001
CFT10 -.010 -.001 .010 .028 -.026 .001
CFT11 .016 -.020 .043 .049 -.083 .020
CFT12 -.003 -.015 .010 .010 -.016 .002
Anti-image
Correlation
CFT1 .955a -.440 .084 -.002 -.188 .125
CFT2 -.440 .811a -.599 -.270 .520 -.401
CFT3 .084 -.599 .773a .582 -.442 -.041
CFT4 -.002 -.270 .582 .829a -.336 -.376
CFT5 -.188 .520 -.442 -.336 .748a -.582
CFT6 .125 -.401 -.041 -.376 -.582 .906a
CFT7 .081 .011 -.164 .131 -.064 -.099
CFT8 .008 -.044 .206 -.052 -.010 .000
CFT9 -.019 .476 -.776 -.578 .550 -.042
CFT10 -.084 -.022 .217 .336 -.286 .015
CFT11 .076 -.186 .531 .355 -.532 .185
CFT12 -.055 -.478 .419 .251 -.348 .063
a. Measures of Sampling Adequacy(MSA)

133
Universitas Esa Unggul
Lampiran 3
Hasil Uji Pre-test (lanjutan)
Anti-image Matrices
CFT7 CFT8 CFT9 CFT10 CFT11 CFT12
Anti-image
Covariance
CFT1 .019 .001 -.001 -.010 .016 -.003
CFT2 .001 -.004 .010 -.001 -.020 -.015
CFT3 -.015 .014 -.012 .010 .043 .010
CFT4 .020 -.006 -.016 .028 .049 .010
CFT5 -.011 -.001 .017 -.026 -.083 -.016
CFT6 -.012 3.633E-05 -.001 .001 .020 .002
CFT7 .252 -.088 -.004 .069 -.008 -.003
CFT8 -.088 .144 -.006 -.044 .017 .006
CFT9 -.004 -.006 .008 -.011 -.023 -.009
CFT10 .069 -.044 -.011 .074 .046 -.001
CFT11 -.008 .017 -.023 .046 .210 .003
CFT12 -.003 .006 -.009 -.001 .003 .019
Anti-image
Correlation
CFT1 .081 .008 -.019 -.084 .076 -.055
CFT2 .011 -.044 .476 -.022 -.186 -.478
CFT3 -.164 .206 -.776 .217 .531 .419
CFT4 .131 -.052 -.578 .336 .355 .251
CFT5 -.064 -.010 .550 -.286 -.532 -.348
CFT6 -.099 .000 -.042 .015 .185 .063
CFT7 .895a -.463 -.085 .506 -.036 -.037
CFT8 -.463 .926a -.179 -.423 .099 .114
CFT9 -.085 -.179 .752a -.429 -.552 -.718
CFT10 .506 -.423 -.429 .860a .366 -.029
CFT11 -.036 .099 -.552 .366 .756a .051
CFT12 -.037 .114 -.718 -.029 .051 .872a
a. Measures of Sampling Adequacy(MSA)

134
Universitas Esa Unggul
Lampiran 3
Hasil Uji Pre-test (lanjutan)
Component Matrixa
Component
1
CFT1 .854
CFT2 .906
CFT3 .933
CFT4 .894
CFT5 .808
CFT6 .917
CFT7 .770
CFT8 .877
CFT9 .965
CFT10 .875
CFT11 .695
CFT12 .971
Extraction Method: Principal Component Analysis.
a. 1 components extracted.
5. Factor Analysis Variabel Intensi Pembelian Produk Halal
KMO and Bartlett's Test
Kaiser-Meyer-Olkin Measure of Sampling Adequacy. .834
Bartlett's Test of Sphericity
Approx. Chi-Square 113.913
df 6
Sig. .000
Anti-image Matrices
IH1 IH2 IH3 IH4
Anti-image Covariance
IH1 .248 -.078 -.004 -.051
IH2 -.078 .108 -.089 -.049
IH3 -.004 -.089 .161 -.030
IH4 -.051 -.049 -.030 .341
Anti-image Correlation
IH1 .883a -.475 -.021 -.175
IH2 -.475 .748a -.677 -.254
IH3 -.021 -.677 .812a -.130
IH4 -.175 -.254 -.130 .941a
a. Measures of Sampling Adequacy(MSA)

135
Universitas Esa Unggul
Lampiran 3
Hasil Uji Pre-test (lanjutan)
Component Matrixa
Component
1
IH1 .917
IH2 .966
IH3 .938
IH4 .889
Extraction Method: Principal Component Analysis.
a. 1 components extracted.
6. Reliabilitas Persepsi Label Halal
Reliability Statistics
Cronbach's
Alpha
Cronbach's
Alpha Based on
Standardized
Items
N of Items
.956 .959 8
7. Reliabilitas Attention to Ingredients Information
Reliability Statistics
Cronbach's
Alpha
Cronbach's
Alpha Based on
Standardized
Items
N of Items
.897 .914 5
8. Reliabilitas Religiosity
Reliability Statistics
Cronbach's
Alpha
Cronbach's
Alpha Based on
Standardized
Items
N of Items
.970 .970 15

136
Universitas Esa Unggul
Lampiran 3
Hasil Uji Pre-test (lanjutan)
9. Reliabilitas CFT
Reliability Statistics
Cronbach's
Alpha
Cronbach's
Alpha Based on
Standardized
Items
N of Items
.971 .971 12
10. Reliabilitas Intensi Pembelian Produk Halal
Reliability Statistics
Cronbach's
Alpha
Cronbach's
Alpha Based on
Standardized
Items
N of Items
.945 .946 4

143
Universitas Esa Unggul
Lampiran 4
Data Kuesioner After Pre-test
TABULASI DATA KUESIONER AFTER PRETEST
No Persepsi Label Halal Attention to Ingredients Information
LH1 LH2 LH3 LH4 LH5 LH6 LH7 LH8 AI1 AI2 AI3 AI4 AI5
1 5 5 5 5 5 5 4 5 5 5 5 5 5
2 5 5 5 5 5 5 4 5 5 5 5 5 5
3 3 2 2 3 4 3 2 3 2 3 3 3 2
4 4 4 3 4 4 4 3 3 4 4 5 4 4
5 5 5 5 5 5 5 4 5 5 5 5 5 5
6 4 4 4 4 4 4 2 2 4 4 4 4 4
7 5 5 5 5 5 5 5 5 5 5 5 5 5
8 5 5 5 5 5 5 5 4 5 5 5 5 5
9 3 3 3 5 5 5 3 3 3 5 5 3 3
10 3 3 3 4 4 4 4 4 5 5 5 3 3
11 3 3 3 3 3 3 3 3 5 5 5 3 3
12 2 2 3 3 3 3 3 3 4 4 4 2 2
13 3 3 3 3 5 4 3 3 3 3 3 3 3
14 4 3 4 4 5 4 4 4 5 5 5 4 3
15 3 4 4 3 4 4 4 3 4 5 5 3 4
16 5 5 4 5 5 5 4 4 5 5 5 5 5
17 5 5 5 4 5 5 4 3 5 5 5 5 5
18 4 4 3 4 4 4 3 3 4 4 5 4 4
19 3 3 3 3 3 3 3 3 4 4 4 3 3
20 5 5 5 5 5 5 4 5 5 5 5 5 5
21 3 5 5 5 5 5 4 5 5 5 5 3 5
22 5 5 5 5 5 5 4 5 4 4 4 5 5
23 4 5 5 5 5 5 5 4 5 5 5 4 5

144
Universitas Esa Unggul
No Persepsi Label Halal Attention to Ingredients Information
LH1 LH2 LH3 LH4 LH5 LH6 LH7 LH8 AI1 AI2 AI3 AI4 AI5
24 5 5 5 4 4 5 4 5 5 5 5 5 5
25 5 5 5 5 5 5 4 5 5 5 5 5 5
26 5 5 5 5 5 5 4 5 5 5 5 5 5
27 5 5 5 5 5 5 4 5 5 5 5 5 5
28 5 5 5 5 5 5 4 5 5 5 5 5 5
29 5 5 5 5 5 5 4 5 5 5 5 5 5
30 5 5 5 5 5 5 4 5 5 5 5 5 5
31 5 5 5 5 5 5 4 5 5 5 5 5 5
32 5 5 5 5 5 5 4 5 5 5 5 5 5
33 3 2 2 3 4 3 2 3 2 3 3 3 2
34 4 4 3 4 4 4 3 3 4 4 5 4 4
35 5 5 5 5 5 5 4 5 5 5 5 5 5
36 4 4 4 4 4 4 2 2 4 4 4 4 4
37 5 5 5 5 5 5 5 5 5 5 5 5 5
38 5 5 5 5 5 5 5 4 5 5 5 5 5
39 3 3 3 5 5 5 3 3 3 5 5 3 3
40 3 3 3 4 4 4 4 4 5 5 5 3 3
41 3 3 3 3 3 3 3 3 5 5 5 3 3
42 2 2 3 3 3 3 3 3 4 4 4 2 2
43 3 3 3 3 5 4 3 3 3 3 3 3 3
44 4 3 4 4 5 4 4 4 5 5 5 4 3
45 3 4 4 3 4 4 4 3 4 5 5 3 4
46 5 5 4 5 5 5 4 4 5 5 5 5 5
47 5 5 5 4 5 5 4 3 5 5 5 5 5
48 4 4 3 4 4 4 3 3 4 4 5 4 4
49 3 3 3 3 3 3 3 3 4 4 4 3 3
50 5 5 5 5 5 5 4 5 5 5 5 5 5

145
Universitas Esa Unggul
No Persepsi Label Halal Attention to Ingredients Information
LH1 LH2 LH3 LH4 LH5 LH6 LH7 LH8 AI1 AI2 AI3 AI4 AI5
51 3 5 5 5 5 5 4 5 5 5 5 3 5
52 5 5 5 5 5 5 4 5 4 4 4 5 5
53 4 5 5 5 5 5 5 4 5 5 5 4 5
54 5 5 5 4 4 5 4 5 5 5 5 5 5
55 5 5 5 5 5 5 4 5 5 5 5 5 5
56 5 5 5 5 5 5 4 5 5 5 5 5 5
57 5 5 5 5 5 5 4 5 5 5 5 5 5
58 5 5 5 5 5 5 4 5 5 5 5 5 5
59 5 5 5 5 5 5 4 5 5 5 5 5 5
60 5 5 5 5 5 5 4 5 5 5 5 5 5
61 5 5 5 5 5 5 4 5 5 5 5 5 5
62 5 5 5 5 5 5 4 5 5 5 5 5 5
63 3 2 2 3 4 3 2 3 2 3 3 3 2
64 4 4 3 4 4 4 3 3 4 4 5 4 4
65 5 5 5 5 5 5 4 5 5 5 5 5 5
66 4 4 4 4 4 4 2 2 4 4 4 4 4
67 5 5 5 5 5 5 5 5 5 5 5 5 5
68 5 5 5 5 5 5 5 4 5 5 5 5 5
69 3 3 3 5 5 5 3 3 3 5 5 3 3
70 3 3 3 4 4 4 4 4 5 5 5 3 3
71 3 3 3 3 3 3 3 3 5 5 5 3 3
72 2 2 3 3 3 3 3 3 4 4 4 2 2
73 3 3 3 3 5 4 3 3 3 3 3 3 3
74 4 3 4 4 5 4 4 4 5 5 5 4 3
75 3 4 4 3 4 4 4 3 4 5 5 3 4
76 5 5 4 5 5 5 4 4 5 5 5 5 5
77 5 5 5 4 5 5 4 3 5 5 5 5 5
146
Universitas Esa Unggul
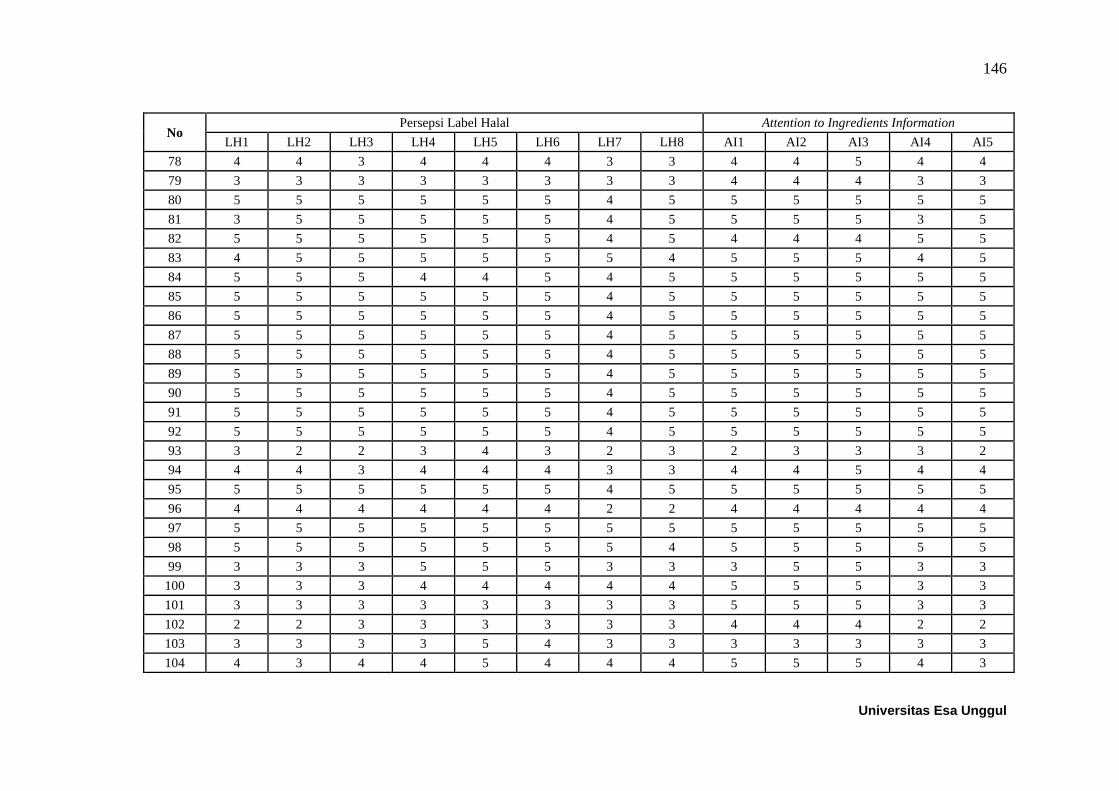
No Persepsi Label Halal Attention to Ingredients Information
LH1 LH2 LH3 LH4 LH5 LH6 LH7 LH8 AI1 AI2 AI3 AI4 AI5
78 4 4 3 4 4 4 3 3 4 4 5 4 4
79 3 3 3 3 3 3 3 3 4 4 4 3 3
80 5 5 5 5 5 5 4 5 5 5 5 5 5
81 3 5 5 5 5 5 4 5 5 5 5 3 5
82 5 5 5 5 5 5 4 5 4 4 4 5 5
83 4 5 5 5 5 5 5 4 5 5 5 4 5
84 5 5 5 4 4 5 4 5 5 5 5 5 5
85 5 5 5 5 5 5 4 5 5 5 5 5 5
86 5 5 5 5 5 5 4 5 5 5 5 5 5
87 5 5 5 5 5 5 4 5 5 5 5 5 5
88 5 5 5 5 5 5 4 5 5 5 5 5 5
89 5 5 5 5 5 5 4 5 5 5 5 5 5
90 5 5 5 5 5 5 4 5 5 5 5 5 5
91 5 5 5 5 5 5 4 5 5 5 5 5 5
92 5 5 5 5 5 5 4 5 5 5 5 5 5
93 3 2 2 3 4 3 2 3 2 3 3 3 2
94 4 4 3 4 4 4 3 3 4 4 5 4 4
95 5 5 5 5 5 5 4 5 5 5 5 5 5
96 4 4 4 4 4 4 2 2 4 4 4 4 4
97 5 5 5 5 5 5 5 5 5 5 5 5 5
98 5 5 5 5 5 5 5 4 5 5 5 5 5
99 3 3 3 5 5 5 3 3 3 5 5 3 3
100 3 3 3 4 4 4 4 4 5 5 5 3 3
101 3 3 3 3 3 3 3 3 5 5 5 3 3
102 2 2 3 3 3 3 3 3 4 4 4 2 2
103 3 3 3 3 5 4 3 3 3 3 3 3 3
104 4 3 4 4 5 4 4 4 5 5 5 4 3

147
Universitas Esa Unggul
No Persepsi Label Halal Attention to Ingredients Information
LH1 LH2 LH3 LH4 LH5 LH6 LH7 LH8 AI1 AI2 AI3 AI4 AI5
105 3 4 4 3 4 4 4 3 4 5 5 3 4
106 5 5 4 5 5 5 4 4 5 5 5 5 5
107 5 5 5 4 5 5 4 3 5 5 5 5 5
108 4 4 3 4 4 4 3 3 4 4 5 4 4
109 3 3 3 3 3 3 3 3 4 4 4 3 3
110 5 5 5 5 5 5 4 5 5 5 5 5 5
111 3 5 5 5 5 5 4 5 5 5 5 3 5
112 5 5 5 5 5 5 4 5 4 4 4 5 5
113 4 5 5 5 5 5 5 4 5 5 5 4 5
114 5 5 5 4 4 5 4 5 5 5 5 5 5
115 5 5 5 5 5 5 4 5 5 5 5 5 5
116 5 5 5 5 5 5 4 5 5 5 5 5 5
117 5 5 5 5 5 5 4 5 5 5 5 5 5
118 5 5 5 5 5 5 4 5 5 5 5 5 5
119 5 5 5 5 5 5 4 5 5 5 5 5 5
120 5 5 5 5 5 5 4 5 5 5 5 5 5
148
Universitas Esa Unggul
Lampiran 4
Data Kuesioner After Pre-test (lanjutan)
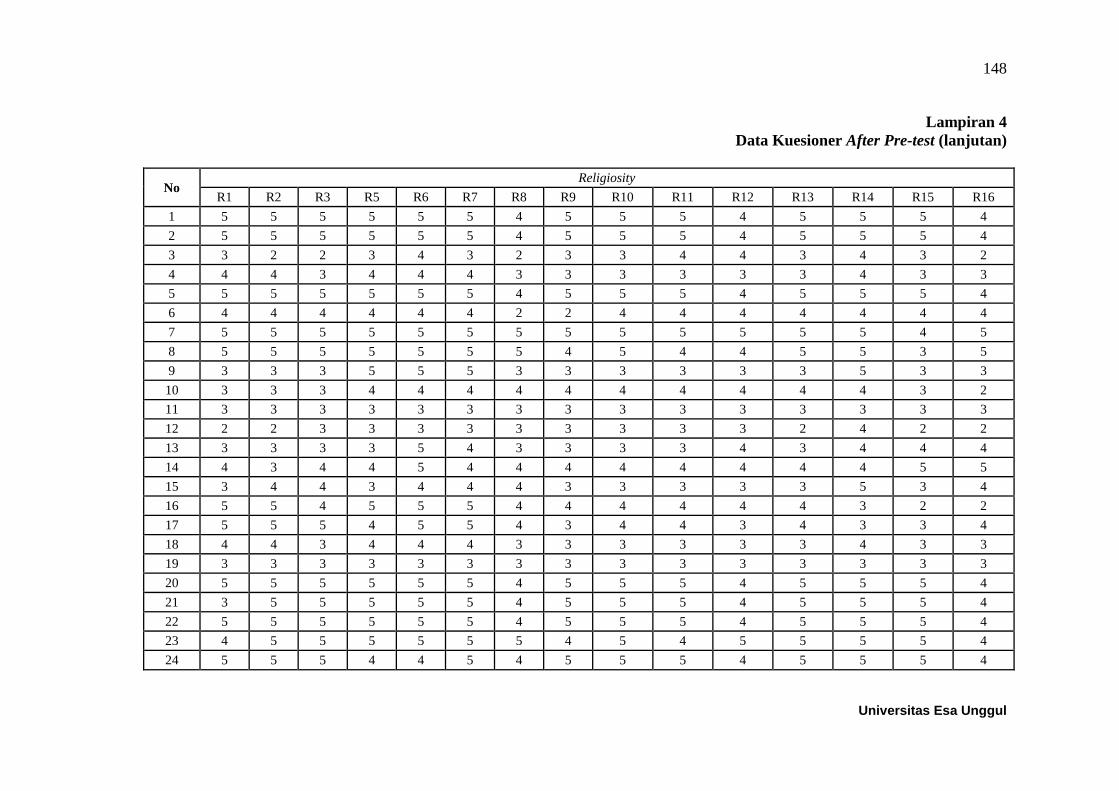
No Religiosity
R1 R2 R3 R5 R6 R7 R8 R9 R10 R11 R12 R13 R14 R15 R16
1 5 5 5 5 5 5 4 5 5 5 4 5 5 5 4
2 5 5 5 5 5 5 4 5 5 5 4 5 5 5 4
3 3 2 2 3 4 3 2 3 3 4 4 3 4 3 2
4 4 4 3 4 4 4 3 3 3 3 3 3 4 3 3
5 5 5 5 5 5 5 4 5 5 5 4 5 5 5 4
6 4 4 4 4 4 4 2 2 4 4 4 4 4 4 4
7 5 5 5 5 5 5 5 5 5 5 5 5 5 4 5
8 5 5 5 5 5 5 5 4 5 4 4 5 5 3 5
9 3 3 3 5 5 5 3 3 3 3 3 3 5 3 3
10 3 3 3 4 4 4 4 4 4 4 4 4 4 3 2
11 3 3 3 3 3 3 3 3 3 3 3 3 3 3 3
12 2 2 3 3 3 3 3 3 3 3 3 2 4 2 2
13 3 3 3 3 5 4 3 3 3 3 4 3 4 4 4
14 4 3 4 4 5 4 4 4 4 4 4 4 4 5 5
15 3 4 4 3 4 4 4 3 3 3 3 3 5 3 4
16 5 5 4 5 5 5 4 4 4 4 4 4 3 2 2
17 5 5 5 4 5 5 4 3 4 4 3 4 3 3 4
18 4 4 3 4 4 4 3 3 3 3 3 3 4 3 3
19 3 3 3 3 3 3 3 3 3 3 3 3 3 3 3
20 5 5 5 5 5 5 4 5 5 5 4 5 5 5 4
21 3 5 5 5 5 5 4 5 5 5 4 5 5 5 4
22 5 5 5 5 5 5 4 5 5 5 4 5 5 5 4
23 4 5 5 5 5 5 5 4 5 4 5 5 5 5 4
24 5 5 5 4 4 5 4 5 5 5 4 5 5 5 4

149
Universitas Esa Unggul
No Religiosity
R1 R2 R3 R5 R6 R7 R8 R9 R10 R11 R12 R13 R14 R15 R16
25 5 5 5 5 5 5 4 5 5 5 4 5 5 5 4
26 5 5 5 5 5 5 4 5 5 5 4 5 5 5 4
27 5 5 5 5 5 5 4 5 5 5 4 5 5 5 4
28 5 5 5 5 5 5 4 5 5 5 4 5 5 5 4
29 5 5 5 5 5 5 4 5 5 5 4 5 5 5 4
30 5 5 5 5 5 5 4 5 5 4 5 5 5 5 4
31 5 5 5 5 5 5 4 5 5 5 4 5 5 5 4
32 5 5 5 5 5 5 4 5 5 5 4 5 5 5 4
33 3 2 2 3 4 3 2 3 3 4 4 3 4 3 2
34 4 4 3 4 4 4 3 3 3 3 3 3 4 3 3
35 5 5 5 5 5 5 4 5 5 5 4 5 5 5 4
36 4 4 4 4 4 4 2 2 4 4 4 4 4 4 4
37 5 5 5 5 5 5 5 5 5 5 5 5 5 4 5
38 5 5 5 5 5 5 5 4 5 4 4 5 5 3 5
39 3 3 3 5 5 5 3 3 3 3 3 3 5 3 3
40 3 3 3 4 4 4 4 4 4 4 4 4 4 3 2
41 3 3 3 3 3 3 3 3 3 3 3 3 3 3 3
42 2 2 3 3 3 3 3 3 3 3 3 2 4 2 2
43 3 3 3 3 5 4 3 3 3 3 4 3 4 4 4
44 4 3 4 4 5 4 4 4 4 4 4 4 4 5 5
45 3 4 4 3 4 4 4 3 3 3 3 3 5 3 4
46 5 5 4 5 5 5 4 4 4 4 4 4 3 2 2
47 5 5 5 4 5 5 4 3 4 4 3 4 3 3 4
48 4 4 3 4 4 4 3 3 3 3 3 3 4 3 3
49 3 3 3 3 3 3 3 3 3 3 3 3 3 3 3
50 5 5 5 5 5 5 4 5 5 5 4 5 5 5 4
51 3 5 5 5 5 5 4 5 5 5 4 5 5 5 4

150
Universitas Esa Unggul
No Religiosity
R1 R2 R3 R5 R6 R7 R8 R9 R10 R11 R12 R13 R14 R15 R16
52 5 5 5 5 5 5 4 5 5 5 4 5 5 5 4
53 4 5 5 5 5 5 5 4 5 4 5 5 5 5 4
54 5 5 5 4 4 5 4 5 5 5 4 5 5 5 4
55 5 5 5 5 5 5 4 5 5 5 4 5 5 5 4
56 5 5 5 5 5 5 4 5 5 5 4 5 5 5 4
57 5 5 5 5 5 5 4 5 5 5 4 5 5 5 4
58 5 5 5 5 5 5 4 5 5 5 4 5 5 5 4
59 5 5 5 5 5 5 4 5 5 5 4 5 5 5 4
60 5 5 5 5 5 5 4 5 5 4 5 5 5 5 4
61 5 5 5 5 5 5 4 5 5 5 4 5 5 5 4
62 5 5 5 5 5 5 4 5 5 5 4 5 5 5 4
63 3 2 2 3 4 3 2 3 3 4 4 3 4 3 2
64 4 4 3 4 4 4 3 3 3 3 3 3 4 3 3
65 5 5 5 5 5 5 4 5 5 5 4 5 5 5 4
66 4 4 4 4 4 4 2 2 4 4 4 4 4 4 4
67 5 5 5 5 5 5 5 5 5 5 5 5 5 4 5
68 5 5 5 5 5 5 5 4 5 4 4 5 5 3 5
69 3 3 3 5 5 5 3 3 3 3 3 3 5 3 3
70 3 3 3 4 4 4 4 4 4 4 4 4 4 3 2
71 3 3 3 3 3 3 3 3 3 3 3 3 3 3 3
72 2 2 3 3 3 3 3 3 3 3 3 2 4 2 2
73 3 3 3 3 5 4 3 3 3 3 4 3 4 4 4
74 4 3 4 4 5 4 4 4 4 4 4 4 4 5 5
75 3 4 4 3 4 4 4 3 3 3 3 3 5 3 4
76 5 5 4 5 5 5 4 4 4 4 4 4 3 2 2
77 5 5 5 4 5 5 4 3 4 4 3 4 3 3 4
78 4 4 3 4 4 4 3 3 3 3 3 3 4 3 3

151
Universitas Esa Unggul
No Religiosity
R1 R2 R3 R5 R6 R7 R8 R9 R10 R11 R12 R13 R14 R15 R16
79 3 3 3 3 3 3 3 3 3 3 3 3 3 3 3
80 5 5 5 5 5 5 4 5 5 5 4 5 5 5 4
81 3 5 5 5 5 5 4 5 5 5 4 5 5 5 4
82 5 5 5 5 5 5 4 5 5 5 4 5 5 5 4
83 4 5 5 5 5 5 5 4 5 4 5 5 5 5 4
84 5 5 5 4 4 5 4 5 5 5 4 5 5 5 4
85 5 5 5 5 5 5 4 5 5 5 4 5 5 5 4
86 5 5 5 5 5 5 4 5 5 5 4 5 5 5 4
87 5 5 5 5 5 5 4 5 5 5 4 5 5 5 4
88 5 5 5 5 5 5 4 5 5 5 4 5 5 5 4
89 5 5 5 5 5 5 4 5 5 5 4 5 5 5 4
90 5 5 5 5 5 5 4 5 5 4 5 5 5 5 4
91 5 5 5 5 5 5 4 5 5 5 4 5 5 5 4
92 5 5 5 5 5 5 4 5 5 5 4 5 5 5 4
93 3 2 2 3 4 3 2 3 3 4 4 3 4 3 2
94 4 4 3 4 4 4 3 3 3 3 3 3 4 3 3
95 5 5 5 5 5 5 4 5 5 5 4 5 5 5 4
96 4 4 4 4 4 4 2 2 4 4 4 4 4 4 4
97 5 5 5 5 5 5 5 5 5 5 5 5 5 4 5
98 5 5 5 5 5 5 5 4 5 4 4 5 5 3 5
99 3 3 3 5 5 5 3 3 3 3 3 3 5 3 3
100 3 3 3 4 4 4 4 4 4 4 4 4 4 3 2
101 3 3 3 3 3 3 3 3 3 3 3 3 3 3 3
102 2 2 3 3 3 3 3 3 3 3 3 2 4 2 2
103 3 3 3 3 5 4 3 3 3 3 4 3 4 4 4
104 4 3 4 4 5 4 4 4 4 4 4 4 4 5 5
105 3 4 4 3 4 4 4 3 3 3 3 3 5 3 4

152
Universitas Esa Unggul
No Religiosity
R1 R2 R3 R5 R6 R7 R8 R9 R10 R11 R12 R13 R14 R15 R16
106 5 5 4 5 5 5 4 4 4 4 4 4 3 2 2
107 5 5 5 4 5 5 4 3 4 4 3 4 3 3 4
108 4 4 3 4 4 4 3 3 3 3 3 3 4 3 3
109 3 3 3 3 3 3 3 3 3 3 3 3 3 3 3
110 5 5 5 5 5 5 4 5 5 5 4 5 5 5 4
111 3 5 5 5 5 5 4 5 5 5 4 5 5 5 4
112 5 5 5 5 5 5 4 5 5 5 4 5 5 5 4
113 4 5 5 5 5 5 5 4 5 4 5 5 5 5 4
114 5 5 5 4 4 5 4 5 5 5 4 5 5 5 4
115 5 5 5 5 5 5 4 5 5 5 4 5 5 5 4
116 5 5 5 5 5 5 4 5 5 5 4 5 5 5 4
117 5 5 5 5 5 5 4 5 5 5 4 5 5 5 4
118 5 5 5 5 5 5 4 5 5 5 4 5 5 5 4
119 5 5 5 5 5 5 4 5 5 5 4 5 5 5 4
120 5 5 5 5 5 5 4 5 5 4 5 5 5 5 4

153
Universitas Esa Unggul
Lampiran 4
Data Kuesioner After Pre-test (lanjutan)
No CFT Intensi Pembelian Produk Halal
CFT1 CFT2 CFT3 CFT4 CFT5 CFT6 CFT7 CFT8 CFT9 CFT10 IH1 IH2 IH3 IH4
1 4 5 5 5 5 5 5 4 5 5 4 5 5 5
2 4 5 5 5 5 5 5 4 5 5 4 5 5 5
3 2 3 2 2 3 4 3 2 3 3 4 3 4 3
4 3 4 4 3 4 4 4 3 3 3 3 3 4 3
5 4 5 5 5 5 5 5 4 5 5 4 5 5 5
6 4 4 4 4 4 4 4 2 2 4 4 4 4 4
7 5 5 5 5 5 5 5 5 5 5 5 5 5 4
8 5 5 5 5 5 5 5 5 4 5 4 5 5 3
9 3 3 3 3 5 5 5 3 3 3 3 3 5 3
10 2 3 3 3 4 4 4 4 4 4 4 4 4 3
11 3 3 3 3 3 3 3 3 3 3 3 3 3 3
12 2 2 2 3 3 3 3 3 3 3 3 2 4 2
13 4 3 3 3 3 5 4 3 3 3 4 3 4 4
14 5 4 3 4 4 5 4 4 4 4 4 4 4 5
15 4 3 4 4 3 4 4 4 3 3 3 3 5 3
16 2 5 5 4 5 5 5 4 4 4 4 4 3 2
17 4 5 5 5 4 5 5 4 3 4 3 4 3 3
18 3 4 4 3 4 4 4 3 3 3 3 3 4 3
19 3 3 3 3 3 3 3 3 3 3 3 3 3 3
20 4 5 5 5 5 5 5 4 5 5 4 5 5 5
21 4 3 5 5 5 5 5 4 5 5 4 5 5 5
22 4 5 5 5 5 5 5 4 5 5 4 5 5 5
23 4 4 5 5 5 5 5 5 4 5 5 5 5 5
24 4 5 5 5 4 4 5 4 5 5 4 5 5 5

154
Universitas Esa Unggul
No CFT Intensi Pembelian Produk Halal
CFT1 CFT2 CFT3 CFT4 CFT5 CFT6 CFT7 CFT8 CFT9 CFT10 IH1 IH2 IH3 IH4
25 4 5 5 5 5 5 5 4 5 5 4 5 5 5
26 2 3 2 2 3 4 3 2 3 3 4 5 5 5
27 3 4 4 3 4 4 4 3 3 3 4 5 5 5
28 4 5 5 5 5 5 5 4 5 5 4 5 5 5
29 4 4 4 4 4 4 4 2 2 4 4 5 5 5
30 5 5 5 5 5 5 5 5 5 5 5 5 5 5
31 5 5 5 5 5 5 5 5 4 5 4 5 5 5
32 3 3 3 3 5 5 5 3 3 3 4 5 5 5
33 2 3 3 3 4 4 4 4 4 4 4 3 4 3
34 3 3 3 3 3 3 3 3 3 3 3 3 4 3
35 2 2 2 3 3 3 3 3 3 3 4 5 5 5
36 2 3 2 2 3 4 3 2 3 3 4 4 4 4
37 3 4 4 3 4 4 4 3 3 3 5 5 5 4
38 4 5 5 5 5 5 5 4 5 5 4 5 5 3
39 4 4 4 4 4 4 4 2 2 4 3 3 5 3
40 5 5 5 5 5 5 5 5 5 5 4 4 4 3
41 5 5 5 5 5 5 5 5 4 5 3 3 3 3
42 3 3 3 3 5 5 5 3 3 3 3 2 4 2
43 2 3 3 3 4 4 4 4 4 4 4 3 4 4
44 3 3 3 3 3 3 3 3 3 3 4 4 4 5
45 2 2 2 3 3 3 3 3 3 3 3 3 5 3
46 2 3 2 2 3 4 3 2 3 3 4 4 3 2
47 3 4 4 3 4 4 4 3 3 3 3 4 3 3
48 4 5 5 5 5 5 5 4 5 5 3 3 4 3
49 4 4 4 4 4 4 4 2 2 4 3 3 3 3
50 5 5 5 5 5 5 5 5 5 5 4 5 5 5
51 5 5 5 5 5 5 5 5 4 5 4 5 5 5

155
Universitas Esa Unggul
No CFT Intensi Pembelian Produk Halal
CFT1 CFT2 CFT3 CFT4 CFT5 CFT6 CFT7 CFT8 CFT9 CFT10 IH1 IH2 IH3 IH4
52 3 3 3 3 5 5 5 3 3 3 4 5 5 5
53 2 3 3 3 4 4 4 4 4 4 5 5 5 5
54 3 3 3 3 3 3 3 3 3 3 4 5 5 5
55 2 2 2 3 3 3 3 3 3 3 4 5 5 5
56 2 3 2 2 3 4 3 2 3 3 4 5 5 5
57 3 4 4 3 4 4 4 3 3 3 4 5 5 5
58 4 5 5 5 5 5 5 4 5 5 4 5 5 5
59 4 4 4 4 4 4 4 2 2 4 4 5 5 5
60 5 5 5 5 5 5 5 5 5 5 5 5 5 5
61 5 5 5 5 5 5 5 5 4 5 4 5 5 5
62 3 3 3 3 5 5 5 3 3 3 4 5 5 5
63 2 3 3 3 4 4 4 4 4 4 4 3 4 3
64 3 3 3 3 3 3 3 3 3 3 3 3 4 3
65 2 2 2 3 3 3 3 3 3 3 4 5 5 5
66 4 3 3 3 3 5 4 3 3 3 4 4 4 4
67 5 4 3 4 4 5 4 4 4 4 5 5 5 4
68 4 3 4 4 3 4 4 4 3 3 4 5 5 3
69 2 5 5 4 5 5 5 4 4 4 3 3 5 3
70 4 5 5 5 4 5 5 4 3 4 4 4 4 3
71 3 4 4 3 4 4 4 3 3 3 3 3 3 3
72 3 3 3 3 3 3 3 3 3 3 3 2 4 2
73 4 5 5 5 5 5 5 4 5 5 4 3 4 4
74 4 3 5 5 5 5 5 4 5 5 4 4 4 5
75 4 5 5 5 5 5 5 4 5 5 3 3 5 3
76 4 4 5 5 5 5 5 5 4 5 4 4 3 2
77 5 5 3 3 3 3 3 3 3 3 3 4 3 3
78 4 4 2 2 2 2 3 3 3 3 3 3 4 3

156
Universitas Esa Unggul
No CFT Intensi Pembelian Produk Halal
CFT1 CFT2 CFT3 CFT4 CFT5 CFT6 CFT7 CFT8 CFT9 CFT10 IH1 IH2 IH3 IH4
79 3 3 3 3 3 3 3 3 5 4 3 3 3 3
80 5 5 4 3 4 3 4 4 5 4 4 5 5 5
81 4 4 4 4 4 4 2 2 4 4 4 5 5 5
82 5 5 5 5 5 5 5 5 5 5 4 5 5 5
83 5 5 5 5 5 5 5 4 5 4 5 5 5 5
84 3 3 3 5 5 5 3 3 3 3 4 5 5 5
85 3 3 3 4 4 4 4 4 4 4 4 5 5 5
86 3 3 3 3 3 3 3 3 3 3 4 5 5 5
87 2 2 3 3 3 3 3 3 3 3 4 5 5 5
88 3 3 3 3 5 4 3 3 3 3 4 5 5 5
89 4 3 4 4 5 4 4 4 4 4 4 5 5 5
90 3 4 4 3 4 4 4 3 3 3 5 5 5 5
91 5 5 4 5 5 5 4 4 4 4 4 5 5 5
92 5 5 5 4 5 5 4 3 4 4 4 5 5 5
93 5 5 5 5 5 5 4 5 5 5 4 3 4 3
94 4 4 4 4 4 4 2 2 4 4 3 3 4 3
95 5 5 5 5 5 5 5 5 5 5 4 5 5 5
96 5 5 5 5 5 5 5 4 5 4 4 4 4 4
97 3 3 3 5 5 5 3 3 3 3 5 5 5 4
98 3 3 3 4 4 4 4 4 4 4 4 5 5 3
99 3 3 3 3 3 3 3 3 3 3 3 3 5 3
100 2 2 3 3 3 3 3 3 3 3 4 4 4 3
101 3 2 2 3 4 3 2 3 3 4 3 3 3 3
102 4 4 3 4 4 4 3 3 3 3 3 2 4 2
103 5 5 5 5 5 5 4 5 5 5 4 3 4 4
104 4 4 4 4 4 4 2 2 4 4 4 4 4 5
105 5 5 5 5 5 5 5 5 5 5 3 3 5 3

157
Universitas Esa Unggul
No CFT Intensi Pembelian Produk Halal
CFT1 CFT2 CFT3 CFT4 CFT5 CFT6 CFT7 CFT8 CFT9 CFT10 IH1 IH2 IH3 IH4
106 5 5 5 5 5 5 5 4 5 4 4 4 3 2
107 3 3 3 5 5 5 3 3 3 3 3 4 3 3
108 3 3 3 4 4 4 4 4 4 4 3 3 4 3
109 3 3 3 3 3 3 3 3 3 3 3 3 3 3
110 5 5 5 4 5 5 5 4 5 5 4 5 5 5
111 4 4 4 2 2 4 4 4 4 4 4 5 5 5
112 5 5 5 5 5 5 5 5 5 5 4 5 5 5
113 5 5 5 5 4 5 4 4 5 5 5 5 5 5
114 5 5 5 3 3 3 3 3 3 5 4 5 5 5
115 4 4 4 4 4 4 4 4 4 4 4 5 5 5
116 3 3 3 3 3 3 3 3 3 3 4 5 5 5
117 3 3 3 3 3 3 3 3 2 4 4 5 5 5
118 3 5 4 3 3 3 3 4 3 4 4 5 5 5
119 4 5 4 4 4 4 4 4 4 4 4 5 5 5
120 4 5 4 4 4 4 4 4 4 4 5 5 5 5

137
Universitas Esa Unggul
Lampiran 4
Kuesioner Penelitian
KUESIONER PENELITIAN
LABEL HALAL, ATTENTION TO INGREDIENTS INFORMATION,
RELIGIOSITY, COUNTERFACTUAL THINKING TERHADAP INTENSI
PEMBELIAN
(STUDI PADA MINUMAN LIANG TEH CAP PANDA)
Sehubungan dengan penelitian tentang “Persepsi Label Halal, Religiosity,
Attention to Ingredients Information, Counterfactual Thinking Terhadap Intensi
Pembelian (Study Pada Minuman Liang Teh Cap Panda)” yang sedang saya
lakukan dalam rangka penyusunan tesis untuk program S2 dalam bidang
pemasaran, dengan ini saya mohon kesediaan Bapak / Ibu / Saudara / Saudari
untuk meluangkan waktu beberapa menit untuk mengisi kuesioner terlampir.
Kerahasiaan data Bapak / Ibu / Saudara / Saudari adalah prioritas saya sehingga
dimohonkan untuk mengisi kuisioner ini dengan sejujur-jujurnya.
Hormat saya,
Firgosti Flamboyant

138
Universitas Esa Unggul
Lampiran 4
Kuesioner Penelitian (lanjutan)
A. IDENTITAS RESPONDEN
1. Nama : _______________________________________
2. Usia : (1) < 20 tahun
(2) 20 – 29 tahun
(3) 30 – 39 tahun
(4) 40 – 49 tahun
(5) >50 tahun
3. Jenis Kelamin : __ Perempuan __ Laki-laki
4. Tingkat Pendidikan : ___ SMU/Sederajat ___ D3 ___ S1___ S2
5. Agama : (1) Islam (4) Hindu
(2) Kristen Khatolik (5) Budha
(3) Kristen Protestan (6) Lainnya
6. Pekerjaan : (1) Pelajar (4) Wiraswasta
(2) Pegawai Negeri (5) Lainnya
(3) Karyawan Swasta
7. Rata-rata konsumsi : (1) < 1 juta (4) 5 juta – 7.9 juta
(2) 1 juta – 2.9 juta (3) 3 juta – 4.9 juta
(5) >= 8 juta
8. Apakah anda pernah mengkonsumsi Liang Teh : ______ Ya ______ Tidak

139
Universitas Esa Unggul
9. Jika Anda mengkonsumsi Liang Teh brand apakah yang anda pilih ?
___________
Lampiran 4
Kuesioner Penelitian (lanjutan)
B. KUESIONER
Berilah tanda silang (X) pada pilihan jawaban sesuai kenyataan yang
Bapak/Ibu yang rasakan selama ini, serta tambahkan penjelasan mengenai
jawaban tersebut jika Bapak/Ibu anggap diperlukan. Angka 1 (satu) hingga 5
(lima) menunjukan kecenderungan jawaban.
SS = Sangat Setuju (5)
S = Setuju (4)
N = Netral (3)
TS = Tidak Setuju (2)
STS = Sangat Tidak Setuju (1)
No. Pernyataan SS S N TS STS
5 4 3 2 1
1. VARIABEL PERSEPSI LABEL HALAL
1
Saya selalu mengecek ada atau tidak logo halal yang ada
pada kemasan produk sebelum melakukan pembelian.
2
Menurut saya semua produk makanan dan minuman
seharusnya mendapatkan sertifikasi halal dari LPPOM
MUI.
3
Sistem/motode yang digunakan oleh produsen dalam
proses produksi berpengaruh penting dalam menentukan
status halal.
4
Saya akan segera melaporkan ke pihak yang terkait jika
menemukan label produk halal yang palsu.
5
Produk minuman halal harus dipisahkan untuk muslim
dan non-muslim dalam penempatannya.
6
Yang berhak untuk mengeluarkan logo halal adalah
LPPOM MUI

140
Universitas Esa Unggul
Lampiran 4
Kuesioner Penelitian (lanjutan)
No. Pernyataan SS S N TS STS
5 4 3 2 1
1. VARIABEL PERSEPSI LABEL HALAL
7
LPPOM MUI wajib mengambil tindakan kepada semua
produsen yang tidak mengikuti standar halal.
8
Saya memilih minuman karena halal, tidak hanya
didasarkan pada "rasa" produk saja.
2. VARIABEL ATTENTION TO INGREDIENTS INFORMATION
9
Saya akan memilih minuman yang memiliki kandungan
bahan yang baik meskipun tidak memiliki logo halal.
10
Saya memperhatikan informasi ingredients pada
kemasan produk minuman yang saya beli.
11
Informasi Ingredients pada kemasan produk minuman
sangat penting bagi konsumen.
12 Tanggal kadaluwarsa produk adalah penting.
13
Minuman yang mengandung bahan pengawet kurang
disukai oleh konsumen.
3. VARIABEL RELIGIOSITY
14
Saya mempercayakan diri saya sepenuhnya hanya
kepada Tuhan.
15
Agama yang saya yakini memperkuat harga diri dan
identitas saya.
16
Mengetahui kasih Tuhan adalah fundamental bagi
kehidupan saya.
17
Saya percaya bahwa hal yang paling penting adalah
hubungan saya dengan Tuhan.
18
Pengalaman bersama Tuhan dalam hidup saya
memotivasi saya untuk hidup dalam kebaikan, meskipun
ini sulit.
19
Saya percaya kepada Tuhan dengan tulus, bukan bagian
dari kewajiban atau ketakutan.
20
Dalam berbagai pencobaan dan kesusahan, saya hanya
percaya pada Tuhan.

141
Universitas Esa Unggul
Lampiran 4
Kuesioner Penelitian (lanjutan)
No. Pernyataan SS S N TS STS
5 4 3 2 1
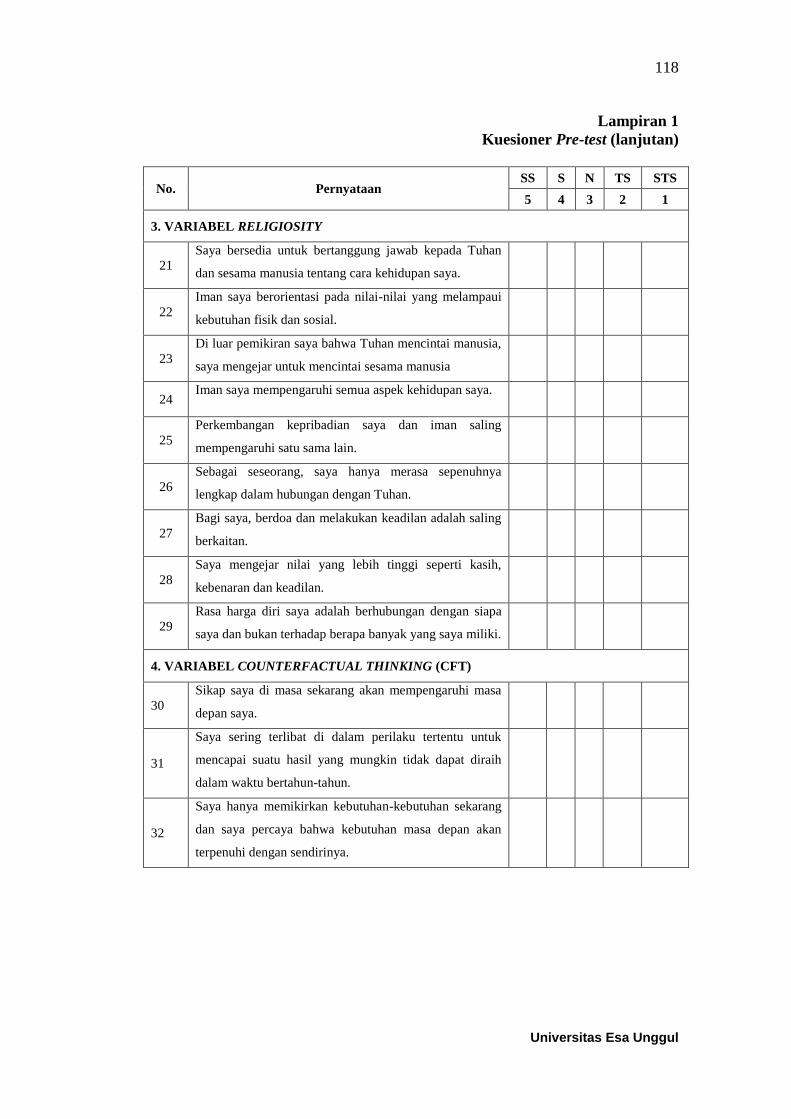
3. VARIABEL RELIGIOSITY
21
Saya bersedia untuk bertanggung jawab kepada Tuhan
dan sesama manusia tentang cara kehidupan saya.
22
Iman saya berorientasi pada nilai-nilai yang melampaui
kebutuhan fisik dan sosial.
23
Di luar pemikiran saya bahwa Tuhan mencintai manusia,
saya mengejar untuk mencintai sesama manusia
24 Iman saya mempengaruhi semua aspek kehidupan saya.
25
Perkembangan kepribadian saya dan iman saling
mempengaruhi satu sama lain.
26
Sebagai seseorang, saya hanya merasa sepenuhnya
lengkap dalam hubungan dengan Tuhan.
27
Bagi saya, berdoa dan melakukan keadilan adalah saling
berkaitan.
28
Saya mengejar nilai yang lebih tinggi seperti kasih,
kebenaran dan keadilan.
29
Rasa harga diri saya adalah berhubungan dengan siapa
saya dan bukan terhadap berapa banyak yang saya miliki.
4. VARIABEL COUNTERFACTUAL THINKING (CFT)
30
Sikap saya di masa sekarang akan mempengaruhi masa
depan saya.
31
Saya sering terlibat di dalam perilaku tertentu untuk
mencapai suatu hasil yang mungkin tidak dapat diraih
dalam waktu bertahun-tahun.
32
Saya hanya memikirkan kebutuhan-kebutuhan sekarang
dan saya percaya bahwa kebutuhan masa depan akan
terpenuhi dengan sendirinya.
142
Universitas Esa Unggul
Lampiran 4
Kuesioner Penelitian (lanjutan)
No. Pernyataan SS S N TS STS
5 4 3 2 1
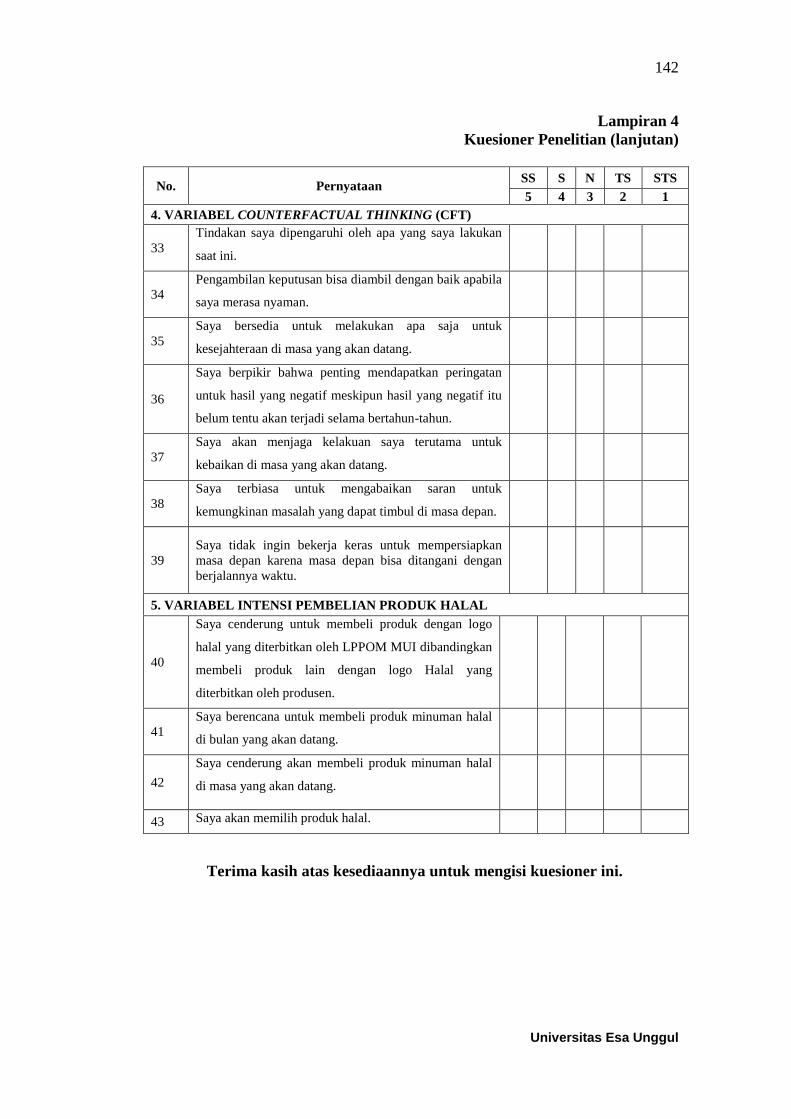
4. VARIABEL COUNTERFACTUAL THINKING (CFT)
33
Tindakan saya dipengaruhi oleh apa yang saya lakukan
saat ini.
34
Pengambilan keputusan bisa diambil dengan baik apabila
saya merasa nyaman.
35
Saya bersedia untuk melakukan apa saja untuk
kesejahteraan di masa yang akan datang.
36
Saya berpikir bahwa penting mendapatkan peringatan
untuk hasil yang negatif meskipun hasil yang negatif itu
belum tentu akan terjadi selama bertahun-tahun.
37
Saya akan menjaga kelakuan saya terutama untuk
kebaikan di masa yang akan datang.
38
Saya terbiasa untuk mengabaikan saran untuk
kemungkinan masalah yang dapat timbul di masa depan.
39
Saya tidak ingin bekerja keras untuk mempersiapkan
masa depan karena masa depan bisa ditangani dengan
berjalannya waktu.
5. VARIABEL INTENSI PEMBELIAN PRODUK HALAL
40
Saya cenderung untuk membeli produk dengan logo
halal yang diterbitkan oleh LPPOM MUI dibandingkan
membeli produk lain dengan logo Halal yang
diterbitkan oleh produsen.
41
Saya berencana untuk membeli produk minuman halal
di bulan yang akan datang.
42
Saya cenderung akan membeli produk minuman halal
di masa yang akan datang.
43 Saya akan memilih produk halal.
Terima kasih atas kesediaannya untuk mengisi kuesioner ini.

158
Universitas Esa Unggul
Lampiran 5
Uji One Way ANOVA
1. Jenis Kelamin
Lower
Bound
Upper
Bound
60 0.0949193 0.9556664 0.123376 -0.1519556 0.3417941 -2.00464 1.00246
60 -0.0949193 1.0417899 0.1344945 -0.3640421 0.1742036 -2.00464 1.00246
120 0.00E+00 1 0.0912871 -0.1807576 0.1807576 -2.00464 1.00246
Fixed
Effects0.999656 0.0912557 -0.1807111 0.1807111
Random
Effects0.0949193 -1.2060634 1.2060634 0.0013641
60 0.0820615 1.0194731 0.1316134 -0.1812963 0.3454193 -2.96429 0.73445
60 -0.0820615 0.981798 0.1267496 -0.3356868 0.1715638 -2.96429 0.73445
120 0.00E+00 1 0.0912871 -0.1807576 0.1807576 -2.96429 0.73445
Fixed
Effects1.0008128 0.0913613 -0.1809202 0.1809202
Random
Effects.09136130
a-1.1608553
a1.1608553
a -0.0032256
60 0.0919381 0.9759738 0.1259977 -0.1601827 0.3440589 -1.9934 1.08728
60 -0.0919381 1.0233438 0.1321131 -0.3562958 0.1724196 -1.9934 1.08728
120 0.00E+00 1 0.0912871 -0.1807576 0.1807576 -1.9934 1.08728
Fixed
Effects0.9999394 0.0912816 -0.1807623 0.1807623
Random
Effects0.0919381 -1.1681843 1.1681843 0.0002406
60 0.0744977 1.0156876 0.1311247 -0.1878822 0.3368777 -1.51915 1.44852
60 -0.0744977 0.9869346 0.1274127 -0.32945 0.1804545 -1.51915 1.44852
120 0.00E+00 1 0.0912871 -0.1807576 0.1807576 -1.51915 1.44852
Fixed
Effects1.0014143 0.0914162 -0.181029 0.181029
Random
Effects.09141620
a-1.1615530
a1.1615530
a -0.005614
60 0.1079163 1.0220952 0.1319519 -0.1561188 0.3719515 -1.85901 1.28095
60 -0.1079163 0.9739528 0.1257368 -0.359515 0.1436823 -1.85901 0.99557
120 0.00E+00 1 0.0912871 -0.1807576 0.1807576 -1.85901 1.28095
Fixed
Effects0.9983142 0.0911332 -0.1804685 0.1804685
Random
Effects0.1079163 -1.3712072 1.3712072 0.0066814
IH
Perempuan
Laki-Laki
Total
Model
a. Warning: Between-component variance is negative. It was replaced by 0.0 in computing this random effects measure.
RL
Perempuan
Laki-Laki
Total
Model
CFT
Perempuan
Laki-Laki
Total
Model
LH
Perempuan
Laki-Laki
Total
Model
AI
Perempuan
Laki-Laki
Total
Model
Descriptives
N MeanStd.
DeviationStd. Error
95% Confidence
Interval for MeanMinimum Maximum
Between-
Componen
t Variance
Test of Homogeneity of Variances
Levene Statistic df1 df2 Sig.
LH 2.154 1 118 .145
AI .064 1 118 .800
RL .301 1 118 .584
CFT .426 1 118 .515
IH .323 1 118 .571

159
Universitas Esa Unggul
Lampiran 5
Uji One Way ANOVA (lanjutan)
ANOVA
Sum of Squares df Mean Square F Sig.
LH
Between Groups 1.081 1 1.081 1.082 .300
Within Groups 117.919 118 .999
Total 119.000 119
AI
Between Groups .808 1 .808 .807 .371
Within Groups 118.192 118 1.002
Total 119.000 119
RL
Between Groups 1.014 1 1.014 1.014 .316
Within Groups 117.986 118 1.000
Total 119.000 119
CFT
Between Groups .666 1 .666 .664 .417
Within Groups 118.334 118 1.003
Total 119.000 119
IH
Between Groups 1.398 1 1.398 1.402 .239
Within Groups 117.602 118 .997
Total 119.000 119
Robust Tests of Equality of Means
Statistica df1 df2 Sig.
LH Welch 1.082 1 117.132 .300
Brown-Forsythe 1.082 1 117.132 .300
AI Welch .807 1 117.833 .371
Brown-Forsythe .807 1 117.833 .371
RL Welch 1.014 1 117.736 .316
Brown-Forsythe 1.014 1 117.736 .316
CFT Welch .664 1 117.903 .417
Brown-Forsythe .664 1 117.903 .417
IH Welch 1.402 1 117.726 .239
Brown-Forsythe 1.402 1 117.726 .239
a. Asymptotically F distributed.

160
Universitas Esa Unggul
Lampiran 5
Uji One Way ANOVA (lanjutan)
Means Plots

161
Universitas Esa Unggul
Lampiran 5
Uji One Way ANOVA (lanjutan)

162
Universitas Esa Unggul
Lampiran 5
Uji One Way ANOVA (lanjutan)

163
Universitas Esa Unggul
Lampiran 5
Uji One Way ANOVA (lanjutan)
2. Usia
Lower
Bound
Upper
Bound
8 0.376239 0.978927 0.346103 -0.44216 1.194642 -1.70977 1.00246
68 0.107048 0.921163 0.111707 -0.11592 0.330017 -2.00464 1.00246
42 -0.224 1.079864 0.166627 -0.56051 0.112506 -2.00464 0.82874
2 -0.44052 1.794998 1.269255 -16.5679 15.6869 -1.70977 0.82874
120 0.00E+00 1 0.091287 -0.18076 0.180758 -2.00464 1.00246
Fixed
Effects0.993916 0.090732 -0.17971 0.179706
Random
Effects0.134198 -0.42708 0.427079 0.021807
8 0.262297 0.820767 0.290185 -0.42388 0.948476 -1.28982 0.73445
68 0.075876 0.909517 0.110295 -0.14427 0.296026 -2.96429 0.73445
42 -0.1864 1.167582 0.180162 -0.55024 0.177444 -2.96429 0.73445
2 0.285432 0.635002 0.449014 -5.41983 5.990694 -0.16358 0.73445
120 0.00E+00 1 0.091287 -0.18076 0.180758 -2.96429 0.73445
Fixed
Effects1.001877 0.091458 -0.18115 0.181145
Random
Effects
.09145844a
-
.2910616a .2910616
a -0.00675
8 0.368599 1.034347 0.365697 -0.49614 1.233335 -1.67882 1.08728
68 0.12021 0.918631 0.1114 -0.10215 0.342566 -1.9934 1.08728
42 -0.24564 1.068245 0.164834 -0.57853 0.087249 -1.9934 0.88535
2 -0.40311 1.804129 1.275712 -16.6126 15.80635 -1.67882 0.87261
120 0.00E+00 1 0.091287 -0.18076 0.180758 -1.9934 1.08728
Fixed
Effects0.991651 0.090525 -0.1793 0.179296
Random
Effects0.146952 -0.46767 0.467668 0.029889
8 0.328141 1.039063 0.367364 -0.54054 1.196819 -1.16513 1.44852
68 -0.07601 1.025068 0.124308 -0.32413 0.172106 -1.51915 1.44852
42 0.041049 0.95904 0.147983 -0.25781 0.339907 -1.51915 1.44852
2 0.40986 1.292315 0.913804 -11.2011 12.02085 -0.50394 1.32366
120 0.00E+00 1 0.091287 -0.18076 0.180758 -1.51915 1.44852
Fixed
Effects1.005755 0.091812 -0.18185 0.181846
Random
Effects
.09181243a
-
.2921881a .2921881
a -0.02075
8 0.330853 1.037855 0.366937 -0.53682 1.198522 -1.6268 1.28095
68 0.116203 0.939578 0.113941 -0.11122 0.343629 -1.85901 1.28095
42 -0.23182 1.047074 0.161567 -0.55811 0.094472 -1.85901 1.28095
2 -0.4061 1.726331 1.2207 -15.9166 15.10437 -1.6268 0.8146
120 0.00E+00 1 0.091287 -0.18076 0.180758 -1.85901 1.28095
Fixed
Effects0.99403 0.090742 -0.17973 0.179726
Random
Effects0.13352 -0.42492 0.42492 0.021398
a. Warning: Between-component variance is negative. It was replaced by 0.0 in computing this random effects measure.
IH
< 20 tahun
20 – 29 tahun
30 – 39 tahun
40 – 49 tahun
Total
Model
CFT
< 20 tahun
20 – 29 tahun
30 – 39 tahun
40 – 49 tahun
Total
Model
RL
< 20 tahun
20 – 29 tahun
30 – 39 tahun
40 – 49 tahun
Total
Model
AI
< 20 tahun
20 – 29 tahun
30 – 39 tahun
40 – 49 tahun
Total
Model
LH
< 20 tahun
20 – 29 tahun
30 – 39 tahun
40 – 49 tahun
Total
Model
Descriptives
N MeanStd.
DeviationStd. Error
95% Confidence
Interval for MeanMinimum Maximum
Between-
Compone
nt
Variance
164
Universitas Esa Unggul
Lampiran 5
Uji One Way ANOVA (lanjutan)
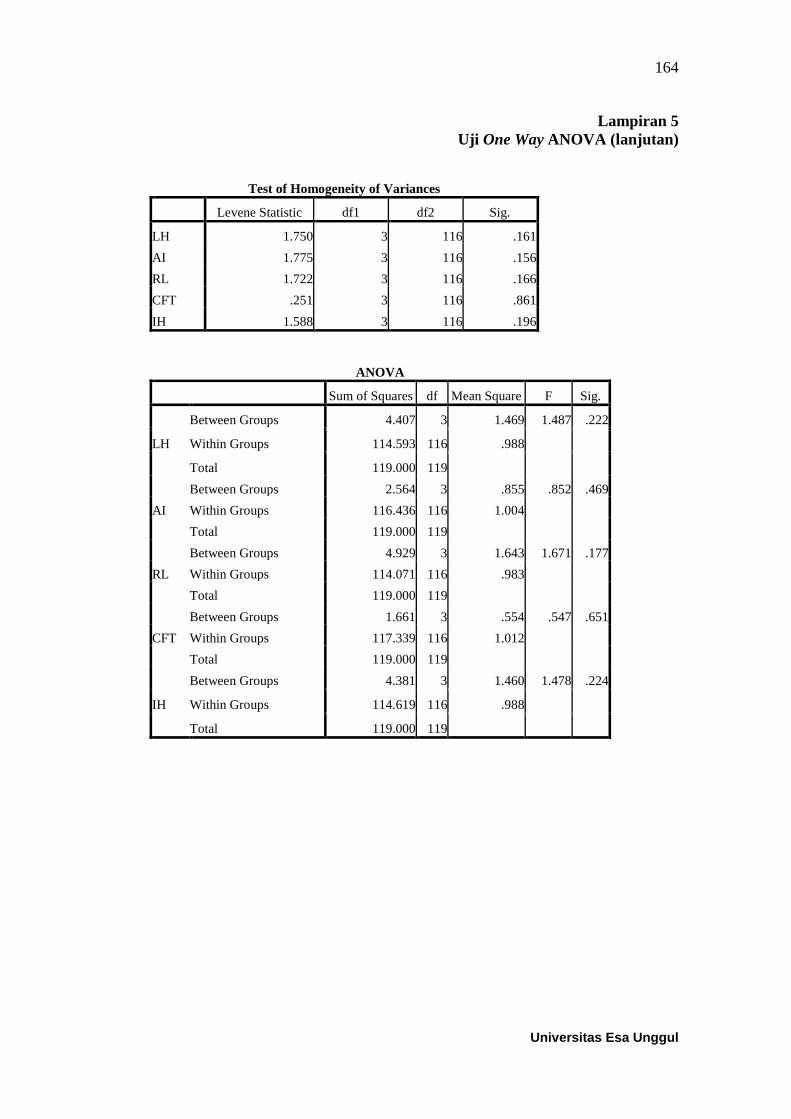
Test of Homogeneity of Variances
Levene Statistic df1 df2 Sig.
LH 1.750 3 116 .161
AI 1.775 3 116 .156
RL 1.722 3 116 .166
CFT .251 3 116 .861
IH 1.588 3 116 .196
ANOVA
Sum of Squares df Mean Square F Sig.
LH
Between Groups 4.407 3 1.469 1.487 .222
Within Groups 114.593 116 .988
Total 119.000 119
AI
Between Groups 2.564 3 .855 .852 .469
Within Groups 116.436 116 1.004
Total 119.000 119
RL
Between Groups 4.929 3 1.643 1.671 .177
Within Groups 114.071 116 .983
Total 119.000 119
CFT
Between Groups 1.661 3 .554 .547 .651
Within Groups 117.339 116 1.012
Total 119.000 119
IH
Between Groups 4.381 3 1.460 1.478 .224
Within Groups 114.619 116 .988
Total 119.000 119
165
Universitas Esa Unggul
Lampiran 5
Uji One Way ANOVA (lanjutan)
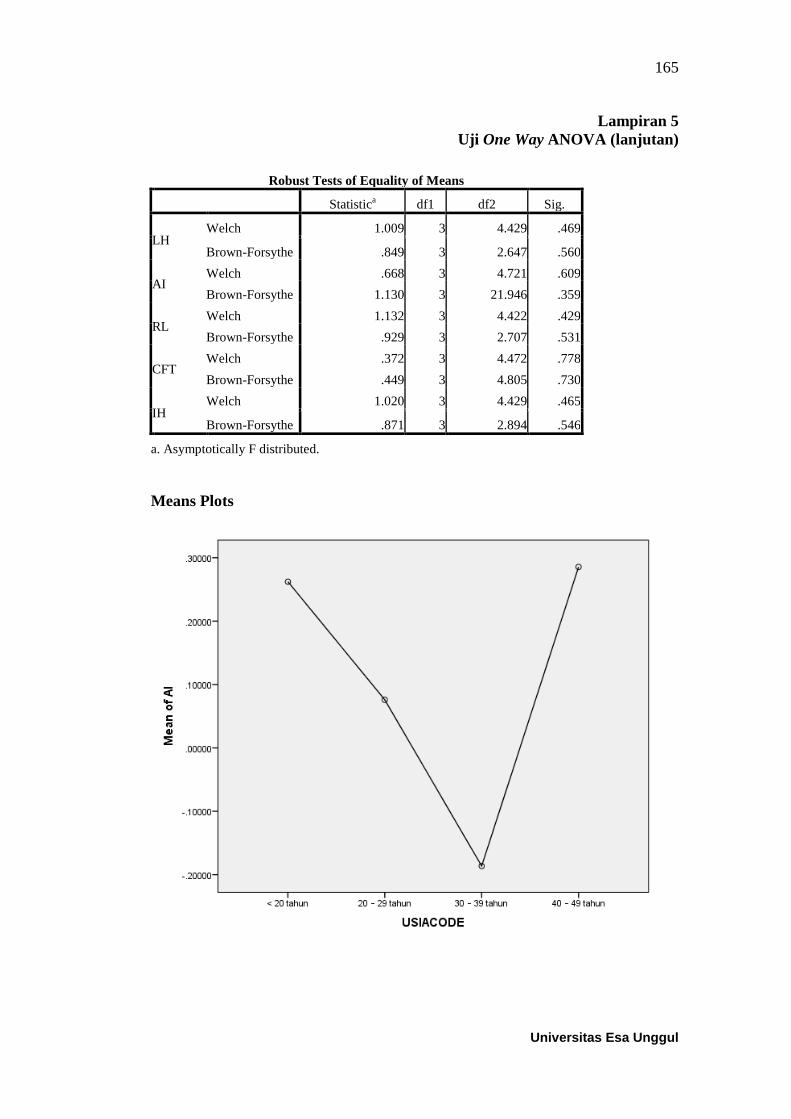
Robust Tests of Equality of Means
Statistica df1 df2 Sig.
LH Welch 1.009 3 4.429 .469
Brown-Forsythe .849 3 2.647 .560
AI Welch .668 3 4.721 .609
Brown-Forsythe 1.130 3 21.946 .359
RL Welch 1.132 3 4.422 .429
Brown-Forsythe .929 3 2.707 .531
CFT Welch .372 3 4.472 .778
Brown-Forsythe .449 3 4.805 .730
IH Welch 1.020 3 4.429 .465
Brown-Forsythe .871 3 2.894 .546
a. Asymptotically F distributed.
Means Plots

166
Universitas Esa Unggul
Lampiran 5
Uji One Way ANOVA (lanjutan)

167
Universitas Esa Unggul
Lampiran 5
Uji One Way ANOVA (lanjutan)

168
Universitas Esa Unggul
Lampiran 5
Uji One Way ANOVA (lanjutan)
3. Agama
Lower
Bound
Upper
Bound
63 0.598661 0.644313 0.081176 0.436393 0.76093 -2.00464 1.00246
13 -0.91395 0.864446 0.239754 -1.43633 -0.39157 -2.00464 0.82874
25 -0.17983 0.816308 0.163262 -0.51679 0.157121 -1.70977 1.00246
7 -1.16692 0.945884 0.357511 -2.04172 -0.29212 -2.00464 0.53444
12 -1.0975 0.653724 0.188714 -1.51286 -0.68215 -2.00464 -0.30295
120 0.00E+00 1 0.091287 -0.18076 0.180758 -2.00464 1.00246
Fixed
Effects0.726921 0.066358 -0.13144 0.131443
Random
Effects0.499819 -1.38772 1.38772 0.713072
63 0.460603 0.631629 0.079578 0.301529 0.619676 -2.41606 0.73445
13 -0.42472 0.748772 0.207672 -0.8772 0.027756 -1.73883 0.73445
25 0.047843 0.670305 0.134061 -0.22885 0.324531 -1.28982 0.73445
7 -1.79496 1.347705 0.509384 -3.04138 -0.54854 -2.96429 0.73445
12 -1.01066 1.178489 0.340201 -1.75944 -0.26188 -2.96429 0.05524
120 0.00E+00 1 0.091287 -0.18076 0.180758 -2.96429 0.73445
Fixed
Effects0.771343 0.070414 -0.13948 0.139476
Random
Effects0.464475 -1.28959 1.289591 0.612434
63 0.640245 0.646625 0.081467 0.477395 0.803095 -1.9934 1.08728
13 -0.92903 0.825248 0.228883 -1.42773 -0.43034 -1.9934 0.87261
25 -0.30269 0.833098 0.16662 -0.64657 0.041198 -1.67882 1.08728
7 -1.16595 0.616976 0.233195 -1.73655 -0.59534 -1.9934 -0.15341
12 -1.0441 0.605256 0.174722 -1.42866 -0.65954 -1.9934 -0.08276
120 0.00E+00 1 0.091287 -0.18076 0.180758 -1.9934 1.08728
Fixed
Effects0.704439 0.064306 -0.12738 0.127378
Random
Effects0.51604 -1.43276 1.432757 0.76173
63 0.226059 1.00895 0.127116 -0.02804 0.48016 -1.51915 1.44852
13 -0.60374 0.474609 0.131633 -0.89055 -0.31694 -1.39254 0.21982
25 -0.18253 1.012825 0.202565 -0.6006 0.235546 -1.51915 1.44852
7 -0.46735 0.894634 0.33814 -1.29475 0.360046 -1.51625 1.31492
12 0.120131 1.098238 0.317034 -0.57766 0.817918 -1.51915 1.44852
120 0.00E+00 1 0.091287 -0.18076 0.180758 -1.51915 1.44852
Fixed
Effects0.971359 0.088673 -0.17564 0.175643
Random
Effects0.192991 -0.53583 0.535829 0.085374
63 0.621336 0.706427 0.089001 0.443424 0.799247 -1.85901 1.28095
13 -0.91936 0.826444 0.229214 -1.41877 -0.41994 -1.85901 0.8146
25 -0.4468 0.923514 0.184703 -0.82801 -0.06559 -1.6268 1.28095
7 -0.91603 0.468928 0.177238 -1.34972 -0.48235 -1.85901 -0.4974
12 -0.80085 0.618246 0.178472 -1.19367 -0.40804 -1.85901 0.11246
120 0.00E+00 1 0.091287 -0.18076 0.180758 -1.85901 1.28095
Fixed
Effects0.752558 0.068699 -0.13608 0.136079
Random
Effects0.479996 -1.33268 1.332683 0.655719
IH
Islam
Kristen Khatolik
Kristen Protestan
Hindu
Budha
Total
Model
CFT
Islam
Kristen Khatolik
Kristen Protestan
Hindu
Budha
Total
Model
RL
Islam
Kristen Khatolik
Kristen Protestan
Hindu
Budha
Total
Model
AI
Islam
Kristen Khatolik
Kristen Protestan
Hindu
Budha
Total
Model
LH
Islam
Kristen Khatolik
Kristen Protestan
Hindu
Budha
Total
Model
Descriptives
N MeanStd.
DeviationStd. Error
95% Confidence
Interval for MeanMinimum Maximum
Between-
Compone
nt
Variance

169
Universitas Esa Unggul
Lampiran 5
Uji One Way ANOVA (lanjutan)
Test of Homogeneity of Variances
Levene Statistic df1 df2 Sig.
LH 3.815 4 115 .006
AI 6.297 4 115 .000
RL 2.749 4 115 .032
CFT 4.623 4 115 .002
IH 3.431 4 115 .011
ANOVA
Sum of Squares df Mean Square F Sig.
LH
Between Groups 58.232 4 14.558 27.551 .000
Within Groups 60.768 115 .528
Total 119.000 119
AI
Between Groups 50.578 4 12.645 21.253 .000
Within Groups 68.422 115 .595
Total 119.000 119
RL
Between Groups 61.933 4 15.483 31.202 .000
Within Groups 57.067 115 .496
Total 119.000 119
CFT
Between Groups 10.493 4 2.623 2.780 .030
Within Groups 108.507 115 .944
Total 119.000 119
IH
Between Groups 53.870 4 13.468 23.780 .000
Within Groups 65.130 115 .566
Total 119.000 119

170
Universitas Esa Unggul
Lampiran 5
Uji One Way ANOVA (lanjutan)
Robust Tests of Equality of Means
Statistica df1 df2 Sig.
LH Welch 25.703 4 24.168 .000
Brown-Forsythe 22.242 4 37.878 .000
AI Welch 11.300 4 23.384 .000
Brown-Forsythe 12.627 4 24.447 .000
RL Welch 32.810 4 25.170 .000
Brown-Forsythe 30.308 4 55.498 .000
CFT Welch 5.157 4 26.635 .003
Brown-Forsythe 3.146 4 47.066 .023
IH Welch 27.293 4 26.699 .000
Brown-Forsythe 25.995 4 62.498 .000
a. Asymptotically F distributed.
Means Plots

171
Universitas Esa Unggul

172
Universitas Esa Unggul
Lampiran 5
Uji One Way ANOVA (lanjutan)

173
Universitas Esa Unggul
Lampiran 5
Uji One Way ANOVA (lanjutan)
4. Pendidikan
Lower
Bound
Upper
Bound
24 0.449339 0.797616 0.162813 0.112535 0.786143 -1.70977 1.00246
30 -0.26916 1.045045 0.190798 -0.65939 0.121066 -2.00464 0.8634
59 -0.05348 0.975552 0.127006 -0.30771 0.200752 -2.00464 1.00246
7 0.063698 1.309022 0.494764 -1.14695 1.274341 -1.98803 0.82874
120 0.00E+00 1 0.091287 -0.18076 0.180758 -2.00464 1.00246
Fixed
Effects0.981658 0.089613 -0.17749 0.177489
Random
Effects0.16504 -0.52523 0.525231 0.055252
24 0.471215 0.545887 0.111429 0.240707 0.701723 -1.28982 0.73445
30 -0.37629 1.121629 0.20478 -0.79511 0.042533 -2.96429 0.73445
59 -0.00957 0.969977 0.12628 -0.26235 0.243204 -2.96429 0.73445
7 0.077765 1.382539 0.52255 -1.20087 1.3564 -2.96429 0.73445
120 0.00E+00 1 0.091287 -0.18076 0.180758 -2.96429 0.73445
Fixed
Effects0.971026 0.088642 -0.17557 0.175567
Random
Effects0.19503 -0.62067 0.620672 0.086812
24 0.417179 0.846642 0.17282 0.059673 0.774684 -1.67882 1.08728
30 -0.25177 1.022631 0.186706 -0.63363 0.130086 -1.9934 0.88535
59 -0.06011 0.988342 0.128671 -0.31767 0.197452 -1.9934 1.08728
7 0.15534 1.229488 0.464703 -0.98175 1.292427 -1.67882 0.88535
120 0.00E+00 1 0.091287 -0.18076 0.180758 -1.9934 1.08728
Fixed
Effects0.98497 0.089915 -0.17809 0.178088
Random
Effects0.154435 -0.49148 0.491482 0.04535
24 0.147466 0.990616 0.202209 -0.27083 0.565766 -1.51915 1.44852
30 -0.26996 0.993025 0.181301 -0.64076 0.100843 -1.51915 1.44852
59 -0.02228 0.97877 0.127425 -0.27734 0.232793 -1.51915 1.44852
7 0.839121 0.875871 0.331048 0.029076 1.649166 -0.50394 1.44852
120 0.00E+00 1 0.091287 -0.18076 0.180758 -1.51915 1.44852
Fixed
Effects0.97968 0.089432 -0.17713 0.177132
Random
Effects0.171045 -0.54434 0.544342 0.061151
24 0.29191 0.950734 0.194068 -0.10955 0.69337 -1.6268 1.28095
30 -0.2078 0.981017 0.179108 -0.57411 0.158521 -1.85901 1.28095
59 -0.04918 1.010833 0.131599 -0.31261 0.214243 -1.85901 1.28095
7 0.304252 1.072877 0.405509 -0.68799 1.296498 -1.6268 1.28095
120 0.00E+00 1 0.091287 -0.18076 0.180758 -1.85901 1.28095
Fixed
Effects0.995112 0.090841 -0.17992 0.179922
Random
Effects0.115781 -0.36847 0.368466 0.014823
IH
SMU/Sederajat
D3
S1
S2
Total
Model
CFT
SMU/Sederajat
D3
S1
S2
Total
Model
RL
SMU/Sederajat
D3
S1
S2
Total
Model
AI
SMU/Sederajat
D3
S1
S2
Total
Model
LH
SMU/Sederajat
D3
S1
S2
Total
Model
Descriptives
N MeanStd.
DeviationStd. Error
95% Confidence
Interval for MeanMinimum Maximum
Between-
Compone
nt
Variance

174
Universitas Esa Unggul
Lampiran 5
Uji One Way ANOVA (lanjutan)
Test of Homogeneity of Variances
Levene Statistic df1 df2 Sig.
LH 4.652 3 116 .004
AI 3.692 3 116 .014
RL 2.195 3 116 .092
CFT .269 3 116 .848
IH .731 3 116 .536
ANOVA
Sum of Squares df Mean Square F Sig.
LH
Between Groups 7.216 3 2.405 2.496 .063
Within Groups 111.784 116 .964
Total 119.000 119
AI
Between Groups 9.625 3 3.208 3.403 .020
Within Groups 109.375 116 .943
Total 119.000 119
RL
Between Groups 6.461 3 2.154 2.220 .090
Within Groups 112.539 116 .970
Total 119.000 119
CFT
Between Groups 7.666 3 2.555 2.663 .051
Within Groups 111.334 116 .960
Total 119.000 119
IH
Between Groups 4.131 3 1.377 1.391 .249
Within Groups 114.869 116 .990
Total 119.000 119

175
Universitas Esa Unggul
Lampiran 5
Uji One Way ANOVA (lanjutan)
Robust Tests of Equality of Means
Statistica df1 df2 Sig.
LH Welch 2.996 3 24.402 .050
Brown-Forsythe 2.107 3 24.839 .125
AI Welch 5.209 3 24.491 .006
Brown-Forsythe 2.782 3 20.747 .067
RL Welch 2.485 3 24.535 .084
Brown-Forsythe 1.971 3 28.463 .141
CFT Welch 2.909 3 25.536 .054
Brown-Forsythe 2.804 3 54.671 .048
IH Welch 1.364 3 24.903 .277
Brown-Forsythe 1.355 3 38.529 .271
a. Asymptotically F distributed.
Means Plots

176
Universitas Esa Unggul
Lampiran 5
Uji One Way ANOVA (lanjutan)

177
Universitas Esa Unggul
Lampiran 6
Hasil Uji After Pretest
1. Factor Analysis Variabel Persepsi Label Halal
KMO and Bartlett's Test
Kaiser-Meyer-Olkin Measure of Sampling Adequacy. .876
Bartlett's Test of Sphericity
Approx. Chi-Square 1186.468
df 28
Sig. .000
Anti-image Matrices
LH1 LH2 LH3 LH4 LH5 LH6 LH7 LH8
Anti-image
Covariance
LH1 .221 -.068 -.001 -.011 -.049 .017 .057 -.045
LH2 -.068 .078 -.049 -.006 .051 -.032 -.009 .029
LH3 -.001 -.049 .113 .023 -.009 -.007 -.055 -.066
LH4 -.011 -.006 .023 .152 -.012 -.046 .019 -.080
LH5 -.049 .051 -.009 -.012 .192 -.070 -.013 .011
LH6 .017 -.032 -.007 -.046 -.070 .061 -.015 .012
LH7 .057 -.009 -.055 .019 -.013 -.015 .369 -.084
LH8 -.045 .029 -.066 -.080 .011 .012 -.084 .292
Anti-image
Correlation
LH1 .900a -.516 -.005 -.058 -.237 .147 .198 -.179
LH2 -.516 .821a -.528 -.057 .414 -.460 -.052 .191
LH3 -.005 -.528 .895a .172 -.061 -.082 -.270 -.361
LH4 -.058 -.057 .172 .909a -.072 -.476 .081 -.379
LH5 -.237 .414 -.061 -.072 .843a -.640 -.048 .046
LH6 .147 -.460 -.082 -.476 -.640 .840a -.096 .087
LH7 .198 -.052 -.270 .081 -.048 -.096 .940a -.256
LH8 -.179 .191 -.361 -.379 .046 .087 -.256 .894a
a. Measures of Sampling Adequacy(MSA)

178
Universitas Esa Unggul
Lampiran 6
Hasil Uji After Pretest (lanjutan)
Component Matrixa
Component
1
LH1 .866
LH2 .930
LH3 .929
LH4 .908
LH5 .834
LH6 .953
LH7 .792
LH8 .840
Extraction Method: Principal Component Analysis.
a. 1 components extracted.
2. Factor Analysis Variabel Attention to Ingredients Information
KMO and Bartlett's Test
Kaiser-Meyer-Olkin Measure of Sampling Adequacy. .774
Bartlett's Test of Sphericity
Approx. Chi-Square 580.445
df 10
Sig. .000
Anti-image Matrices
AI1 AI2 AI3 AI4 AI5
Anti-image Covariance
AI1 .249 -.080 -.013 -.025 -.041
AI2 -.080 .135 -.112 .013 -.006
AI3 -.013 -.112 .168 .006 -.016
AI4 -.025 .013 .006 .251 -.176
AI5 -.041 -.006 -.016 -.176 .201
Anti-image Correlation
AI1 .900a -.434 -.064 -.101 -.183
AI2 -.434 .737a -.744 .072 -.036
AI3 -.064 -.744 .780a .031 -.087
AI4 -.101 .072 .031 .710a -.782
AI5 -.183 -.036 -.087 -.782 .746a
a. Measures of Sampling Adequacy(MSA)

179
Universitas Esa Unggul
Lampiran 6
Hasil Uji After Pretest (lanjutan)
Component Matrixa
Component
1
AI1 .908
AI2 .892
AI3 .877
AI4 .774
AI5 .860
Extraction Method: Principal Component Analysis.
a. 1 components extracted.
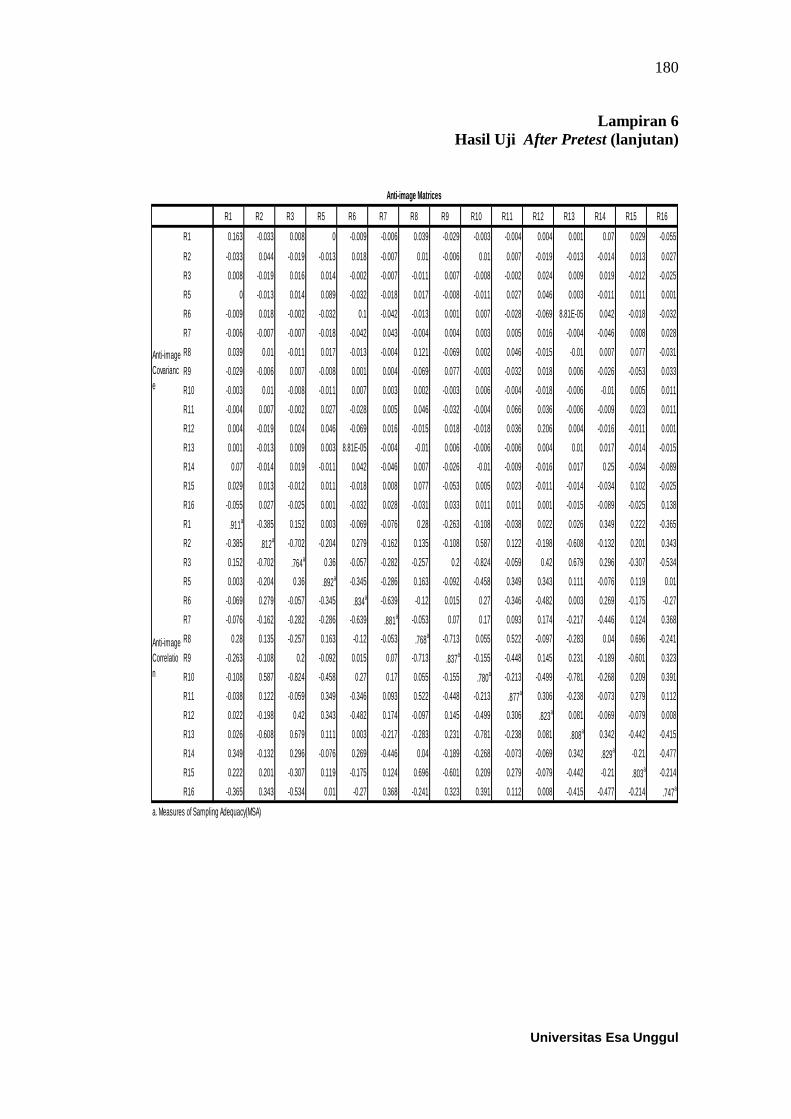
3. Factor Analysis Variabel Religiosity
KMO and Bartlett's Test
Kaiser-Meyer-Olkin Measure of Sampling Adequacy. .823
Bartlett's Test of Sphericity
Approx. Chi-Square 2977.989
df 105
Sig. .000
180
Universitas Esa Unggul
Lampiran 6
Hasil Uji After Pretest (lanjutan)
R1 R2 R3 R5 R6 R7 R8 R9 R10 R11 R12 R13 R14 R15 R16
R1 0.163 -0.033 0.008 0 -0.009 -0.006 0.039 -0.029 -0.003 -0.004 0.004 0.001 0.07 0.029 -0.055
R2 -0.033 0.044 -0.019 -0.013 0.018 -0.007 0.01 -0.006 0.01 0.007 -0.019 -0.013 -0.014 0.013 0.027
R3 0.008 -0.019 0.016 0.014 -0.002 -0.007 -0.011 0.007 -0.008 -0.002 0.024 0.009 0.019 -0.012 -0.025
R5 0 -0.013 0.014 0.089 -0.032 -0.018 0.017 -0.008 -0.011 0.027 0.046 0.003 -0.011 0.011 0.001
R6 -0.009 0.018 -0.002 -0.032 0.1 -0.042 -0.013 0.001 0.007 -0.028 -0.069 8.81E-05 0.042 -0.018 -0.032
R7 -0.006 -0.007 -0.007 -0.018 -0.042 0.043 -0.004 0.004 0.003 0.005 0.016 -0.004 -0.046 0.008 0.028
R8 0.039 0.01 -0.011 0.017 -0.013 -0.004 0.121 -0.069 0.002 0.046 -0.015 -0.01 0.007 0.077 -0.031
R9 -0.029 -0.006 0.007 -0.008 0.001 0.004 -0.069 0.077 -0.003 -0.032 0.018 0.006 -0.026 -0.053 0.033
R10 -0.003 0.01 -0.008 -0.011 0.007 0.003 0.002 -0.003 0.006 -0.004 -0.018 -0.006 -0.01 0.005 0.011
R11 -0.004 0.007 -0.002 0.027 -0.028 0.005 0.046 -0.032 -0.004 0.066 0.036 -0.006 -0.009 0.023 0.011
R12 0.004 -0.019 0.024 0.046 -0.069 0.016 -0.015 0.018 -0.018 0.036 0.206 0.004 -0.016 -0.011 0.001
R13 0.001 -0.013 0.009 0.003 8.81E-05 -0.004 -0.01 0.006 -0.006 -0.006 0.004 0.01 0.017 -0.014 -0.015
R14 0.07 -0.014 0.019 -0.011 0.042 -0.046 0.007 -0.026 -0.01 -0.009 -0.016 0.017 0.25 -0.034 -0.089
R15 0.029 0.013 -0.012 0.011 -0.018 0.008 0.077 -0.053 0.005 0.023 -0.011 -0.014 -0.034 0.102 -0.025
R16 -0.055 0.027 -0.025 0.001 -0.032 0.028 -0.031 0.033 0.011 0.011 0.001 -0.015 -0.089 -0.025 0.138
R1 .911a -0.385 0.152 0.003 -0.069 -0.076 0.28 -0.263 -0.108 -0.038 0.022 0.026 0.349 0.222 -0.365
R2 -0.385 .812a -0.702 -0.204 0.279 -0.162 0.135 -0.108 0.587 0.122 -0.198 -0.608 -0.132 0.201 0.343
R3 0.152 -0.702 .764a 0.36 -0.057 -0.282 -0.257 0.2 -0.824 -0.059 0.42 0.679 0.296 -0.307 -0.534
R5 0.003 -0.204 0.36 .892a -0.345 -0.286 0.163 -0.092 -0.458 0.349 0.343 0.111 -0.076 0.119 0.01
R6 -0.069 0.279 -0.057 -0.345 .834a -0.639 -0.12 0.015 0.27 -0.346 -0.482 0.003 0.269 -0.175 -0.27
R7 -0.076 -0.162 -0.282 -0.286 -0.639 .881a -0.053 0.07 0.17 0.093 0.174 -0.217 -0.446 0.124 0.368
R8 0.28 0.135 -0.257 0.163 -0.12 -0.053 .768a -0.713 0.055 0.522 -0.097 -0.283 0.04 0.696 -0.241
R9 -0.263 -0.108 0.2 -0.092 0.015 0.07 -0.713 .837a -0.155 -0.448 0.145 0.231 -0.189 -0.601 0.323
R10 -0.108 0.587 -0.824 -0.458 0.27 0.17 0.055 -0.155 .780a -0.213 -0.499 -0.781 -0.268 0.209 0.391
R11 -0.038 0.122 -0.059 0.349 -0.346 0.093 0.522 -0.448 -0.213 .877a 0.306 -0.238 -0.073 0.279 0.112
R12 0.022 -0.198 0.42 0.343 -0.482 0.174 -0.097 0.145 -0.499 0.306 .823a 0.081 -0.069 -0.079 0.008
R13 0.026 -0.608 0.679 0.111 0.003 -0.217 -0.283 0.231 -0.781 -0.238 0.081 .808a 0.342 -0.442 -0.415
R14 0.349 -0.132 0.296 -0.076 0.269 -0.446 0.04 -0.189 -0.268 -0.073 -0.069 0.342 .829a -0.21 -0.477
R15 0.222 0.201 -0.307 0.119 -0.175 0.124 0.696 -0.601 0.209 0.279 -0.079 -0.442 -0.21 .803a -0.214
R16 -0.365 0.343 -0.534 0.01 -0.27 0.368 -0.241 0.323 0.391 0.112 0.008 -0.415 -0.477 -0.214 .747a
Anti-image Matrices
Anti-image
Covarianc
e
Anti-image
Correlatio
n
a. Measures of Sampling Adequacy(MSA)

181
Universitas Esa Unggul
Lampiran 6
Hasil Uji After Pretest (lanjutan)
Component Matrixa
Component
1
R1 .832
R2 .889
R3 .938
R5 .877
R6 .808
R7 .905
R8 .756
R9 .879
R10 .966
R11 .875
R12 .701
R13 .973
R14 .723
R15 .800
R16 .689
Extraction Method: Principal Component Analysis.
a. 1 components extracted.
4. Factor Analysis Variabel CFT
KMO and Bartlett's Test
Kaiser-Meyer-Olkin Measure of Sampling Adequacy. .884
Bartlett's Test of Sphericity
Approx. Chi-Square 1195.069
df 45
Sig. .000
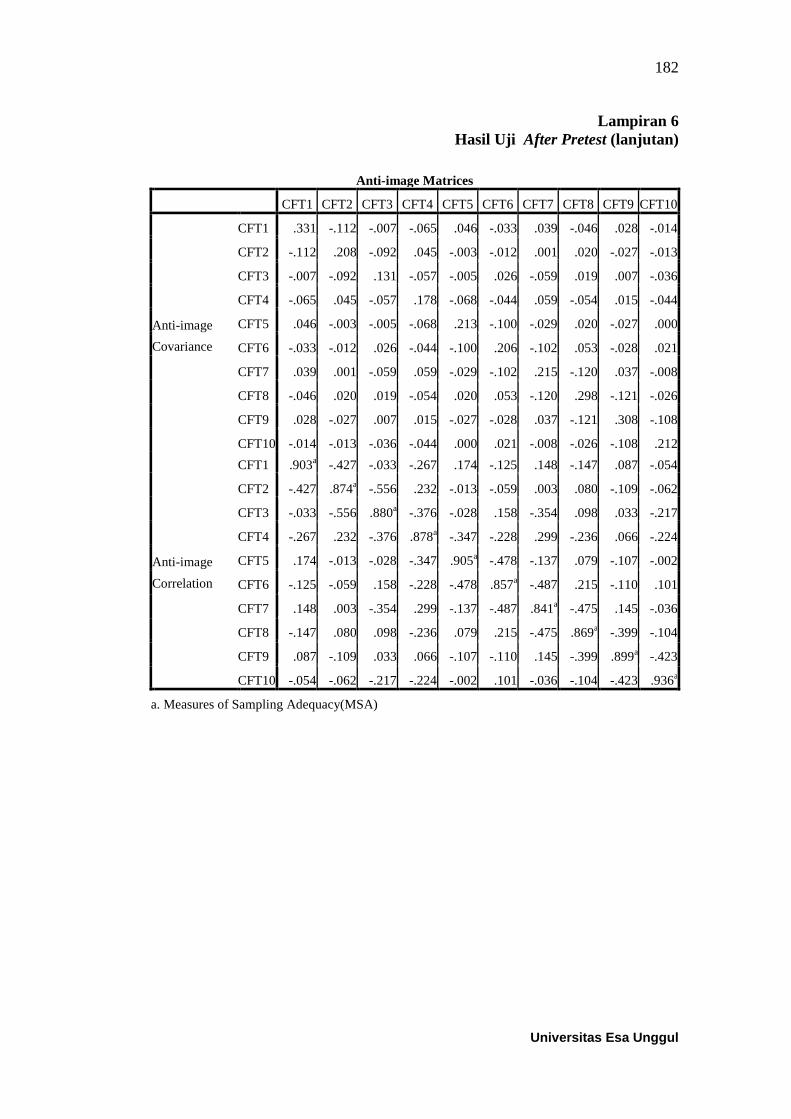
182
Universitas Esa Unggul
Lampiran 6
Hasil Uji After Pretest (lanjutan)
Anti-image Matrices
CFT1 CFT2 CFT3 CFT4 CFT5 CFT6 CFT7 CFT8 CFT9 CFT10
Anti-image
Covariance
CFT1 .331 -.112 -.007 -.065 .046 -.033 .039 -.046 .028 -.014
CFT2 -.112 .208 -.092 .045 -.003 -.012 .001 .020 -.027 -.013
CFT3 -.007 -.092 .131 -.057 -.005 .026 -.059 .019 .007 -.036
CFT4 -.065 .045 -.057 .178 -.068 -.044 .059 -.054 .015 -.044
CFT5 .046 -.003 -.005 -.068 .213 -.100 -.029 .020 -.027 .000
CFT6 -.033 -.012 .026 -.044 -.100 .206 -.102 .053 -.028 .021
CFT7 .039 .001 -.059 .059 -.029 -.102 .215 -.120 .037 -.008
CFT8 -.046 .020 .019 -.054 .020 .053 -.120 .298 -.121 -.026
CFT9 .028 -.027 .007 .015 -.027 -.028 .037 -.121 .308 -.108
CFT10 -.014 -.013 -.036 -.044 .000 .021 -.008 -.026 -.108 .212
Anti-image
Correlation
CFT1 .903a -.427 -.033 -.267 .174 -.125 .148 -.147 .087 -.054
CFT2 -.427 .874a -.556 .232 -.013 -.059 .003 .080 -.109 -.062
CFT3 -.033 -.556 .880a -.376 -.028 .158 -.354 .098 .033 -.217
CFT4 -.267 .232 -.376 .878a -.347 -.228 .299 -.236 .066 -.224
CFT5 .174 -.013 -.028 -.347 .905a -.478 -.137 .079 -.107 -.002
CFT6 -.125 -.059 .158 -.228 -.478 .857a -.487 .215 -.110 .101
CFT7 .148 .003 -.354 .299 -.137 -.487 .841a -.475 .145 -.036
CFT8 -.147 .080 .098 -.236 .079 .215 -.475 .869a -.399 -.104
CFT9 .087 -.109 .033 .066 -.107 -.110 .145 -.399 .899a -.423
CFT10 -.054 -.062 -.217 -.224 -.002 .101 -.036 -.104 -.423 .936a
a. Measures of Sampling Adequacy(MSA)

183
Universitas Esa Unggul
Lampiran 6
Hasil Uji After Pretest (lanjutan)
Component Matrixa
Component
1
CFT1 .763
CFT2 .829
CFT3 .912
CFT4 .890
CFT5 .827
CFT6 .809
CFT7 .827
CFT8 .795
CFT9 .801
CFT10 .881
Extraction Method: Principal Component
Analysis.
a. 1 components extracted.
5. Factor Analysis Variabel Intensi Pembelian Produk Halal
KMO and Bartlett's Test
Kaiser-Meyer-Olkin Measure of Sampling Adequacy. .795
Bartlett's Test of Sphericity
Approx. Chi-Square 289.237
df 6
Sig. .000
Anti-image Matrices
IH1 IH2 IH3 IH4
Anti-image Covariance
IH1 .468 -.170 -.021 -.018
IH2 -.170 .260 -.063 -.152
IH3 -.021 -.063 .499 -.144
IH4 -.018 -.152 -.144 .309
Anti-image Correlation
IH1 .827a -.487 -.043 -.047
IH2 -.487 .741a -.175 -.537
IH3 -.043 -.175 .873a -.367
IH4 -.047 -.537 -.367 .777a
a. Measures of Sampling Adequacy(MSA)

184
Universitas Esa Unggul
Lampiran 6
Hasil Uji After Pretest (lanjutan)
Component Matrixa
Component
1
IH1 .817
IH2 .923
IH3 .816
IH4 .901
Extraction Method: Principal Component Analysis.
a. 1 components extracted.
Reliability (after pre-test)
6. Reliability Persepsi Label Halal
Case Processing Summary
N %
Cases
Valid 120 100.0
Excludeda 0 .0
Total 120 100.0
a. Listwise deletion based on all variables in the
procedure.
Reliability Statistics
Cronbach's Alpha N of Items
.956 8
7. Reliability Attention to Ingredients Information
Case Processing Summary
N %
Cases
Valid 120 100.0
Excludeda 0 .0
Total 120 100.0
a. Listwise deletion based on all variables in the
procedure.

185
Universitas Esa Unggul
Lampiran 6
Hasil Uji After Pretest (lanjutan)
Reliability Statistics
Cronbach's Alpha N of Items
.897 5
8. Reliability Religiosity
Case Processing Summary
N %
Cases
Valid 120 100.0
Excludeda 0 .0
Total 120 100.0
a. Listwise deletion based on all variables in the
procedure.
Reliability Statistics
Cronbach's Alpha N of Items
.970 15
9. Reliability CFT
Case Processing Summary
N %
Cases
Valid 120 100.0
Excludeda 0 .0
Total 120 100.0
a. Listwise deletion based on all variables in the
procedure.
Reliability Statistics
Cronbach's Alpha N of Items
.950 10

186
Universitas Esa Unggul
Lampiran 6
Hasil Uji After Pretest (lanjutan)
10. Reliability Intensi Pembelian Produk Halal
Case Processing Summary
N %
Cases
Valid 120 100.0
Excludeda 0 .0
Total 120 100.0
a. Listwise deletion based on all variables in the
procedure.
Reliability Statistics
Cronbach's Alpha N of Items
.877 4

187
Universitas Esa Unggul
Lampiran 7
Hasil Uji Rerata Sel
1. Factor Analysis Label Halal
Communalities
Initial Extraction
LH1 1.000 .750
LH2 1.000 .865
LH3 1.000 .864
LH4 1.000 .825
LH5 1.000 .696
LH6 1.000 .909
LH7 1.000 .627
LH8 1.000 .706
Extraction Method: Principal Component Analysis.
Total Variance Explained
Component Initial Eigenvalues Extraction Sums of Squared Loadings
Total % of Variance Cumulative % Total % of Variance Cumulative %
1 6.243 78.034 78.034 6.243 78.034 78.034
2 .547 6.834 84.869
3 .448 5.600 90.469
4 .325 4.062 94.531
5 .185 2.311 96.842
6 .149 1.864 98.706
7 .064 .803 99.509
8 .039 .491 100.000
Extraction Method: Principal Component Analysis.

188
Universitas Esa Unggul
Lampiran 7
Hasil Uji Rerata Sel (lanjutan)
Component Matrixa
Component
1
LH1 .866
LH2 .930
LH3 .929
LH4 .908
LH5 .834
LH6 .953
LH7 .792
LH8 .840
Extraction Method: Principal Component Analysis.
a. 1 components extracted.
Component Score
Coefficient Matrix
Component
1
LH1 .139
LH2 .149
LH3 .149
LH4 .146
LH5 .134
LH6 .153
LH7 .127
LH8 .135
Component Score
Covariance Matrix
Component 1
1 1.000
Extraction Method: Principal Component Analysis.
Component Scores.

189
Universitas Esa Unggul
Lampiran 7
Hasil Uji Rerata Sel (lanjutan)
2. Factor Analysis Attention to Ingredients Information
Communalities
Initial Extraction
AI1 1.000 .825
AI2 1.000 .795
AI3 1.000 .769
AI4 1.000 .599
AI5 1.000 .739
Extraction Method: Principal Component Analysis.
Total Variance Explained
Component Initial Eigenvalues Extraction Sums of Squared Loadings
Total % of Variance Cumulative % Total % of Variance Cumulative %
1 3.727 74.532 74.532 3.727 74.532 74.532
2 .858 17.167 91.699
3 .208 4.159 95.858
4 .124 2.477 98.335
5 .083 1.665 100.000
Extraction Method: Principal Component Analysis.
Component Matrixa
Component
1
AI1 .908
AI2 .892
AI3 .877
AI4 .774
AI5 .860
Extraction Method: Principal Component Analysis.
a. 1 components extracted.

190
Universitas Esa Unggul
Lampiran 7
Hasil Uji Rerata Sel (lanjutan)
Component Score
Coefficient Matrix
Component
1
AI1 .244
AI2 .239
AI3 .235
AI4 .208
AI5 .231
Extraction Method: Principal Component Analysis.
Component Scores.
Component Score
Covariance Matrix
Component 1
1 1.000
Extraction Method: Principal Component Analysis.
Component Scores.
3. Factor Analysis Religiosity
Communalities
Initial Extraction
R1 1.000 .693
R2 1.000 .791
R3 1.000 .880
R5 1.000 .768
R6 1.000 .653
R7 1.000 .820
R8 1.000 .572
R9 1.000 .773
R10 1.000 .933
R11 1.000 .766
R12 1.000 .492
R13 1.000 .946
R14 1.000 .523
R15 1.000 .640
R16 1.000 .475
Extraction Method: Principal Component Analysis.

191
Universitas Esa Unggul
Lampiran 7
Hasil Uji Rerata Sel (lanjutan)
Total Variance Explained
Component Initial Eigenvalues Extraction Sums of Squared Loadings
Total % of Variance Cumulative % Total % of Variance Cumulative %
1 10.723 71.486 71.486 10.723 71.486 71.486
2 .960 6.401 77.886
3 .768 5.123 83.009
4 .644 4.292 87.301
5 .578 3.854 91.155
6 .524 3.492 94.647
7 .245 1.631 96.278
8 .168 1.117 97.395
9 .138 .919 98.314
10 .112 .749 99.063
11 .046 .307 99.370
12 .041 .275 99.645
13 .030 .199 99.844
14 .020 .134 99.978
15 .003 .022 100.000
Extraction Method: Principal Component Analysis.

192
Universitas Esa Unggul
Lampiran 7
Hasil Uji Rerata Sel (lanjutan)
Component Matrixa
Component
1
R1 .832
R2 .889
R3 .938
R5 .877
R6 .808
R7 .905
R8 .756
R9 .879
R10 .966
R11 .875
R12 .701
R13 .973
R14 .723
R15 .800
R16 .689
Extraction Method: Principal Component Analysis.
a. 1 components extracted.

193
Universitas Esa Unggul
Lampiran 7
Hasil Uji Rerata Sel (lanjutan)
Component Score
Coefficient Matrix
Component
1
R1 .078
R2 .083
R3 .087
R5 .082
R6 .075
R7 .084
R8 .071
R9 .082
R10 .090
R11 .082
R12 .065
R13 .091
R14 .067
R15 .075
R16 .064
Extraction Method: Principal Component Analysis.
Component Scores.
Component Score
Covariance Matrix
Component 1
1 1.000
Extraction Method: Principal
Component Analysis.
Component Scores.

194
Universitas Esa Unggul
Lampiran 7
Hasil Uji Rerata Sel (lanjutan)
4. Factor Analysis CFT
Communalities
Initial Extraction
CFT1 1.000 .583
CFT2 1.000 .688
CFT3 1.000 .832
CFT4 1.000 .792
CFT5 1.000 .684
CFT6 1.000 .654
CFT7 1.000 .684
CFT8 1.000 .631
CFT9 1.000 .642
CFT10 1.000 .775
Extraction Method: Principal
Component Analysis.
Total Variance Explained
Component Initial Eigenvalues Extraction Sums of Squared Loadings
Total % of Variance Cumulative % Total % of Variance Cumulative %
1 6.964 69.639 69.639 6.964 69.639 69.639
2 .867 8.672 78.311
3 .670 6.695 85.006
4 .406 4.061 89.067
5 .330 3.301 92.369
6 .260 2.596 94.965
7 .172 1.721 96.686
8 .133 1.329 98.015
9 .121 1.207 99.222
10 .078 .778 100.000
Extraction Method: Principal Component Analysis.

195
Universitas Esa Unggul
Lampiran 7
Hasil Uji Rerata Sel (lanjutan)
Component Matrixa
Component
1
CFT1 .763
CFT2 .829
CFT3 .912
CFT4 .890
CFT5 .827
CFT6 .809
CFT7 .827
CFT8 .795
CFT9 .801
CFT10 .881
Extraction Method: Principal Component Analysis.
a. 1 components extracted.
Component Score
Coefficient Matrix
Component
1
CFT1 .110
CFT2 .119
CFT3 .131
CFT4 .128
CFT5 .119
CFT6 .116
CFT7 .119
CFT8 .114
CFT9 .115
CFT10 .126
Extraction Method: Principal Component Analysis.
Component Scores.

196
Universitas Esa Unggul
Lampiran 7
Hasil Uji Rerata Sel (lanjutan)
Component Score
Covariance Matrix
Component 1
1 1.000
Extraction Method: Principal Component Analysis.
Component Scores.
5. Factor Analysis Intensi Pembelian Produk Halal
Communalities
Initial Extraction
IH1 1.000 .668
IH2 1.000 .852
IH3 1.000 .666
IH4 1.000 .811
Extraction Method: Principal
Component Analysis.
Total Variance Explained
Component Initial Eigenvalues Extraction Sums of Squared Loadings
Total % of Variance Cumulative % Total % of Variance Cumulative %
1 2.998 74.947 74.947 2.998 74.947 74.947
2 .515 12.865 87.812
3 .314 7.845 95.656
4 .174 4.344 100.000
Extraction Method: Principal Component Analysis.
Component Matrixa
Component
1
IH1 .817
IH2 .923
IH3 .816
IH4 .901
Extraction Method: Principal Component Analysis.
a. 1 components extracted.

197
Universitas Esa Unggul
Lampiran 7
Hasil Uji Rerata Sel (lanjutan)
Component Score
Coefficient Matrix
Component
1
IH1 .273
IH2 .308
IH3 .272
IH4 .300
Extraction Method: Principal Component Analysis.
Component Scores.
Component Score
Covariance Matrix
Component 1
1 1.000
Extraction Method: Principal Component Analysis.
Component Scores.
6. Frequencies
Statistics
LH AI RL CFT IH
N Valid 120 120 120 120 120
Missing 0 0 0 0 0
Median .5353889 .6250360 .6834370 -.3377949 .5292130

198
Universitas Esa Unggul
Lampiran 7
Hasil Uji Rerata Sel (lanjutan)
Frequency Table
LH
Frequency Percent Valid Percent Cumulative Percent
Valid
-2.00464 4 3.3 3.3 3.3
-1.98803 4 3.3 3.3 6.7
-1.70977 8 6.7 6.7 13.3
-1.09943 4 3.3 3.3 16.7
-.97923 4 3.3 3.3 20.0
-.82168 8 6.7 6.7 26.7
-.82117 4 3.3 3.3 30.0
-.80376 4 3.3 3.3 33.3
-.52333 4 3.3 3.3 36.7
-.30295 4 3.3 3.3 40.0
.36836 4 3.3 3.3 43.3
.44711 4 3.3 3.3 46.7
.53444 4 3.3 3.3 50.0
.53634 4 3.3 3.3 53.3
.71720 4 3.3 3.3 56.7
.82874 44 36.7 36.7 93.3
.86340 4 3.3 3.3 96.7
1.00246 4 3.3 3.3 100.0
Total 120 100.0 100.0

199
Universitas Esa Unggul
Lampiran 7
Hasil Uji Rerata Sel (lanjutan)
AI
Frequency Percent Valid Percent Cumulative Percent
Valid
-2.96429 4 3.3 3.3 3.3
-2.41606 4 3.3 3.3 6.7
-1.73883 4 3.3 3.3 10.0
-1.28982 4 3.3 3.3 13.3
-.84081 4 3.3 3.3 16.7
-.79966 4 3.3 3.3 20.0
-.43226 8 6.7 6.7 26.7
-.39179 4 3.3 3.3 30.0
-.25142 4 3.3 3.3 33.3
-.16358 8 6.7 6.7 40.0
.05524 4 3.3 3.3 43.3
.29681 4 3.3 3.3 46.7
.51563 4 3.3 3.3 50.0
.73445 60 50.0 50.0 100.0
Total 120 100.0 100.0

200
Universitas Esa Unggul
Lampiran 7
Hasil Uji Rerata Sel (lanjutan)
RL
Frequency Percent Valid
Percent
Cumulative
Percent
Valid
-1.9934 4 3.3 3.3 3.3
-1.67882 8 6.7 6.7 10
-1.60957 4 3.3 3.3 13.3
-1.08899 8 6.7 6.7 20
-0.98369 4 3.3 3.3 23.3
-0.91478 4 3.3 3.3 26.7
-0.82828 4 3.3 3.3 30
-0.74116 4 3.3 3.3 33.3
-0.6229 4 3.3 3.3 36.7
-0.15341 4 3.3 3.3 40
-0.13611 4 3.3 3.3 43.3
-0.08276 4 3.3 3.3 46.7
0.65782 4 3.3 3.3 50
0.70905 4 3.3 3.3 53.3
0.7207 4 3.3 3.3 56.7
0.81543 4 3.3 3.3 60
0.87261 40 33.3 33.3 93.3
0.88535 4 3.3 3.3 96.7
1.08728 4 3.3 3.3 100
Total 120 100 100
CFT
Frequency Percent Valid
Percent
Cumulative
Percent
Valid
-1.51915 5 4.2 4.2 4.2
-1.51625 5 4.2 4.2 8.3
-1.47629 1 0.8 0.8 9.2
-1.39254 2 1.7 1.7 10.8
-1.25441 1 0.8 0.8 11.7
-1.16513 11 9.2 9.2 20.8
-1.13766 1 0.8 0.8 21.7
-0.76308 1 0.8 0.8 22.5
-0.74555 1 0.8 0.8 23.3
-0.71029 1 0.8 0.8 24.2
-0.63543 2 1.7 1.7 25.8
-0.52574 1 0.8 0.8 26.7
-0.51772 1 0.8 0.8 27.5
-0.50394 8 6.7 6.7 34.2
-0.45074 5 4.2 4.2 38.3
-0.39435 1 0.8 0.8 39.2

201
Universitas Esa Unggul
CFT
Frequency Percent Valid
Percent
Cumulative
Percent
-0.39252 2 1.7 1.7 40.8
-0.3856 3 2.5 2.5 43.3
-0.36811 5 4.2 4.2 47.5
-0.34119 3 2.5 2.5 50
-0.3344 5 4.2 4.2 54.2
-0.21233 3 2.5 2.5 56.7
-0.15243 1 0.8 0.8 57.5
0.1417 1 0.8 0.8 58.3
0.1603 1 0.8 0.8 59.2
0.21982 1 0.8 0.8 60
0.26091 2 1.7 1.7 61.7
0.26724 2 1.7 1.7 63.3
0.58647 2 1.7 1.7 65
0.64744 1 0.8 0.8 65.8
0.67041 2 1.7 1.7 67.5
0.78108 1 0.8 0.8 68.3
0.92851 1 0.8 0.8 69.2
0.97185 2 1.7 1.7 70.8
1.04706 1 0.8 0.8 71.7
1.09625 2 1.7 1.7 73.3
1.16615 3 2.5 2.5 75.8
1.18827 1 0.8 0.8 76.7
1.21027 12 10 10 86.7
1.31492 2 1.7 1.7 88.3
1.32366 5 4.2 4.2 92.5
1.44852 9 7.5 7.5 100
Total 120 100 100
IH
Frequency Percent Valid Percent Cumulative Percent
Valid
-1.85901 4 3.3 3.3 3.3
-1.62680 8 6.7 6.7 10.0
-1.30232 4 3.3 3.3 13.3
-1.24914 8 6.7 6.7 20.0
-1.12136 4 3.3 3.3 23.3
-.87149 8 6.7 6.7 30.0
-.78279 4 3.3 3.3 33.3
-.49740 4 3.3 3.3 36.7
-.45831 4 3.3 3.3 40.0
-.17292 4 3.3 3.3 43.3

202
Universitas Esa Unggul
IH
Frequency Percent Valid Percent Cumulative Percent
.11246 4 3.3 3.3 46.7
.24383 4 3.3 3.3 50.0
.81460 48 40.0 40.0 90.0
.99557 4 3.3 3.3 93.3
1.28095 8 6.7 6.7 100.0
Total 120 100.0 100.0
7. Univariate Analysis of Variance
Between-Subjects Factors
Value Label N
LHCODE 1.00 TINGGI 61
2.00 RENDAH 59
RLCODE 1.00 TINGGI 62
2.00 RENDAH 58
Descriptive Statistics
Dependent Variable: IH
LHCODE RLCODE Mean Std. Deviation N
TINGGI
TINGGI .8507938 .22905185 60
RENDAH -1.2491434 . 1
Total .8163686 .35196747 61
RENDAH
TINGGI .8146007 0E-8 2
RENDAH -.9022401 .64345526 57
Total -.8440421 .70565685 59
Total
TINGGI .8496263 .22535785 62
RENDAH -.9082212 .63941048 58
Total 0E-7 1.00000000 120
Levene's Test of Equality of Error Variancesa
Dependent Variable: IH
F df1 df2 Sig.
16.453 3 116 .000
Tests the null hypothesis that the error variance of the dependent variable is equal across groups.
a. Design: Intercept + LHCODE + LHCODE * RLCODE

203
Universitas Esa Unggul
Lampiran 7
Hasil Uji Rerata Sel (lanjutan)
Tests of Between-Subjects Effects
Dependent Variable: IH
Source Type III Sum
of Squares
df Mean
Square
F Sig. Partial Eta
Squared
Noncent.
Parameter
Observed
Powerb
Corrected
Model 92.719
a 3 30.906 136.413 .000 .779 409.239 1.000
Intercept .154 1 .154 .679 .411 .006 .679 .129
LHCODE .063 1 .063 .278 .599 .002 .278 .082
LHCODE *
RLCODE 10.033 2 5.016 22.141 .000 .276 44.282 1.000
Error 26.281 116 .227
Total 119.000 120
Corrected
Total 119.000 119
a. R Squared = .779 (Adjusted R Squared = .773)
b. Computed using alpha = .05
Parameter Estimates
Dependent Variable: IH
Parameter B Std.
Error
t Sig. 95% Confidence
Interval
Partial Eta
Squared
Noncent.
Parameter
Observed
Powerb
Lower
Bound
Upper
Bound
Intercept -.902 .063 -
14.311 .000 -1.027 -.777 .638 14.311 1.000
[LHCODE=1.00] -.347 .480 -.722 .471 -1.298 .604 .004 .722 .111
[LHCODE=2.00] 0a . . . . . . . .
[LHCODE=1.00] *
[RLCODE=1.00] 2.100 .480 4.375 .000 1.149 3.051 .142 4.375 .991
[LHCODE=1.00] *
[RLCODE=2.00] 0
a . . . . . . . .
[LHCODE=2.00] *
[RLCODE=1.00] 1.717 .342 5.014 .000 1.039 2.395 .178 5.014 .999
[LHCODE=2.00] *
[RLCODE=2.00] 0
a . . . . . . . .
a. This parameter is set to zero because it is redundant.
b. Computed using alpha = .05

204
Universitas Esa Unggul
Lampiran 7
Hasil Uji Rerata Sel (lanjutan)
General Estimable Functiona
Parameter Contrast
L1 L2 L4 L6
Intercept 1 0 0 0
[LHCODE=1.00] 0 1 0 0
[LHCODE=2.00] 1 -1 0 0
[LHCODE=1.00] * [RLCODE=1.00] 0 0 1 0
[LHCODE=1.00] * [RLCODE=2.00] 0 1 -1 0
[LHCODE=2.00] * [RLCODE=1.00] 0 0 0 1
[LHCODE=2.00] * [RLCODE=2.00] 1 -1 0 -1
a. Design: Intercept + LHCODE + LHCODE * RLCODE
8. Contrast Coefficients (L' Matrix)
Intercept
Parameter Contrast
L1
Intercept 1
[LHCODE=1.00] .500
[LHCODE=2.00] .500
[LHCODE=1.00] * [RLCODE=1.00] .250
[LHCODE=1.00] * [RLCODE=2.00] .250
[LHCODE=2.00] * [RLCODE=1.00] .250
[LHCODE=2.00] * [RLCODE=2.00] .250
The default display of this matrix is the transpose of the corresponding L matrix.
Based on Type III Sums of Squares.
LHCODE
Parameter Contrast
L2
Intercept 0
[LHCODE=1.00] 1
[LHCODE=2.00] -1
[LHCODE=1.00] * [RLCODE=1.00] .500
[LHCODE=1.00] * [RLCODE=2.00] .500
[LHCODE=2.00] * [RLCODE=1.00] -.500
[LHCODE=2.00] * [RLCODE=2.00] -.500
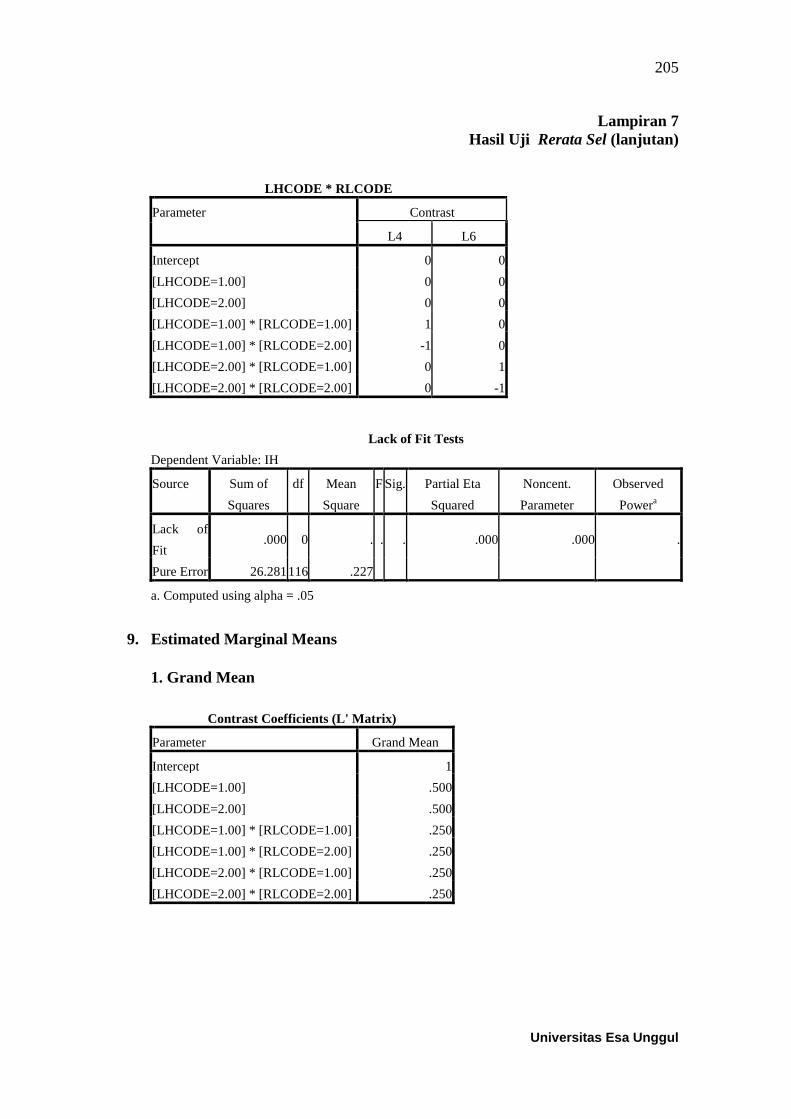
205
Universitas Esa Unggul
Lampiran 7
Hasil Uji Rerata Sel (lanjutan)
LHCODE * RLCODE
Parameter Contrast
L4 L6
Intercept 0 0
[LHCODE=1.00] 0 0
[LHCODE=2.00] 0 0
[LHCODE=1.00] * [RLCODE=1.00] 1 0
[LHCODE=1.00] * [RLCODE=2.00] -1 0
[LHCODE=2.00] * [RLCODE=1.00] 0 1
[LHCODE=2.00] * [RLCODE=2.00] 0 -1
Lack of Fit Tests
Dependent Variable: IH
Source Sum of
Squares
df Mean
Square
F Sig. Partial Eta
Squared
Noncent.
Parameter
Observed
Powera
Lack of
Fit .000 0 . . . .000 .000 .
Pure Error 26.281 116 .227
a. Computed using alpha = .05
9. Estimated Marginal Means
1. Grand Mean
Contrast Coefficients (L' Matrix)
Parameter Grand Mean
Intercept 1
[LHCODE=1.00] .500
[LHCODE=2.00] .500
[LHCODE=1.00] * [RLCODE=1.00] .250
[LHCODE=1.00] * [RLCODE=2.00] .250
[LHCODE=2.00] * [RLCODE=1.00] .250
[LHCODE=2.00] * [RLCODE=2.00] .250

206
Universitas Esa Unggul
Lampiran 7
Hasil Uji Rerata Sel (lanjutan)
Estimates
Dependent Variable: IH
Mean Std. Error 95% Confidence Interval
Lower Bound Upper Bound
-.121 .147 -.413 .170
2. LHCODE
Contrast Coefficients (L' Matrix)
Parameter LHCODE
TINGGI RENDAH
Intercept 1 1
[LHCODE=1.00] 1 0
[LHCODE=2.00] 0 1
[LHCODE=1.00] * [RLCODE=1.00] .500 0
[LHCODE=1.00] * [RLCODE=2.00] .500 0
[LHCODE=2.00] * [RLCODE=1.00] 0 .500
[LHCODE=2.00] * [RLCODE=2.00] 0 .500
Estimates
Dependent Variable: IH
LHCODE Mean Std. Error 95% Confidence Interval
Lower Bound Upper Bound
TINGGI -.199 .240 -.674 .276
RENDAH -.044 .171 -.383 .295

207
Universitas Esa Unggul
Lampiran 7
Hasil Uji Rerata Sel (lanjutan)
Pairwise Comparisons
Dependent Variable: IH
(I)
LHCODE
(J)
LHCODE
Mean Difference (I-
J)
Std.
Error
Sig.a 95% Confidence Interval for
Differencea
Lower Bound Upper Bound
TINGGI RENDAH -.155 .295 .599 -.739 .429
RENDAH TINGGI .155 .295 .599 -.429 .739
Based on estimated marginal means
a. Adjustment for multiple comparisons: Least Significant Difference (equivalent to no
adjustments).
Univariate Tests
Dependent Variable: IH
Sum of
Squares
df Mean
Square
F Sig. Partial Eta
Squared
Noncent.
Parameter
Observed
Powera
Contrast .063 1 .063 .278 .599 .002 .278 .082
Error 26.281 116 .227
The F tests the effect of LHCODE. This test is based on the linearly independent pairwise
comparisons among the estimated marginal means.
a. Computed using alpha = .05
3. LHCODE * RLCODE
Contrast Coefficients (L' Matrix)
Parameter LHCODE
TINGGI RENDAH
RLCODE RLCODE
TINGGI RENDAH TINGGI RENDAH
Intercept 1 1 1 1
[LHCODE=1.00] 1 1 0 0
[LHCODE=2.00] 0 0 1 1
[LHCODE=1.00] * [RLCODE=1.00] 1 0 0 0
[LHCODE=1.00] * [RLCODE=2.00] 0 1 0 0
[LHCODE=2.00] * [RLCODE=1.00] 0 0 1 0
[LHCODE=2.00] * [RLCODE=2.00] 0 0 0 1

208
Universitas Esa Unggul
Lampiran 7
Hasil Uji Rerata Sel (lanjutan)
Estimates
Dependent Variable: IH
LHCODE RLCODE Mean Std. Error 95% Confidence Interval
Lower Bound Upper Bound
TINGGI TINGGI .851 .061 .729 .973
RENDAH -1.249 .476 -2.192 -.306
RENDAH TINGGI .815 .337 .148 1.481
RENDAH -.902 .063 -1.027 -.777
4. Spread-versus-Level Plots

209
Universitas Esa Unggul
Lampiran 7
Hasil Uji Rerata Sel (lanjutan)

210
Universitas Esa Unggul
Lampiran 7
Hasil Uji Rerata Sel (lanjutan)
10. Univariate Analysis of Variance
Between-Subjects Factors
Value Label N
AICODE 1.00 TINGGI 60
2.00 RENDAH 60
CFTCODE 1.00 TINGGI 57
2.00 RENDAH 63
Descriptive Statistics
Dependent Variable: IH
AICODE CFTCODE Mean Std. Deviation N
TINGGI
TINGGI .5863086 .70543741 32
RENDAH .5074583 .75731315 28
Total .5495118 .72491815 60
RENDAH
TINGGI -.1352715 .96372679 25
RENDAH -.8453977 .80649949 35
Total -.5495118 .93663249 60
Total
TINGGI .2698261 .89667164 57
RENDAH -.2441284 1.03230258 63
Total 0E-7 1.00000000 120
Levene's Test of Equality of Error Variancesa
Dependent Variable: IH
F df1 df2 Sig.
2.659 3 116 .052
Tests the null hypothesis that the error variance of the dependent variable is
equal across groups.
a. Design: Intercept + AICODE + AICODE * CFTCODE

211
Universitas Esa Unggul
Lampiran 7
Hasil Uji Rerata Sel (lanjutan)
Tests of Between-Subjects Effects
Dependent Variable: IH
Source Type III Sum
of Squares
df Mean
Square
F Sig. Partial Eta
Squared
Noncent.
Parameter
Observed
Powerb
Corrected
Model 43.683
a 3 14.561 22.426 .000 .367 67.277 1.000
Intercept .094 1 .094 .145 .704 .001 .145 .067
AICODE 31.750 1 31.750 48.900 .000 .297 48.900 1.000
AICODE *
CFTCODE 7.447 2 3.723 5.735 .004 .090 11.469 .858
Error 75.317 116 .649
Total 119.000 120
Corrected Total 119.000 119
a. R Squared = .367 (Adjusted R Squared = .351)
b. Computed using alpha = .05
Parameter Estimates
Dependent Variable: IH
Parameter B Std.
Error
t Sig. 95% Confidence
Interval
Partial Eta
Squared
Noncent.
Parameter
Observed
Powerb
Lower
Bound
Upper
Bound
Intercept -.845 .136 -
6.207 .000 -1.115 -.576 .249 6.207 1.000
[AICODE=1.00] 1.353 .204 6.622 .000 .948 1.758 .274 6.622 1.000
[AICODE=2.00] 0a . . . . . . . .
[AICODE=1.00] *
[CFTCODE=1.00] .079 .209 .378 .706 -.334 .492 .001 .378 .066
[AICODE=1.00] *
[CFTCODE=2.00] 0
a . . . . . . . .
[AICODE=2.00] *
[CFTCODE=1.00] .710 .211 3.365 .001 .292 1.128 .089 3.365 .916
[AICODE=2.00] *
[CFTCODE=2.00] 0
a . . . . . . . .
a. This parameter is set to zero because it is redundant.
b. Computed using alpha = .05

212
Universitas Esa Unggul
Lampiran 7
Hasil Uji Rerata Sel (lanjutan)
General Estimable Functiona
Parameter Contrast
L1 L2 L4 L6
Intercept 1 0 0 0
[AICODE=1.00] 0 1 0 0
[AICODE=2.00] 1 -1 0 0
[AICODE=1.00] * [CFTCODE=1.00] 0 0 1 0
[AICODE=1.00] * [CFTCODE=2.00] 0 1 -1 0
[AICODE=2.00] * [CFTCODE=1.00] 0 0 0 1
[AICODE=2.00] * [CFTCODE=2.00] 1 -1 0 -1
a. Design: Intercept + AICODE + AICODE * CFTCODE
11. Contrast Coefficients (L' Matrix)
Intercept
Parameter Contrast
L1
Intercept 1
[AICODE=1.00] .500
[AICODE=2.00] .500
[AICODE=1.00] *
[CFTCODE=1.00] .250
[AICODE=1.00] *
[CFTCODE=2.00] .250
[AICODE=2.00] *
[CFTCODE=1.00] .250
[AICODE=2.00] *
[CFTCODE=2.00] .250
The default display of this matrix is the transpose of the corresponding L matrix.
Based on Type III Sums of Squares.
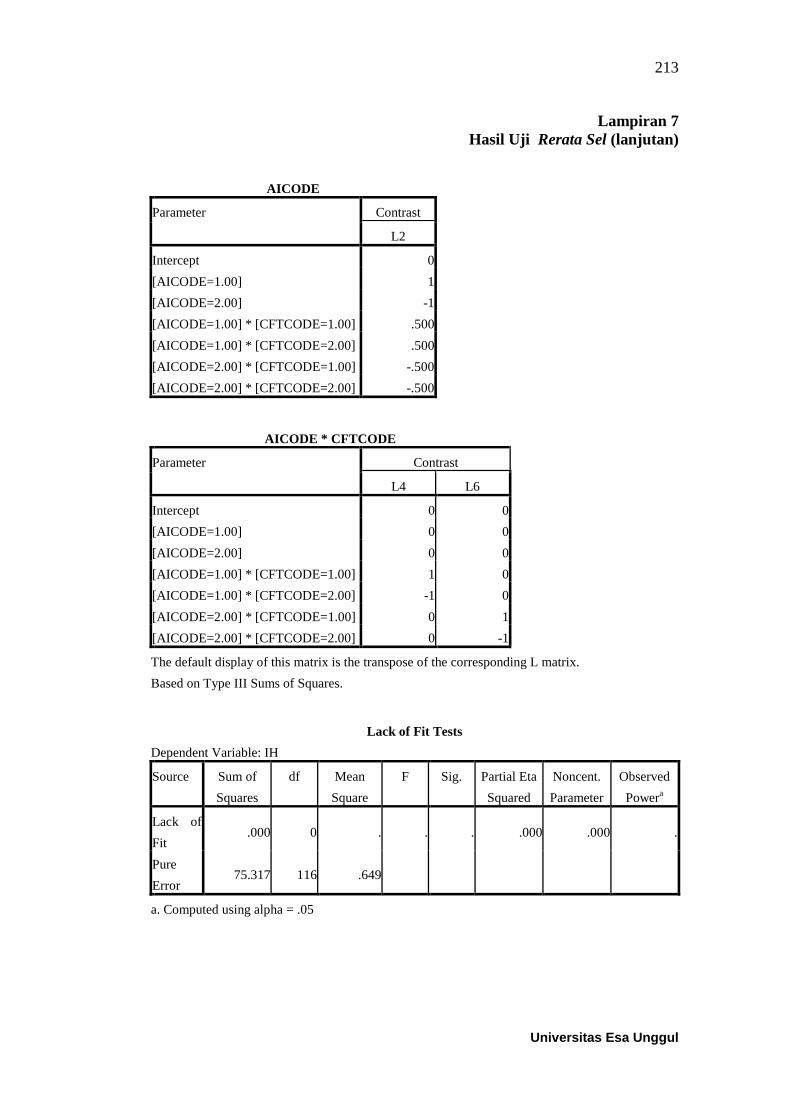
213
Universitas Esa Unggul
Lampiran 7
Hasil Uji Rerata Sel (lanjutan)
AICODE
Parameter Contrast
L2
Intercept 0
[AICODE=1.00] 1
[AICODE=2.00] -1
[AICODE=1.00] * [CFTCODE=1.00] .500
[AICODE=1.00] * [CFTCODE=2.00] .500
[AICODE=2.00] * [CFTCODE=1.00] -.500
[AICODE=2.00] * [CFTCODE=2.00] -.500
AICODE * CFTCODE
Parameter Contrast
L4 L6
Intercept 0 0
[AICODE=1.00] 0 0
[AICODE=2.00] 0 0
[AICODE=1.00] * [CFTCODE=1.00] 1 0
[AICODE=1.00] * [CFTCODE=2.00] -1 0
[AICODE=2.00] * [CFTCODE=1.00] 0 1
[AICODE=2.00] * [CFTCODE=2.00] 0 -1
The default display of this matrix is the transpose of the corresponding L matrix.
Based on Type III Sums of Squares.
Lack of Fit Tests
Dependent Variable: IH
Source Sum of
Squares
df Mean
Square
F Sig. Partial Eta
Squared
Noncent.
Parameter
Observed
Powera
Lack of
Fit .000 0 . . . .000 .000 .
Pure
Error 75.317 116 .649
a. Computed using alpha = .05

214
Universitas Esa Unggul
Lampiran 7
Hasil Uji Rerata Sel (lanjutan)
12. Estimated Marginal Means
1. Grand Mean
Contrast Coefficients (L' Matrix)
Parameter Grand Mean
Intercept 1
[AICODE=1.00] .500
[AICODE=2.00] .500
[AICODE=1.00] * [CFTCODE=1.00] .250
[AICODE=1.00] * [CFTCODE=2.00] .250
[AICODE=2.00] * [CFTCODE=1.00] .250
[AICODE=2.00] * [CFTCODE=2.00] .250
Estimates
Dependent Variable: IH
Mean Std. Error 95% Confidence Interval
Lower Bound Upper Bound
.028 .074 -.119 .175
2. AICODE
Contrast Coefficients (L' Matrix)
Parameter AICODE
TINGGI RENDAH
Intercept 1 1
[AICODE=1.00] 1 0
[AICODE=2.00] 0 1
[AICODE=1.00] * [CFTCODE=1.00] .500 0
[AICODE=1.00] * [CFTCODE=2.00] .500 0
[AICODE=2.00] * [CFTCODE=1.00] 0 .500
[AICODE=2.00] * [CFTCODE=2.00] 0 .500

215
Universitas Esa Unggul
Lampiran 7
Hasil Uji Rerata Sel (lanjutan)
Estimates
Dependent Variable: IH
AICODE Mean Std. Error 95% Confidence Interval
Lower Bound Upper Bound
TINGGI .547 .104 .340 .753
RENDAH -.490 .106 -.699 -.281
Pairwise Comparisons
Dependent Variable: IH
(I) AICODE (J) AICODE Mean
Difference (I-J)
Std. Error Sig.b 95% Confidence Interval for
Differenceb
Lower Bound Upper Bound
TINGGI RENDAH 1.037* .148 .000 .743 1.331
RENDAH TINGGI -1.037* .148 .000 -1.331 -.743
Based on estimated marginal means
*. The mean difference is significant at the .05 level.
b. Adjustment for multiple comparisons: Least Significant Difference (equivalent to no
adjustments).
Univariate Tests
Dependent Variable: IH
Sum of
Squares
df Mean
Square
F Sig. Partial Eta
Squared
Noncent.
Parameter
Observed
Powera
Contrast 31.750 1 31.750 48.900 .000 .297 48.900 1.000
Error 75.317 116 .649
The F tests the effect of AICODE. This test is based on the linearly independent pairwise
comparisons among the estimated marginal means.
a. Computed using alpha = .05

216
Universitas Esa Unggul
Lampiran 7
Hasil Uji Rerata Sel (lanjutan)
3. AICODE * CFTCODE
Contrast Coefficients (L' Matrix)
Parameter AICODE
TINGGI RENDAH
CFTCODE CFTCODE
TINGGI RENDAH TINGGI RENDAH
Intercept 1 1 1 1
[AICODE=1.00] 1 1 0 0
[AICODE=2.00] 0 0 1 1
[AICODE=1.00] * [CFTCODE=1.00] 1 0 0 0
[AICODE=1.00] * [CFTCODE=2.00] 0 1 0 0
[AICODE=2.00] * [CFTCODE=1.00] 0 0 1 0
[AICODE=2.00] * [CFTCODE=2.00] 0 0 0 1
Estimates
Dependent Variable: IH
AICODE CFTCODE Mean Std. Error 95% Confidence Interval
Lower Bound Upper Bound
TINGGI TINGGI .586 .142 .304 .868
RENDAH .507 .152 .206 .809
RENDAH TINGGI -.135 .161 -.454 .184
RENDAH -.845 .136 -1.115 -.576

217
Universitas Esa Unggul
Lampiran 7
Hasil Uji Rerata Sel (lanjutan)
13. Spread-versus-Level Plots

218
Universitas Esa Unggul
Lampiran 7
Hasil Uji Rerata Sel (lanjutan)

219
Universitas Esa Unggul
Lampiran 8
Hasil Uji Regression Regression
Descriptive Statistics
Mean Std. Deviation N
IH 0E-7 1.00000000 120
LH 0E-7 1.00000000 120
AI 0E-7 1.00000000 120
Correlations
IH LH AI
Pearson Correlation
IH 1.000 .833 .604
LH .833 1.000 .855
AI .604 .855 1.000
Sig. (1-tailed)
IH . .000 .000
LH .000 . .000
AI .000 .000 .
N
IH 120 120 120
LH 120 120 120
AI 120 120 120
Variables Entered/Removeda
Model Variables Entered Variables Removed Method
1 AI, LHb . Enter
a. Dependent Variable: IH
b. All requested variables entered.
Model Summaryb
Model R R
Square
Adjusted R
Square
Std. Error of
the Estimate
Change Statistics Durbin-
Watson R Square
Change
F
Change
df1 df2 Sig. F
Change
1 .859a .738 .733 .51665377 .738 164.404 2 117 .000 1.168
a. Predictors: (Constant), AI, LH
b. Dependent Variable: IH

220
Universitas Esa Unggul
Lampiran 8
Hasil Uji Regression (lanjutan)
ANOVAa
Model Sum of Squares df Mean Square F Sig.
1
Regression 87.769 2 43.885 164.404 .000b
Residual 31.231 117 .267
Total 119.000 119
a. Dependent Variable: IH
b. Predictors: (Constant), AI, LH
Coefficientsa
Model Unstandardized
Coefficients
Standardized
Coefficients
t Sig. Correlations Collinearity
Statistics
B Std.
Error
Beta Zero-
order
Partial Part Tolerance VIF
1
(Constant) -1.801E-
016 .047
.000 1.000
LH 1.178 .091 1.178 12.884 .000 .833 .766 .610 .268 3.726
AI -.403 .091 -.403 -4.410 .000 .604 -.378 -
.209 .268 3.726
a. Dependent Variable: IH
Collinearity Diagnosticsa
Model Dimension Eigenvalue Condition Index Variance Proportions
(Constant) LH AI
1
1 1.855 1.000 .00 .07 .07
2 1.000 1.362 1.00 .00 .00
3 .145 3.581 .00 .93 .93
a. Dependent Variable: IH
Residuals Statisticsa
Minimum Maximum Mean Std. Deviation N
Predicted Value -1.9478951 1.1340652 0E-7 .85881029 120
Residual -1.45476282 .64406741 0E-8 .51229374 120
Std. Predicted Value -2.268 1.321 .000 1.000 120
Std. Residual -2.816 1.247 .000 .992 120
a. Dependent Variable: IH