lampiran 6repository.upi.edu/13541/10/t_adp_1204799_appendix (1).pdf · lampiran 16 uji normalitas...
TRANSCRIPT

155
Yayan Sumaryana, 2014 PENGARUHKEPEMIMPINANINSTRUKSIONAL KEPALASEKOLAHDAN MOTIVASI BERPRESTASI GURU TERHADAP KINERJA MENGAJAR GURU SD NEGERI DI KOTA SUKABUMI Universitas Pendidikan Indonesia | repository.upi.edu | perpustakaan.upi.edu
Lampiran 6

156
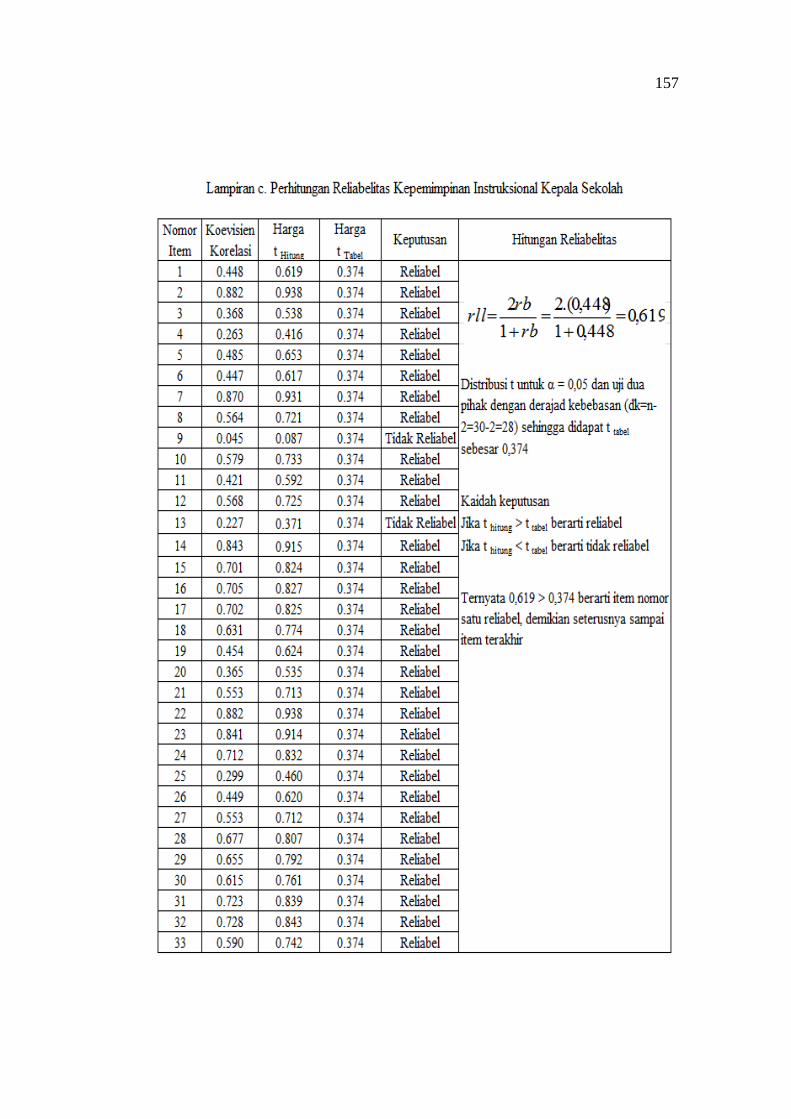
157

158

159
Lampiran 7
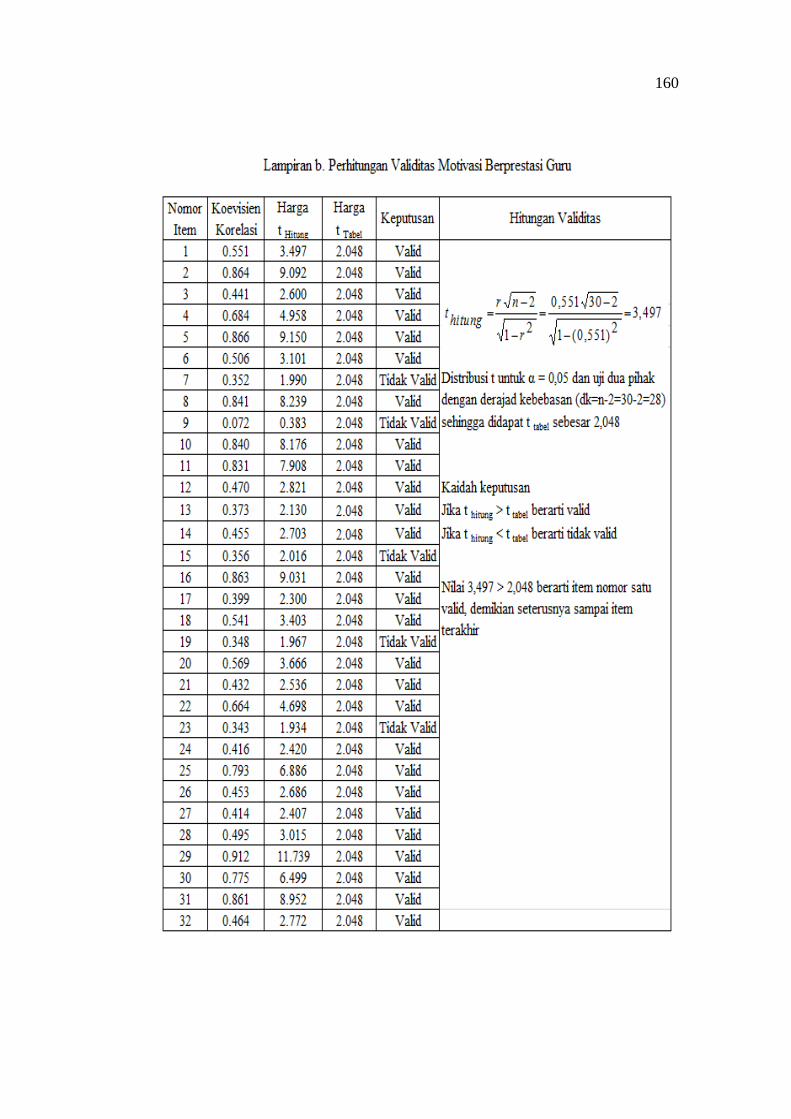
160

161

162

163
Lampiran 8

164

165

166
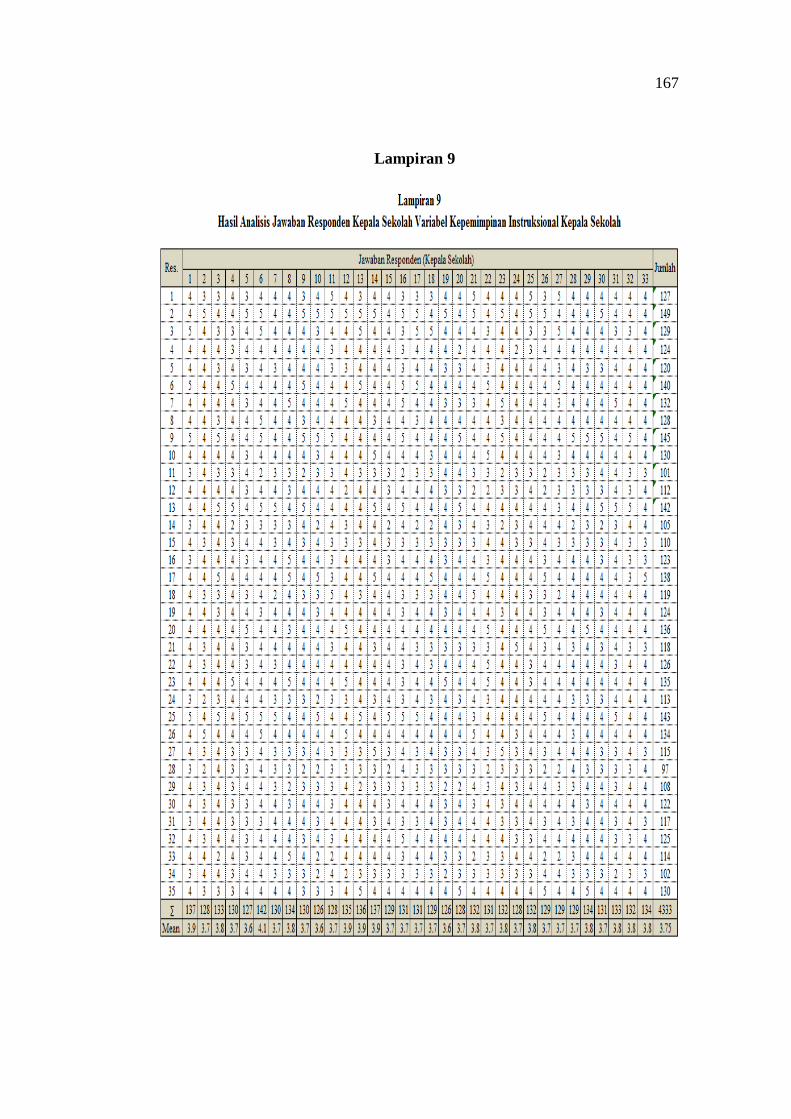
167
Lampiran 9

168
Lampiran 10

169
Lampiran 11

170
Lampiran 12
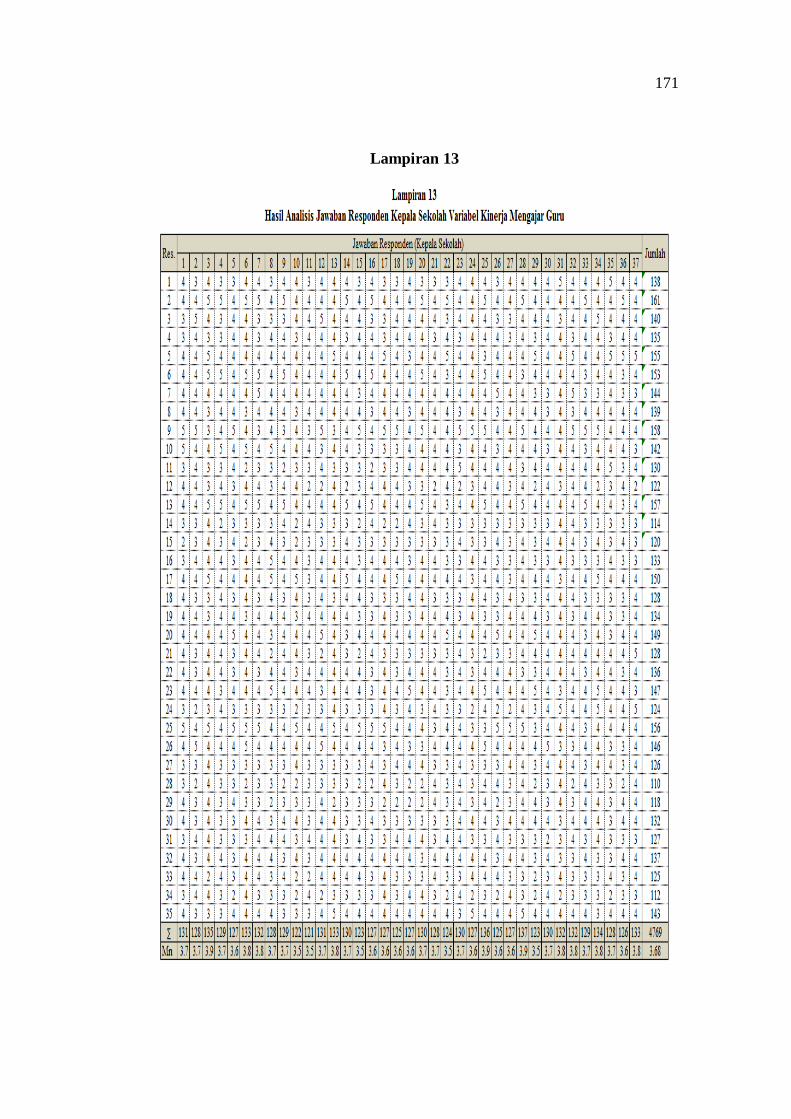
171
Lampiran 13

172
Lampiran 14

173
Lampiran 15

174
Lampiran 16
Uji Normalitas Data
One-Sample Kolmogorov-Smirnov Test
X1
N 129
Normal Parametersa Mean 1.2411E2
Std. Deviation 1.26573E1
Most Extreme Differences Absolute .050
Positive .038
Negative -.050
Kolmogorov-Smirnov Z .566
Asymp. Sig. (2-tailed) .906
a. Test distribution is Normal.
One-Sample Kolmogorov-Smirnov Test
X2
N 129
Normal Parametersa Mean 1.2450E2
Std. Deviation 1.39436E1
Most Extreme Differences Absolute .039
Positive .039
Negative -.037
Kolmogorov-Smirnov Z .442
Asymp. Sig. (2-tailed) .990
a. Test distribution is Normal.
One-Sample Kolmogorov-Smirnov Test
Y
N 129
Normal Parametersa Mean 1.3906E2
Std. Deviation 1.30305E1
Most Extreme Differences Absolute .044
Positive .042
Negative -.044
Kolmogorov-Smirnov Z .504
Asymp. Sig. (2-tailed) .961
a. Test distribution is Normal.
Rekapitulasi hasil uji normalitas data variabel X1, X2 dan Y
Variabel χ2
hitung χ2
tabel Keterangan
X1 0,566 0,906 Distribusi normal
X2 0,442 0,990 Distribusi normal
Y 0,504 0,961 Distribusi normal
175
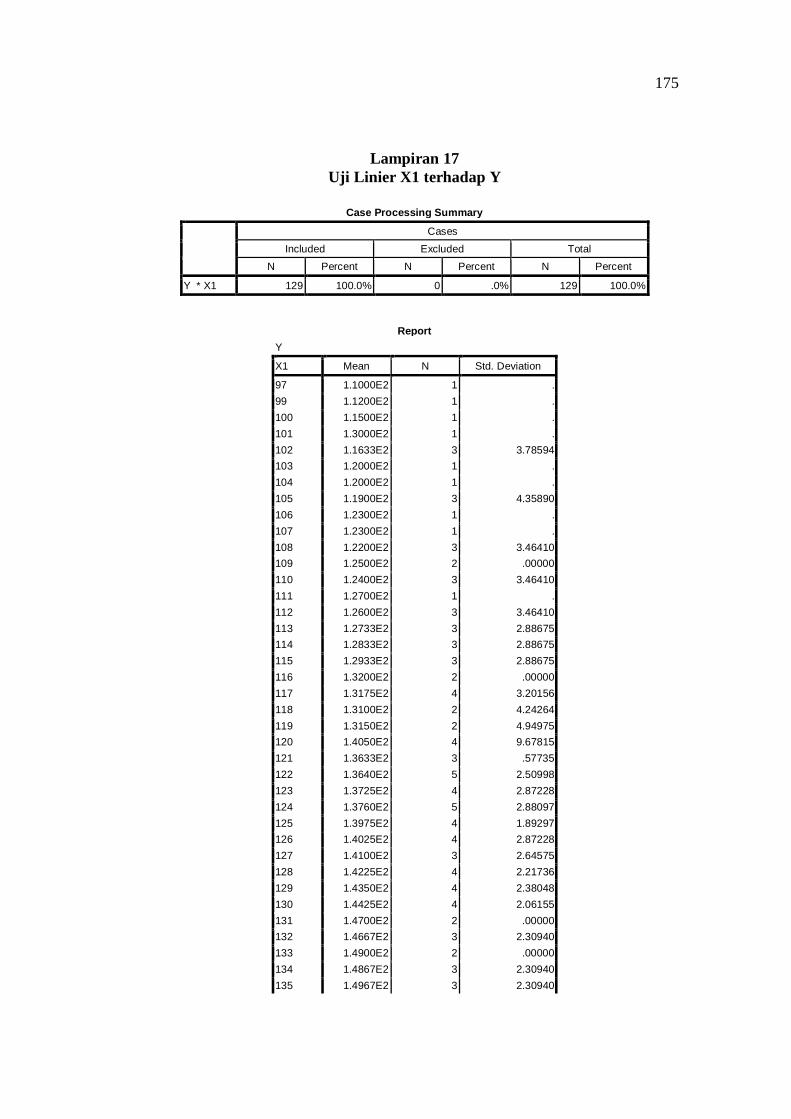
Lampiran 17
Uji Linier X1 terhadap Y
Case Processing Summary
Cases
Included Excluded Total
N Percent N Percent N Percent
Y * X1 129 100.0% 0 .0% 129 100.0%
Report
Y
X1 Mean N Std. Deviation
97 1.1000E2 1 .
99 1.1200E2 1 .
100 1.1500E2 1 .
101 1.3000E2 1 .
102 1.1633E2 3 3.78594
103 1.2000E2 1 .
104 1.2000E2 1 .
105 1.1900E2 3 4.35890
106 1.2300E2 1 .
107 1.2300E2 1 .
108 1.2200E2 3 3.46410
109 1.2500E2 2 .00000
110 1.2400E2 3 3.46410
111 1.2700E2 1 .
112 1.2600E2 3 3.46410
113 1.2733E2 3 2.88675
114 1.2833E2 3 2.88675
115 1.2933E2 3 2.88675
116 1.3200E2 2 .00000
117 1.3175E2 4 3.20156
118 1.3100E2 2 4.24264
119 1.3150E2 2 4.94975
120 1.4050E2 4 9.67815
121 1.3633E2 3 .57735
122 1.3640E2 5 2.50998
123 1.3725E2 4 2.87228
124 1.3760E2 5 2.88097
125 1.3975E2 4 1.89297
126 1.4025E2 4 2.87228
127 1.4100E2 3 2.64575
128 1.4225E2 4 2.21736
129 1.4350E2 4 2.38048
130 1.4425E2 4 2.06155
131 1.4700E2 2 .00000
132 1.4667E2 3 2.30940
133 1.4900E2 2 .00000
134 1.4867E2 3 2.30940
135 1.4967E2 3 2.30940
176
136 1.5050E2 2 2.12132
137 1.5200E2 1 .
138 1.5200E2 3 1.73205
139 1.5450E2 2 .70711
140 1.5467E2 3 1.52753
141 1.5650E2 2 .70711
142 1.5750E2 4 .57735
143 1.5800E2 3 1.73205
144 1.6000E2 1 .
145 1.6000E2 2 2.82843
146 1.6300E2 1 .
147 1.6600E2 1 .
148 1.6700E2 1 .
149 1.6100E2 1 .
Total 1.3906E2 129 13.03046
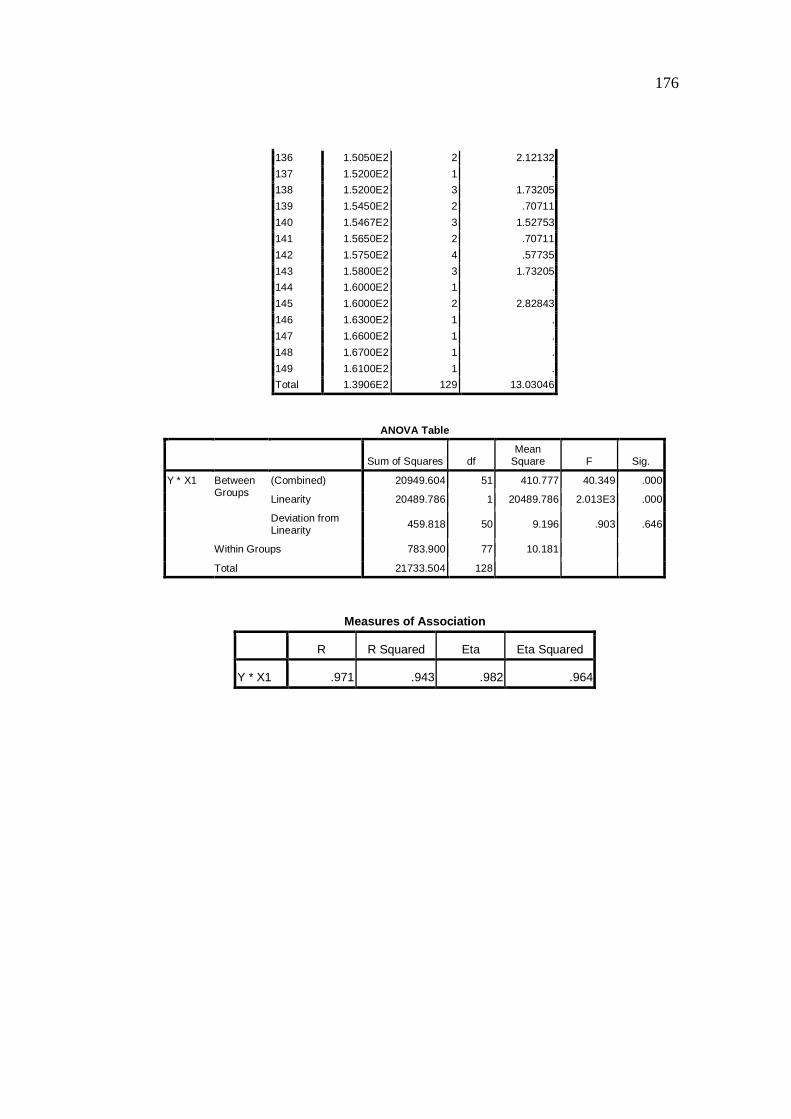
ANOVA Table
Sum of Squares df Mean
Square F Sig.
Y * X1 Between Groups
(Combined) 20949.604 51 410.777 40.349 .000
Linearity 20489.786 1 20489.786 2.013E3 .000
Deviation from Linearity
459.818 50 9.196 .903 .646
Within Groups 783.900 77 10.181
Total 21733.504 128
Measures of Association
R R Squared Eta Eta Squared
Y * X1 .971 .943 .982 .964
177
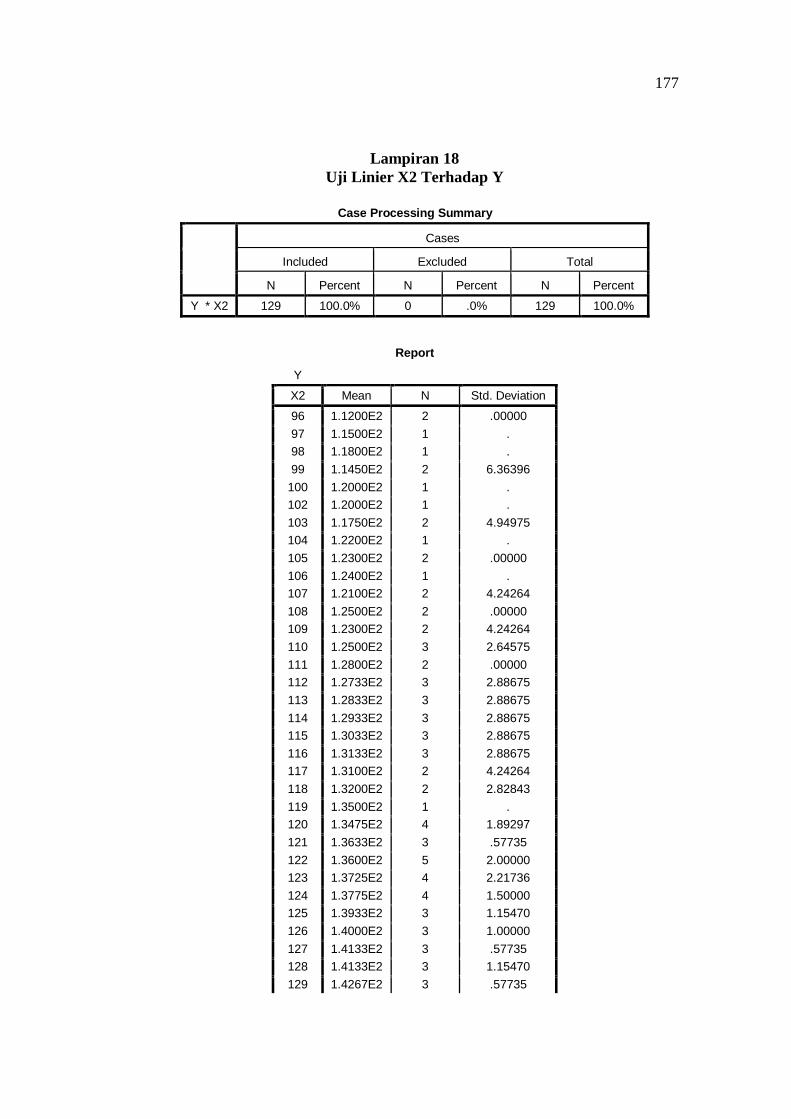
Lampiran 18
Uji Linier X2 Terhadap Y
Case Processing Summary
Cases
Included Excluded Total
N Percent N Percent N Percent
Y * X2 129 100.0% 0 .0% 129 100.0%
Report
Y
X2 Mean N Std. Deviation
96 1.1200E2 2 .00000
97 1.1500E2 1 .
98 1.1800E2 1 .
99 1.1450E2 2 6.36396
100 1.2000E2 1 .
102 1.2000E2 1 .
103 1.1750E2 2 4.94975
104 1.2200E2 1 .
105 1.2300E2 2 .00000
106 1.2400E2 1 .
107 1.2100E2 2 4.24264
108 1.2500E2 2 .00000
109 1.2300E2 2 4.24264
110 1.2500E2 3 2.64575
111 1.2800E2 2 .00000
112 1.2733E2 3 2.88675
113 1.2833E2 3 2.88675
114 1.2933E2 3 2.88675
115 1.3033E2 3 2.88675
116 1.3133E2 3 2.88675
117 1.3100E2 2 4.24264
118 1.3200E2 2 2.82843
119 1.3500E2 1 .
120 1.3475E2 4 1.89297
121 1.3633E2 3 .57735
122 1.3600E2 5 2.00000
123 1.3725E2 4 2.21736
124 1.3775E2 4 1.50000
125 1.3933E2 3 1.15470
126 1.4000E2 3 1.00000
127 1.4133E2 3 .57735
128 1.4133E2 3 1.15470
129 1.4267E2 3 .57735
178
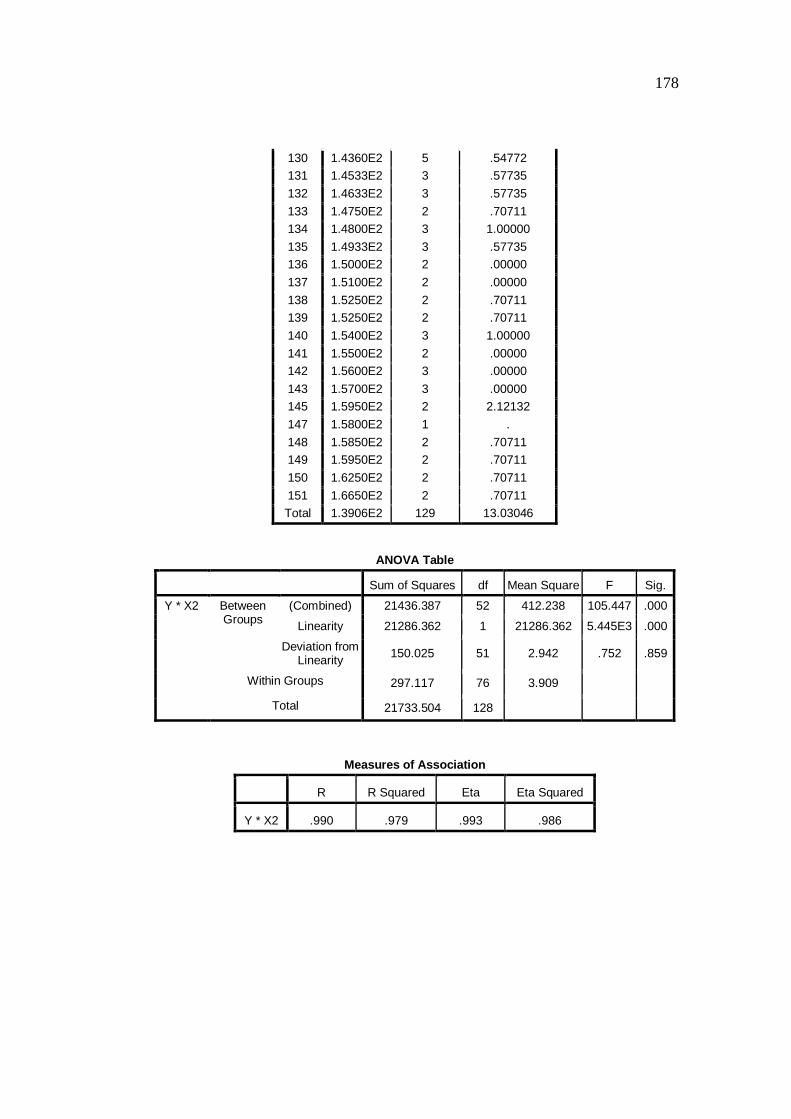
130 1.4360E2 5 .54772
131 1.4533E2 3 .57735
132 1.4633E2 3 .57735
133 1.4750E2 2 .70711
134 1.4800E2 3 1.00000
135 1.4933E2 3 .57735
136 1.5000E2 2 .00000
137 1.5100E2 2 .00000
138 1.5250E2 2 .70711
139 1.5250E2 2 .70711
140 1.5400E2 3 1.00000
141 1.5500E2 2 .00000
142 1.5600E2 3 .00000
143 1.5700E2 3 .00000
145 1.5950E2 2 2.12132
147 1.5800E2 1 .
148 1.5850E2 2 .70711
149 1.5950E2 2 .70711
150 1.6250E2 2 .70711
151 1.6650E2 2 .70711
Total 1.3906E2 129 13.03046
ANOVA Table
Sum of Squares df Mean Square F Sig.
Y * X2 Between Groups
(Combined) 21436.387 52 412.238 105.447 .000
Linearity 21286.362 1 21286.362 5.445E3 .000
Deviation from Linearity
150.025 51 2.942 .752 .859
Within Groups 297.117 76 3.909
Total 21733.504 128
Measures of Association
R R Squared Eta Eta Squared
Y * X2 .990 .979 .993 .986
179
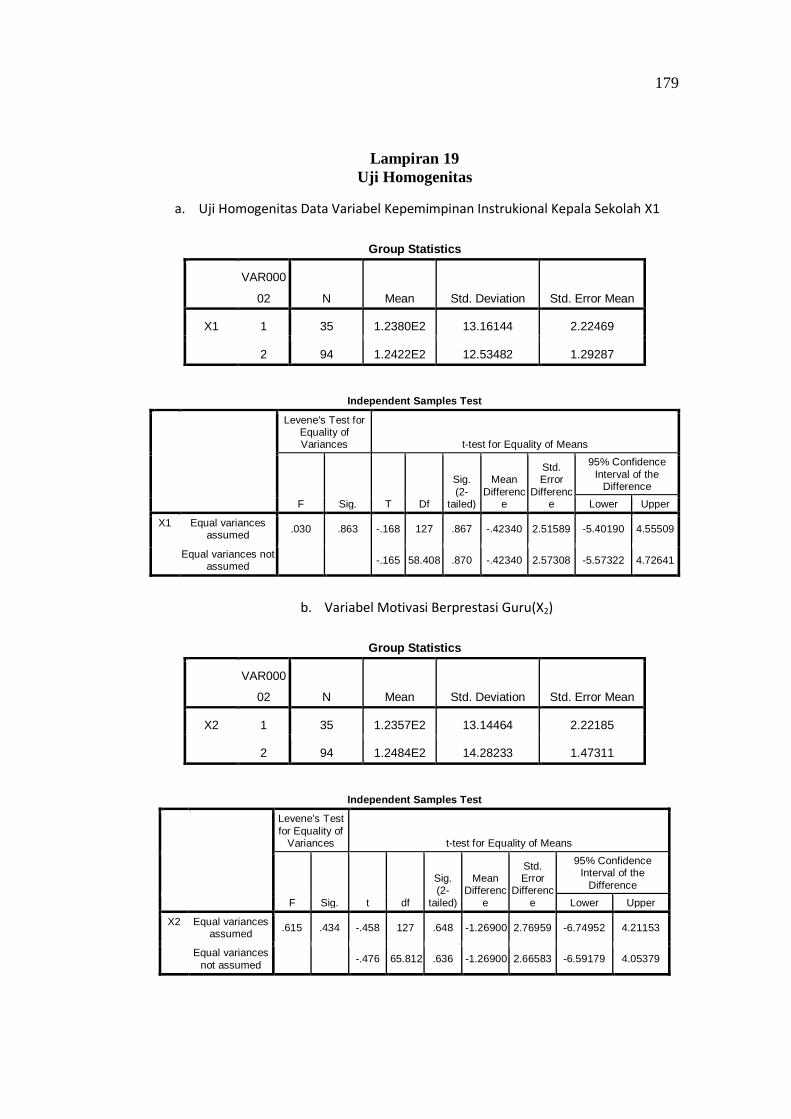
Lampiran 19
Uji Homogenitas
a. Uji Homogenitas Data Variabel Kepemimpinan Instrukional Kepala Sekolah X1
Group Statistics
VAR000
02 N Mean Std. Deviation Std. Error Mean
X1 1 35 1.2380E2 13.16144 2.22469
2 94 1.2422E2 12.53482 1.29287
Independent Samples Test
Levene's Test for Equality of Variances t-test for Equality of Means
F Sig. T Df
Sig.
(2-tailed)
Mean
Difference
Std. Error
Difference
95% Confidence
Interval of the Difference
Lower Upper
X1 Equal variances assumed
.030 .863 -.168 127 .867 -.42340 2.51589 -5.40190 4.55509
Equal variances not assumed
-.165 58.408 .870 -.42340 2.57308 -5.57322 4.72641
b. Variabel Motivasi Berprestasi Guru(X2)
Group Statistics
VAR000
02 N Mean Std. Deviation Std. Error Mean
X2 1 35 1.2357E2 13.14464 2.22185
2 94 1.2484E2 14.28233 1.47311
Independent Samples Test
Levene's Test
for Equality of Variances t-test for Equality of Means
F Sig. t df
Sig. (2-
tailed)
Mean Differenc
e
Std. Error
Differenc
e
95% Confidence Interval of the
Difference
Lower Upper
X2 Equal variances assumed
.615 .434 -.458 127 .648 -1.26900 2.76959 -6.74952 4.21153
Equal variances
not assumed
-.476 65.812 .636 -1.26900 2.66583 -6.59179 4.05379

180
c. Variabel Kinerja Mengajar Guru
Group Statistics
VAR00002 N Mean Std. Deviation Std. Error Mean
Y 1 35 1.3626E2 13.84227 2.33977
2 94 1.4011E2 12.63250 1.30294
Independent Samples Test
Levene's Test for
Equality of Variances t-test for Equality of Means
F Sig. t df Sig. (2-tailed)
Mean Difference
Std. Error Differenc
e
95% Confidence Interval of the
Difference
Lower Upper
Y Equal variances assumed
.500 .481 -
1.499 127 .136 -3.84924 2.56774 -8.93034 1.23186
Equal variances not
assumed
-1.437
56.375 .156 -3.84924 2.67809 -9.21332 1.51484

181
Lampiran20
Pengujan Hipotesis X1 terhadap Y
Model Summaryb
Model R R Square
Adjusted R
Square
Std. Error of the
Estimate
1 .971a .943 .942 3.12939
a. Predictors: (Constant), X1
b. Dependent Variable: Y
ANOVAb
Model Sum of Squares df Mean Square F Sig.
1 Regression 20489.786 1 20489.786 2.092E3 .000a
Residual 1243.718 127 9.793
Total 21733.504 128
a. Predictors: (Constant), X1
b. Dependent Variable: Y
Coefficientsa
Model
Unstandardized Coefficients
Standardized
Coefficients
t Sig. B Std. Error Beta
1 (Constant) 15.004 2.726 5.504 .000
X1 1.000 .022 .971 45.741 .000
a. Dependent Variable: Y

182
Lampiran21
Pengujian Hipotesis Pengaruh X2 terhadap Y
Variables Entered/Removedb
Model
Variables
Entered
Variables
Removed Method
1 X2a . Enter
a. All requested variables entered.
b. Dependent Variable: Y
Model Summaryb
Model R R Square
Adjusted R
Square
Std. Error of the
Estimate
1 .990a .979 .979 1.87638
a. Predictors: (Constant), X2
b. Dependent Variable: Y
ANOVAb
Model Sum of Squares df Mean Square F Sig.
1 Regression 21286.362 1 21286.362 6.046E3 .000a
Residual 447.142 127 3.521
Total 21733.504 128
a. Predictors: (Constant), X2
b. Dependent Variable: Y

183
Lampiran22
Pengujian Hipotesis Pengaruh X1 dan X2 terhadap Y
Variables Entered/Removedb
Model
Variables
Entered
Variables
Removed Method
1 X2, X1a . Enter
a. All requested variables entered.
b. Dependent Variable: Y
Model Summaryb
Model R R Square
Adjusted R
Square
Std. Error of the
Estimate
1 .990a .980 .979 1.87713
a. Predictors: (Constant), X2, X1
b. Dependent Variable: Y
ANOVAb
Model Sum of Squares df Mean Square F Sig.
1 Regression 21289.529 2 10644.764 3.021E3 .000a
Residual 443.975 126 3.524
Total 21733.504 128
a. Predictors: (Constant), X2, X1
b. Dependent Variable: Y

184
TABEL II
NILAI-NILAI CHI KUADRAT
dk Tarafsignifikansi
50% 30% 20% 10% 5%, 1%
1 0,455 1,074 1,642 2,706 3,841 6,635
2 1,386 2,408 3,219 4,605 5,991 9,210
3 2,366 3,665 4,642 6,251 7,815 11,341
4 3,357 4,878 5,989 7,779 9,488 13,277
5 4,351 6,064 7,289 9,236 11,070 15,086
6 5,348 7,231 8,558 10,645 12,592 16,812
7 6,346 8,383 9,803 12,017 14,067 18,475
8 7,344 9,524 11,030 13,362 15,507 20,090
9 8,343 10,656 12,242 14,684 16,919 21,666
10 9,342 11,781 13,442 15,987 18,307 23,209
11 10,341 12,899 14,631 17,275 19,675 24,725
12 11,340 14,011 15,812 18,549 21,026 26,217
13 12,340 15,119 16,985 19,812 22,362 27,688
14 13,339 16,222 18,151 21,064 23,685 29,141
15 14,339 17,322 19,311 22,307 24,996 30,578
16 15,338 18,418 20,465 23,542 26,296 32,000
17 16,338 19,511 21,615 24,769 27,587 33,409
18 17,338 20,601 22,760 25,989 28,869 34,805
19 18,338 21,689 23,900 27,204 30,144 36,191
20 19,337 22,775 25,038 28,412 31,410 37,566
21 20,337 23,858 26,171 29,615 32,671 38,932
22 21,337 24,939 27,301 30,813 33,924 40,289
23 22,337 26,018 28,429 32,007 35,172 41,638
24 23,337 27,096 29,553 33,196 35,415 42,980
25 24,337 28,172 30,675 34,382 37,652 44,314
26 25,336 29,246 31,795 35,563 38,885 45,642
27 26,336 30,319 32,912 36,741 40,113 46,963
28 27,336 31,391 34,027 37,916 41,337 48,278
29 28,336 32,461 35,139 39,087 42,557 49,588
30 29,336 33,530 36,250 40,258 43,773 50,892

185
TABEL IV
NILAI-NILAI r PODUCT MOMENT
N TarafSignifikan
N TarafSignifikan
N TarafSignifikan
5% 1% 5% 1% 5% 1%
3 0,997 0,999 27 0,381 0,487 55 0,266 0,345
4 0,950 0,990 28 0,374 0,478 60 0,254 0,330
5 0,878 0,959 29 0,367 0,470 65 0,244 0,317
6 0,811 0,917 30 0,361 0,463 70 0,235 0,306
7 0,754 0,874 31 0,355 0,456 75 0,227 0,296
8 0,707 0,834 32 0,349 0,449 80 0,220 0,286
9 0,666 0,798 33 0,344 0,442 85 0,213 0,278
10 0,632 0,765 34 0,339 0,436 90 0,207 0,270
11 0,602 0,735 35 0,334 0,430 95 0,202 0,263
12 0,576 0,708 36 0,329 0,424 100 0,195 0,250
13 0,553 0,684 37 0,325 0,418 125 0,176 0,230
14 0,532 0,661 38 0,320 0,413 150 0,159 0,210
15 0,514 0,641 39 0,3113 0,408 175 0,148 0,194
16 0,497 0,623 40 0,312 0,403 200 0,138 0,181
17 0,482 0,606 41 0,308 0,398 300 0,113 0,148
18 0,468 0,590 42 0,304 0,393 400 0,098 0,128
19 0,456 0,575 43 0,301 0,389 500 0,088 0,115
20 0,444 0,561 44 0,297 0,384 600 0,080 0,105
21 0,433 0,549 45 0,294 0,380 700 0,074 0,097
22 0,423 0,537 46 0,291 0,376 800 0,070 0,091
23 0,413 0,526 47 0,288 0,372 900 0,065 0,086
24 0,404 0,515 48 0,284 0,368 1000 0,062 0,081
25 0,396 0,505 49 0,281 0,364
26 0,388 0,496 50 0,279 0;361

186
TABEL V
NILAI-NILAI DISTRIBUSI t
α untukujiduafihak (two tail test)
0,50 0,20 0,10 0,05 0,02 0,01
α untukujisatufihak (one tail test)
Dk 0,25 0,10 0,05 0,025 0,01 0,005
1 1,000 3,078 6,314 12,706 31,821 63,657
2 0,816 1,886 2,920 4,303 6,965 9,925
3 0,765 1,638 2,353 3,182 4,541 5,841
4 0,741 1,533 2,132 2,776 3,747 4,604
5 0,727 1,476 2,015 2,571 3,365 4,032
6 0,718 1,440 1,943 2,447 3,143 3,707
7 0,711 1,415 1,895 2,365 2,998 3,499
8 0,706 1,397 1,860 2,306 2,896 3,355
9 0,703 1,383 1,833 2,262 2,821 3,250
10 0,700 1,372 1,812 2,228 2,764 3,169
11 0,697 1,363 1,796 2,201 2,718 3,106
12 0,695 1,356 1,782 2,179 2,681 3,055
13 0,692 1,350 1,771 2,160 2,650 3,012
14 0,691 1,345 1,761 2,145 2,624 2,977
15 0,690 1,341 1,753 2,131 2,602 2,947
16 0,689 1,337 1,746 2,120 2,583 2,921
17 0,688 1,333 1,740 2,110 2,567 2,898
18 0,688 1,330 1,734 2,101 2,552 2,878
19 0,687 1,328 1,729 2,093 2,539 2,861
20 0,687 1,325 1,725 2,086 2,528 2,845
21 0,686 1,323 1,721 2,080 2,518 2,831
22 0,686 1,321 1,717 2,074 2,508 2,819
23 0,685 1,319 1,714 2,069 2,500 2,807
24 0,685 1,318 1,711 2,064 2,492 2,797
25 0,684 1,316 1,708 2,060 2,485 2,787
26 0,684 1,315 1,706 2,056 2,479 2,779
27 0,684 1,314 1,703 2,052 2,473 2,771
28 0,683 1,313 1,701 2,048 2,467 2,763
29 0,683 1,311 1,699 2,045 2,462 2,756
30 0,683 1,310 1,697 2,042 2,457 2,750
40 0,681 1,303 1,684 2,021 2,423 2,704
60 0,679 1,296 1,671 2,000 2,390 2,660
120 0,677 1,289 1,658 1,980 2.358 2,617
∞ 0,674 1,282 1,645 1,960 2,326 2,576