hasil analisis dewi apraha
TRANSCRIPT

8/11/2019 Hasil Analisis Dewi Apraha
http://slidepdf.com/reader/full/hasil-analisis-dewi-apraha 1/17
Frequency Table
Q1
Frequency Percent Valid Percent Cumulative Percent
Valid .00 14 34.1 34.1 34.1
ASI 27 65.9 65.9 100.0
Total 41 100.0 100.0
Q2
Frequency Percent Valid Percent Cumulative Percent
Valid .00 25 61.0 61.0 61.0
1.00 16 39.0 39.0 100.0
Total 41 100.0 100.0
Q3 Frequency Percent Valid Percent Cumulative Percent
Valid 1.00 41 100.0 100.0 100.0
Q4
Frequency Percent Valid Percent Cumulative Percent

8/11/2019 Hasil Analisis Dewi Apraha
http://slidepdf.com/reader/full/hasil-analisis-dewi-apraha 2/17
Valid .00 3 7.3 7.3 7.3
1.00 38 92.7 92.7 100.0
Total 41 100.0 100.0
Q5
Frequency Percent Valid Percent Cumulative Percent
Valid .00 8 19.5 19.5 19.5
1.00 33 80.5 80.5 100.0
Total 41 100.0 100.0
Q6
Frequency Percent Valid Percent Cumulative Percent
Valid .00 12 29.3 29.3 29.3
1.00 29 70.7 70.7 100.0
Total 41 100.0 100.0
Q7
Frequency Percent Valid Percent Cumulative Percent
Valid 1.00 41 100.0 100.0 100.0
Q8

8/11/2019 Hasil Analisis Dewi Apraha
http://slidepdf.com/reader/full/hasil-analisis-dewi-apraha 3/17
Frequency Percent Valid Percent Cumulative Percent
Valid 1.00 41 100.0 100.0 100.0
Q9
Frequency Percent Valid Percent Cumulative Percent
Valid .00 2 4.9 4.9 4.9
1.00 39 95.1 95.1 100.0
Total 41 100.0 100.0
Q10
Frequency Percent Valid Percent Cumulative Percent
Valid .00 17 41.5 41.5 41.5
1.00 24 58.5 58.5 100.0
Total 41 100.0 100.0
Q11
Frequency Percent Valid Percent Cumulative Percent
Valid .00 32 78.0 78.0 78.0
1.00 9 22.0 22.0 100.0
Total 41 100.0 100.0

8/11/2019 Hasil Analisis Dewi Apraha
http://slidepdf.com/reader/full/hasil-analisis-dewi-apraha 4/17
Q12
Frequency Percent Valid Percent Cumulative Percent
Valid .00 25 61.0 61.0 61.0
1.00 16 39.0 39.0 100.0Total 41 100.0 100.0
Q13
Frequency Percent Valid Percent Cumulative Percent
Valid .00 40 97.6 97.6 97.6
1.00 1 2.4 2.4 100.0
Total 41 100.0 100.0
Q14
Frequency Percent Valid Percent Cumulative Percent
Valid .00 41 100.0 100.0 100.0
Q15
Frequency Percent Valid Percent Cumulative Percent
Valid .00 2 4.9 4.9 4.9
1.00 39 95.1 95.1 100.0
Total 41 100.0 100.0

8/11/2019 Hasil Analisis Dewi Apraha
http://slidepdf.com/reader/full/hasil-analisis-dewi-apraha 5/17
Q16
Frequency Percent Valid Percent Cumulative Percent
Valid .00 5 12.2 12.2 12.2
1.00 36 87.8 87.8 100.0
Total 41 100.0 100.0
Q17
Frequency Percent Valid Percent Cumulative Percent
Valid .00 36 87.8 87.8 87.8
1.00 5 12.2 12.2 100.0
Total 41 100.0 100.0
Q18
Frequency Percent Valid Percent Cumulative Percent
Valid .00 3 7.3 7.3 7.3
1.00 38 92.7 92.7 100.0
Total 41 100.0 100.0
Q19
Frequency Percent Valid Percent Cumulative Percent
Valid .00 6 14.6 14.6 14.6

8/11/2019 Hasil Analisis Dewi Apraha
http://slidepdf.com/reader/full/hasil-analisis-dewi-apraha 6/17
1.00 35 85.4 85.4 100.0
Total 41 100.0 100.0
Q20
Frequency Percent Valid Percent Cumulative Percent
Valid .00 36 87.8 87.8 87.8
1.00 5 12.2 12.2 100.0
Total 41 100.0 100.0
Q21
Frequency Percent Valid Percent Cumulative Percent
Valid .00 16 39.0 39.0 39.0
1.00 25 61.0 61.0 100.0
Total 41 100.0 100.0
Q22
Frequency Percent Valid Percent Cumulative Percent
Valid 1.00 41 100.0 100.0 100.0
Q23
Frequency Percent Valid Percent Cumulative Percent

8/11/2019 Hasil Analisis Dewi Apraha
http://slidepdf.com/reader/full/hasil-analisis-dewi-apraha 7/17
Valid .00 8 19.5 19.5 19.5
1.00 33 80.5 80.5 100.0
Total 41 100.0 100.0
Q24
Frequency Percent Valid Percent Cumulative Percent
Valid .00 5 12.2 12.2 12.2
1.00 36 87.8 87.8 100.0
Total 41 100.0 100.0
Q25
Frequency Percent Valid Percent Cumulative Percent
Valid .00 26 63.4 63.4 63.4
1.00 15 36.6 36.6 100.0
Total 41 100.0 100.0
Q26
Frequency Percent Valid Percent Cumulative Percent
Valid .00 10 24.4 24.4 24.4
1.00 31 75.6 75.6 100.0
Total 41 100.0 100.0

8/11/2019 Hasil Analisis Dewi Apraha
http://slidepdf.com/reader/full/hasil-analisis-dewi-apraha 8/17
Q27
Frequency Percent Valid Percent Cumulative Percent
Valid .00 6 14.6 14.6 14.61.00 35 85.4 85.4 100.0
Total 41 100.0 100.0
Q28
Frequency Percent Valid Percent Cumulative Percent
Valid .00 6 14.6 14.6 14.6
1.00 35 85.4 85.4 100.0
Total 41 100.0 100.0
Q29
Frequency Percent Valid Percent Cumulative Percent
Valid .00 8 19.5 19.5 19.5
1.00 33 80.5 80.5 100.0Total 41 100.0 100.0
Q30
Frequency Percent Valid Percent Cumulative Percent
Valid .00 23 56.1 56.1 56.1
8/11/2019 Hasil Analisis Dewi Apraha
http://slidepdf.com/reader/full/hasil-analisis-dewi-apraha 9/17
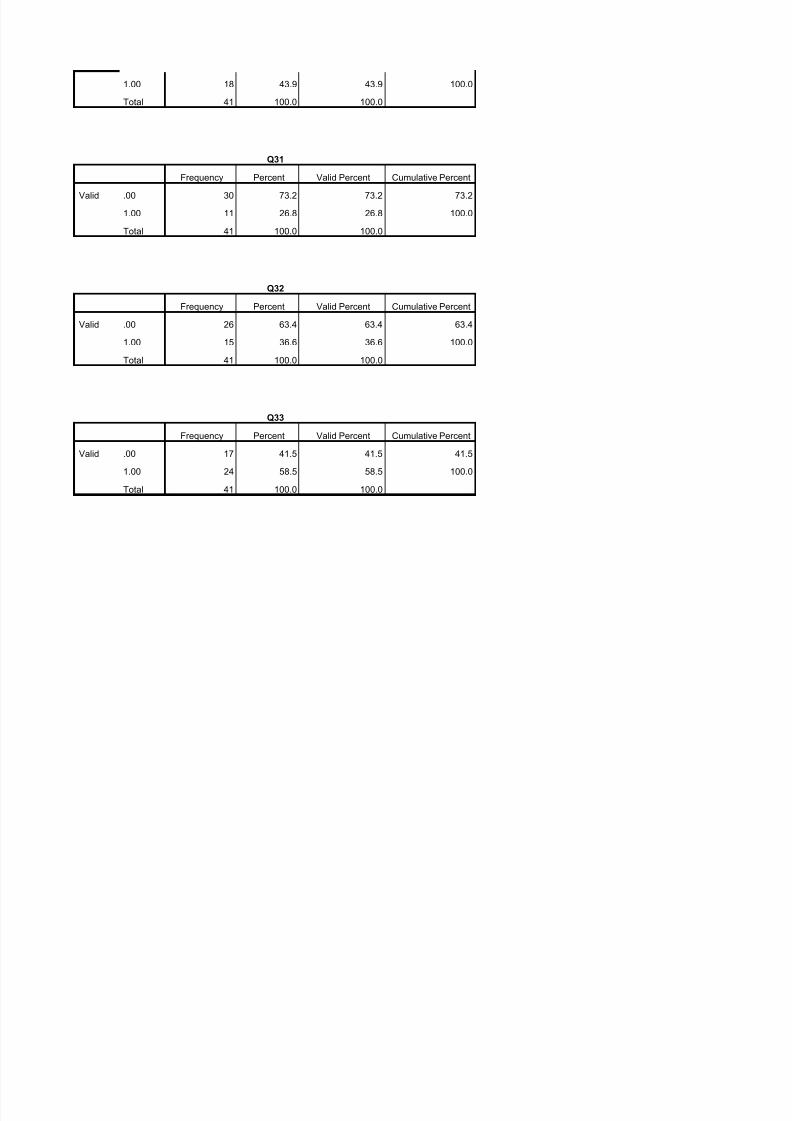
1.00 18 43.9 43.9 100.0
Total 41 100.0 100.0
Q31
Frequency Percent Valid Percent Cumulative Percent
Valid .00 30 73.2 73.2 73.2
1.00 11 26.8 26.8 100.0
Total 41 100.0 100.0
Q32
Frequency Percent Valid Percent Cumulative Percent
Valid .00 26 63.4 63.4 63.4
1.00 15 36.6 36.6 100.0
Total 41 100.0 100.0
Q33
Frequency Percent Valid Percent Cumulative Percent
Valid .00 17 41.5 41.5 41.5
1.00 24 58.5 58.5 100.0
Total 41 100.0 100.0

8/11/2019 Hasil Analisis Dewi Apraha
http://slidepdf.com/reader/full/hasil-analisis-dewi-apraha 10/17
Q34
Frequency Percent Valid Percent Cumulative Percent
Valid .00 4 9.8 9.8 9.8
1.00 37 90.2 90.2 100.0Total 41 100.0 100.0
Kat_Pengetahuan
Frequency Percent Valid Percent Cumulative Percent
Valid Cukup 41 100.0 100.0 100.0
Kat_Sikap
Frequency Percent Valid Percent Cumulative Percent
Valid Positif 33 80.5 80.5 80.5
Negatif 8 19.5 19.5 100.0
Total 41 100.0 100.0
Kat_Jumlah
Frequency Percent Valid Percent Cumulative Percent
Valid Cukup 39 95.1 95.1 95.1
Kurang 2 4.9 4.9 100.0
Total 41 100.0 100.0

8/11/2019 Hasil Analisis Dewi Apraha
http://slidepdf.com/reader/full/hasil-analisis-dewi-apraha 11/17
Kat_Dukungan
Frequency Percent Valid Percent Cumulative Percent
Valid Tinggi 25 61.0 61.0 61.0Rendah 16 39.0 39.0 100.0
Total 41 100.0 100.0
CROSSTABS/TABLES=Kat_Pengetahuan Kat_Sikap Kat_Jumlah Kat_Dukungan BY Q1/FORMAT=AVALUE TABLES/STATISTICS=CHISQ/CELLS=COUNT ROW
/COUNT ROUND CELL.
Crosstabs
Notes
Output Created 02-SEP-2014 20:50:59
Comments
Input Active Dataset DataSet0
Filter <none>
Weight <none>
Split File <none>

8/11/2019 Hasil Analisis Dewi Apraha
http://slidepdf.com/reader/full/hasil-analisis-dewi-apraha 12/17
N of Rows in Working Data File 41
Missing Value Handling Definition of Missing User-defined missing values are treated as
missing.
Cases Used Statistics for each table are based on all the
cases with valid data in the specified range(s) for
all variables in each table.
Syntax CROSSTABS
/TABLES=Kat_Pengetahuan Kat_Sikap
Kat_Jumlah Kat_Dukungan BY Q1
/FORMAT=AVALUE TABLES
/STATISTICS=CHISQ
/CELLS=COUNT ROW
/COUNT ROUND CELL.Resources Processor Time 00:00:00.05
Elapsed Time 00:00:00.32
Dimensions Requested 2
Cells Available 174734
Warnings
No measures of association are computed for the crosstabulation of Kat_Pengetahuan * Q1. At least one variable
in each 2-way table upon which measures of association are computed is a constant.
Case Processing Summary
Cases
Valid Missing Total

8/11/2019 Hasil Analisis Dewi Apraha
http://slidepdf.com/reader/full/hasil-analisis-dewi-apraha 13/17
N Percent N Percent N Percent
Kat_Pengetahuan * Q1 41 100.0% 0 0.0% 41 100.0%
Kat_Sikap * Q1 41 100.0% 0 0.0% 41 100.0%
Kat_Jumlah * Q1 41 100.0% 0 0.0% 41 100.0%
Kat_Dukungan * Q1 41 100.0% 0 0.0% 41 100.0%
Kat_Pengetahuan * Q1
Crosstab
Q1
Total.00 ASI
Kat_Pengetahuan Cukup Count 14 27 41
% within Kat_Pengetahuan 34.1% 65.9% 100.0%
Total Count 14 27 41
% within Kat_Pengetahuan 34.1% 65.9% 100.0%
Chi-Square Tests
Value
Pearson Chi-Square . a
N of Valid Cases 41

8/11/2019 Hasil Analisis Dewi Apraha
http://slidepdf.com/reader/full/hasil-analisis-dewi-apraha 14/17
a. No statistics are computed because
Kat_Pengetahuan is a constant.
Kat_Sikap * Q1
Crosstab
Q1
Total.00 ASIKat_Sikap Positif Count 11 22 33
% within Kat_Sikap 33.3% 66.7% 100.0%
Negatif Count 3 5 8
% within Kat_Sikap 37.5% 62.5% 100.0%
Total Count 14 27 41
% within Kat_Sikap 34.1% 65.9% 100.0%
Chi-Square Tests
Value df
Asymp. Sig. (2-
sided) Exact Sig. (2-sided) Exact Sig. (1-sided)
Pearson Chi-Square .050 a 1 .824
Continuity Correction b .000 1 1.000
Likelihood Ratio .049 1 .825

8/11/2019 Hasil Analisis Dewi Apraha
http://slidepdf.com/reader/full/hasil-analisis-dewi-apraha 15/17
Fisher's Exact Test 1.000 .565
Linear-by-Linear Association .049 1 .826
N of Valid Cases 41
a. 1 cells (25.0%) have expected count less than 5. The minimum expected count is 2.73.
b. Computed only for a 2x2 table
Kat_Jumlah * Q1
Crosstab
Q1
Total.00 ASI
Kat_Jumlah Cukup Count 13 26 39
% within Kat_Jumlah 33.3% 66.7% 100.0%
Kurang Count 1 1 2
% within Kat_Jumlah 50.0% 50.0% 100.0%
Total Count 14 27 41% within Kat_Jumlah 34.1% 65.9% 100.0%
Chi-Square Tests
Value df
Asymp. Sig. (2-
sided) Exact Sig. (2-sided) Exact Sig. (1-sided)

8/11/2019 Hasil Analisis Dewi Apraha
http://slidepdf.com/reader/full/hasil-analisis-dewi-apraha 16/17

8/11/2019 Hasil Analisis Dewi Apraha
http://slidepdf.com/reader/full/hasil-analisis-dewi-apraha 17/17
Chi-Square Tests
Value df
Asymp. Sig. (2-
sided) Exact Sig. (2-sided) Exact Sig. (1-sided)
Pearson Chi-Square .131 a 1 .717
Continuity Correction b .001 1 .980
Likelihood Ratio .131 1 .718
Fisher's Exact Test .747 .487
Linear-by-Linear Association .128 1 .720
N of Valid Cases 41
a. 0 cells (0.0%) have expected count less than 5. The minimum expected count is 5.46.
b. Computed only for a 2x2 table