grafik konduktometri
TRANSCRIPT
8/18/2019 grafik konduktometri
http://slidepdf.com/reader/full/grafik-konduktometri 1/2
8/18/2019 grafik konduktometri
http://slidepdf.com/reader/full/grafik-konduktometri 2/2
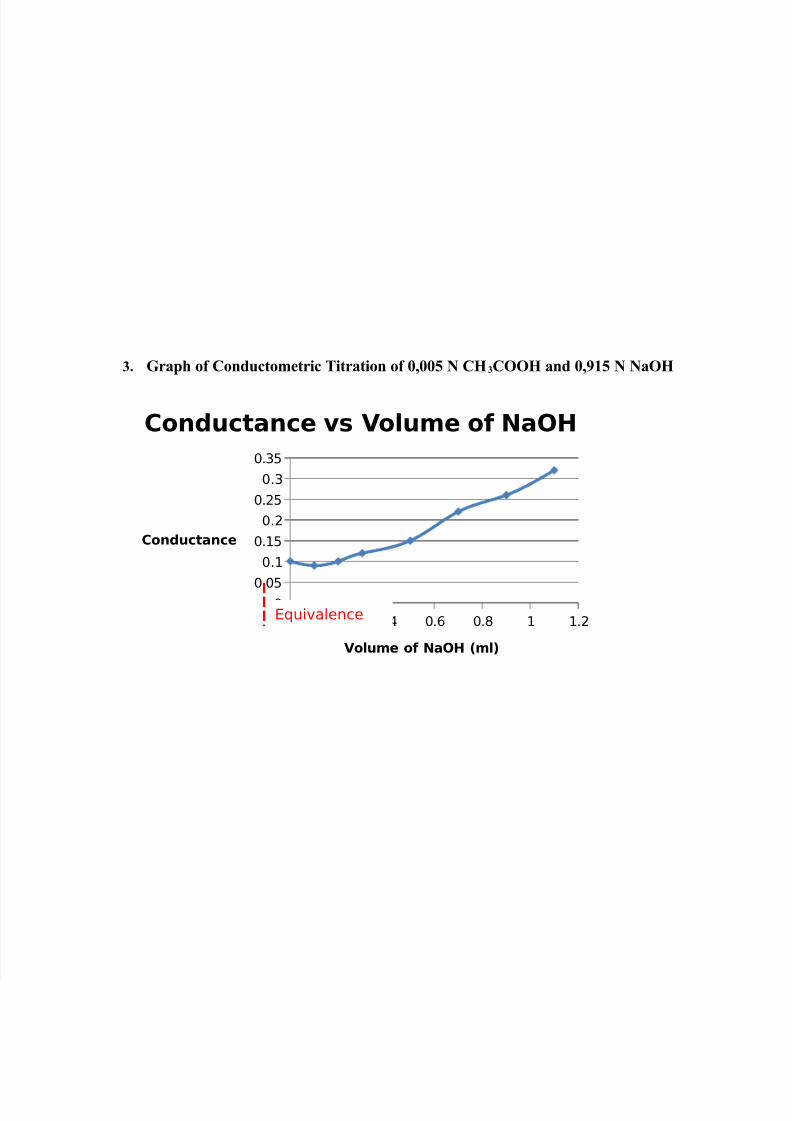
3. Graph of Conductometric Titration of 0,005 N CH3COOH and 0,915 N NaOH
0 0.2 0.4 0.6 0.8 1 1.2
00.05
0.1
0.15
0.2
0.25
0.3
0.35
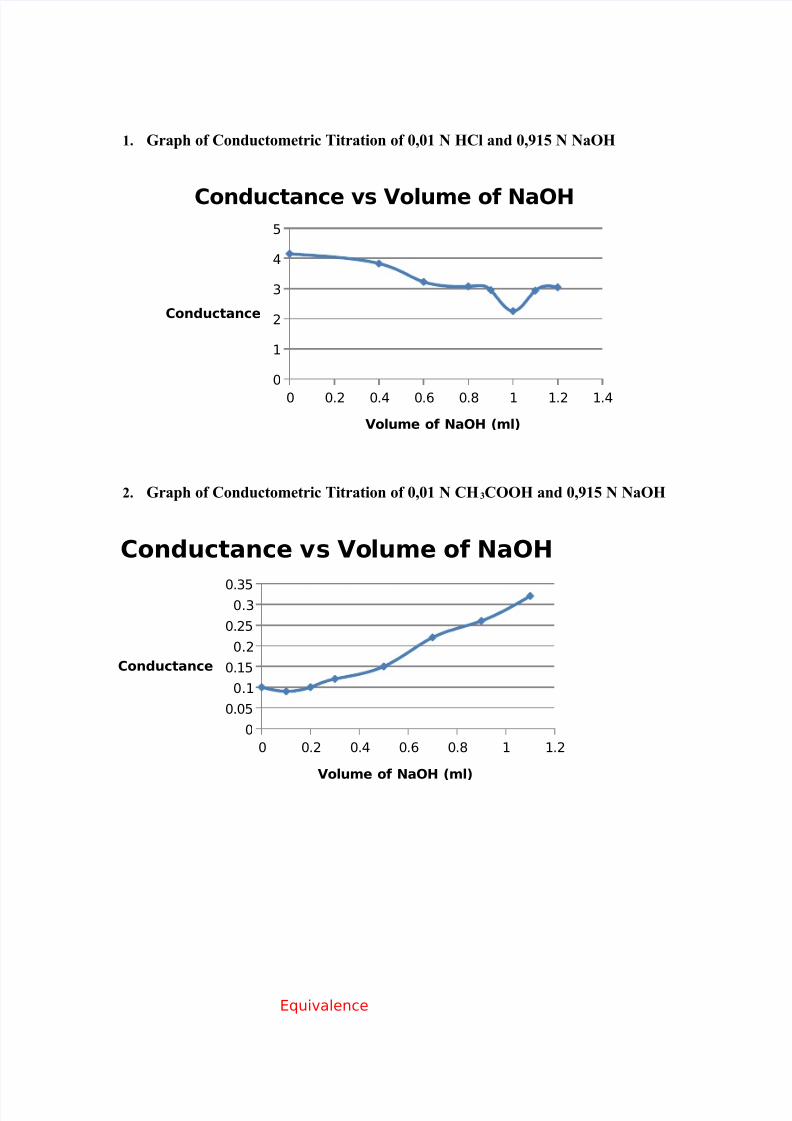
Conductance vs Volume of NaOH
Volume of NaOH (ml)
Conductance
Equivalence