concawe0152
DESCRIPTION
akademikTRANSCRIPT
report no. 01/52
I
a noise exposurethreshold value forhearing conservationPrepared for CONCAWE by
B. W. LawtonUniversity of SouthamptonInstitute of Sound and Vibration Research
Reviewed by
M. ClaydonJ.-Ph. GennartW. HoweJ. Urbanus (Technical Coordinator)
CONCAWEBrusselsApril 2001
Acknowledgement
The author wishes to acknowledge the significant contribution to this report made byProfessor D.W. Robinson before his death in 1999. The sections dealing withInternational Standard ISO 1999 rely heavily upon his understanding of theevolution of this standard, and upon text prepared jointly with the present author.
report no. 01/52
II
ABSTRACT
As part of a proposed EU directive for health and safety at work, a noise exposurethreshold level of 75 decibels (A-weighted) over an 8-hour working day has beenspecified. This is stated to be the value below which continuous and/or repetitiveexposure has no adverse effect on the health and safety of workers. This reviewconsiders the scientific background to the current international standard used to setthe threshold level. Other literature data are reviewed, taking into account hearingloss due to the combination of natural ageing and exposure to noise. It is concludedthat a threshold level of 75 dB(A) is overly conservative and that a daily noiseexposure threshold level of 80 dB(A) can deliver suitable hearing protection.
KEYWORDS
Hearing loss, noise-induced hearing loss, noise, occupational noise exposure,exposure threshold level.
NOTEConsiderable efforts have been made to assure the accuracy and reliability of the informationcontained in this publication. However, neither CONCAWE nor any company participating inCONCAWE can accept liability for any loss, damage or injury whatsoever resulting from the useof this information.
This report does not necessarily represent the views of any company participating in CONCAWE.
report no. 01/52
III
CONTENTS
SUMMARY IV
1. INTRODUCTION 1
2. THE PRELUDE TO ISO 1999 2
3. HEARING DAMAGE PREDICTED BY ISO 1999 33.1. THE NOISE THRESHOLD FOR MINIMUM PREDICTED
HEARING DAMAGE 33.2. DERIVATION OF ISO 1999 METHOD 33.2.1. UK data 43.2.2. Dutch data 43.2.3. Johnson's synthesis 5
4. STUDIES OF PERMANENT HEARING LOSS FROM LOW-LEVELNOISE 74.1. HEARING LOSS FOR INDIVIDUAL FREQUENCIES 74.1.1. Passchier-Vermeer et al (1985), Passchier-Vermeer (1986) 74.1.2. Passchier-Vermeer (1988) 84.1.3. Robinson et al (1994) 84.2. HEARING LOSS OVER ALL FREQUENCIES 94.2.1. Flottorp (1995) 94.2.2. International Institute of Noise Control Engineering (1997) 94.3. CONCLUSIONS ON HEARING LOSS FROM LOW-LEVEL
NOISE 9
5. TEMPORARY THRESHOLD SHIFT AND EFFECTIVE QUIET 115.1. INVESTIGATIONS OF ASYMPTOTIC TEMPORARY
THRESHOLD SHIFT 115.1.1. Johnson, Nixon, Stephenson (1975) 115.1.2. Stephenson, Nixon, Johnson (1980) 125.1.3. Mills, Adkins, Gilbert (1981) 125.2. A THRESHOLD FOR EFFECTIVE QUIET 12
6. CONCLUSIONS 13
7. REFERENCES 14
APPENDIX 1 CALCULATED HEARING THRESHOLDS FOR AGE AND NOISEEFFECT ACCORDING TO ISO 1999 16
report no. 01/52
IV
SUMMARY
A draft health and safety directive, proposed by the European Commission, sets athreshold level of 75 dB(A) for an 8-hour workday as the exposure value belowwhich continuous and/or repetitive exposure has no adverse effect on health andsafety of workers.
This noise exposure target appears to be based on the International StandardISO 1999, part of which deals with the estimation of noise-induced permanentthreshold shift. An 8-hour exposure value of 75 dB(A) is deemed to produce nohearing damage.
The hearing loss portion of ISO 1999 is flawed. The mathematical model forestimating noise-induced hearing loss is based upon two incompatible data sets,one of which has been mistreated, while the other contains obvious errors.
Occupational hearing surveys show that daily noise exposures of 80 dB(A) or lessdo not produce detectable hearing loss at 4 kHz, the most noise-susceptiblefrequency, even after years of exposure.
Research on temporary threshold shift has indicated that broadband noise at75 dB(A) does not produce measurable dullness of hearing at 4 kHz, even after8-hour exposures. Noise of 80 dB(A) does produce a temporary threshold shiftwhich recovers in a matter of minutes after the noise ceases.
The available scientific evidence indicates that the Threshold Level of the proposeddirective has been set at a level so low that no hearing deficit would be anticipated,even in the most noise-susceptible portion of the population after a working lifetimeof 40 years. The hearing protection aim of the proposed directive could be achievedwith a noise exposure threshold level of 80 dB(A).
report no. 01/52
1
1. INTRODUCTION
In 1993, the Council of the European Communities issued a proposal for a directiveregarding the exposure of workers to the risks arising from physical agents, one ofwhich is noise (Commission of the European Communities, 1993: amended version,Commission of the European Union, 1994). The risks arising from noise exposuremust be reduced to the lowest achievable level, with the aim of reducing exposureto below a Threshold Level. Considering the risk of noise-induced hearing loss, thethreshold has been set at an LEX,8h value of 75 dB(A).1 This risk reduction target is astandardised noise exposure level for a reference 8-hour workday.
The draft directive was accompanied by an Explanatory Memorandum which gavebackground on the aim of the proposal and the need for action, relying upon a draftInternational Standard (see International Organization for Standardization, 1982 and1985). The Memorandum stated that, during the period leading up to the 1986Council Directive on noise at work, “scientific and technical knowledge was alreadysufficiently advanced to make it possible to ascertain precisely the harmful effect ofnoise on hearing capacity. The scientific community had already established that,from 75 dB(A) on, the risks run by workers were far from negligible.” Thesestatements may be challenged on several counts. Over the few years before the1986 Directive, the exposure level 75 dB(A) was being proposed by some scientistsas the threshold at which no effect whatever would be observed, even at the mostvulnerable frequency 4 kHz. To imply that hearing risk, from that level upward,would be “far from negligible” is an unwarranted overstatement. The effect isprogressive: there is no sudden jump from no effect to “far from negligible” as thethreshold is crossed. A more accurate perception may be gained by considering theThreshold Level from both directions: the value of noise exposure, above whichhearing damage is measurable and significant, and below which no effects arediscernible. Furthermore, it is incorrect to say that scientific and technical knowledgeallowed one to ascertain precisely the harmful effects of noise exposure. On thecontrary, there were unexplained discrepancies in the scientific literature; many ofthese problems remain today.
This report is intended firstly to examine the hearing conservation potential of the75 dB(A) exposure threshold of ISO 1999, which is the only universally accessibleand workable document dealing with this matter (International Organization forStandardization, 1990). However, it will be shown that ISO 1999 is flawed: there isconsiderable uncertainty in the predicted magnitude of Noise-Induced PermanentThreshold Shift (NIPTS), particularly for low noise exposure levels.
Secondly, in this report a number of research studies and occupational hearingsurveys are reviewed which post-date the development of ISO 1999, and in somecases the proposed Physical Agents Directive. These later studies enable one toassess the validity of the 75 dB(A) threshold of ISO 1999 and the proposedDirective.
1 NOTE: The quantity LEX,8h is a noise exposure level, a notional constant noise lasting for a nominal 8-hour working day.The unit is the decibel corrected according to the A-weighting, a frequency response to account for the way the humanear perceives sounds of different frequencies.

report no. 01/52
2
2. THE PRELUDE TO ISO 1999
The idea of a noise threshold value of 75 dB(A) for hearing conservation purposes isnot new. Such a value was suggested in Guignard (1973). "A level of 75 dB(A)sustained for 8 hours per day is the threshold for detectable NIPTS: exceeding thatthreshold may cause NIPTS exceeding 5 dB in up to 10% of the people after acumulative noise exposure of 10 years."
Guignard’s 75 dB(A) value also appeared in an important recommendation from theUS Environmental Protection Agency (1974), to establish sound levels which wouldnot adversely affect public health. Any measurable loss of hearing sensitivity, at anyaudiometric frequency, was deemed unacceptable; a NIPTS value of 0 dB wasthought ideal, but not appropriate for several reasons. At the time, most audiometricinstruments did not measure hearing levels in steps of less that 5 dB. In addition,there was no evidence to suggest that NIPTS of less than 5 dB would be perceptibleby an individual with such a hearing loss. Therefore, an imperceptible NIPTS at themost noise-sensitive frequency 4 kHz was thought to be of no practical significance.
The EPA recommendation was based upon a synthesis (Johnson, 1973) of resultsfrom three occupational hearing loss surveys, one Dutch, one British, and oneAmerican. The survey results were summarised in a table giving the predictedmaximum NIPTS in 90% of a noise-exposed population after a 40-year workinglifetime in a range of average noise levels.
LAeq,8h maximum NIPTS, 4 kHz
75 dB(A) 6 dB
80 dB(A) 11 dB
85 dB(A) 19 dB
90 dB(A) 28 dB
These predicted NIPTS values form the basis of the final recommendation for thenoise exposure limit of 75 dB(A) for 8 hours, to protect the hearing of the Americanpublic “with an adequate margin of safety”. The Dutch and British data wereexamined again by Johnson for the later International Standard ISO 1999.
report no. 01/52
3
3. HEARING DAMAGE PREDICTED BY ISO 1999
This section is intended to examine the 75 dB(A) exposure threshold of ISO 1999,which is the only universally accessible and workable document dealing with thismatter.
3.1. THE NOISE THRESHOLD FOR MINIMUM PREDICTED HEARINGDAMAGE
The first section of ISO 1999 contains statements which define the scope of thestandard. In respect of estimating NIPTS from any given noise exposure, the scopemay be summarised as follows:
- Formulae are presented to calculate NIPTS, for the audiometric frequencies0.5 kHz to 6 kHz, attributable to noise exposures over each 8-hour workingday, for periods of exposure lasting from 0 to 40 years. The calculation methoduses the daily exposure level, termed LEX,8h, over the limited range from75 dB(A) to 100 dB(A). The formulae may be used to calculate the medianNIPTS and the statistical distribution above and below the median. The valuesof NIPTS resulting from the calculation method are valid for both male andfemale populations.
Two points are worth mentioning here. First, NIPTS should not be confused withhearing threshold level. NIPTS may combine with age-associated hearing loss andany possible pathological overlay to give hearing threshold level. Second, the dailynoise exposure level LEX,8h which appears in ISO 1999 and in this presentdocument, is identical to the daily personal noise exposure level LEP,d usedthroughout the European Union since 1986.
A detailed examination of the calculated values of hearing thresholds depending onage, noise exposure, and the combination of these two factors is presented inAppendix 1. The following conclusions are drawn from this examination:
– ISO 1999 states a damage risk threshold LEX,8h equal to 75 dB(A). However,NIPTS is not predicted until an exposure of 78 dB(A) is reached.
– NIPTS values resulting from an LEX,8h of 80 dB(A) are small in comparison to theage-associated hearing loss of a normal population.
– NIPTS values resulting from an LEX,8h of 80 dB(A) are insignificant in comparisonto the hearing loss associated with ageing, diseases, etc. in a typical orunscreened population.
3.2. DERIVATION OF ISO 1999 METHOD
The use of the international standard ISO 1999 in this report does not implyacceptance of its reliability. In fact, its derivation from experimental data is flawed inseveral respects, as outlined below.
The estimation of NIPTS in the standard uses a mathematical model derived byJohnson (1978), and is based upon a synthesis of two incompatible data sets, onefrom the UK, the other one from the Netherlands.
report no. 01/52
4
3.2.1. UK data
A field study of occupational hearing loss in approximately 1000 workers wasreported by Burns and Robinson (1970). This work, performed in part by theNational Physical Laboratory (NPL), led to a set of tables to allow easy estimation ofhearing threshold levels in noise-exposed workers (Robinson and Shipton, 1977).These tables were used in Johnson's synthesis. The NPL tables give NIPTS for ascreened normal population having a daily noise exposure of LEX,d for any givennumber of years. Audiometric frequency (0.5–6 kHz) and sex are accounted for;The overall hearing threshold level is obtained by adding a standard age factor.However, the noise and age components are notional factors separated forcomputational purposes only, with the statistical variation of both age and noiseeffects loaded onto the NIPTS factor alone. Nevertheless, Johnson attempted togenerate independent distributions for the true age and noise components, to forcethe NPL data into a form compatible with information from the Netherlands (seebelow). To do this, he superimposed the arbitrary assumption that noise exposuresof 75 dB(A), no matter for how long, produce no hearing loss. Using thisassumption, Johnson was able to extract distributions of the age and NIPTS factors.This procedure was highly dubious, considering the stated nature of the data in theNPL tables, and also the fact that the NPL table values had to be extrapolated wellbelow the range of noise levels actually encountered in the Burns and Robinsonfield studies.
The results of Johnson's manipulations are shown for 4 kHz in Table 1a, anddeserve some comment. Trends in the values reflect features that can be observedin actual populations. Selecting any column of the table, the threshold shiftincreases with noise exposure levels as common sense dictates. A slightly lessobvious trend of threshold shift may also be observed: note that NIPTS increases ata decelerating rate with time, e.g. for 90% (noise-resistant fractile), 100 dB(A), thevalues are
10 20 30 40 yr
10.8 14.5 17.4 18.9 dB
From any similar example in the table, it is seen that the greater threshold shiftoccurs in the first ten years of noise exposure. This is a well-established aspect ofnoise-induced hearing loss (NIHL).
Another subtle feature of the NIPTS distribution is also correctly reflected in thevalues of Table 1a. The distribution is slightly asymmetrical, with less variabilityamongst individuals who are resistant to noise than among those who are moresusceptible. This can be seen from the different intervals, at any exposure durationand audiometric frequency, between the 90-percentile and the median values andbetween the median and the 10-percentile values.
3.2.2. Dutch data
Johnson's other starting point were data contained in a report by Passchier-Vermeer(1977), giving a synthesis of eight noise-induced hearing loss studies from the1950s and 60s. The model of NIHL (based upon data from 2300 ears) was given inthe form which Johnson desired, as separate distributions (90%, 50% and 10%) ofNIPTS and age components, with overall hearing threshold levels obtained bysumming at corresponding fractiles. The actual values for the noise component
report no. 01/52
5
extracted from Passchier-Vermeer were median, 90% and 10% hearing thresholdlevels after 10, 20, 30 and 40 years exposure at various LEX,8h values.
Focusing on 4 kHz, the relevant data may be seen in Table 1b. Note that there is novariation over the 30-year span. For example at 100 dB(A) the noise component(NIPTS) is constant at 38.7 dB. This trend, or rather non-trend, occurs only at themost noise-susceptible frequency 4 kHz, and is clearly anomalous.
Examining Table 1b, it may be seen that trends differ from those in Table 1a inanother important respect. The values are expected to increase as one scans from90% through 10% in each cell of the table. This is seen, however, only at 10 and 20years exposure; for long durations, it is reversed. For example, at 100 dB(A), 40years, the values are
90% 50% 10%
42.3 38.7 34.7 dB
This is highly dubious, as it indicates that increasing noise duration actually reducesthe degree of noise-induced hearing loss in the most susceptible 10% of thepopulation. Such suspicious entries in Table 1b are given in bold type face.
There is another dubious trend which dominates the NIPTS data for 40 yearsduration. Note that the threshold values decrease (improve) as one scans from thebetter-hearing to worse-hearing deciles. This false trend, seen in the values given initalic type face, is clearly opposite to what it should be.
3.2.3. Johnson's synthesis
The data derived from the UK and Dutch sources were not in close agreement; insome cases, the corresponding values differ by over 20 dB. However discordant,the values were simply averaged by Johnson to provide a data field for hismathematical model. The input data for this modelling process are shown, for theexample of 4 kHz, in Table 1c.
The curve-fitting procedure employed by Johnson introduced a further arbitraryassumption: there exists a threshold value L0, below which NIPTS does not occurfor any noise exposure duration, and above which the NIPTS increases as thesquare of the excess of L EX,8h over the threshold L0. This model of NIPTS growthhas no foundation in experiment. In defence of Johnson, it is clear that any higherlevel function could not be determined from the input data, in view of thediscrepancies between the data sets and uncertainties within each set. Theassumed model of NIPTS growth takes on particular significance when the resultsare used at or near the ‘threshold’ L0, which is the focus of the present report.
CONCLUSION: The hearing loss calculation method for ISO 1999 is flawed, andthere is a large underlying uncertainty of the magnitude ofNIPTS. The method is untrustworthy, particularly for low noiselevels.
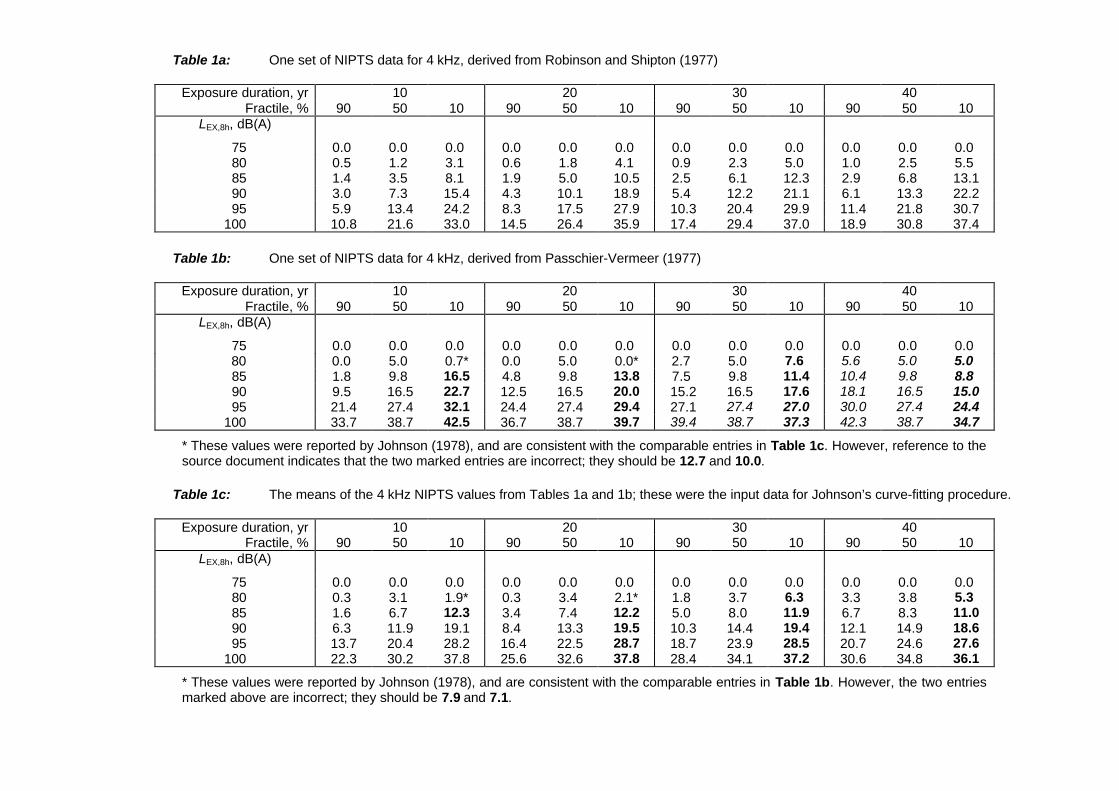
Table 1a: One set of NIPTS data for 4 kHz, derived from Robinson and Shipton (1977)
Exposure duration, yr 10 20 30 40Fractile, % 90 50 10 90 50 10 90 50 10 90 50 10
LEX,8h, dB(A)
75 0.0 0.0 0.0 0.0 0.0 0.0 0.0 0.0 0.0 0.0 0.0 0.0 80 0.5 1.2 3.1 0.6 1.8 4.1 0.9 2.3 5.0 1.0 2.5 5.5 85 1.4 3.5 8.1 1.9 5.0 10.5 2.5 6.1 12.3 2.9 6.8 13.1 90 3.0 7.3 15.4 4.3 10.1 18.9 5.4 12.2 21.1 6.1 13.3 22.2 95 5.9 13.4 24.2 8.3 17.5 27.9 10.3 20.4 29.9 11.4 21.8 30.7100 10.8 21.6 33.0 14.5 26.4 35.9 17.4 29.4 37.0 18.9 30.8 37.4
Table 1b: One set of NIPTS data for 4 kHz, derived from Passchier-Vermeer (1977)
Exposure duration, yr 10 20 30 40Fractile, % 90 50 10 90 50 10 90 50 10 90 50 10
LEX,8h, dB(A)
75 0.0 0.0 0.0 0.0 0.0 0.0 0.0 0.0 0.0 0.0 0.0 0.0 80 0.0 5.0 0.7* 0.0 5.0 0.0* 2.7 5.0 7.6 5.6 5.0 5.0 85 1.8 9.8 16.5 4.8 9.8 13.8 7.5 9.8 11.4 10.4 9.8 8.8 90 9.5 16.5 22.7 12.5 16.5 20.0 15.2 16.5 17.6 18.1 16.5 15.0 95 21.4 27.4 32.1 24.4 27.4 29.4 27.1 27.4 27.0 30.0 27.4 24.4100 33.7 38.7 42.5 36.7 38.7 39.7 39.4 38.7 37.3 42.3 38.7 34.7
* These values were reported by Johnson (1978), and are consistent with the comparable entries in Table 1c. However, reference to thesource document indicates that the two marked entries are incorrect; they should be 12.7 and 10.0.
Table 1c: The means of the 4 kHz NIPTS values from Tables 1a and 1b; these were the input data for Johnson’s curve-fitting procedure.
Exposure duration, yr 10 20 30 40Fractile, % 90 50 10 90 50 10 90 50 10 90 50 10
LEX,8h, dB(A)
75 0.0 0.0 0.0 0.0 0.0 0.0 0.0 0.0 0.0 0.0 0.0 0.0 80 0.3 3.1 1.9* 0.3 3.4 2.1* 1.8 3.7 6.3 3.3 3.8 5.3 85 1.6 6.7 12.3 3.4 7.4 12.2 5.0 8.0 11.9 6.7 8.3 11.0 90 6.3 11.9 19.1 8.4 13.3 19.5 10.3 14.4 19.4 12.1 14.9 18.6 95 13.7 20.4 28.2 16.4 22.5 28.7 18.7 23.9 28.5 20.7 24.6 27.6100 22.3 30.2 37.8 25.6 32.6 37.8 28.4 34.1 37.2 30.6 34.8 36.1
* These values were reported by Johnson (1978), and are consistent with the comparable entries in Table 1b. However, the two entriesmarked above are incorrect; they should be 7.9 and 7.1.
report no. 01/52
7
4. STUDIES OF PERMANENT HEARING LOSS FROM LOW-LEVELNOISE
The very low exposures at or near the Threshold Level imply that very small valuesof NIPTS might be expected. If any effect is to be seen, then that effect will be mostevident at 4 kHz.
4.1. HEARING LOSS FOR INDIVIDUAL FREQUENCIES
4.1.1. Passchier-Vermeer et al (1985), Passchier-Vermeer (1986)
Age-related hearing loss was investigated in Dutch samples not exposed tooccupational noise, yielding data on the hearing thresholds for a typical unscreenedpopulation. These typical-for-age thresholds were then employed to show the effectof occupational noise upon hearing threshold levels of exposed workers.
Data were taken from 30 industrial hearing conservation programs, involving about2000 male workers exposed to noise with level LEX,8h ≥ 75 dB(A). The noiseexposure data gathered during the term of the study (1982-84) were used torepresent the noise experienced by each worker over the course of his entire noiselifetime. The thresholds of the workers were corrected using the typical-for-age datato give the noise damage component of each worker’s threshold. The study datawere then subjected to curve-fitting analyses, with LEX,8h and noise-inducedthreshold shift as the independent and dependent variables, respectively. Curveswere derived for noise durations of 10 and 40 years, and for the median (50%)threshold shift and for the 10% worst shift. The Dutch data, representing realhearing losses in noise-exposed workers, did not follow the predictions of ISO 1999:the survey data showed less NIPTS than predicted by the ISO calculation method.
For present purposes, the most useful curves are those for the noise-sensitivefrequency 4 kHz. For the workers with 10 year occupational noise exposures, the4 kHz threshold showed a very small rise (perhaps 1 dB) as LEX,8h increased from 75to 85 dB(A), for both the median and worst decile data. No confidence limits werepresented for the fitted curves, but it seems unlikely that the extremely weak relationbetween LEX,8h and threshold shift would be statistically significant. For the 40-yearexposure, the situation was not much clearer. As noise exposure increased from 75to 85 dB(A), the 4 kHz threshold shift increased approximately 2-3 dB, for both themedian and worst decile of the workers. For LEX,8h below 80 dB(A), there was norelationship between exposure and NIPTS. Above 85-90 dB(A), NIPTS rose sharplywith increasing exposure.
CONCLUSION: The ISO 1999 method predicted more NIPTS than was observedin the Dutch workers surveyed. These Dutch data show atransition zone between no noise effect and a clear risk tohearing. Below an LEX,8h value of 80 dB(A), daily occupationalnoise has little if any effect upon the 4 kHz threshold. Above90 dB(A), most workers show a hearing loss.
report no. 01/52
8
4.1.2. Passchier-Vermeer (1988)
This author reviews a number of research studies to establish a database of hearingthresholds considered typical-for-age for males not exposed to noise. This ‘typical’database shows slightly higher (worse) thresholds-by-age than for screened normalmales. These typical data were used in an analysis of hearing thresholds observedin noise-exposed groups reported in the literature of the 1980s.
The thresholds at 4 kHz (the most noise-sensitive audiometric frequency) wereconsidered for 56 groups or samples of noise-exposed workers. Values of LEX,8h
ranged from less than 80 dB(A) up to 108 dB(A); representative ages for the groupsranged from 28 years to 53 years. As might be expected, the thresholds showed twogeneral trends for the median and for the worst decile: worse thresholds withincreasing LEX,8h and also with increasing age.
One aspect of the analysis is particularly important for present purposes: theoccupational samples with LEX,8h equal to or less than 80 dB(A) had 4 kHzthresholds matching the typical-for-age hearing threshold levels, over the age range30 to 50 years.
CONCLUSION: Noise exposures equal to or less than 80 dB(A) had no effectupon workers’ hearing thresholds at 4 kHz.
4.1.3. Robinson et al (1994)
A review study, conducted for the UK Health and Safety Executive, examined thehearing loss which might result from occupational noise exposures with LEX,8h lessthan 85 dB(A). Data were taken from six studies from Europe and North America,reported over the period 1961 to 1980. The key feature of the analysis was theseparation of hearing threshold levels into components due to noise and due to age.Because very small threshold shifts were expected from the low-level noiseexposures, the analysis concentrated on hearing threshold data for the mostvulnerable frequency 4 kHz.
The data ensemble, covering a range of low-level exposures and years of work innoise, indicated a negligible noise-induced threshold shift for LEX,8h values at andbelow 75 dB(A). Above 75 dB(A), but below 85 dB(A), long-term noise exposure hadsome effect, but the amount of noise-induced threshold shift in the subject sampleswas so small as to be undetectable by practical means in individual cases. Withinthe exposure range 75-85 dB(A), the noise effect was measurable only in thestatistical sense, using groups of exposed individuals. Moreover, the amount ofnoise-induced threshold shift was so small as to be overshadowed by the loss ofhearing associated with advancing age, whether due to natural causes or the insultsof everyday living.
CONCLUSION: Noise exposures of 80 dB(A) LEX,8h or less will produce nodetectable hearing threshold shift, even after years of exposure.
report no. 01/52
9
4.2. HEARING LOSS OVER ALL FREQUENCIES
4.2.1. Flottorp (1995)
A project was undertaken at a tobacco plant in Norway, over the period 1983 to1994, to monitor the workplace noise and the hearing of exposed workers. TheLAeq,8h was determined at over 140 individual workstations. Over the study duration,the proportion of locations with exposure levels equal to or greater than 85 dB(A)increased from 3% to 13%. Workers in these areas were required to wear earprotectors. The majority of work areas were found to have levels between 75 and85 dB(A).
Monitoring audiometry was performed annually on all workers (some protected,most not) exposed to an LEX,8h of 75 dB(A) or greater. Over the years, the number ofworkers surveyed ranged from 232 to 315. The proportion of workers with high-frequency hearing losses, possibly attributable to damage by noise, remainedconstant at around 15%. These workers were said to have joined the company witha pre-existing hearing deficit. All other workers retained normal or near-normalthresholds over the duration of the project, or exhibited hearing pathology from non-noise causes.
CONCLUSION: When workplace noise does not exceed an LEX,8h of 85 dB(A),the chance of acquiring noise-induced hearing loss is small.
4.2.2. International Institute of Noise Control Engineering (1997)
This international organization set up a Working Party to review current knowledgeand practice concerning upper noise levels in the workplace. A number of membersocieties submitted position papers dealing with existing national legislation, typicallevels of industrial noise, and programmes to enforce legislation together with theeffectiveness of those efforts.
The Working Party recommended that use of personal hearing protection should beencouraged when engineering and other noise-control measures are unable toreduce the LEX,8h of workers to 85 dB(A). The use of protectors should be mandatorywhen the exposure level is over 90 dB(A). Workers whose LEX,8h exceeds 85 dB(A)should undergo regular audiometric testing. These recommendations suggest thatthe Working Party felt that an exposure of 85 dB(A) marked a dividing line betweenno risk to hearing (or perhaps some minimal-but-acceptable risk) and unacceptablerisk. The Working Party did note that an LEX,8h of 75 dB(A) was recommended inSweden to avoid any risk of noise-induced hearing loss in any worker, but felt thatsuch a low level was not supported by definitive and unambiguous evidence.
4.3. CONCLUSIONS ON HEARING LOSS FROM LOW-LEVEL NOISE
Overall, occupational hearing loss studies involving low-level noise exposuressuggest a region of transition between no effect and a clear noise hazard. Below anLEX,8h value of 80 dB(A), the daily occupational noise seems to have little if anyeffect upon the 4 kHz threshold of even the most susceptible workers; male workersexposed to a daily average noise level of 80 dB(A) or less showed no hearing lossexcept that typically expected for their age.
report no. 01/52
10
As workplace noise becomes greater, the risk of hearing damage becomes evident.Where noise exceeds an LEX,8h of 85 dB(A), there is a chance of acquiring somedegree of noise-induced hearing loss. Above 90 dB(A), the risk of hearing damagebecomes plain and progressively more severe for groups with higher noiseexposures.
report no. 01/52
11
5. TEMPORARY THRESHOLD SHIFT AND EFFECTIVE QUIET
When considering what level might be appropriate for an occupational noise limit, itis relevant to raise the question: Is there a noise exposure which is known to causeno permanent hearing injury? The question may be phrased in an even moreextreme form: Is there a noise exposure known to produce no after-effectswhatever, either permanent or temporary?
Research into temporary threshold shift (TTS) has addressed these questions. TTSis an increase (worsening) of the hearing threshold level, for one or morefrequencies, which shows recovery once the apparent cause has been removed.Recovery occurs over a period ranging from minutes to hours to days depending onthe degree of TTS. Much research was conducted in the 1950s and 1960s, in aneffort to understand how noise damages hearing, and to set reasonable damagerisk criteria. Several aspects of this research are important for present purposes:
1) There exists a certain magnitude, in dB(A), for a broadband noise which will justfail to produce a TTS, no matter how long an individual is subjected to that noise.This level marks the top of a range which has been termed Effective Quiet.
2) Exposure to constant-level broadband noise for very long periods, up to 48 hours,has been shown to cause TTS which grows and then remains constant. Thisphenomenon is called Asymptotic Temporary Threshold Shift (ATTS); the final valueof threshold shift depends upon noise level, but is (by definition) independent ofexposure duration.
5.1. INVESTIGATIONS OF ASYMPTOTIC TEMPORARY THRESHOLD SHIFT
5.1.1. Johnson, Nixon, Stephenson (1975)
These researchers investigated ATTS in a military context: what ATTS would beexpected in US Air Force personnel exposed to continuous noise during a flightmission lasting as long as 48 hours? The threshold shift at 4 kHz, widelyacknowledged as the most noise-sensitive frequency of human hearing, was usedto determine a noise level which might produce no ATTS, in other words, a value ofEffective Quiet. Groups of subjects were exposed to pink noise (with equal SoundPressure Levels for the octave bands ranging from 125 Hz to 4 kHz) at 80, 85 and95 dB(A) for periods of 24 hours and 48 hours. TTS was measured throughout eachexposure period, for comparison with each individual’s pre-test audiogram. Foreach exposure condition, the TTS increased rapidly over the first few exposurehours, to approach the asymptotic TTS.
The values of maximum TTS found in this study were applied to various models forgrowth of ATTS. An extrapolation suggested to the investigators that 0 dB ATTSmight be expected at a sound level of 78 dB(A). This estimate of Effective Quiet wasnot regarded as definitive; further research was needed to cover a wider range offatiguing sound levels, in order to bracket the desired value for Effective Quiet.

report no. 01/52
12
5.1.2. Stephenson, Nixon, Johnson (1980)
Reviewing results from their own earlier studies, and those of other workers, ledthese researchers to hypothesise that a threshold for ATTS by broadband noise layin the wide range 65-80 dB(A). Follow-on work was undertaken, to narrow thisrange. Young male volunteers were exposed to 24 hours of broadband noise atsound levels of 65, 70, 75, 80 and 85 dB(A). TTS growth and recovery weremeasured throughout each exposure (and recovery) condition.
Stephenson, Nixon and Johnson concluded that there was a range of sound levelfor broad-band sounds which separated noises which are potentially harmful tohuman hearing, from noises which are harmless regardless of duration. This rangewas 75-80 dB(A); in this range, the beginnings of ATTS could be identified after 24hours exposures. The authors preferred 75 dB(A) as the upper limit for EffectiveQuiet, for the very long exposure durations tested. They commented that 80 dB(A)produced only a small ATTS which recovered very rapidly, even after a 24-hourexposure.
CONCLUSION: In the context of TTS, no sharp boundary exists betweenharmless and fatiguing noise exposures.
5.1.3. Mills, Adkins, Gilbert (1981)
These investigators also examined the growth and recovery of ATTS, usingbroadband noise at levels of 76, 81, 87 and 91 dB(A). For the first portion of theirstudy, exposure duration was 24 hours. The TTS was measured during theexposure and found to reach a maximum at 8 hours into the 24-hour period;thereafter, a degree of recovery appeared to take place in spite of the continuingnoise. Further investigations concentrated on the maximum TTS after 8 hours, andrecovery in quiet. Regression analysis of the ATTS data against the levels of thebroadband noise indicated (by extrapolation) an expected ATTS of 0 dB for a noiseof 78 dB(A) lasting 8 hours.
CONCLUSION: A noise exposure of 78 dB(A) would not be expected to produceany TTS after 8 hours.
5.2. A THRESHOLD FOR EFFECTIVE QUIET
Any broadband sound falling within the range of Effective Quiet may be regarded ascompletely innocuous in terms of hearing damage. In respect of any noise leveloutside (above) the range of Effective Quiet, the most severe occupational criterionmight be: Any noise capable of producing TTS (after an 8-hour exposure) carries arisk of producing a permanent shift of the hearing thresholds. Conversely, any noisewhich does not produce TTS cannot produce a noise-induced permanent shift ofhearing threshold. Research has indicated that sound of 75 dB(A) do not produceconsistent and discernible TTS, whereas 80 dB(A) does produce short-lived TTS. IfEffective Quiet does have an upper limit, that noise exposure Threshold Level isprobably about 78 dB(A).

report no. 01/52
13
6. CONCLUSIONS
The Commission of the European Union has proposed a health and safety at workdirective which contains a noise exposure Threshold Level of 75 dB(A) for each8-hour workday. This LEX,8h was chosen to eliminate the risk of noise-inducedhearing loss. The 75 dB(A) value appears to be based on InternationalStandard 1999; this standard is flawed and gives a hearing damage threshold whichis unjustifiably low.
Overall, occupational hearing loss studies involving low-level noise exposuressuggest a slowly progressive region of transition between no noise effect and aclear noise hazard for the two main noise-related effects on hearing capability, i.e.permanent hearing loss and temporary threshold shift.
Studies of permanent hearing loss from low-level occupational noise have indicatedthat for workers whose LEX,8h exceeds 85 dB(A), there is a chance of acquiring somedegree of noise-induced hearing loss. Workers exposed to 80 dB(A) LEX,8h or lesssuffered no hearing loss beyond the range typically expected for age; noise had noeffect upon the hearing at 4 kHz, the most noise-susceptible frequency, even afteryears of exposure.
Investigations into temporary threshold shift (TTS) have produced results applicableto the transition zone between harmless and harmful occupational noise exposure.Any noise capable of producing TTS (after an 8-hour exposure) carries a risk ofproducing a permanent shift of the hearing thresholds after years of repeatedexposures. Conversely, any noise which does not produce TTS cannot produce aNIPTS. Research has indicated that sound levels of 75 dB(A) do not produceconsistent and discernible TTS even after many hours, whereas 80 dB(A) doesproduce detectable but very short-lived TTS.
The results of this review indicate that the Threshold Level of 75 dB(A) proposed inthe draft directive is too restrictive; no permanent injury or temporary effect would beanticipated. If it is possible to specify a unique Threshold Level for hearingprotection as a value of noise exposure, above which hearing injury is measurableand significant, and below which no effect is discernible, an LEX,8h of 80 dB(A)seems to be a suitable value. Years of occupational exposure to noise at 80 dB(A)do not produce a discernible NIPTS and only a non-significant temporary thresholdshift.

report no. 01/52
14
7. REFERENCES
Burns W, Robinson DW. Hearing and noise in industry. Her Majesty’s StationeryOffice, London, 1970.
Commission of the European Communities. Proposal for a Council Directive on theminimum health and safety requirements regarding the exposure of workers to therisks arising from physical agents. Official Journal of the European Communities, 18March 1993, No C 77/12-29.
Commission of the European Union. Amended proposal for a Council Directive onthe minimum health and safety requirements regarding the exposure of workers tothe risks arising from physical agents. Official Journal of the EuropeanCommunities, 19 August 1994, No C 230/3-12.
Environmental Protection Agency. Information on levels of environmental noiserequisite to protect public health and welfare with an adequate margin of safety.Report 550/9-74-004, 1974, US Environmental Protection Agency, Washington DC.
Flottorp G. Ten year test of the Norwegian regulations relating to noise at theworkplace. Proceedings 15th International Congress on Acoustics, Trondheim,1995; III: 225-228.
Guignard JC. A basis for limiting noise exposure for hearing conservation. Issuedjointly as: Report EPA-550/9-73-001-A, 1973, US Environmental Protection Agency,Washington DC; Report AMRL-TR-73-90, 1973, Aerospace Medical ResearchLaboratory, Wright-Patterson Air Force Base, Ohio.
International Institute of Noise Control Engineering. Final report: Technicalassessment of upper limits on noise in the workplace. Noise/News International1997; 5: 203-216.
International Organization for Standardization. Acoustics – Threshold of hearing byair conduction as a function of age and sex for otologically normal persons.ISO 7029:1984.
International Organization for Standardization. Acoustics – Determination ofoccupational noise exposure and estimation of noise-induced hearing impairment.ISO 1999:1990 second edition. (Preceded by two draft international standardsISO/DIS 1999 of 1982 and ISO/DIS 1999.2 of 1985.)
Johnson DL. Prediction of NIPTS due to continuous noise exposure. Issued jointlyas: Report EPA-550/9-73-001-B, 1973, US Environmental Protection Agency,Washington DC; Report AMRL-TR-73-91, 1973, Aerospace Medical ResearchLaboratory, Wright-Patterson Air Force Base, Ohio.
Johnson DL. Derivation of presbycusis and noise induced permanent threshold shift(NIPTS) to be used for the basis of a standard on the effects of noise on hearing.Report AMRL-TR-78-128, 1978, Aerospace Medical Research Laboratory, Wright-Patterson Air Force Base, Ohio.

report no. 01/52
15
Johnson DL, Nixon CW, Stephenson MR. Asymptotic behavior of temporarythreshold shift during exposure to long duration noises. Chapter 5 in: Whitcomb MA(ed.), Effects of long duration noise exposure on hearing and health. NATO AdvisoryGroup for Aerospace Research and Development, Neuilly sur Seine, France;AGARD Conference Proceedings No. 171, 1975.
Mills JH, Adkins WY, Gilbert RM. Temporary threshold shifts produced by widebandnoise. Journal Acoustical Society America 1981; 70: 390-396.
Passchier-Vermeer W. Hearing levels of non-noise exposed subjects and ofsubjects exposed to constant noise during working hours. Report B 367, ResearchInstitute for Environmental Hygiene, Delft, 1977.
Passchier-Vermeer W, v d Berg R, Rövekamp AJM. The effects of age andoccupational noise exposure on hearing threshold levels of various populations.Inter-noise 85, Munich, 1985; II: 1395-1398.
Passchier-Vermeer W. The effects of age, otological factors and occupational noiseon hearing threshold levels of various populations. In: Salvi RJ et al (eds.), Basicand applied aspects of noise-induced hearing loss. Plenum Press, New York, 1986;571-581.
Passchier-Vermeer W. Occupational noise exposure and hearing: An analysis ofrecent publications on age-related hearing threshold levels and on hearing thresholdlevels of occupational noise-exposed populations. Report 88056, 1988, TNOInstitute of Preventive Health Care, Leiden.
Robinson DW, Shipton MS. Tables for the estimation of noise-induced hearing loss.Acoustics Report Ac 61 (second edition), National Physical Laboratory, Teddington,1977.
Robinson DW, Lawton BW, Rice CG. Occupational hearing loss from low-levelnoise. Contract Research Report No. 68/1994, Health and Safety Executive, HSEBooks, Sudbury, UK, 1994.
Stephenson MR, Nixon CW, Johnson DL. Identification of the minimum noise levelcapable of producing an asymptotic temporary threshold shift. Aviation SpaceEnvironmental Medicine 1980; 51: 391-396.

report no. 01/52
16
APPENDIX 1
CALCULATED HEARING THRESHOLDS FOR AGE AND NOISE EFFECTACCORDING TO ISO 1999
The lower limit of applicability of the standard, an LEX,8h of 75 dB(A), is implicit in thecalculation method. For exposure levels above 75 dB(A), and durations rangingfrom 10 to 40 years, the median NIPTS values, N0.50 in dB, for both sexes are givenby the equation:
N0.50 = [u + v log q ] [ L EX,8h – L0 ]2
where L0 is a cut-off sound pressure level defined as a function of audiometricfrequency, with values given in tabular form,
q is the exposure time in years, and
u and v are parameters tabulated as a function of frequency.
The standard gives a table of values for the quantities u, v and L0 appropriate to thedifferent audiometric frequencies. The values of L0 have been extracted forexamination here.
Table A1: Values of L0 for each audiometric frequency
Frequency, kHz L0, dB
0.5 931 892 803 774 756 77
Note that L0 assumes a minimum value at 4 kHz, the audiometric frequency at whichnoise-induced hearing loss usually appears first. For an LEX,8h of 75 dB(A), thesquared term in the equation above equals zero, therefore the median NIPTS iszero. For LEX,8h < 75 dB(A), NIPTS is defined as zero. Another equation allowscalculation of various fractiles of the NIPTS distribution; this equation also containsthe term [ LEX,8h – L0 ]
2 . Therefore, NIPTS at 4 kHz is zero for all members of thepopulation exposed to 75 dB(A) or less.
From the values of L0 given here in Table A1, it may be seen that NIPTS at 4 kHzwill be non-zero only when a threshold of 75 dB(A) is exceeded. For NIPTS at 3 and6 kHz, the threshold value is 77 dB(A). For the lower frequencies, the thresholdvalues are higher still.
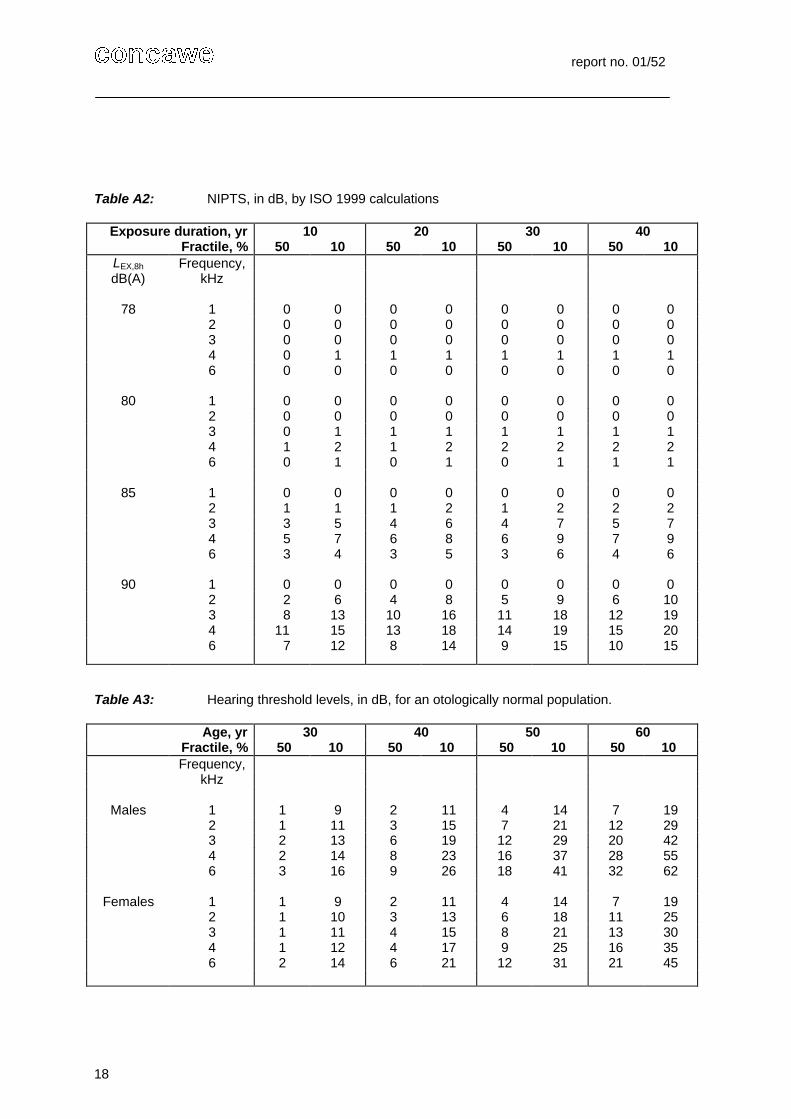
To show the influence of the quantity L0 upon NIPTS, threshold shifts are given inTable A2 for the frequencies 1–6 kHz, and for various values of LEX,8h. Of interesthere is hearing loss due to relatively low noise exposures, therefore NIPTS valuesare given to represent the median of the noise-exposed population and also themost noise-susceptible decile. An LEX,8h of 75 dB(A) yields NIPTS values of zero.Exposures of 76 and 77 dB(A) give non-zero NIPTS values for 4 kHz but roundingto the nearest integer decibel still gives entries of zero.
report no. 01/52
17
For an LEX,8h of 78 dB(A), a non-zero value of NIPTS at 4 kHz emerges for the'tender-ear' decile after 10 years of exposure. After 20 years of exposure, thethreshold shift at the median reaches 1 dB. Further exposure duration up to 40years does not enlarge the 1 dB of NIPTS at 4 kHz, and does not produce NIPTS atany other frequency. A threshold shift of 1 dB is virtually undetectable, and isimperceptible to the person with such a loss.
CONCLUSION: ISO 1999 states a damage risk threshold LEX,8h equal to75 dB(A). However, NIPTS is not predicted until an exposure of78 dB(A) is reached.
Returning to Table A2, it may be seen that an LEX,8h of 80 dB(A) is the next point ofinterest: non-zero values of NIPTS are now exhibited for the frequencies 3 and6 kHz, as well as for 4 kHz, the most noise-sensitive frequency. The NIPTS valuesare, however, very small. As the noise exposure assumes higher values, 85 and90 dB(A), it may be seen that NIPTS grows quickly over the exposure durationperiod up to 10 years, and then less quickly over the period 10–40 years. Thegrowth of NIPTS is faster for the 'tender-ear' decile than at the median; this meansthat the NIPTS distribution is becoming more disperse with increasing exposuretime. Finally, keeping exposure duration constant, it may be seen that increasingvalues of LEX,8h leads to increasing, in fact rapidly accelerating, NIPTS at any onefrequency or fractile. Between 75 and 80 dB(A), NIPTS at the frequencies 3, 4 and6 kHz hardly grows at all. Above 85 dB(A), NIPTS at these frequencies increasessharply with increasing LEX,8h.
HEARING THRESHOLD LEVELS OF A NOISE-EXPOSED POPULATION: THECOMBINATION OF AGE AND NOISE
Having calculated in the previous section the NIPTS at a number of frequencies andfor various noise exposure levels and durations, the overall hearing threshold levelH for any frequency may be evaluated by using the empirical formula given inISO 1999 (the terms of the equation have been altered slightly for clarity ofpresentation here):
H = A + N – [( A × N ) ⁄ 120]
where A is the hearing threshold level, in dB, associated with natural ageingand incurred loss from other causes, and
N is the NIPTS in dB.
The equation is applicable only to corresponding fractile values of H, A and N. Thismeans, for example, that H at the worse-hearing decile (10%) will result for theequation applied with the 10% values for A and N.
Otologically normal population
Values of A, age-related hearing loss for a relevant baseline population, are needed.One set of such baseline values is available from standard ISO 7029, giving thevariation of hearing threshold with age for various fractiles of the otologically normalmale and female populations. The otologically normal population is a screened orselected sample, composed of persons in a normal state of health, free ofobstructing wax in the ear canals, without past or present ear disease, and havingno history of "undue" noise exposure. The hearing data from ISO 7029 are alsoincluded in ISO 1999, and a selection is reproduced here in Table A3 where values
report no. 01/52
18
Table A2: NIPTS, in dB, by ISO 1999 calculations
Exposure duration, yr 10 20 30 40Fractile, % 50 10 50 10 50 10 50 10
LEX,8h Frequency,dB(A) kHz
78 1 0 0 0 0 0 0 0 02 0 0 0 0 0 0 0 03 0 0 0 0 0 0 0 04 0 1 1 1 1 1 1 16 0 0 0 0 0 0 0 0
80 1 0 0 0 0 0 0 0 02 0 0 0 0 0 0 0 03 0 1 1 1 1 1 1 14 1 2 1 2 2 2 2 26 0 1 0 1 0 1 1 1
85 1 0 0 0 0 0 0 0 02 1 1 1 2 1 2 2 23 3 5 4 6 4 7 5 74 5 7 6 8 6 9 7 96 3 4 3 5 3 6 4 6
90 1 0 0 0 0 0 0 0 02 2 6 4 8 5 9 6 103 8 13 10 16 11 18 12 194 11 15 13 18 14 19 15 206 7 12 8 14 9 15 10 15
Table A3: Hearing threshold levels, in dB, for an otologically normal population.
Age, yr 30 40 50 60Fractile, % 50 10 50 10 50 10 50 10 Frequency,
kHz
Males 1 1 9 2 11 4 14 7 192 1 11 3 15 7 21 12 293 2 13 6 19 12 29 20 424 2 14 8 23 16 37 28 556 3 16 9 26 18 41 32 62
Females 1 1 9 2 11 4 14 7 192 1 10 3 13 6 18 11 253 1 11 4 15 8 21 13 304 1 12 4 17 9 25 16 356 2 14 6 21 12 31 21 45
report no. 01/52
19
are given for the frequencies 1–6 kHz at the median (50%) and at the worse-hearing10% point for males and females at various ages.
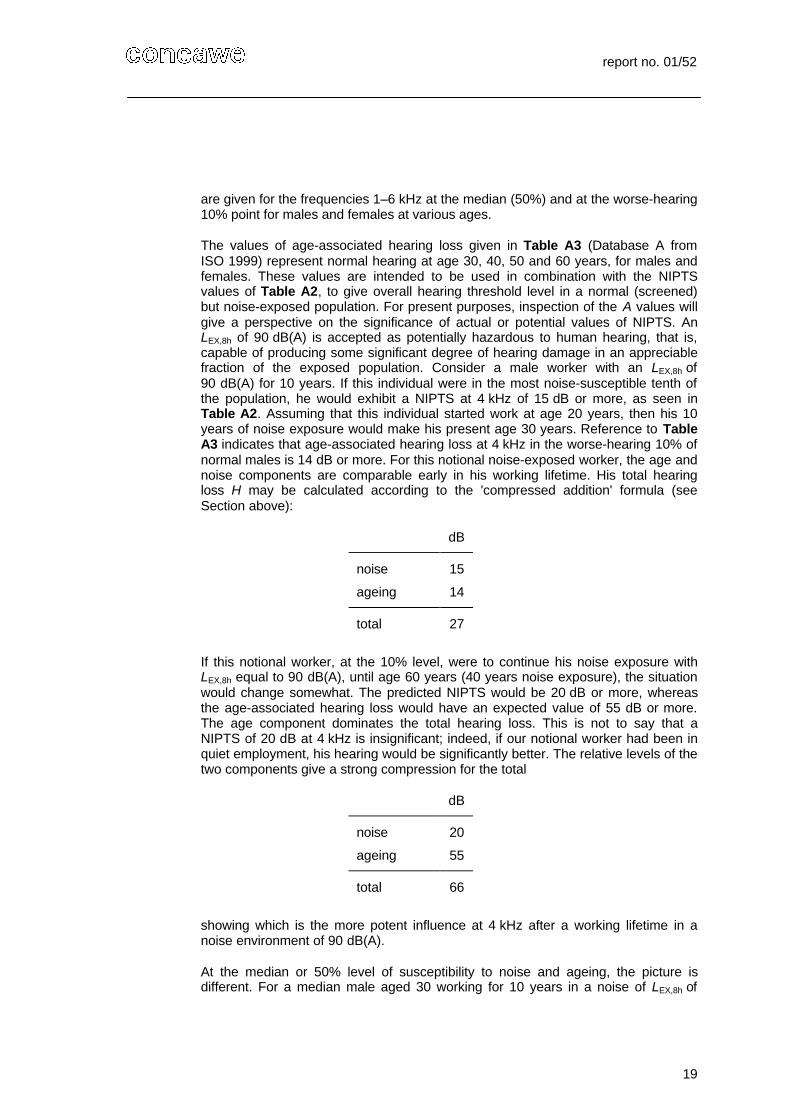
The values of age-associated hearing loss given in Table A3 (Database A fromISO 1999) represent normal hearing at age 30, 40, 50 and 60 years, for males andfemales. These values are intended to be used in combination with the NIPTSvalues of Table A2, to give overall hearing threshold level in a normal (screened)but noise-exposed population. For present purposes, inspection of the A values willgive a perspective on the significance of actual or potential values of NIPTS. AnLEX,8h of 90 dB(A) is accepted as potentially hazardous to human hearing, that is,capable of producing some significant degree of hearing damage in an appreciablefraction of the exposed population. Consider a male worker with an LEX,8h of90 dB(A) for 10 years. If this individual were in the most noise-susceptible tenth ofthe population, he would exhibit a NIPTS at 4 kHz of 15 dB or more, as seen inTable A2. Assuming that this individual started work at age 20 years, then his 10years of noise exposure would make his present age 30 years. Reference to TableA3 indicates that age-associated hearing loss at 4 kHz in the worse-hearing 10% ofnormal males is 14 dB or more. For this notional noise-exposed worker, the age andnoise components are comparable early in his working lifetime. His total hearingloss H may be calculated according to the 'compressed addition' formula (seeSection above):
dB
noise 15
ageing 14
total 27
If this notional worker, at the 10% level, were to continue his noise exposure withLEX,8h equal to 90 dB(A), until age 60 years (40 years noise exposure), the situationwould change somewhat. The predicted NIPTS would be 20 dB or more, whereasthe age-associated hearing loss would have an expected value of 55 dB or more.The age component dominates the total hearing loss. This is not to say that aNIPTS of 20 dB at 4 kHz is insignificant; indeed, if our notional worker had been inquiet employment, his hearing would be significantly better. The relative levels of thetwo components give a strong compression for the total
dB
noise 20
ageing 55
total 66
showing which is the more potent influence at 4 kHz after a working lifetime in anoise environment of 90 dB(A).
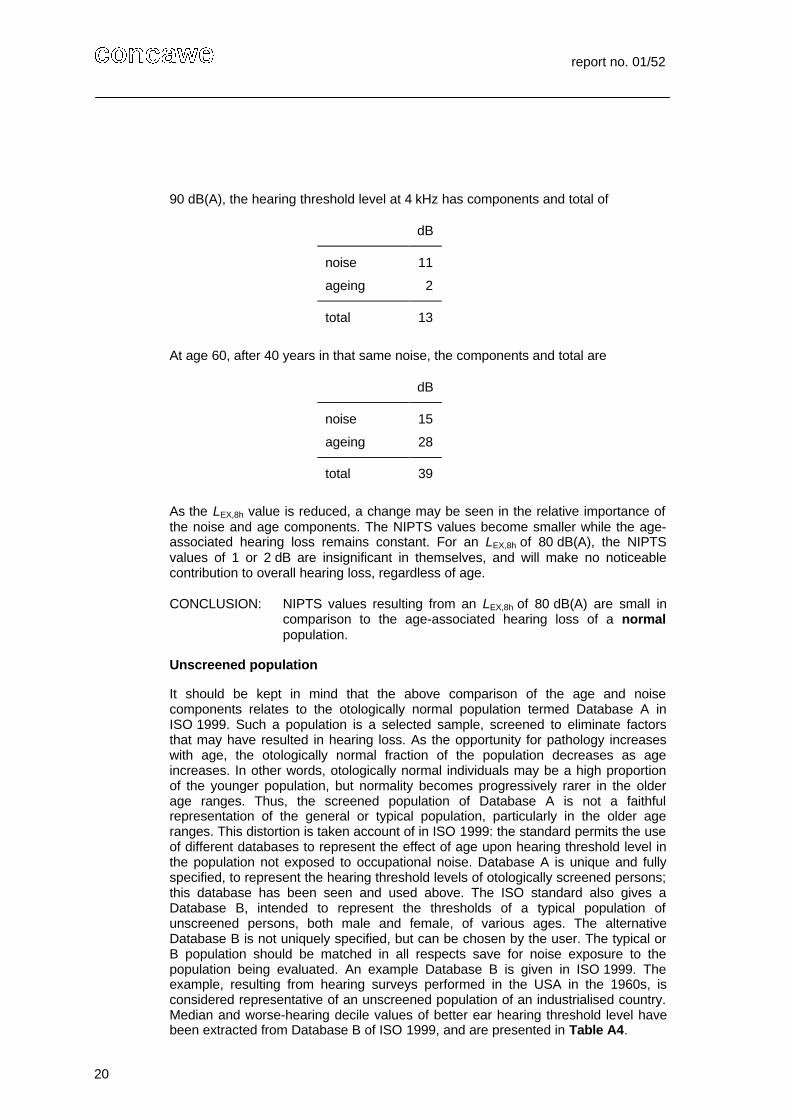
At the median or 50% level of susceptibility to noise and ageing, the picture isdifferent. For a median male aged 30 working for 10 years in a noise of LEX,8h of
report no. 01/52
20
90 dB(A), the hearing threshold level at 4 kHz has components and total of
dB
noise 11
ageing 2
total 13
At age 60, after 40 years in that same noise, the components and total are
dB
noise 15
ageing 28
total 39
As the LEX,8h value is reduced, a change may be seen in the relative importance ofthe noise and age components. The NIPTS values become smaller while the age-associated hearing loss remains constant. For an LEX,8h of 80 dB(A), the NIPTSvalues of 1 or 2 dB are insignificant in themselves, and will make no noticeablecontribution to overall hearing loss, regardless of age.
CONCLUSION: NIPTS values resulting from an LEX,8h of 80 dB(A) are small incomparison to the age-associated hearing loss of a normalpopulation.
Unscreened population
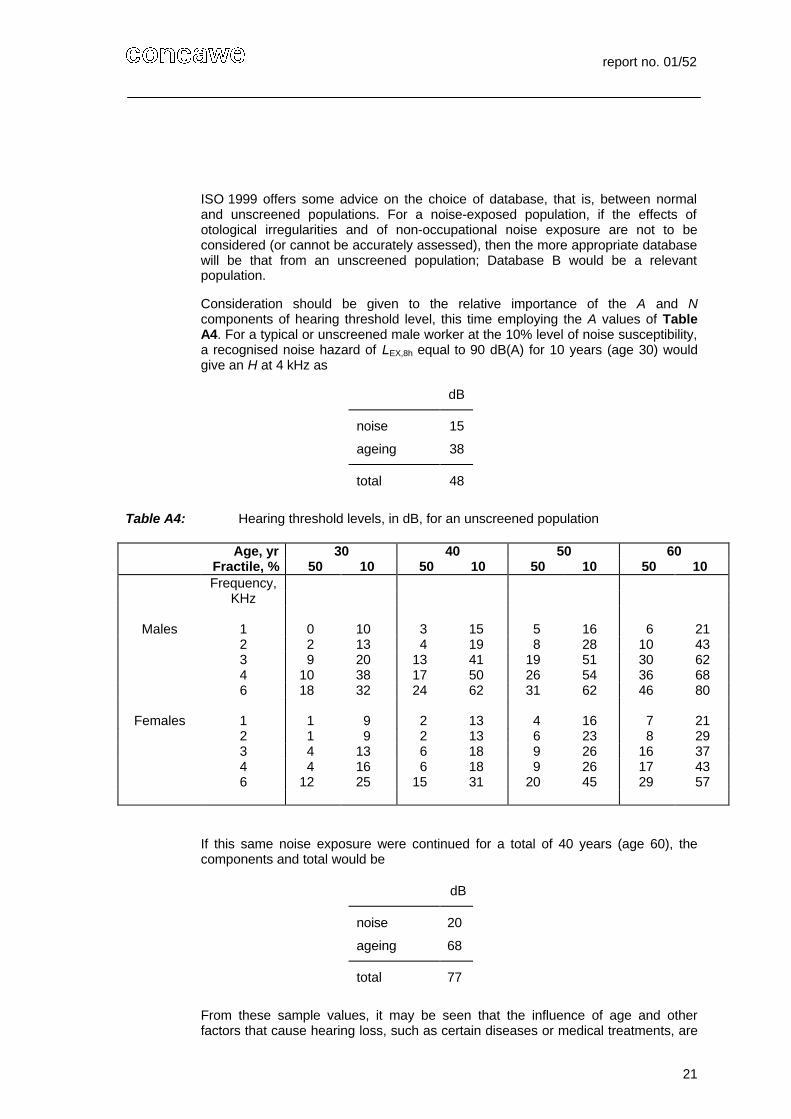
It should be kept in mind that the above comparison of the age and noisecomponents relates to the otologically normal population termed Database A inISO 1999. Such a population is a selected sample, screened to eliminate factorsthat may have resulted in hearing loss. As the opportunity for pathology increaseswith age, the otologically normal fraction of the population decreases as ageincreases. In other words, otologically normal individuals may be a high proportionof the younger population, but normality becomes progressively rarer in the olderage ranges. Thus, the screened population of Database A is not a faithfulrepresentation of the general or typical population, particularly in the older ageranges. This distortion is taken account of in ISO 1999: the standard permits the useof different databases to represent the effect of age upon hearing threshold level inthe population not exposed to occupational noise. Database A is unique and fullyspecified, to represent the hearing threshold levels of otologically screened persons;this database has been seen and used above. The ISO standard also gives aDatabase B, intended to represent the thresholds of a typical population ofunscreened persons, both male and female, of various ages. The alternativeDatabase B is not uniquely specified, but can be chosen by the user. The typical orB population should be matched in all respects save for noise exposure to thepopulation being evaluated. An example Database B is given in ISO 1999. Theexample, resulting from hearing surveys performed in the USA in the 1960s, isconsidered representative of an unscreened population of an industrialised country.Median and worse-hearing decile values of better ear hearing threshold level havebeen extracted from Database B of ISO 1999, and are presented in Table A4.
report no. 01/52
21
ISO 1999 offers some advice on the choice of database, that is, between normaland unscreened populations. For a noise-exposed population, if the effects ofotological irregularities and of non-occupational noise exposure are not to beconsidered (or cannot be accurately assessed), then the more appropriate databasewill be that from an unscreened population; Database B would be a relevantpopulation.
Consideration should be given to the relative importance of the A and Ncomponents of hearing threshold level, this time employing the A values of TableA4. For a typical or unscreened male worker at the 10% level of noise susceptibility,a recognised noise hazard of LEX,8h equal to 90 dB(A) for 10 years (age 30) wouldgive an H at 4 kHz as
dB
noise 15
ageing 38
total 48
Table A4: Hearing threshold levels, in dB, for an unscreened population
Age, yr 30 40 50 60Fractile, % 50 10 50 10 50 10 50 10 Frequency,
KHz
Males 1 0 10 3 15 5 16 6 212 2 13 4 19 8 28 10 433 9 20 13 41 19 51 30 624 10 38 17 50 26 54 36 686 18 32 24 62 31 62 46 80
Females 1 1 9 2 13 4 16 7 212 1 9 2 13 6 23 8 293 4 13 6 18 9 26 16 374 4 16 6 18 9 26 17 436 12 25 15 31 20 45 29 57
If this same noise exposure were continued for a total of 40 years (age 60), thecomponents and total would be
dB
noise 20
ageing 68
total 77
From these sample values, it may be seen that the influence of age and otherfactors that cause hearing loss, such as certain diseases or medical treatments, are
report no. 01/52
22
more potent than that of a working lifetime in an LEX,8h of 90 dB(A). This conclusionholds also for the median male of an unscreened population, and also for otheraudiometric frequencies less affected by noise. For lower noise exposures, theinequality becomes greater still. For an LEX,8h of 80 dB(A), the predicted NIPTSvalues of 1 or 2 dB are not only insignificant in themselves, but will make nodetectable contribution to overall hearing loss, regardless of age.
CONCLUSION: NIPTS values resulting from an LEX,8h of 80 dB(A) areinsignificant in comparison to the hearing loss associated withageing and adventitious pathology in a typical or unscreenedpopulation.