ahp bpr
TRANSCRIPT
7/27/2019 AHP BPR
http://slidepdf.com/reader/full/ahp-bpr 1/15
Development of a decision-making strategy to improvethe efficiency of BPR
Selma Limam Mansar a, Hajo A. Reijers b,*, Fouzia Ounnar c
a Carnegie Mellon University, Information Systems Program, P.O. Box 24866, Doha, Qatarb Eindhoven University of Technology, Department of Technology Management, P.O. Box 513, 5600 MB Eindhoven, The Netherlands
c Universite Paul Ce zanne, Laboratoire des Sciences de l’Information et des Syste mes, UMR CNRS 6168,
Avenue Escadrille Normandie Niemen, 13397 Marseille cedex 20, France
Abstract
To support the efficient appraisal of and selection from a list of generic business process improvement principles, this paper proposes astrategy for the implementation of business process redesign (BPR). Its backbone is formed by the analytic hierarchy process (AHP)multicriteria method and our earlier research into the popularity and impact of a set of redesign ‘‘best practices ”. Using AHP, we derivea classification of most suitable directions for a particular process to be redesigned. Criteria such as the popularity, the impact, the goalsand the risks of BPR implementation are taken into account. A case study is included to demonstrate the method’s feasibility andeffectiveness.Ó 2008 Elsevier Ltd. All rights reserved.
Keywords: Business process redesign; AHP; Multi-criteria; Decision-making; Best practices
1. Introduction
One of the highlights in a large survey among seniorbusiness managers is that business process redesign(BPR) is almost as popular again as it was in the beginningof the 1990s (Rigby & Bilodeau, 2005). Despite the contin-ued interest in this approach to rethink existing processstructures considering the opportunities that IT provides,few analytical tools exist to support the actual redesignof a business process (Nissen, 1988). The aim of the work
as presented in this paper is to develop a tool that supportsthe decision-making process practitioners apply to come upwith a new, improved plan for a business process.
This aim links up with a more general observation thatBPR often does not lead to the desired results, because it isa time-consuming and costly affair with unpredictable
results. It has been argued that there is a clear need toimprove the redesign process itself (Hofacker & Vetschera,2001; Nissen, 1988; Reijers, 2003). The goal of the decision-making tool that is described in this paper is to:
(i) increase the efficiency of the redesign process itself,and
(ii) to lead to a more systematic evaluation of improve-ment opportunities.
In earlier work (Limam Mansar & Reijers, 2005, 2007;Reijers & Limam Mansar, 2005), we published on ourefforts to attain the second goal through the identification,validation, and practical use of a set of so-called ‘‘bestpractices”. In this context, a best practice is a general heu-ristic derived from earlier successful encounters to improveprocess performance, which may need skilful adaptation tobe applied in a concrete setting. For example, instead of using a paper file which favors processing in a sequentialway (i.e. the physical document is passed from one execu-tor to the other), the use of an electronic file may be con-
0957-4174/$ - see front matter Ó 2008 Elsevier Ltd. All rights reserved.
doi:10.1016/j.eswa.2008.01.008
* Corresponding author. Tel.: +31 40 2473629.E-mail addresses: [email protected] (S. Limam Mansar), h.a.
[email protected] (H.A. Reijers), [email protected] (F. Ounnar).
www.elsevier.com/locate/eswa
Available online at www.sciencedirect.com
Expert Systems with Applications xxx (2008) xxx–xxx
Expert Systems with Applications
ARTICLE IN PRESS
Please cite this article in press as: Limam Mansar, S. et al., Development of a decision-making strategy to improve ..., Expert Systemswith Applications (2008), doi:10.1016/j.eswa.2008.01.008

7/27/2019 AHP BPR
http://slidepdf.com/reader/full/ahp-bpr 2/15
sidered to speed up the work, as people can work concur-
rently on their own electronic copies.The proposed set of best practices may be used to struc-
ture the redesign sessions with business professionals, as wedid, for example, for the redesign of an intake procedure ina mental health-care setting (Jansen-Vullers & Reijers,
2006). Each best practice was considered by all participantson its applicability and subsequently subjected to a morethorough performance evaluation by simulating the pro-cess models. But even though this structured approachimproves upon the often intuitive way that BPR is carriedout, it remains problematic in the sense that such anapproach requires considerable time and efforts from allparticipants to carry out the project.
The described tool in this paper still fosters the system-
atic breadth of considering a set of redesign best practices,but it also addresses the efficiency of the BPR process byefficiently classifying a set of most appropriate best prac-tices for a specific case. Such a result may serve as a
‘‘kick-start” for the redesign team involved, speeding upthe redesign process.
There have been other contributions in this field wheremainly artificial intelligence algorithms have been used.Case-based reasoning and inference rules are examples of such approaches (see e.g. Min, Kim, Kim, Min, & Ku,1996). However, the majority of these contributions requirethe gathering of a large set of successful cases or addressonly specific processes for a given industrial or service sec-tor. An exception is the work of Nissen (Nissen, 1988) thataims to detect weaknesses in a given process design byusing various metrics and dedicated algorithms. Although
the aim of this work is comparable to ours, the approachis completely different, as will be discussed in our relatedwork section (see Section 7).
In the remainder of this paper, Section 2 will give thenecessary background for this paper in the form of an over-view of our earlier work. Section 3 gives a high-leveldescription and contribution of our tool and specificallyhow it may help to improve upon common design practice.Section 4 deals with introducing the different aspects or cri-teria that should be taken into account when decidingwhich best practice should be implemented in a concretesituation. Section 5 introduces AHP as the multicriteriadecision-making method chosen for this study and buildsup the strategy for the implementation of BPR usingAHP. Section 6 applies our findings to the case study of a Dutch municipality. Section 7 is a review of related work.Finally, Section 8 provides our conclusions and futurework.
2. Background
In total, we earlier identified 29 best practices (Refer toTable 2) that are widely applied by practitioners and found(partial) support in the literature to improve the perfor-mance of existing processes (Reijers & Limam Mansar,
2005). To search for improvement opportunities in an
existing process and to locally apply one or more best prac-tices is clearly different from the original reengineeringidea, which is to get rid of current work practice and startthinking out the business process all over again (Hammer& Champy, 1993). However, the latter ‘‘clean slate”approach has repeatedly proven to be impractical in reality
(Al-Mashari, Irani, & Zairi, 2001; Davenport & Stoddard,1994; Sockalingam & Doswell, 1996), which explains thefocus of our work. In the same paper in which we publishedour set of best practices (Reijers & Limam Mansar, 2005),we also discussed the qualitative impact of each best prac-tice on four important performance indicators of the rede-signed processes: its time, quality, cost and flexibility.
If a process were to be redesigned using this set of bestpractices, all 29 of them would need to be carefully scruti-nized to assess their applicability to the process at hand. Itis clearly a lengthy procedure that will require many meet-ings involving various stakeholders. We already aimed tolimit this effort by listing and classifying the best practices
into a framework (Limam Mansar & Reijers, 2005). Theidea behind a framework is to help practitioners by identi-fying the components that should be considered and howthese components are related. Our framework includedeight components, namely, the customer’s perspective of the process, the information handled, the product deliveredby the process, the operation, behavior and organizationviews of the process, the technology that supports the pro-cess and finally the external environment.
In the same paper (Limam Mansar & Reijers, 2005), wepublished on the exposure of the best practices and theframework to experienced BPR practitioners in both the
Netherlands and the United Kingdom. To establish theirpractical use and impact, a survey was undertaken in theyears 2003–2004. In that survey, we asked the experts’ helpto validate our framework and to classify the ten most pop-ular best practices; this in an effort to highlight the mostrelevant ones.
In Limam Mansar and Reijers (2007) we continued oursurvey analysis discussing the feedback received from theexperts on the practical impact of the various best practicesin terms of cost, time, quality, and flexibility improvement.It is important to note that the latter discussion was con-ducted on the top ten best practices only (as it would havebeen too long to include them all in the survey).
So far, we applied the set of best practices to improveexisting business processes in various settings, such as amental health-care institute, a medium-sized mortgage len-der, a Dutch ministry, and a large multi-national bank(Jansen-Vullers & Reijers, 2006; Limam Mansar & Reijers,2005; Reijers, 2003). This paper includes the case of a localmunicipality where the set of best practices was applied toredesign their invoice handling process (see Section 6).
These accumulated experiences, stressed even further theimportance of making the BPR process itself more efficient.They also delivered many of the insights that were requiredto develop the tool, of which the specifics will be given in
the following sections.
2 S. Limam Mansar et al. / Expert Systems with Applications xxx (2008) xxx–xxx
ARTICLE IN PRESS
Please cite this article in press as: Limam Mansar, S. et al., Development of a decision-making strategy to improve ..., Expert Systemswith Applications (2008), doi:10.1016/j.eswa.2008.01.008
7/27/2019 AHP BPR
http://slidepdf.com/reader/full/ahp-bpr 3/15
3. The redesign process
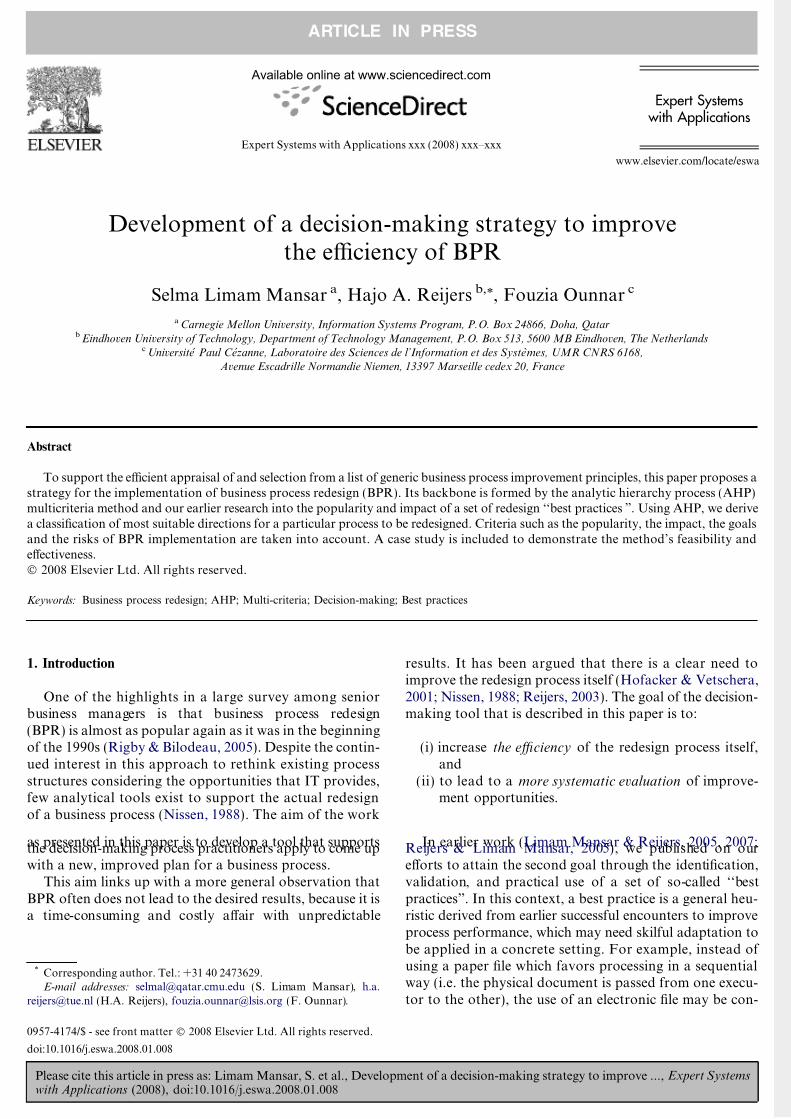
To position the contribution of our work in this paper,we will describe in this section a general context of the rede-sign process and how it is thought to be improved by thedecision-making strategy we propose. In Fig. 1, we show
three different approaches, all of which lead to an improveddesign for a certain business process in a more or less sys-tematic way.
At the left-hand side of the figure, the so-called ‘‘creativeapproach” is depicted. Starting from a set of goals, brain-storming sessions and constructive discussions are held tofinally arrive at an improved process design. This is an intu-itive and highly iterative approach, often carried out withinthe setting of a workshop facilitated by management con-sultants (Reijers, 2003). Its advantages are obviously thatusers as well as practitioners have a broad playing fieldfor creativity and innovation. Its drawbacks are that dis-cussions can lead to biased choices or even to neglecting
some alternatives that might be worth testing. As weargued before (Reijers & Limam Mansar, 2005), thisapproach is probably the most applied way to reach animproved design and is described as such in practitionerguides and management text books (see e.g. Davenport,
1993; Hammer & Champy, 1993; Sharp & McDermott,2001).
An alternative is the so-called ‘‘structured approach”,which can be seen in the middle of Fig. 1. As detailed exten-sively in Limam Mansar and Reijers (2005) and industriallyapplied in the settings of a municipality (see Section 5) and
mental healthcare (Jansen-Vullers & Reijers, 2006), thisapproach builds on an extensive list of potentially effectivetechniques to change and improve an existing process thatwe called best practices. We explained that our earlierresearch has identified (Reijers & Limam Mansar, 2005)and validated (Limam Mansar & Reijers, 2005; LimamMansar & Reijers, 2007) a set of 29 recurring best practicesin process redesign projects. In the structured approach,each best practice from the extensive list is evaluatedtogether with a representation of stakeholders, after whichsimulation is used to evaluate the performance improve-ment. The (sub)set of best practices that leads to the mostdesirable performance is then presented to the users for
final discussion, choice and augmentation. The advantagesof this approach are the drawbacks of the creativeapproach: less bias and a systematic evaluation of opportu-nities. However, the drawbacks are the lack of creativityand innovation (advantages of the creative approach),
Brainstorm
start
Discuss
final design
Evaluate BP
start
Discuss
final design
next
BP
Shortlist BP’s
Discuss
final design
AHP
Creative
approach
Structured
approach
Proposed
approach
Simulate
Set goals Set goals
start
Set goals
Fig. 1. Transformation of the redesign process.
S. Limam Mansar et al. / Expert Systems with Applications xxx (2008) xxx–xxx 3
ARTICLE IN PRESS
Please cite this article in press as: Limam Mansar, S. et al., Development of a decision-making strategy to improve ..., Expert Systemswith Applications (2008), doi:10.1016/j.eswa.2008.01.008
7/27/2019 AHP BPR
http://slidepdf.com/reader/full/ahp-bpr 4/15
but also the fact that a model is an imperfect representationof reality and the output of the simulation needs always tobe interpreted cautiously. Furthermore, simulation is acumbersome process and simply takes time to be set up.
In this paper we propose an improved approach to rede-signing processes as shown at the right-hand side of Fig. 1.
It attempts to counter the drawbacks of the creative as wellas of the structured approaches we have discussed so far.After discussing with the users the goals of the redesignand the risks that need to be faced, a decision-making tool(based on AHP, presented in Sections 4 and 5 and illus-trated in Section 6) is used to generate a list of preferredbest practices for redesign. It gives a focus to a set of bestpractices that could potentially be applied to improve theperformance of the existing process. By providing such ashortlist, it cuts out a number of best practices and narrowsthe scope for the discussions with the users. The usersremain the final decision makers and can choose the bestpractices to implement or revert to simulating the short
listed best practices for further insights. Compared to theuse of discrete event simulation, the presented approachis more efficient, although it still relies on approximationsand on modeling the decision-making process. At the sametime, it focuses more on a qualitative, user-involved evalu-ation of best practices performances rather than a quanti-tative, simulation approach from behind a desk.
The proposed approach implies building a decision-making tool that will allow the redesign team to expresspreferences and hence derive a shortlist of best practices.To do so, we define in this paper appropriate selection cri-teria. We set up their importance and build the decision-
making process using the AHP algorithm. The output of the tool is a generated short list of best practices withinthe proposed approach. In the next section, we discussthe selected criteria.
4. Criteria for a decision-making strategy
Based on the analysis of practitioner guidebooks (e.g.Sharp & McDermott, 2001) and on our practical redesignexperience (e.g. Reijers, 2003), we developed our insightson how process redesign takes place in practice. As arguedin the introduction, practitioners tend to start with firstobserving the process and the organization. They identifywith (top) managers the issues within the process and therisks the implementation may face and set up one or several goals (performance) for the redesign. They may decide notto look back at existing processes and produce a com-pletely new design or they may decide to improve the cur-rent processes. In the latter case, they would use theirexperience to spot areas of improvement and come up withalternative designs. Redesign rules are used for this purposeand practitioners choose amongst the rules for one or sev-eral reasons: they ‘always’ use some popular rules, theychoose a rule because they expect it to have some sort of impact on the process (reduce cost, improve the quality,
etc.) or because it improves on some components of the
redesign such as the use of technology or relationships withthe customers.
This implies that the decision on which rules to use isimplicitly based on a set of criteria:
– The popularity of the redesign rules.
– The component of the redesign, i.e. which perspectiveare we looking at? – The impact of the redesign rules on the processes. – The redesign goals. – The redesign risks.
These criteria are our starting point for the decision-making tool to support and improve the efficiency of BPR. In what follows, we explore ways to qualitativelyor quantitatively express the criteria and relate them tothe BPR best practices. For qualitative evaluation, we willuse the original AHP scale as introduced in Saaty (1980). Itsets preference statements defined to be selected from a set
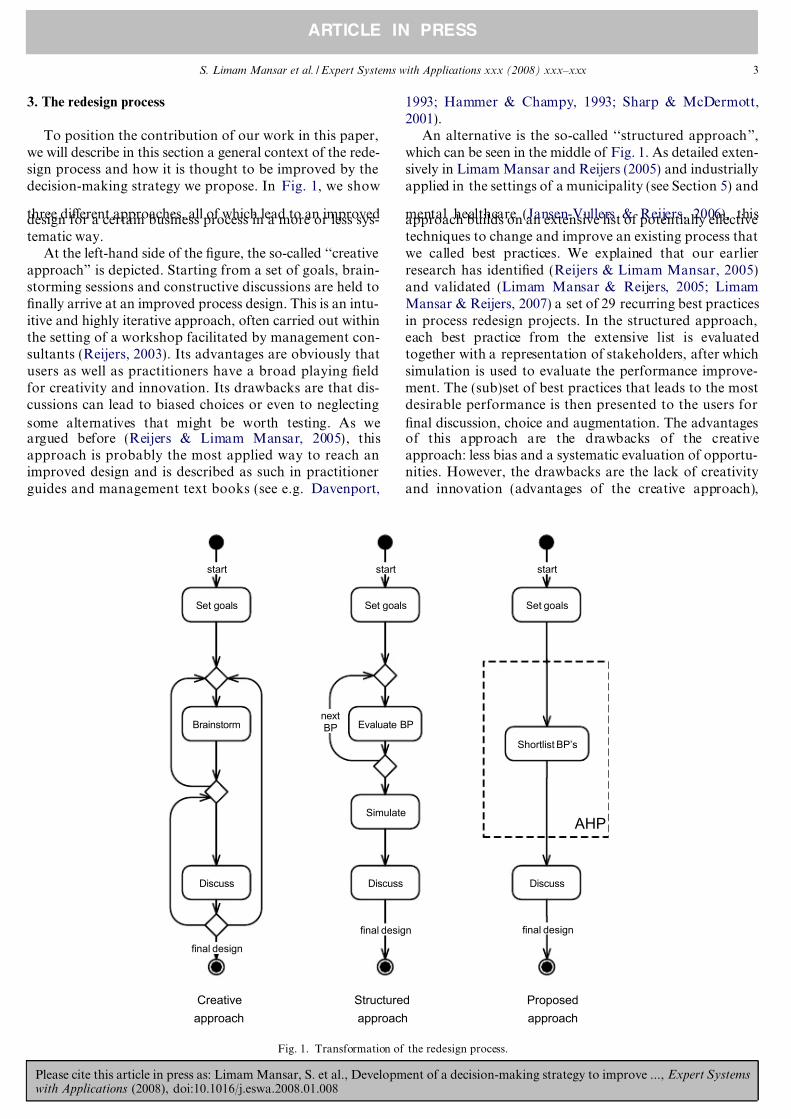
of integers between 1 and 9. In Table 1 we show the scalemeasurement we use for the preference statements in-linewith the AHP algorithm.
4.1. Exploring the ‘popularity’ criterion
We have explained in our introduction that in previousresearch, we have collected and discussed best practicesused by practitioners for BPR implementation. We gath-ered and classified these rules (cf. Reijers & Limam Man-sar, 2005), identifying a list of 29 widely used best
practices. For instance, one very popular rule is ‘task elim-ination’: It advocates the elimination of redundant orunnecessary tasks. In Limam Mansar and Reijers (2005)we have derived a list of top ten best practices in the field.We initially selected them because of their frequent use inthe literature review and case studies. The experts con-sulted for our survey further classified them into a ‘‘topten” list. We have restricted the classification of the bestpractices to ten only because the survey would have beencumbersome for the participants should they have to exam-ine 29 best practices. Table 2 displays the top ten best prac-tices followed by the remaining 19 best practices not beingclassified. For the purpose of this present study, we leave
Table 1Scale measurement for AHP (Saaty, 1980)
NumericalValues
Definition
1 Equally important3 Slightly more important5 Strongly more important7 Very strongly more important9 Extremely more important
Reciprocals Used to reflect dominance of the second alternative as
compared with the first.
4 S. Limam Mansar et al. / Expert Systems with Applications xxx (2008) xxx–xxx
ARTICLE IN PRESS
Please cite this article in press as: Limam Mansar, S. et al., Development of a decision-making strategy to improve ..., Expert Systemswith Applications (2008), doi:10.1016/j.eswa.2008.01.008

7/27/2019 AHP BPR
http://slidepdf.com/reader/full/ahp-bpr 5/15
out the external environment best practices (Interfacing,
Outsourcing, Trusted party) as we feel that there are toomany factors, typically outside the discrepancy of the rede-sign project itself, to take into account to determine theirapplicability in specific settings. Nevertheless, the latterbest practices may still be examined or used by the redesignteam if they deem it appropriate. We recall that our pro-posed approach includes discussions after applying thedecision-making process (refer to Section 3 and Fig. 1).This brings the number of best practices we do study to 26.
In order to prepare for our decision-making tool, weneed to quantify the popularity of a best practice. To doso, we differentiated the top ten best practices for whichwe do have a classification from the remaining 16 bestpractices. For the top ten group, the top four received avalue of 4, the three next popular best practices wereassigned a value of 3 and the last three popular best prac-tices a value of 2. The remaining 16 best practices were allallocated a value of 1. We do not have sufficient informa-tion to differentiate between them.
Note that despite the variability of the popularity crite-ria over time (while popular today, a best practice mightbecome unpopular in the future) we still believe that it isrelevant as another criteria ‘impact’, assesses the perfor-mance impact of the best practice on the redesigned processthus dissociating how a best practice is currently ‘‘per-
ceived” (popularity) and its real performance (impact).
4.2. Exploring the ‘component’ criterion
In earlier work (Reijers & Limam Mansar, 2005) weestablished a framework for BPR implementation. Theframework identifies eight components which need to beaddressed during a redesign implementation: the customer,
the information, the product, the operation view, thebehavior view, the organization, the technology and theexternal environment. For the same reasons for which wetook out the three best practices Interfacing, Outsourcingand Trusted party (refer to Section 4.1), we take out theexternal environment component as its impact is difficultto assess on parts of processes.
In Limam Mansar and Reijers (2005), we provided someindications to the relative importance of the different com-ponents of the framework. In other words, while redesign-ing a process which aspect should the redesigning teamsfocus on most? Is it the way the process deals with custom-ers? Or is it the way the information is processed or any
other component of our framework?To determine the importance of the various elements of
our framework we conducted a survey amongst experi-enced BPR practitioners in both the Netherlands and theUK. We asked the practitioners to indicate how often theyfocused on each framework component when undertakinga BPR project. Extensive details and discussion of thiswork can be found in Limam Mansar and Reijers (2005).Most importantly, the results showed that the customercomponent was the most frequently cited, followed equallyby the information and product components, then theoperation and behavior views components and finally the
organization and technology. For the purposes of this pres-ent study, we translated the latter classification into prefer-ences using the AHP scale. We use it to quantify therelative importance of the various components (cf. Table3). For example, the customers’ component becomes ‘extre-mely important’ in a redesign context (which is worth avalue of 9 on the AHP scale) since it was the most fre-quently cited.
In Limam Mansar, Reijers, and Ounnar (2006) we orga-nized the best practices according to the framework’s com-ponents. We can use this organisation to quantify therelationship between a best practice and a framework’scomponent. For example, we established in our earlierwork that the task elimination best practice impacts theoperation behavior of the process. In Table 3 the reader
Table 2Best practices in BPR
Best practice
1. Task elimination2. Task composition3. Integral technology4. Empower
5. Order assignment6. Resequencing7. Specialist-generalist8. Integration9. Parallelism
10. Numerical involvement – Control relocation – Contact reduction – Order types – Order-based work – Triage – Knock-out – Exception – Flexible assignment – Centralization
– Split responsibilities – Customer teams – Case manager – Extra resources – Control addition – Buffering – Task automation – Interfacing – Outsourcing – Trusted party
Table 3Assigning component indicator’s values
Components’ classification AHP scale Interpretation
1. Customer 9 Extremely important2. Information 7 Very important3. Product 7 Very important4. Operation view 5 Important5. Behavior view 5 Important6. Organization 3 Slightly important
7. Technology 3 Slightly important
S. Limam Mansar et al. / Expert Systems with Applications xxx (2008) xxx–xxx 5
ARTICLE IN PRESS
Please cite this article in press as: Limam Mansar, S. et al., Development of a decision-making strategy to improve ..., Expert Systemswith Applications (2008), doi:10.1016/j.eswa.2008.01.008
7/27/2019 AHP BPR
http://slidepdf.com/reader/full/ahp-bpr 6/15
may note that the latter is assessed as ‘important’ for theredesign and allocated a value of 5. The best practice ‘taskelimination’ is thus allocated the same value ‘5’.
4.3. Exploring the ‘Impact’ criterion
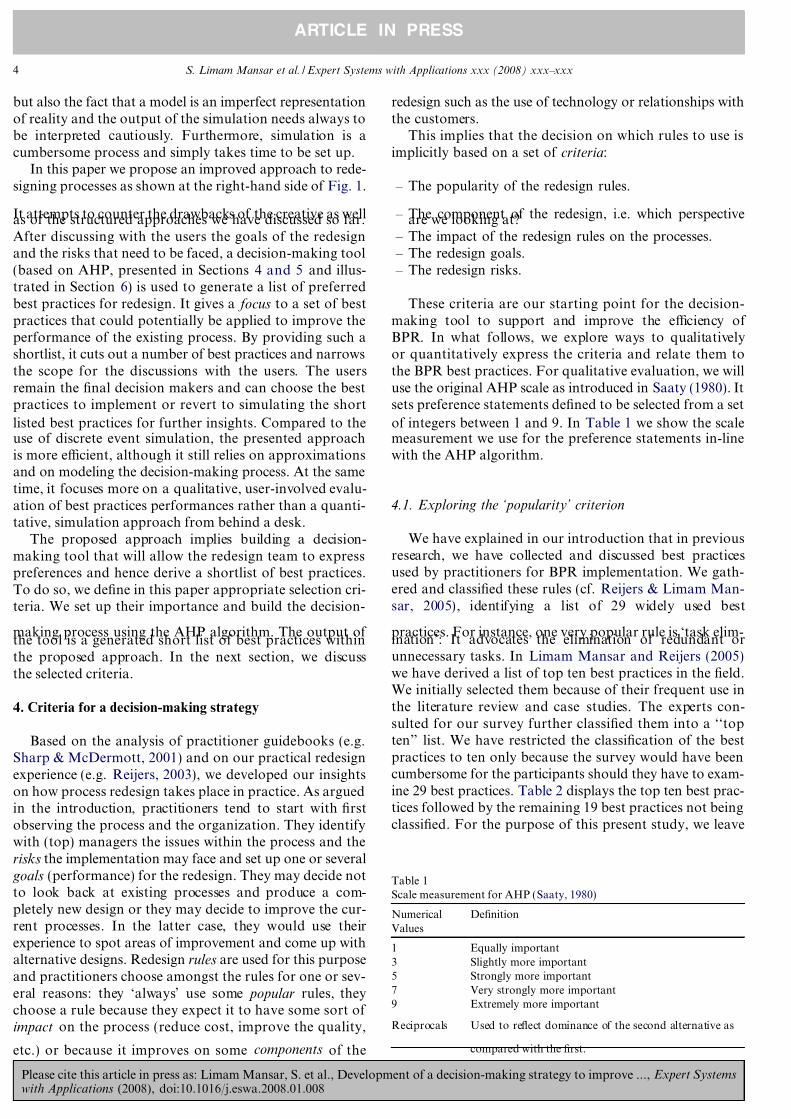
We introduced in Reijers (2003) the ‘devil’s quadrangle(cf. Fig. 2). We use it to graphically display the qualitativeimpact of a best practice on four different dimensions: qual-ity, time, cost and flexibility. This impact may be positive,resulting in a desirable improvement, neutral or negative,resulting in a less performing process. In Limam Mansarand Reijers (2007) the survey we conducted with practitio-ners in the Netherlands and the United Kingdom quanti-fied this impact. Practitioners were presented with ourtop ten best practices and asked to rank the impact of abest practice on a business process between 0 and 10. If lessthan five, this ranking meant a negative impact. If more
than five, this ranking meant a positive impact. We gath-ered and estimated the average rankings. Fig. 2 for exampledisplays the impact of the order assignment best practice.The grey diamond delimitates a neutral area (value 5).Within the area, a negative impact is expressed. Outsidethe area is the positive impact. It shows that improvementsare expected on all four dimensions when this rule isapplied. It can be noticed in Fig. 2 that we display the the-oretical result (literature review) as well as the surveyresult.
For the top ten best practices, we used the values of thesurvey results to quantify the impact of a best practice onquality, time, flexibility and cost. In this paper, we translatethe survey values into the AHP scale: for a negative impactwe use the values 1, 3 (1: highly significant decrease in per-formance; 3: significant decrease in performance), for noimpact we use the value 5 (neutral) and for a positive
impact we use the values 7, 9 (7: significant increase in per-formance, 9: highly significant increase in performance).
For example, for the order assignment best practice,based on its corresponding devil’s quadrangle (cf. Fig. 2)we assign the values 9 for the impact on time, 9 for itsimpact on quality, 7 for its impact on flexibility and 7 for
the cost impact. This translates into the order assignmentbest practice has a strong positive impact on the redesignedprocess’s quality and time and only a limited one on its costand flexibility.
For the remaining 16 best practices not tested by the sur-vey’s experts we used results from the literature review (dis-cussed in Reijers & Limam Mansar, 2005) as well as ourown experience to define appropriate values. At this stageof the research, we trust that these values are sensibleenough to provide a clear understanding of what the toolcan achieve. Future research may include a validation of the values with an additional survey.
So far, we exploited our previous research to come up
with three important criteria in the decision-making pro-cess of selecting best practices for a redesign: ‘component’,‘popularity’ and ‘impact’. The main results are
– There are a number of popular best practices that can beused for redesign: These are general, and context-inde-
pendent (manufacturing/service, small/large organiza-tion, etc.). To quantify the popularity of the bestpractices we emphasized the importance of a top ten listderived in Limam Mansar and Reijers (2005) andassigned the remaining best practices a lesser value toexpress that they may not be chosen by practitioners.
– There are a number of components to address during aBPR implementation: The different components arenot all equally vital for the redesign. In this paper, weused the AHP scale to quantify this difference and assignthem to best practices.
– We know the qualitative impact of each best practice(rule) on four different dimensions: quality, time, costand flexibility (positive/negative) and we explained inthis paper how we can quantify this impact using theAHP scale.
We now introduce and discuss two additional criteriawhich should be considered when choosing best practices:redesign projects’ goals and risks.
4.4. Exploring the ‘Goal’ criterion
Any redesign effort targets a need for improvement tosome specific areas. We studied earlier contributions thatidentify the goals usually targeted in redesign projects.According to (Guimaraes & Bond, 1996; Hammer &Champy, 1993; Malone, Crowston, Lee, & Pentland,1999), goals usually fall into the following categories:
– improve quality,
– reduce costs,
TimeCost
Quality
Flexibility
Order assignment: Survey result
0
Order assignment: Theoretical result
TimeCost
Quality
Flexibility
Order assignment: Survey result
5
510
Order assignment: Theoretical result
10
05
5
10
10
Fig. 2. Devil’s quadrangle for the Order assignment best practice.
6 S. Limam Mansar et al. / Expert Systems with Applications xxx (2008) xxx–xxx
ARTICLE IN PRESS
Please cite this article in press as: Limam Mansar, S. et al., Development of a decision-making strategy to improve ..., Expert Systemswith Applications (2008), doi:10.1016/j.eswa.2008.01.008
7/27/2019 AHP BPR
http://slidepdf.com/reader/full/ahp-bpr 7/15
– reduce service time or production time, – improve productivity, – increase revenue, – improve customer service, – use IT capabilities, – and improve competitiveness.
It remains the responsibility of the redesign team to dis-cuss the relative importance of the goals for their project.To do so, the redesign team will need to use the AHP scale(refer to Table 1).
Our role is only to assess how each best practice can sup-port each goal (or not). To do so we used the AHP scale toquantify goals related to best practices. If we continue onthe example of the task elimination and examine the goal‘use IT capabilities’ then one may argue that applying thisbest practice (eliminating tasks) would neither help norobstruct this goal (use IT capabilities) from being achieved.We could then give it a neutral value of 5. At this stage of
the research, we derived the different values informally,using our best judgment and experience. Future researchmay look into the impact of varying such values on thefinal result.
4.5. Exploring the ‘Risk’ criterion
Before starting the redesign, practitioners identify thefactors that will challenge the redesign of the process. Somebest practices might then become inappropriate becausethey would increase the identified risk. Research indicates,
for example, that for BPR projects, top management com-mitment and managerial support are the most importantfactors. Throughout the literature review, the followingrisk factors are often considered (Al-Mashari et al., 2001;Crowe, Fong, Bauman, & Zayas-Castro, 2002; Guimaraes& Bond, 1996):
– limited implementation time (Davidson, 1993; Grover,Jeong, Kettinger, & Teng, 1995),
– poor information system architecture (Davenport, 1993;Davidson, 1993; Grover et al., 1995),
– limited funds (Bashein, Markus, & Riley, 1994; Daven-port, 1993),
– lack of managerial support (Alter, 1990; Davenport &Short, 1990; Grover et al., 1995),
– lack of top management commitment (Alter, 1990; Dav-enport & Short, 1990; Grover et al., 1995),
– employee resistance (Grover et al., 1995).
As for the ‘goal’ criteria, it remains up to the redesignteam to discuss the relative importance of the risks for theirproject. For example, does the redesign team consider thatthe redesign might be put at risk because they expect astrong resistance from the current employees? And howimportant is this risk versus a perceived lack of top man-
agement commitment? To express the latter, the redesign
team will need to use the AHP scale (refer to Table 1)assigning relative preferences for risks.
Our role here is only to assess how each best practice canincrease or decrease each risk. We use the AHP scale to doso in the same way that we did with the goal criterion. If wecontinue on the example of the task elimination and look at
the risk ‘employee resistance’, then one may argue thatapplying this best practice would increase this risk as elim-inating tasks may reduce some employees’ responsibilitiesand this might be perceived as a threat. We could then giveit a value of 3 to emphasize a negative impact.
As was explained for the goal criterion, at this stage of the research, we derived the different values informally,using our best judgment and experience.
To summarize this section, deciding which best practiceto apply is a complex process that involves looking at sev-eral criteria: the component the best practice belongs to, thebest practice’s popularity, its impact on a redesigned pro-cess, the initial redesign goal and the identified risks. We
explored ways to quantify each criterion and link it to bestpractices. In what follows, we investigate the usefulness of a multicriteria decision-making method for the choice of best practices and describe it hereafter.
5. Using AHP as a multicriteria method
Classifying the best practices is based on a set of quali-tative and quantitative criteria (cost, time, etc.), we thus usea multicriteria method. Our choice for a particular multi-criteria method is mainly based on earlier work and expe-rience (Ounnar et al., 1999; Mekaouche, 2007). We can
distinguish three classes of multicriteria methods: multicri-teria decision aid methods, elementary methods and opti-mization mathematical methods. The choice of one of thethree classes methods depends either on the set of data,or on the way in which the decision maker models prefer-ences. The multicriteria decision aid methods support thedecision maker refining his decision-making process tochoose an action among a set of potential actions, or toclassify a set of actions by examining the logic and thecoherence of its preferences. These methods are based onthe aggregation of the preferences. This aggregation canbe done according to three approaches: Complete, Partialor Local Aggregation.
In order to classify the set of best practices, completeaggregation was exploited. There are several methods thatdeal with complete aggregation: the Technique for OrderPreference by Similarity to Ideal Solution (TOPSIS), theMultiple Attribute Value Theory (MAVT), the MultipleAttribute Utility Theory (MAUT), the Simple Multiple-Attribute Rating Technique (SMART), the Utility TheoryAdditive (UTA), the EVAluation of MIXed criteria (EVA-MIX) and the Analytic Hierarchy Process (AHP).
Unlike the other quoted multicriteria decision aid meth-ods, the AHP method is the only one that allows on the onehand, the measure of the coherence of the decision maker
preferences and on the other hand, taking into account at
S. Limam Mansar et al. / Expert Systems with Applications xxx (2008) xxx–xxx 7
ARTICLE IN PRESS
Please cite this article in press as: Limam Mansar, S. et al., Development of a decision-making strategy to improve ..., Expert Systemswith Applications (2008), doi:10.1016/j.eswa.2008.01.008
7/27/2019 AHP BPR
http://slidepdf.com/reader/full/ahp-bpr 8/15
the same time the independence and the interdependence of the considered criteria. Moreover the AHP method allowsto take into account qualitative and quantitative criteria.
The Analytic Hierarchy Process (AHP) is a methoddeveloped by Saaty (Saaty, 1980) for complex multicriteriaproblems for which quantitative and qualitative aspects
could be taken into account. AHP is widely used to classifyalternatives based on a range of criteria. It is a moredescriptive and less normative analytic approach than theexisting alternatives. In Ounnar, Pujo, Mekaouche, andGiambiasi (2007) an application is given for the supplierevaluation problem. A more detailed description of theAHP decision mechanism is provided in Ounnar and Pujo(2005). The AHP process is performed in four phases:
– Phase 1: Building a hierarchical process for the decisionproblem.
– Phases 2 and 3: Pair-wise comparison of each built hier-archical level’s elements and Relative weight appraisal
between the elements of each two adjacent levels whichdevelops priorities for the alternatives.
– Phase 4: Relative weights aggregation of the differenthierarchical levels to provide alternatives’ classificationof the decision.
In what follows, it is explained how the AHP methodevolves in the setting of our paper.
5.1. Phase 1: building a hierarchical process for the decision’s
problem
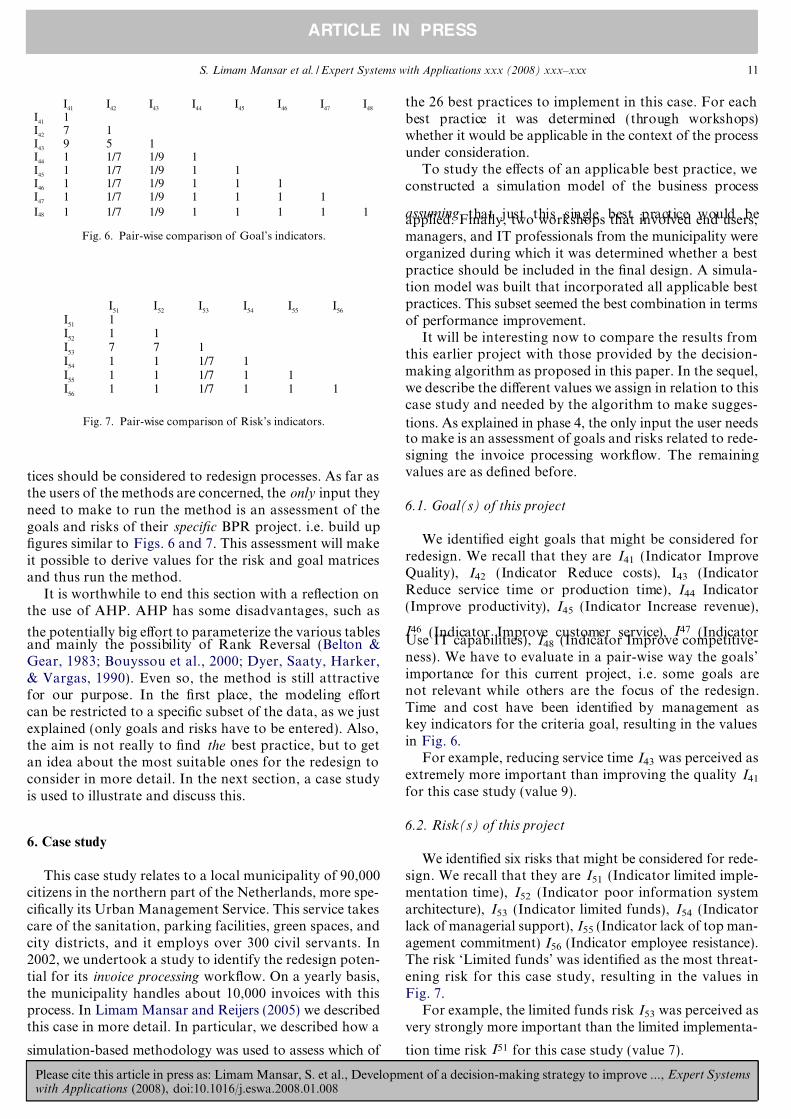
As stated, the AHP method helps the decision makers tostructure the significant components of a problem in a hier-archical structure. This is based on the assumption that theidentified entities can be grouped into disjoint sets. The ele-ments in each group (also called level) of the hierarchy areassumed to be independent. The hierarchy of the decision-making process is defined by a quadruplet hL1, L2, L3, L4i(cf. Fig. 3) where
– Level 1 (L1) = Global Objective. – Level 2 (L2) = Criteria Level. – Level 3 (L3) = Indicators Level. – Level 4 (L4) = Alternatives Level.
This is a key phase as it determines the purpose of thedecision-making process. In Fig. 3 we graphically displaythe hierarchical process. As explained in Section 3, ourobjective is to find appropriate best practices for BPR pro- jects. This defines the global objective (L1). In other words,AHP will classify the set of best practices according to abest compromise between all the criteria we consider asimportant for the redesign process.
Practitioners base their decisions on a set of five criteria(refer to Section 4): component, popularity, impact, goaland risk. This defines the second level of the AHP method
(L2). We also explained that some criteria involve many
indicators. For example, the criteria impact needs to fur-ther be broken down into impact on Time (T ), Quality(Q), Flexibility (F ) and Cost (C ). These define the thirdlevel of the AHP method (L3). Finally, the level 4 (L4) of the method represents the alternatives to be classified – here being the 26 best practices.
After completing this phase, the results are synthesizedby decomposing complex decisions into a series of simplecomparisons and arrangements (cf. Fig. 3).
The following notations are used Ci = Criterion i
(i = 1:4); Iik = Indicator k of Ci (k = 1 for i = 1:2,k = 1:4 for i = 3, k = 1:8 for i = 4, k = 1:6 for i = 4);Aj = Alternative j [practices N ° j ( j = 1:26)].
5.2. Phases 2 and 3: pair-wise comparison of each built
hierarchical level’s elements and relative weight appraisal
between the elements of each two adjacent levels
5.2.1. Evaluation of the relative importance of the criteria to
the global objectiveWe assess the importance of criteria against each other
(pair-wise comparison). That means quantifying what isperceived as really important when choosing a best practicefor the redesign. Note that this assessment is independent of the project under study and is explained here for the sakeof clarity. It is incorporated in our AHP algorithm but hid-den from the users. We summarized the assessment inFig. 4. In this figure, for example, ‘Popularity’ is indicatedas strongly more important than ‘Component’ (value 5)and ‘Impact’ is indicated as strongly more important thanRisk (1/5).
In order to describe the remainder of the method, let usnote that AHP is based on determining a classification forthe alternatives. The central ‘ingredient’ of the AHPmethod is comparisons. The pair-wise comparison evalu-ates the relative importance of two elements for the deci-sion maker. It contributes to the achievement of theadjacent higher level’s objective. The classification by pri-ority of the elements of the hierarchy level contributingto reaching an objective of the adjacent higher level iscalled ‘relative weight’ or ‘order of priority’. The AHPmethod scale of value is used (Saaty, 1980). It definesnumerical values (1–9) corresponding to the importanceof a factor against another factor. Note that it is used herefor comparing qualitative data (refer to Table 1).
5.2.2. Evaluation of the relative importance of the indicators
to the criteria
We assess for each criterion the importance of the indi-cators against each other (pair-wise comparison). Thatmeans quantifying which indicators are really importantwhen it comes down to the level of each criterion sepa-rately. There are five criteria: component, popularity,impact, goal and risk. Component and popularity criteriaare described by one indicator only and thus do not needany assessment in this phase. The goal and the risk crite-
rion are closely dependent on the process to be redesigned.
8 S. Limam Mansar et al. / Expert Systems with Applications xxx (2008) xxx–xxx
ARTICLE IN PRESS
Please cite this article in press as: Limam Mansar, S. et al., Development of a decision-making strategy to improve ..., Expert Systemswith Applications (2008), doi:10.1016/j.eswa.2008.01.008

7/27/2019 AHP BPR
http://slidepdf.com/reader/full/ahp-bpr 9/15
It is thus not possible to assess them in this phase. In thenext section, we will evaluate and illustrate the importanceof the goals and risks for a case study. The only criterionthat is left to be assessed is the impact criterion. Table 1is used as an assessment scale (1–9) as required by theAHP method and results are described in Fig. 5.
In this figure, for example, ‘Time’ is indicated asstrongly more important than ‘Quality’ (value 1/5). The
values were determined by the authors based on their judg-ment and experience.
5.2.3. Evaluation of the relative importance of the
alternatives to the indicators of each criterion
We assess for each alternative (best practice) the appro-priate values for the different indicators. The good news isthat this assessment is totally independent from the specificBPR project under consideration. The values are presentedin Table 4 and will not have to be changed by the users of the method. They are incorporated in the AHP algorithmbut completely hidden from the user of the method. They
are displayed here for the sake of completeness only. In
the sequel we describe how the values in Table 4 areassessed for the best practices.
5.2.3.1. Popularity. Let us recall that in Section 4.1 wedefined the popularity as values that reflect the best prac-tice’s frequent use by practitioners. We explained in Section4.1 that we quantify the evaluation of this criterion (popu-
larity) in the following way: we assign a high value of 4 tothe four first most popular best practices, a value of 3 to thenext three popular best practices, a value of 2 to the nextthree best practices and a neutral value of 1 to all the otherbest practices. This assignment was based on the results of the survey we conducted. Table 4 displays the values for allbest practices: consider the column ‘popularity’.
5.2.3.2. Components. In Section 4.2 we explored how the‘components’ criterion can be quantified. It was a resultof the survey we conducted before. Let us recall the exam-ple: the task elimination best practice impacts the ‘opera-
tion behavior’ of the process. In Table 3 the reader may
Component Popularity Impact Goal riskComponent 1Popularity 5 1
Impact 5 1 1Goal 9 7 7 1
Risk 3 1 1/5 1/9 1
Fig. 4. Pair-wise comparison of the criteria. 1551)(I13 / 17 / 1)(I
15 / 1)(I
1)(I
)(I)(I)(I)(I
34
33
32
31
34333231
C F
Q
T
C F QT
Fig. 5. Pair-wise comparison of Impact’s indicators.
I11
: C/F
Component’s
importance
related to the
framework
I22
: Popularityvalue
I31
: T
GOALCOMPONENT POPULARITY IMPACT
Evaluation of
component’s importance Evaluation of BP’s
qualitative impact
Evaluation of BPs
relationship to BPR goal
Level 1:
Global Objective
Criteria
Indicators
AlternativesEvaluated using
LikertScale
Evaluation of
BP’s popularity
Classified from most
popular to least
popular for the top tenbest practices; neutral
for the remaining
ones
I33
: F I34
: CI32
: Q
Evaluated using Likert Scale
RISK
Evaluation of BP’s impact
on project risk
Best practice’s relevance for the BPR implementation project
Level 2:
Level 3:
Level 4:
Time Quality Flexibil ity Cost I41 (Indicator Improve Quality)
I42 (Indicator Reduce costs)
I43 (Indicator Reduce service time or
production time)
I44 Indicator (Improve productivity)
I45 (Indicator Increase revenue)
I46 (Indicator Improve customer
service)
I47 (Indicator Use IT capabilities)
I48 (Indicator Improve
competitiveness)
I41
I42
I43
I44
I45
I46
I47
I48
I51
Indicator limited implementation time
I52
Indicator poor information system architecture
I53
Indicator limited funds
I54
Indicator lack of managerial support
I55
Indicator lack of top management commitment
I56
Indicator employee resistance
I51
I52
I53
I54
I55
I56
Evaluated using Likert Scale valuated using Likert Scale
Set of best practices
I11
: C/F
Component’s
importance
related to the
framework
I22
: Popularityvalue
I31
: T
GOALCOMPONENT POPULARITY IMPACT
Evaluation of
component’s importance Evaluation of BP’s
qualitative impact
Evaluation of BPs
relationship to BPR goal
Level 1:
Global Ob jective
Criteria
Indicators
AlternativesEvaluated using
LikertScale
Evaluation of
BP’s popularity
Classified from most
popular to least
popular for the top tenbest practices; neutral
for the remaining
ones
I33
: F I34
: CI32
: Q
Evaluated using Likert Scale
RISK
Evaluation of BP’s impact
on project risk
Best practice’s relevance for the BPR implementation project
Level 2:
Level 3:
Level 4:
Time Quality Flexibil ity Cost I41 (Indicator Improve Quality)
I42 (Indicator Reduce costs)
I43 (Indicator Reduce service time or
production time)
I44 Indicator (Improve productivity)
I45 (Indicator Increase revenue)
I46 (Indicator Improve customer
service)
I47 (Indicator Use IT capabilities)
I48 (Indicator Improve
competitiveness)
I41
I42
I43
I44
I45
I46
I47
I48
I51
Indicator limited implementation time
I52
Indicator poor information system architecture
I53
Indicator limited funds
I54
Indicator lack of managerial support
I55
Indicator lack of top management commitment
I56
Indicator employee resistance
I51
I52
I53
I54
I55
I56
Evaluated using Likert Scal valuated using Likert Scale
Set of best practices
Fig. 3. Hierarchical classification for best practices evaluation.
S. Limam Mansar et al. / Expert Systems with Applications xxx (2008) xxx–xxx 9
ARTICLE IN PRESS
Please cite this article in press as: Limam Mansar, S. et al., Development of a decision-making strategy to improve ..., Expert Systemswith Applications (2008), doi:10.1016/j.eswa.2008.01.008

7/27/2019 AHP BPR
http://slidepdf.com/reader/full/ahp-bpr 10/15
note that the latter component of our framework isassessed as important for the redesign and allocated a valueof 5. The best practice ‘task elimination’ is thus allocated
the same value ‘5’.Here is another example: Table 3 shows that the cus-
tomer component is extremely important. The ‘‘integra-tion” best practice has been identified as a customer bestpractice and will thus be assigned a value of 9 to reflectthe importance of this component. (For both examples,‘integration’ and ‘task elimination’, refer to Table 4 andlook at the column ‘Component’ and rows ‘integration’and ‘task elimination’).
5.2.3.3. Impact. Let us recall that in Section 4.3 weexplained that the Impact values are derived from the dev-
il’s quadrangles for each best practice which was defined onthe basis of the survey that we conducted. The values arereflected in Table 4. Look at the example of task elimina-tion: based on its corresponding devil’s quadrangle theimpact values are as follows: I 31 (T) = 9; I 32 (Q) = 7; I 33(F) = 5 and I 34 (C) = 9. This translates into: the task elim-ination best practice has a strong positive impact on theredesigned process’s cost and time, only a limited one onits quality and is neutral in terms of flexibility.
5.2.3.4. Goal. We explained in Section 4.4 that the relation-ship between the goal’s indicators values and the best prac-
tices has been valued by ourselves. The AHP scale was used
in the same way as it was used for the impact and risk cri-teria. Refer to Table 4.
5.2.3.5. Risk. We explained in Section 4.5 that the relation-ship between the risk’s indicators values and the best prac-tices was determined using our discretion. The AHP scalewas used in the same way as it was used for the impact cri-terion. Please refer to Table 4.
We aim to establish a classification of the alternatives(best practices) with respect to the indicators of each crite-rion. To do so it is necessary to compare, for each I i ,k indi-cator of the L3 level belonging to the I i set, the I i ,k , j valuesbetween the Best Practices BP j of the set of the consideredbest practices.
5.3. Phase 4: relative weights aggregation of the different
hierarchical levels to provide alternatives’ classification of the
decision
Having carried out the pair-wise comparison, AHP cal-culates a vector of priority that classifies the alternatives inan ascending or descending order. In this fourth phase thedifferent criteria, indicators, alternatives and their associ-ated values derived in the previous phases are entered intothe AHP algorithm to derive a classification of the alterna-tives (i.e. a classification of the most suitable best practicesto use to redesign the studied process).
To summarize, Fig. 3 describes the criteria and the indi-
cators that are important when deciding which best prac-
Table 4Indicator’s values for selected best practices
Best practice Component Popularity Impact Goal Risk
C/F T Q F C I 41 I 42 I 43 I 44 I 45 I 46 I 47 I 48 I 51 I 52 I 53 I 54 I 55 I 56
Task elimination 5 4 9 7 5 9 7 9 9 9 5 5 5 5 7 5 5 5 5 3Task composition 5 4 9 7 7 7 7 7 9 9 5 5 5 5 5 5 5 5 5 3
Integral technology 3 4 9 9 9 9 9 9 9 9 7 9 9 7 1 1 3 5 5 3Empower 3 4 9 7 9 7 7 7 9 7 5 5 5 5 3 5 7 5 5 9Order assignment 3 3 9 9 7 7 9 7 9 9 5 9 5 7 5 5 5 5 5 3Resequencing 5 3 9 9 5 7 9 7 9 5 5 5 5 5 5 5 5 5 5 3Specialist-generalist 3 3 9 9 9 9 9 9 9 7 7 5 5 5 1 5 3 5 5 1Integration 9 2 9 9 7 7 9 7 9 7 7 9 5 7 1 1 5 5 5 5Parallelism 5 2 9 5 5 7 5 7 9 9 7 5 7 5 3 5 5 5 5 5Numerical involvement 3 2 9 7 7 7 7 7 9 7 7 5 5 5 3 5 7 5 5 3Control relocation 9 1 5 9 5 3 9 3 5 5 5 9 5 7 5 5 7 3 3 3Contact reduction 9 1 7 7 5 3 7 3 7 5 5 1 5 3 5 5 1 3 5 7Order types 5 1 7 3 5 9 3 9 7 9 5 5 5 5 5 5 1 7 5 1Order-based work 5 1 9 5 5 1 5 1 9 9 5 7 5 5 5 1 1 5 5 1Triage 5 1 7 9 3 7 9 7 7 5 5 5 5 5 5 5 1 7 5 1Knock-out 5 1 3 5 5 9 5 9 3 3 5 5 5 5 5 5 1 5 5 1Exception 5 1 7 9 3 5 9 5 7 9 5 5 5 5 5 3 1 5 5 1
Flexible assignment 3 1 7 7 5 5 7 5 7 5 5 5 5 5 3 5 9 9 5 9Centralization 3 1 9 5 9 5 5 5 9 9 5 5 7 5 5 1 1 1 1 5Split responsibilities 3 1 7 7 3 5 7 5 7 3 5 5 5 5 7 3 1 1 1 1Customer teams 3 1 3 7 3 5 7 5 3 7 5 9 5 7 3 3 5 5 5 5Case manager 3 1 5 9 5 1 9 1 5 9 5 9 5 7 5 5 5 5 5 7Extra resources 3 1 9 5 7 3 5 3 9 9 5 9 5 7 1 5 1 1 1 9Control addition 3 1 3 9 5 9 9 9 3 3 7 9 5 7 1 5 1 7 5 1Buffering 7 1 9 5 5 3 5 3 9 7 5 5 5 5 5 5 7 5 5 7Task automation 3 1 7 7 3 3 7 3 7 9 9 5 9 5 1 9 1 3 5 3
10 S. Limam Mansar et al. / Expert Systems with Applications xxx (2008) xxx–xxx
ARTICLE IN PRESS
Please cite this article in press as: Limam Mansar, S. et al., Development of a decision-making strategy to improve ..., Expert Systemswith Applications (2008), doi:10.1016/j.eswa.2008.01.008
7/27/2019 AHP BPR
http://slidepdf.com/reader/full/ahp-bpr 11/15
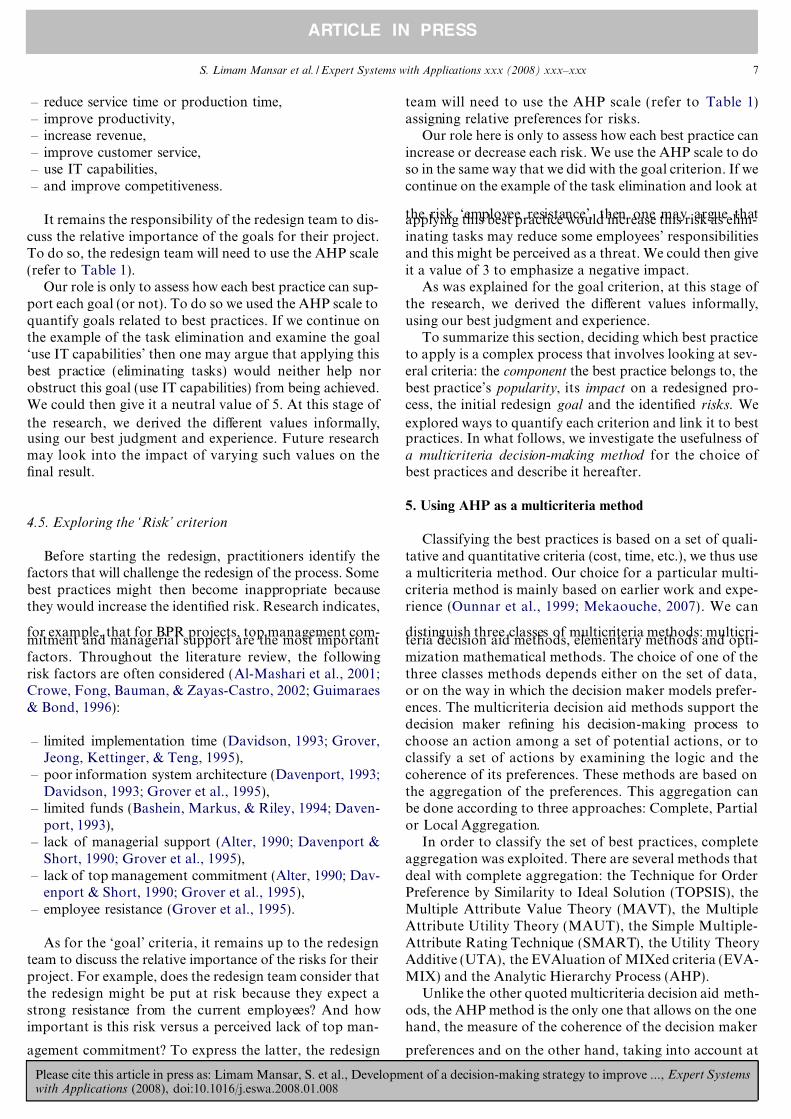
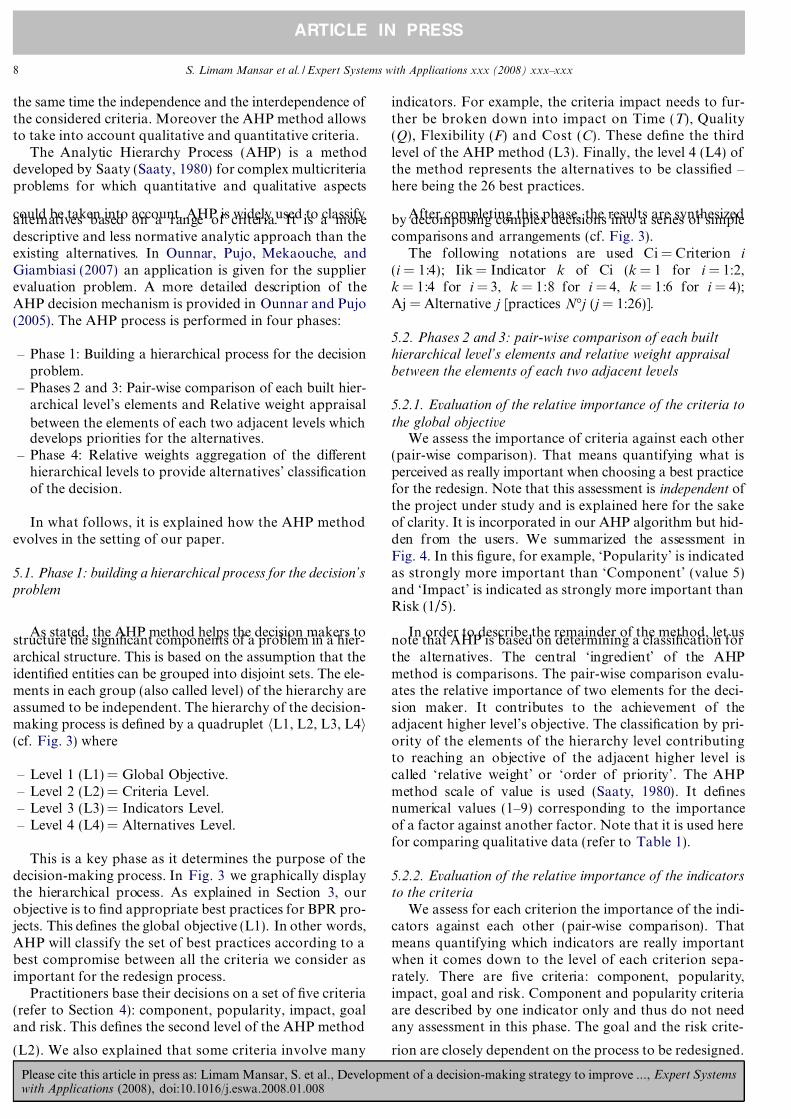
tices should be considered to redesign processes. As far asthe users of the methods are concerned, the only input theyneed to make to run the method is an assessment of thegoals and risks of their specific BPR project. i.e. build upfigures similar to Figs. 6 and 7. This assessment will makeit possible to derive values for the risk and goal matricesand thus run the method.
It is worthwhile to end this section with a reflection onthe use of AHP. AHP has some disadvantages, such as
the potentially big effort to parameterize the various tablesand mainly the possibility of Rank Reversal (Belton &Gear, 1983; Bouyssou et al., 2000; Dyer, Saaty, Harker,& Vargas, 1990). Even so, the method is still attractivefor our purpose. In the first place, the modeling effortcan be restricted to a specific subset of the data, as we justexplained (only goals and risks have to be entered). Also,the aim is not really to find the best practice, but to getan idea about the most suitable ones for the redesign toconsider in more detail. In the next section, a case studyis used to illustrate and discuss this.
6. Case study
This case study relates to a local municipality of 90,000citizens in the northern part of the Netherlands, more spe-cifically its Urban Management Service. This service takescare of the sanitation, parking facilities, green spaces, andcity districts, and it employs over 300 civil servants. In2002, we undertook a study to identify the redesign poten-tial for its invoice processing workflow. On a yearly basis,the municipality handles about 10,000 invoices with thisprocess. In Limam Mansar and Reijers (2005) we describedthis case in more detail. In particular, we described how a
simulation-based methodology was used to assess which of
the 26 best practices to implement in this case. For eachbest practice it was determined (through workshops)whether it would be applicable in the context of the processunder consideration.
To study the effects of an applicable best practice, weconstructed a simulation model of the business process
assuming that just this single best practice would beapplied. Finally, two workshops that involved end users,managers, and IT professionals from the municipality wereorganized during which it was determined whether a bestpractice should be included in the final design. A simula-tion model was built that incorporated all applicable bestpractices. This subset seemed the best combination in termsof performance improvement.
It will be interesting now to compare the results fromthis earlier project with those provided by the decision-making algorithm as proposed in this paper. In the sequel,we describe the different values we assign in relation to thiscase study and needed by the algorithm to make sugges-
tions. As explained in phase 4, the only input the user needsto make is an assessment of goals and risks related to rede-signing the invoice processing workflow. The remainingvalues are as defined before.
6.1. Goal(s) of this project
We identified eight goals that might be considered forredesign. We recall that they are I 41 (Indicator ImproveQuality), I 42 (Indicator Reduce costs), I43 (IndicatorReduce service time or production time), I 44 Indicator(Improve productivity), I 45 (Indicator Increase revenue),
I 46 (Indicator Improve customer service), I 47 (IndicatorUse IT capabilities), I 48 (Indicator Improve competitive-ness). We have to evaluate in a pair-wise way the goals’importance for this current project, i.e. some goals arenot relevant while others are the focus of the redesign.Time and cost have been identified by management askey indicators for the criteria goal, resulting in the valuesin Fig. 6.
For example, reducing service time I 43 was perceived asextremely more important than improving the quality I 41for this case study (value 9).
6.2. Risk(s) of this project
We identified six risks that might be considered for rede-sign. We recall that they are I 51 (Indicator limited imple-mentation time), I 52 (Indicator poor information systemarchitecture), I 53 (Indicator limited funds), I 54 (Indicatorlack of managerial support), I 55 (Indicator lack of top man-agement commitment) I 56 (Indicator employee resistance).The risk ‘Limited funds’ was identified as the most threat-ening risk for this case study, resulting in the values inFig. 7.
For example, the limited funds risk I 53 was perceived asvery strongly more important than the limited implementa-
tion time risk I 51 for this case study (value 7).
I51
I52
I53
I54
I55
I56
I51
1
I52
1 1
I53
7 7 1
I54
1 1 1/7 1
I55
1 1 1/7 1 1
I56
1 1 1/7 1 1 1
Fig. 7. Pair-wise comparison of Risk’s indicators.
I41
I42
I43
I44
I45
I46
I47
I48
I41
1
I42
7 1
I43
9 5 1
I44
1 1/7 1/9 1
I45
1 1/7 1/9 1 1
I46
1 1/7 1/9 1 1 1
I47
1 1/7 1/9 1 1 1 1
I48 1 1/7 1/9 1 1 1 1 1
Fig. 6. Pair-wise comparison of Goal’s indicators.
S. Limam Mansar et al. / Expert Systems with Applications xxx (2008) xxx–xxx 11
ARTICLE IN PRESS
Please cite this article in press as: Limam Mansar, S. et al., Development of a decision-making strategy to improve ..., Expert Systemswith Applications (2008), doi:10.1016/j.eswa.2008.01.008

7/27/2019 AHP BPR
http://slidepdf.com/reader/full/ahp-bpr 12/15
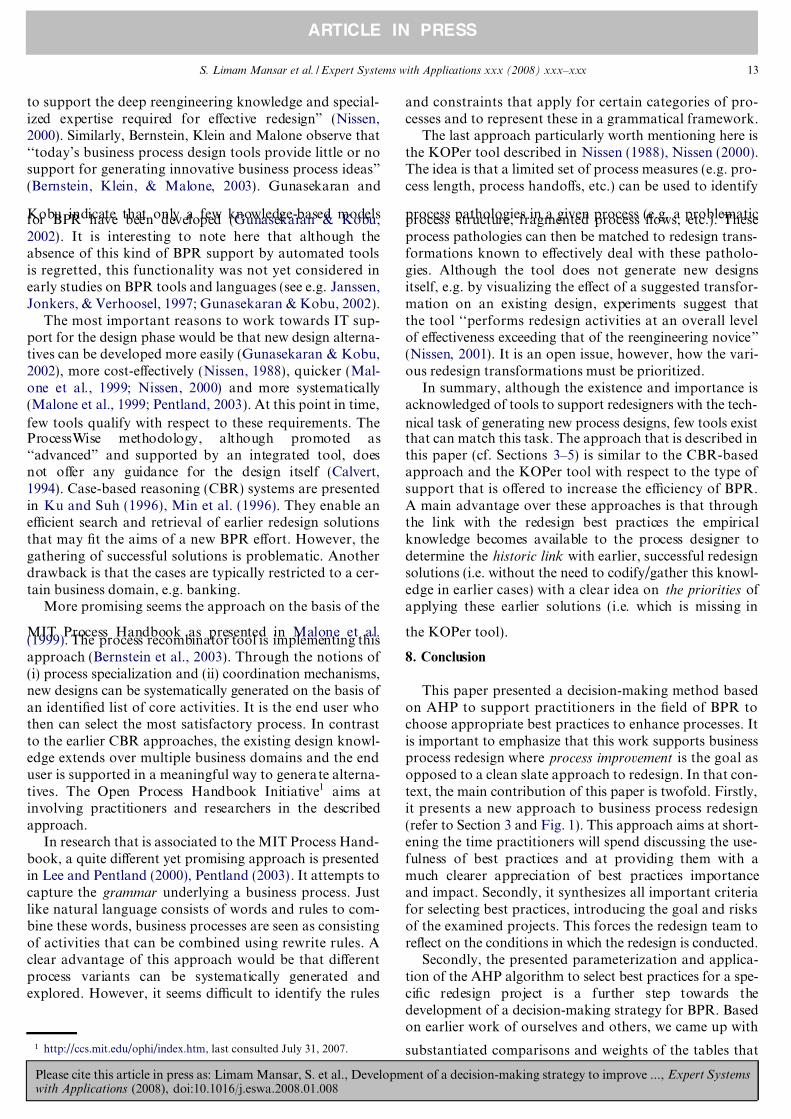
6.3. Results
The application of the AHP algorithm delivered a rank-ing of best practices as shown in Table 5. It advises theimplementation of the (1) integral technology, (2) taskelimination, (3) task composition, (4) specialist-generalist,(5) order assignment and (6) empower, as the six firstchoices. The best practices that were finally integrated inthe redesigned process (out of simulation and workshops’discussions) were (1) integral technology, (2) task elimina-tion, (3) task composition, (4) specialist-generalist, (5) rese-quencing and (6) numerical involvement (Limam Mansar& Reijers, 2005). Note that both methods came up withfour similar best practices out of sets of six. An explanationfor the differences could be that the simulation did not takeall the components of level 2 into account, such as e.g. therisk and goal factors. Another explanation is that themethod we present was not confronted with the users
whose input might have changed the final choices made.Nonetheless, it seems highly conceivable to us that theapplication of our method could have led the redesign teamto come up with a redesign based on very similar ingredi-ents without the use of simulation, as was actually the case.
7. Related work
In their seminal work (Hammer & Champy, 1993),Hammer and Champy identified IT as a key enabler forredesigning business processes. This new role of IT ‘‘repre-sents a fundamental departure from conventional wisdom
on the way an enterprise or business process is viewed,
examined, and organized” (Irani, Hlupic, & Giaglis,2000) and triggered many articles on the role of IT in thecontext of BPR. However, as pointed out in Gunasekaranand Kobu (2002), most of the studies deal with conceptualframeworks and strategies – not with modeling and analy-sis of business processes with the objective of improving the
performance of reengineering efforts.The use of IT to actually support a redesign effort cantake on various forms and a variety of tools are availablein the market place. Kettinger, Teng and Guha compileda list of 102 different tools to support redesign projects(Kettinger, Teng, & Guha, 1997). Building on this study,Al-Mashari, Irani and Zairi classified BPR-related toolsand techniques in 11 major groups (Al-Mashari et al.,2001). These groups cover activities such as project man-agement, process modeling, problem diagnosis, businessplanning, and process prototyping. Gunasekaran andKobu reviewed the literature from 1993–2000 and cameto the following classification of modeling tools and tech-
niques for BPR: (i) conceptual models, (ii) simulation mod-els, (iii) object-oriented models, (iv) IDEF models, (v)network models, and (vi) knowledge-based models (Gun-asekaran & Kobu, 2002). More recently, Attaran linkedthe various available tools to three different phases in aBPR program: before a process is designed, while the pro-cess is being designed, and after the design is complete(Attaran, 2004). In these phases, a tool can respectivelyact as a facilitator (e.g. as an inspiration for a new strategicvision), as an enabler (e.g. for mapping the process, gather-ing performance data, and simulation), and as an imple-menter (e.g. for project planning and evaluation). Using
the classifications of these authors, our interest in thispaper lies with the role of IT as an enabler during thedesign phase.
Considering the state of the art on tools for processredesign, Cypress found the existing first-generation com-puter-based tools of the early 90s inadequate for processdesign (Cypress, 2004). The more recent analysis by Kettin-ger et al. found few tools for conducting front-end BPRactivities such as process planning, competitive analysis,and creative thinking (Kettinger et al., 1997). Only tech-niques – in contrast to tools – are mentioned as suitablefor actual redesign, such as brainstorming, nominal grouptechniques, and ‘‘visioning”. More recently, Irani et al.commented on the continuous releases of new tools forprocess modeling, which, however, are unable to conductwhat-if analyses or show the dynamic change of businessprocesses (Irani et al., 2000). Although simulation toolscan meet these requirements, Al-Mashari et al. found intheir survey that of all available categories of BPR tools‘‘organizations made least use of prototyping and simula-tion techniques” (Al-Mashari et al., 2001). The authorsconjecture that this is due to the complexity frequentlyassociated with them and the conditions that need to bemet to ensure feasible use of such techniques.
Nissen states that despite the plethora of tools for mod-
eling and simulation of business processes, ‘‘such tools fail
Table 5Best practices classified by AHP for our case study
3 Integral technology1 Task elimination2 Task composition7 Specialist-generalist5 Order assignment
4 Empower8 Integration6 Resequencing10 Numerical involvement9 Parallelism13 Order types25 Buffering19 Centralization18 Flexible assignment23 Extra resources17 Exception15 Triage24 Control addition20 Split responsibilities26 Task automation
11 Control relocation14 Order-based work16 Knock-out12 Contact reduction21 Customer teams22 Case manager
12 S. Limam Mansar et al. / Expert Systems with Applications xxx (2008) xxx–xxx
ARTICLE IN PRESS
Please cite this article in press as: Limam Mansar, S. et al., Development of a decision-making strategy to improve ..., Expert Systemswith Applications (2008), doi:10.1016/j.eswa.2008.01.008
7/27/2019 AHP BPR
http://slidepdf.com/reader/full/ahp-bpr 13/15
to support the deep reengineering knowledge and special-ized expertise required for effective redesign” (Nissen,2000). Similarly, Bernstein, Klein and Malone observe that‘‘today’s business process design tools provide little or nosupport for generating innovative business process ideas”(Bernstein, Klein, & Malone, 2003). Gunasekaran and
Kobu indicate that only a few knowledge-based modelsfor BPR have been developed (Gunasekaran & Kobu,2002). It is interesting to note here that although theabsence of this kind of BPR support by automated toolsis regretted, this functionality was not yet considered inearly studies on BPR tools and languages (see e.g. Janssen,Jonkers, & Verhoosel, 1997; Gunasekaran & Kobu, 2002).
The most important reasons to work towards IT sup-port for the design phase would be that new design alterna-tives can be developed more easily (Gunasekaran & Kobu,2002), more cost-effectively (Nissen, 1988), quicker (Mal-one et al., 1999; Nissen, 2000) and more systematically(Malone et al., 1999; Pentland, 2003). At this point in time,
few tools qualify with respect to these requirements. TheProcessWise methodology, although promoted as‘‘advanced” and supported by an integrated tool, doesnot offer any guidance for the design itself (Calvert,1994). Case-based reasoning (CBR) systems are presentedin Ku and Suh (1996), Min et al. (1996). They enable anefficient search and retrieval of earlier redesign solutionsthat may fit the aims of a new BPR effort. However, thegathering of successful solutions is problematic. Anotherdrawback is that the cases are typically restricted to a cer-tain business domain, e.g. banking.
More promising seems the approach on the basis of the
MIT Process Handbook as presented in Malone et al.(1999). The process recombinator tool is implementing thisapproach (Bernstein et al., 2003). Through the notions of (i) process specialization and (ii) coordination mechanisms,new designs can be systematically generated on the basis of an identified list of core activities. It is the end user whothen can select the most satisfactory process. In contrastto the earlier CBR approaches, the existing design knowl-edge extends over multiple business domains and the enduser is supported in a meaningful way to generate alterna-tives. The Open Process Handbook Initiative1 aims atinvolving practitioners and researchers in the describedapproach.
In research that is associated to the MIT Process Hand-book, a quite different yet promising approach is presentedin Lee and Pentland (2000), Pentland (2003). It attempts tocapture the grammar underlying a business process. Justlike natural language consists of words and rules to com-bine these words, business processes are seen as consistingof activities that can be combined using rewrite rules. Aclear advantage of this approach would be that differentprocess variants can be systematically generated andexplored. However, it seems difficult to identify the rules
and constraints that apply for certain categories of pro-cesses and to represent these in a grammatical framework.
The last approach particularly worth mentioning here isthe KOPer tool described in Nissen (1988), Nissen (2000).The idea is that a limited set of process measures (e.g. pro-cess length, process handoffs, etc.) can be used to identify
process pathologies in a given process (e.g. a problematicprocess structure, fragmented process flows, etc.). Theseprocess pathologies can then be matched to redesign trans-formations known to effectively deal with these patholo-gies. Although the tool does not generate new designsitself, e.g. by visualizing the effect of a suggested transfor-mation on an existing design, experiments suggest thatthe tool ‘‘performs redesign activities at an overall levelof effectiveness exceeding that of the reengineering novice”(Nissen, 2001). It is an open issue, however, how the vari-ous redesign transformations must be prioritized.
In summary, although the existence and importance isacknowledged of tools to support redesigners with the tech-
nical task of generating new process designs, few tools existthat can match this task. The approach that is described inthis paper (cf. Sections 3–5) is similar to the CBR-basedapproach and the KOPer tool with respect to the type of support that is offered to increase the efficiency of BPR.A main advantage over these approaches is that throughthe link with the redesign best practices the empiricalknowledge becomes available to the process designer todetermine the historic link with earlier, successful redesignsolutions (i.e. without the need to codify/gather this knowl-edge in earlier cases) with a clear idea on the priorities of applying these earlier solutions (i.e. which is missing in
the KOPer tool).
8. Conclusion
This paper presented a decision-making method basedon AHP to support practitioners in the field of BPR tochoose appropriate best practices to enhance processes. Itis important to emphasize that this work supports businessprocess redesign where process improvement is the goal asopposed to a clean slate approach to redesign. In that con-text, the main contribution of this paper is twofold. Firstly,it presents a new approach to business process redesign(refer to Section 3 and Fig. 1). This approach aims at short-ening the time practitioners will spend discussing the use-fulness of best practices and at providing them with amuch clearer appreciation of best practices importanceand impact. Secondly, it synthesizes all important criteriafor selecting best practices, introducing the goal and risksof the examined projects. This forces the redesign team toreflect on the conditions in which the redesign is conducted.
Secondly, the presented parameterization and applica-tion of the AHP algorithm to select best practices for a spe-cific redesign project is a further step towards thedevelopment of a decision-making strategy for BPR. Basedon earlier work of ourselves and others, we came up with
substantiated comparisons and weights of the tables that1 http://ccs.mit.edu/ophi/index.htm, last consulted July 31, 2007.
S. Limam Mansar et al. / Expert Systems with Applications xxx (2008) xxx–xxx 13
ARTICLE IN PRESS
Please cite this article in press as: Limam Mansar, S. et al., Development of a decision-making strategy to improve ..., Expert Systemswith Applications (2008), doi:10.1016/j.eswa.2008.01.008

7/27/2019 AHP BPR
http://slidepdf.com/reader/full/ahp-bpr 14/15
are used in the appraisal of AHP. Although some valueswere derived in previous papers (Limam Mansar & Reijers,2005; Limam Mansar & Reijers, 2007; Mansar et al., 2006;Reijers & Limam Mansar, 2005), they were not presentedor organized in such a way that it would clearly indicatehow they can be used by practitioners.
Despite the well-known disadvantage of AHP in termsof effort required to rate criteria and options, the ratingis really restricted to defining the relative weights for theindicators of the goal and the risk criteria only (equivalentto filling the values of Figs. 6 and 7). Also, the use of AHPin the presented method should be seen in the light of amore rational approach towards BPR, attaining the advan-tages of a more systematic search for redesign opportuni-ties but more efficiently than by using simulation.
Our method has been implemented in Java 2 (JBuilder),compatible with the JDK standard 4.0 and higher. Fornow, data in the form of different tables is entered in textfiles and used by the algorithm. The results are then gener-
ated and displayed visually on a computer screen. Thealgorithm takes virtually no time to make the computa-tions for the size of data that we considered here. Clearly,our implementation is still a prototype and needs enhance-ment of its user interface to be fully used in a business envi-ronment. Currently, contacts with a Dutch investmentbank are exploited to enhance the tool with respect to thisissue. Using a case study in this paper, we showed the fea-sibility and potential of the approach. We compared anddiscussed its outcome to the real application, where simula-tion was used.
The presented method allows the user to identify poten-
tially interesting best practices. Although AHP’s output isa ranking of best practices, we do not think the exact rank-ing is important. What should be considered is merely apreferred set of best practices as opposed to all best prac-tices or the best practice. Indeed, in none of the redesigninitiatives the authors have been involved in merely onebest practice was singled out. Discussions always resultedin indicating a preferred set that later was tested or applied.
With the presented method, the best practices’ relevanceis addressed through a ‘‘high-level” assessment. It considersfactors such as the redesign project’s risks and goals andthe characteristics of the best practices, for example theirimpact on the processes’ performance indicators. In thisrespect, it is different from the work of Nissen (Nissen,1988) that takes a ‘‘low-level” approach. This work consid-ers the structure of a given process in much detail (e.g.length of the paths, number of steps, etc.) to identifyimprovement opportunities. It would be interesting to seewhether these approaches could actually be used togetheror even merged and by doing so, take another step in mov-ing redesign from art to science.
Future research should also focus on further validatingthe values assigned informally in this paper, namely the rel-ative importance of the criteria and of the impact indica-tors as well as the relationship between the risk’s and
goal’s indicators values and the best practices
Acknowledgements
The authors would like to thank Dr. Patrick Pujofrom the Laboratoire des Sciences de l’Information et
des Syste mes(LSIS), Marseille, France, for his valuablecontribution in implementing the AHP algorithm. Part
of this work was done by Hajo Reijers while visitingZayed University.
References
Al-Mashari, M., Irani, Z., & Zairi, M. (2001). Business process reengi-neering: A survey of international experience. Business Process
Management Journal, 7 (5), 437–455.Alter, A. (1990). The corporate make-over. CIO, 4(3), 32–42.Attaran, M. (2004). Exploring the relationship between information
technology and business process reengineering. Information and
Management, 41(5), 585–596.Bashein, B., Markus, M., & Riley, P. (1994). Precondition for BPR success
and how to prevent failures. Information Systems Manage-ment(Spring), 7–13.
Belton, V., & Gear, T. (1983). On a shortcoming of Saaty’s method of analytic hierarchies. Omega, 11, 228–230.
Bernstein, A., Klein, M., & Malone, T. W. (2003). The processrecombinator: A tool for generating new business process ideas. InT. W. Malone, K. Crowston, & G. A. Herman (Eds.), Organizing
business knowledge: The MIT process handbook (pp. 403–422). Mas-sachusetts: MIT Press.
Bouyssou, D., Marchant, Th., Perny, P., Pirlot, M., Tsoukias, A., Vincke,Ph. (2000). Evaluation and decision models: A critical perspective,Kluwer.
Calvert, P. (1994). An advanced BPR methodology with integrated,computer-based tools. In B. C. Glasson, I. T. Hawryszkiewycz, B. A.Underwood, & R. A. Weber (Eds.), Business process re-engineering:
Information systems opportunities and challenges (pp. 61–170). Amster-dam: Elsevier Science.
Crowe, T. J., Fong, P. M., Bauman, T. A., & Zayas-Castro, J. L. (2002).Quantitative risk level estimation of business process reengineeringefforts. Business Process Management Journal, 8(5), 490–511.
Cypress, H. L. (2004). Reengineering – MS/OR imperative, make secondgeneration of business process improvement mode work. OR/MS
Today(February), 18–29.Davenport, T. (1993). Process innovation: Reengineering work through
information technology. Boston, MA: Harvard Business School Press.Davenport, T., & Short, J. (1990). The new industrial engineering:
information technology and business process redesign. Sloan Manage-
ment Review, 31(4), 11–27.Davenport, T., & Stoddard, D. (1994). Reengineering: Business change of
mythic proportions? MIS Quarterly, 18(2), 121–127.
Davidson, W. (1993). Beyond re-engineering: The three phases of businesstransformation. IBM Systems Journal, 32(1), 65–79.
Dyer, J. S., Saaty, T. L., Harker, P. T., & Vargas, L. G. (1990). Remarkson the analytic hierarchy process. Management Science, 36 (3),249–275.
Grover, V., Jeong, S., Kettinger, W., & Teng, J. (1995). The implemen-tation of business process reengineering. Journal of Management
Information Systems, 12(1), 109–144.Guimaraes, T., & Bond, W. (1996). Empirically assessing the impact of
BPR on manufacturing firms. International Journal of Operations and
Production Management, 16 (8), 5–28.Gunasekaran, A., & Kobu, B. (2002). Modelling and analysis of business
process reengineering. International Journal of Production Research,
40(11), 2521–2546.Hammer, M., & Champy, J. (1993). Reengineering the corporation: A
manifesto for business revolution. New York: Harper Business editions.
14 S. Limam Mansar et al. / Expert Systems with Applications xxx (2008) xxx–xxx
ARTICLE IN PRESS
Please cite this article in press as: Limam Mansar, S. et al., Development of a decision-making strategy to improve ..., Expert Systemswith Applications (2008), doi:10.1016/j.eswa.2008.01.008
7/27/2019 AHP BPR
http://slidepdf.com/reader/full/ahp-bpr 15/15
Hofacker, I., & Vetschera, R. (2001). Algorithmical approaches tobusiness process design. Computers and Operations Research, 28(13),1253–1275.
Irani, Z., Hlupic, V., & Giaglis, G. (2000). Business process reengineering:A design perspective. The International Journal of Flexible Manufac-
turing, 12(4), 247–252.Jansen-Vullers, M. H., & Reijers, H. A. (2006). Business process redesign
in healthcare: Towards a structured approach. INFOR: Information
Systems and Operational Research, 43(4), 321–339.Janssen, W., Jonkers, H., & Verhoosel, J. (1997). What makes business
processes special? An evaluation framework for modelling languagesand tools in business process redesign. In K. Siau, Y. Wand, J. Parsons(Eds.), Proceedings of the second CAiSE/IFIP 8.1 international work-
shop on evaluation of modeling methods in systems analysis and design,Barcelona, Spain.
Kettinger, W. J., Teng, J. T. C., & Guha, S. (1997). Business processchange: A study of methodologies, techniques, and tools. MIS
Quarterly, 21(2), 55–80.Ku, S., & Suh, Y. H. (1996). An investigation of the K-tree search
algorithm for efficient case representation and retrieval. Expert
Systems with Applications, 11(4), 571–581.Lee, J., & Pentland, B. T. (2000). Grammatical approach to organizational
design. MIT Center for Coordination Science Working Paper, 215,4144, pp. 1–35.
Limam Mansar, S., & Reijers, H. A. (2005). Best practices in businessprocess redesign: Validation of a redesign framework. Computers in
Industry, 56 (5), 457–471.Limam Mansar, S., & Reijers, H. A. (2007). Best practices in business
process redesign: Use and impact. Business Process Management
Journal, 13(2), 193–213.Limam Mansar, S., Reijers, H. A., & Ounnar, F. (2006). BPR implemen-
tation: A decision-making strategy. In Proceedings of the BPM’05,
lecture notes in computer science, (3812) (pp. 421–431). Berlin: Springer.Malone, T. W., Crowston, K., Lee, J., & Pentland, B. (1999). Tools for
inventing organizations: Toward a handbook of organizational pro-cesses. Management Science, 45(3), 425–443.
Mekaouche, L. (2007). Pilotage holonique auto organise de reseauxlogistiques: Validation par modelisation et simulation distribuee. PhDUniversite Paul Cezanne Aix-Marseille III.
Min, D. M., Kim, J. R., Kim, W. C., Min, D., & Ku, S. (1996). IBRS:Intelligent bank reengineering system. Decision Support Systems, 18(1),97–105.
Nissen, M. E. (1988). Redesigning reengineering through measurement-driven inference. MIS Quarterly, 22, 509–534.
Nissen, M. E. (2000). An intelligent tool for process redesign: Manufac-turing supply-chain applications. The International Journal of Flexible
Manufacturing Systems, 12(4), 321–339.Nissen, M. E. (2001). An experiment to assess the performance of a
redesign knowledge system. Journal of Management Information
Systems, 17 (3), 25–43.Ounnar, F. (1999). Prise en compte des aspects decision dans la
modelisation par reseaux de Petri des systemes flexibles de production,PhD dissertation (National Polytechnique of Grenoble), AutomaticLaboratory of Grenoble.
Ounnar, F., & Pujo, P. (2005). Supplier evaluation process within a self-organized logistical network. International Journal of Logistics Man-
agement, 16 (1), 159–172.Ounnar, F., Pujo, P., Mekaouche, L., & Giambiasi, N. (2007). Customer-
supplier relationship management in an intelligent supply chainnetwork. Production Planning and Control, 18(5), 377–387.
Pentland, B. T. (2003). Grammatical models of organizational processes.In T. W. Malone, K. Crowston, & G. A. Herman (Eds.), Organizing
business knowledge: The MIT process handbook (pp. 191–214). Meas-sachusetts: MIT Press.
Reijers, H. A. (2003). Design and control of workflow processes: Business
process management for the service industry. Berlin: Springer-Verlag.Reijers, H. A., & Limam Mansar, S. (2005). Best practices in business
process redesign: An overview and qualitative evaluation of successfulredesign heuristics. Omega, 33(4), 283–306.
Rigby, D., & Bilodeau, B. (2005). The Bain 2005 management tool survey.Strategy and Leadership, 33(4), 4–12.
Saaty, T. (1980). The analytic hierarchy process. McGraw-Hill.Sharp, A., & McDermott, P. (2001). Workflow modeling: Tools for process
improvement and application development. Boston: Artech HousePublishers.
Sockalingam, S., & Doswell, A. (1996). Business process re-engineering inScotland: Survey and comparison. Business Change and Re-engineer-
ing, 3(4), 33–44.
S. Limam Mansar et al. / Expert Systems with Applications xxx (2008) xxx–xxx 15
ARTICLE IN PRESS