52817718 si 5141 amp sj 5122 review transport network modeling
TRANSCRIPT

Harun al-Rasyid LUBIS
http://personal.ftsl.itb.ac.id/halubis/
Fakultas Teknik Sipil dan Lingkungan ITB
SI- 5141 Perencanaan & Pemodelan Transportasi
SJ-5122 Perencanaan Transportasi & Pengembangan
Review Transportation Network Modeling

11/11/2010 2
Review : Model Transport 4 Tahap
Trip Generation
Trip Distribution
Modal Split
Trip Assignment
Volume Lalu Lintas
Jaringan Transportasi
SistemZona
Tata Guna Lahan dan Karakteristik Sosio
Ekonomi

Traffic (Trip) Assignment
Trip Generation
Trip Distribution
Transit Estimation & Mode Split
Time-of-Day & Directional Factoring
Transit Person Trip Table
(O&D)
Vehicle Trip Table
(O&D)
Trip Assignment
Loaded Transit
Network
Loaded
Highway
Network
Net
wo
rk
mo
de
ling

Review

11/11/2010 5
Asal/Origin (O)
Tujuan/Destination (D)
Perjalanan/Trip (t)
Perjalanan/Trip
D5
D1
O
D2D3
D430%
20%
10%
25%
15%
Bangkitan seluruh perjalanan dari zona asal (O)
Distribusi seluruh perjalanan dari zona asal (O) ke semua zona tujuan (D)
Mobil Pribadi 25%
Kendaraan Umum 20%
Motor 30%
Tak Bermotor 15%
Jalan Kaki 10%
Tujuan/Destination
(D1)
Asal/Origin (O)
Asal/Origin (O)
Tujuan/Destination
(D1)
t
Pemilihan/pemisahan perjalanan menurut jenis moda dari zona asal (O) ke zona tujuan (D1)
Pembebanan perjalananmenurut jenis modakepada rute-rute(jaringan) diantarapasangan zona asal (O) dan zona tujuan (D) utk public dan private transport

Terminology• Network, node and links
(arcs)
• Highway/trip assignment• Transit trip assignment• All-or-nothing assignment• Equilibrium assignment
• Cost-flow or volume-delay function
• Free-flow speed• Free-flow travel time• Generalized cost
• Path finding
• Impedance
• Waiting time
• Access time
• Path loading
• Level of service
• Capacity restraint

11/11/2010 7
MODELING & SAMPLING in Transport

11/11/2010 8

11/11/2010 9
Asumsi Dasar Model Transport
• Pola interaksi dan perilaku
• Memaksimalkan utilitas
• Kesetimbangan (equilibrium)
• Agregasi

11/11/2010 10
Interaksi Transport – Tata Guna LahanPemilihan
Rute
PemilihanModa
PemilihanTujuan
Keputusan Melakukan Perjalanan
KepemilikanKendaraan
Aktifitas
Penempatan Lahan
Pembangunan
Pemilihan Lahan oleh Investor
Pemilihan Lahan oleh Pengguna
Daya Tarik Lahan
Aksesibilitas
Waktu Tempuh/Jarak/Biaya
Volume di Ruas Jalan
TRANSPORTASI
GUNA LAHAN
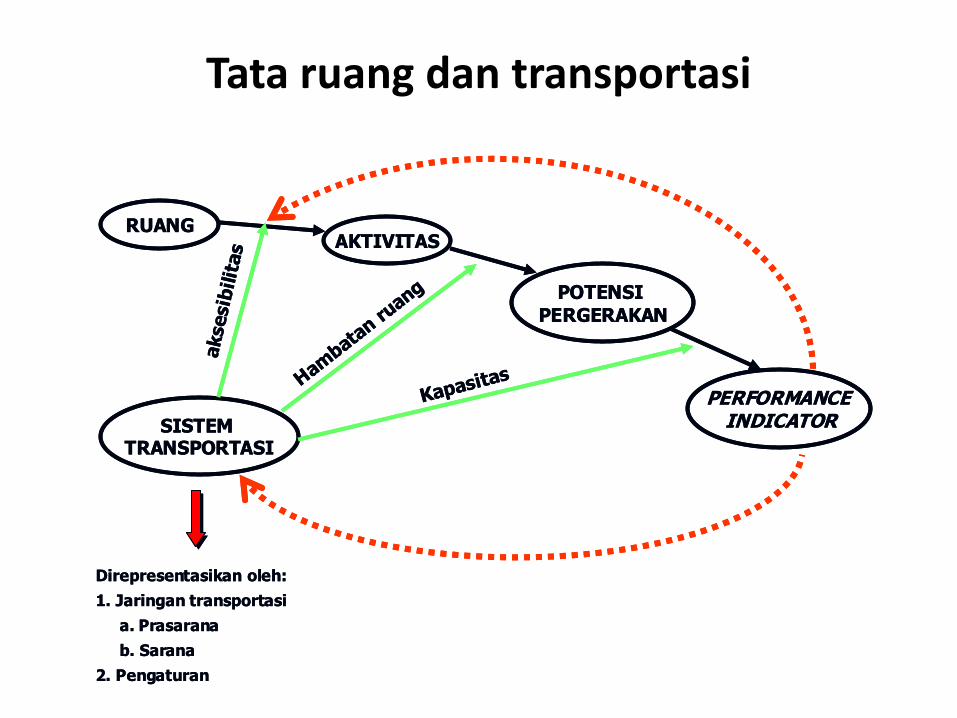
Tata ruang dan transportasi
RUANGAKTIVITAS
POTENSI PERGERAKAN
PERFORMANCE INDICATORSISTEM
TRANSPORTASI
aksesib
ilit
as
Hambata
nru
ang
Kapasitas
Direpresentasikan oleh:
1. Jaringan transportasi
a. Prasarana
b. Sarana
2. Pengaturan
RUANGAKTIVITAS
POTENSI PERGERAKAN
PERFORMANCE INDICATORSISTEM
TRANSPORTASI
aksesib
ilit
as
Hambata
nru
ang
Kapasitas
Direpresentasikan oleh:
1. Jaringan transportasi
a. Prasarana
b. Sarana
2. Pengaturan
11/11/2010 12
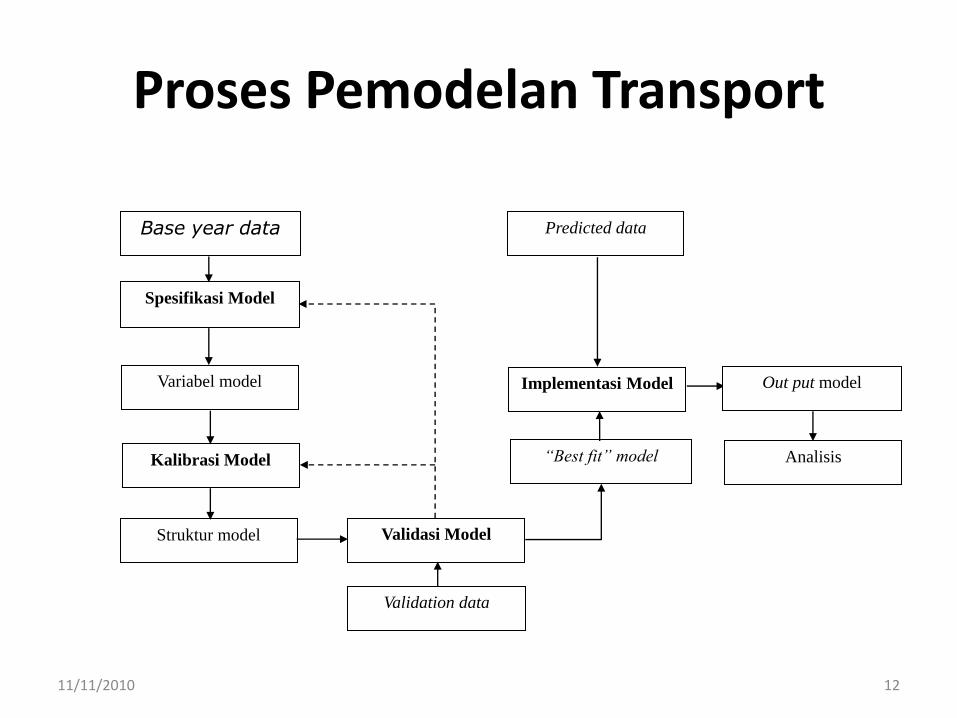
Proses Pemodelan Transport
“Best fit” model
Variabel model
Base year data
Spesifikasi Model
Struktur model
Kalibrasi Model
Validasi Model
Validation data
Predicted data
Implementasi Model Out put model
Analisis

11/11/2010 13
Estimation Calibration Validation Application
Validation and Reasonableness Checks

Transit Assignment
Results 2001 Base Case
Observed vs Predicted Transit Line Boardings
0
2000
4000
6000
8000
10000
12000
14000
0 2000 4000 6000 8000 10000 12000
Observed
Pre
dic
ted
PRED
Total Boardings by Sub-Mode OBS PRED RMSE RMS%
Durham Bus 7499 7164 126.1891 1.68%
York Bus 7111 7280 143.0784 2.01%
Peel Bus 38497 40217 332.7368 0.86%
Halton Bus 4536 4990 81.51716 1.80%
HSR Bus 15982 16337 292.8422 1.83%
GO Bus 7172 7353 399.3889 5.57%
GO Rail 13659 13735 645.6756 4.73%
TTC Bus 282084 260041 1038.175 0.37%
TTC Prem Bus 672 101 176.9569 26.33%
TTC Subway 254060 235691 9103.319 3.58%
TTC Streetcar 47097 47097 1201.121 2.55%
Overall 678369 640006 1036.107 0.15%
Final parameter settings with embedded transit fares seem to be providing good assignment of transit trips to lines and sub-modes.

11/11/2010 15
Acceptable Ranges of Error

The Number of Boarding and Alighting in Tehran Transit Stops in Morning Peak Hour, 2003

11/11/2010 17
Sistem Zona (kecamatan) contoh : Jakarta Mass Rapid Transit System Study
211
241
212
213
214215
216
217
218
231
227
226
225
224
223
232
234
233
222
242
245
246
249
238237
236
235
244
243
251
253
259
261
254
248
247
255
256
257
258271
Zona Internal
Zona Eksternal

Greater Bandung Metropolitan Public TransportZoning
13 Zones based on Density
5 6 7
2 3 41
North BMA (Cimahi +Bandung Barat)1 = Kota Cimahi2 = Kota Bandung 23 = Kota Bandung 34 = Kota Bandung 45 = Kota Bandung 56 = Kota Bandung 67 = Kota Bandung 7
South West
Bandung
South East
Bandung
South West BMA South East BMA
Sumedang

Greater Bandung Metropolitan Public TransportSocio-economic Analysis
Population and GDP by Zones in BMA (2006)
No. DescriptionPopulation in
1,000
GDP per
capita in Mio
Rs
Zone 1 Kota Bandung 1 375
Zone 2 Kota Bandung 2 475
Zone 3 Kota Bandung 3 263
Zone 4 Kota Bandung 4 234
Zone 5 Kota Bandung 6 525
Zone 6 Kota Bandung 5 307
Zone7 North BMA 950 13
Zone 8 South West BMA 1.105 15
Zone 9 South East BMA 545 13
Zone10 South East Bandung 800 15
Zone 11 South West Bandung 710 15
Zone 12 Cimahi NW Bandung 520 16
Zone 13 Special Zone Sumedang 235 9
18

Zone x
Zone z
Zone y
Greater Bandung Metropolitan Public Transport
Methodology of the Analysis of Traffic Pattern in BMA (1)
Commuter Rail
Toll Road
Bus Line
Traffic Volume
Each Zone is tripsGenerator and attractor

SPESIFIKASI JARINGAN
DI PERSIMPANGAN

Coding jaringan di persimpangan
1
2
3
4

25 December 12, 2006Florida Model Task Force
Corradino
Rail Station Micro-coding
StreetsBus platform node
Rail platform nodeMetroRail
PNR KNR
Time= ~1 min
Time= ~0.5 min
Time= ~2 min
Time= ~2 min
Access Connectors
Escalator Link
Time= ~1 min
Source: AECOM Consult

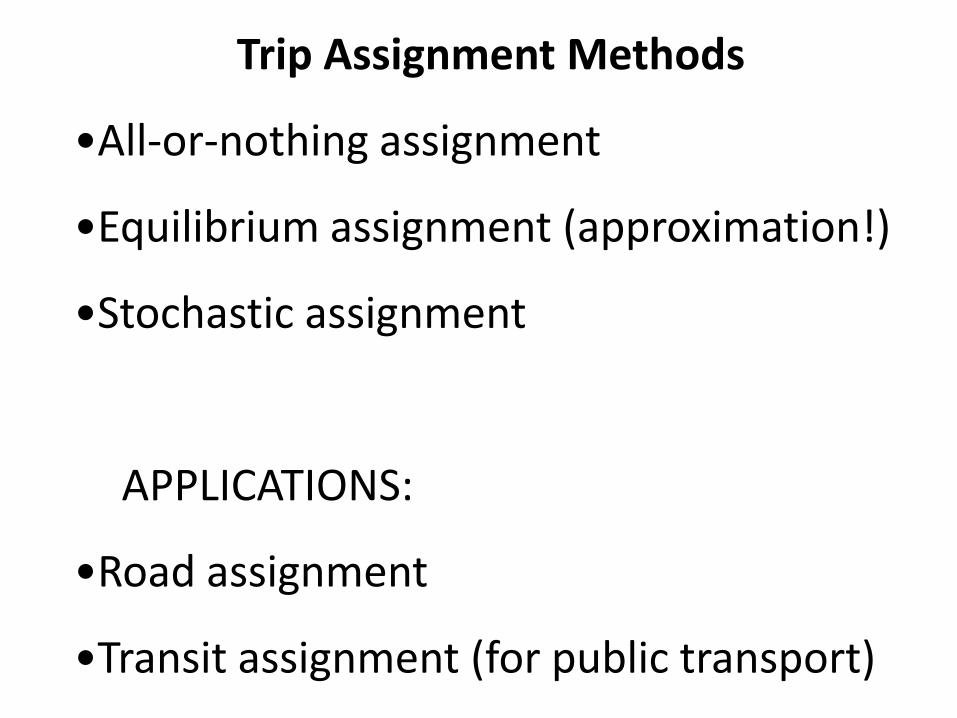
Trip Assignment Methods
•All-or-nothing assignment
•Equilibrium assignment (approximation!)
•Stochastic assignment
APPLICATIONS:
•Road assignment
•Transit assignment (for public transport)

11/11/2010 28
Trip Assignment -Path Selection

Trip AssignmentObjectives:
• Explain the concept of an all-or-nothing assignment
• Explain the concept of an equilibrium assignment
• Mathematical formulation & finding solution + algorithm
• Identify the cost-flow or delay-flow function

Inputs and OutputsInputs
• O&D trip table
• Coded network
Outputs
• Link flows as per coded network
• Link travel times/speeds
• VMT
• Vehicle hours of travel

Step 3:
Continue until
trips between all
TAZ pairs have
been assigned
Step 2:
Assign all trips to
links
compromising
shortest route
Step 1:
Find Shortest
route between
the TAZs
All-or-Nothing Assignment
Advantages
•Simple
•Inexpensive
•Results easy to understand
Disadvantages
•Assumes all traffic will travel on shortest path
•Creates unrealistic flow patterns

Logit model
Can set Ui = 1/tti, but if you do, will need a calibration coefficient
Can set Ui = -tti
(7)
(8)
(9)
67
24
9
These resultsFrom this specification

Capacity Restraint
• Volume-delay relationship
• Average travel speed decreases with increased flow (volume)
• Average travel time increases as the volume-to-capacity ratio on a link increases
• The Bureau of Public Roads (BPR) formula, used as default in
most model packages
shows this relationship:
Travel time depends on the loading, but the loading depends on the travel time – it’s an iterative process