10. teknik dokumentasi
TRANSCRIPT

TEKNIK DOKUMENTASI
DAN PENYUSUNAN
SISTEM
TEKNIK DOKUMENTASI TEKNIK DOKUMENTASI
DAN PENYUSUNAN DAN PENYUSUNAN
SISTEMSISTEM
PraptiPrapti AntarwiyatiAntarwiyati

Bahasa dan Diskripsi SIASIA perlu selalu dikembangkan. Dalam
implementasinya sistem ini selalu dikembangkankarena adanya berbagai perubahan atauperkembangan perusahaan. Sistem ini selaluberkembang sehingga membentuk suatu siklusperkembangan sistem. Pengembangan sistemmeliputi tahap tahap: planning, analysis, design, selection, implementation dan operation.
Melalui tahap tersebut setiap orang yang terlibatdengan SIA harus mempunyai pemahaman yang sama. Bahasa Komunikasi harus persis, danmenghasilkan interpretasi yang sama dankonsisten tentang data apa yang disimpanbagaiman memperoleh data tersebutmenyimpannya dan memanggil kembali, instruksiapa yang dilakukan dalam melaksanakan suatuprosedur dsb

• Diskripsi secara narasi dari suatu sistemsangat diperlukan tetapi hal inimerupakan suatu dokumentasi yang tidak efektif. Diskripsi narasimemerlukan waktu lama untuk membacadan memahaminya dan kemungkinan akanmenghasilkan interpretasi yang berbedabagi setiap orang yang harusmenggunakan dolumentasi tersebut. Oleh karena itu dokumentasi system harus juga disajikan dalam bentuk Chart ( Bagan ) misalnya Flow Chart atau data flow diagram
Document Flowcharts
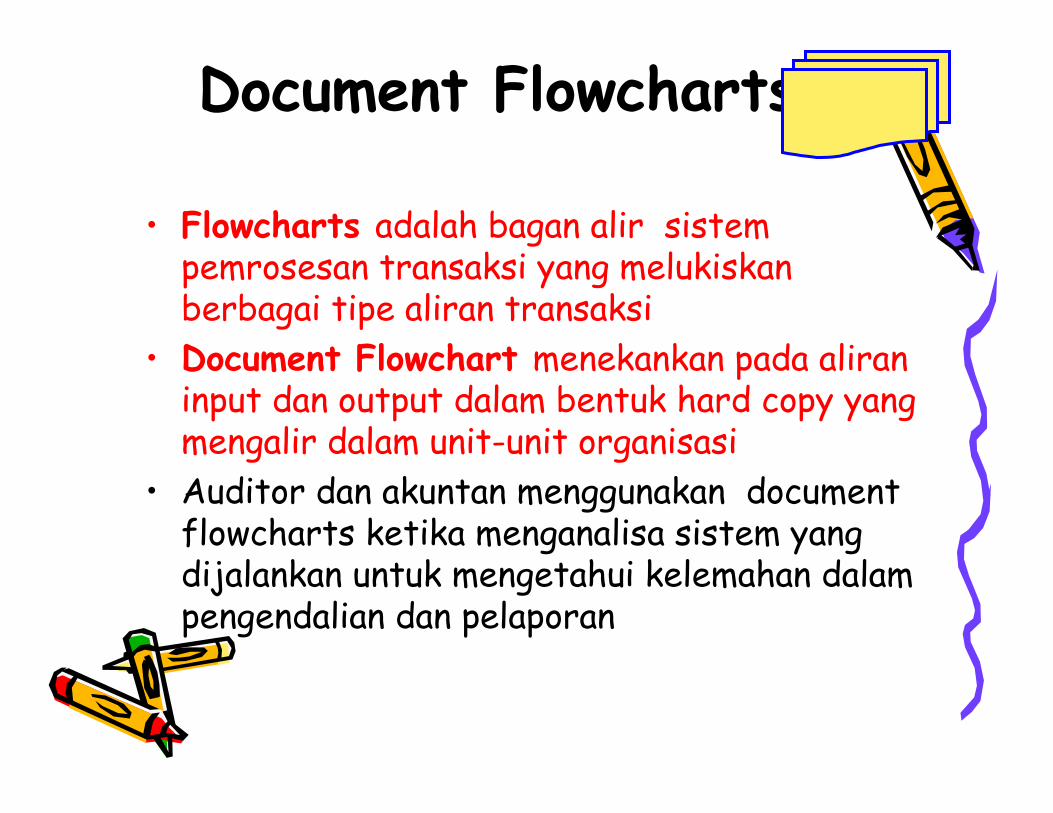
• Flowcharts adalah bagan alir sistempemrosesan transaksi yang melukiskanberbagai tipe aliran transaksi
• Document Flowchart menekankan pada aliraninput dan output dalam bentuk hard copy yang mengalir dalam unit-unit organisasi
• Auditor dan akuntan menggunakan document flowcharts ketika menganalisa sistem yang dijalankan untuk mengetahui kelemahan dalampengendalian dan pelaporan
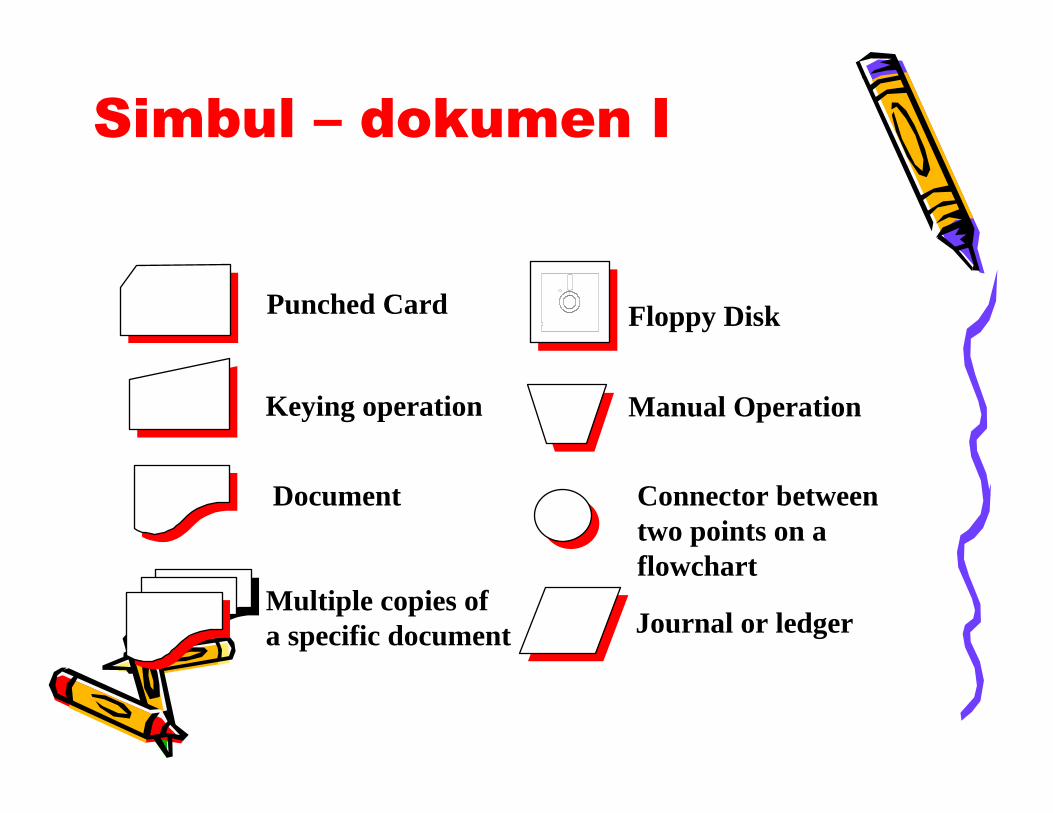
Simbul – dokumen I
Punched Card
Keying operation
Document
Multiple copies ofa specific document
Floppy Disk
Manual Operation
Connector betweentwo points on a flowchart
Journal or ledger
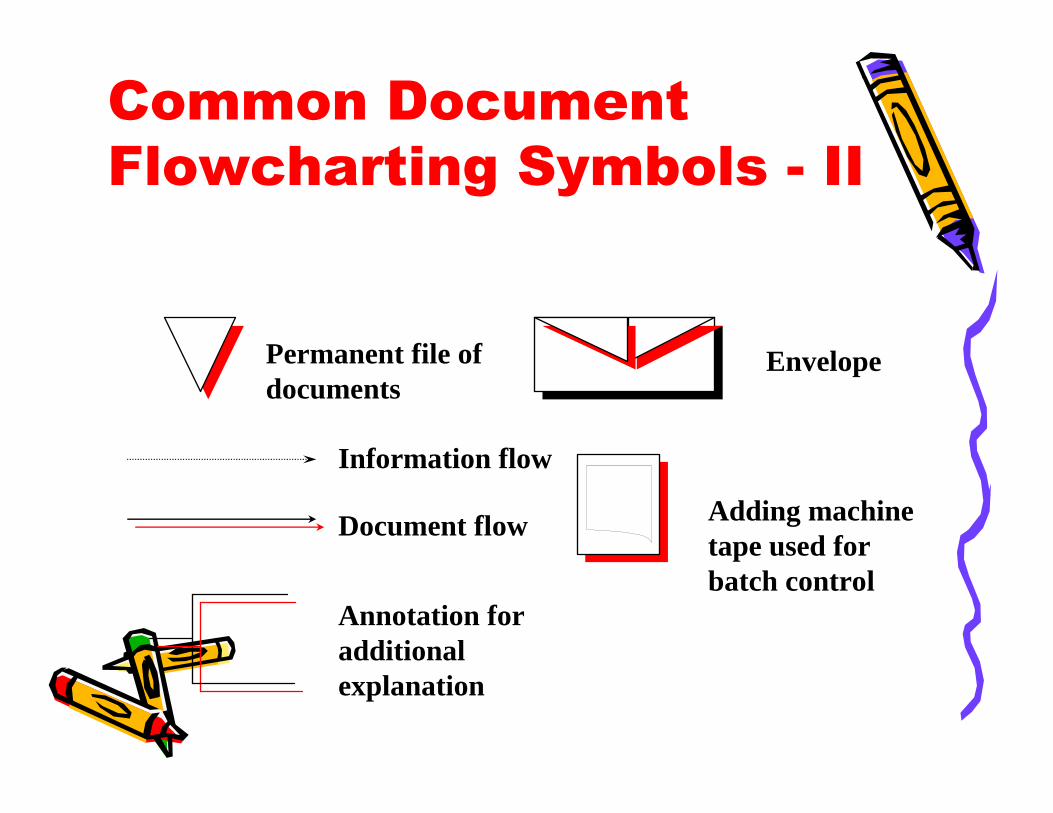
Permanent file ofdocuments
Information flow
Document flow
Annotation foradditional explanation
Envelope
Adding machinetape used forbatch control
Common Document
Flowcharting Symbols - II

A Sample Document
Flowchart
Requesting Department Central Supplies Department
Goods Requisition Form
A
1 2
File
A
Goods Requisition Form
1

System Flowcharts
• System Flowcharts menggambarkan alirandata dan tahap-tahap pemrosesan dalamSIA
• Simbol simbol ini digunakan secarakonvensi dan distandardisasi oleh the American National Standards Institute (ANSI)
• Flowcharting symbols meliputi input-output symbols, processing symbols, storage symbols, data and information flow symbols, and miscellaneous symbols
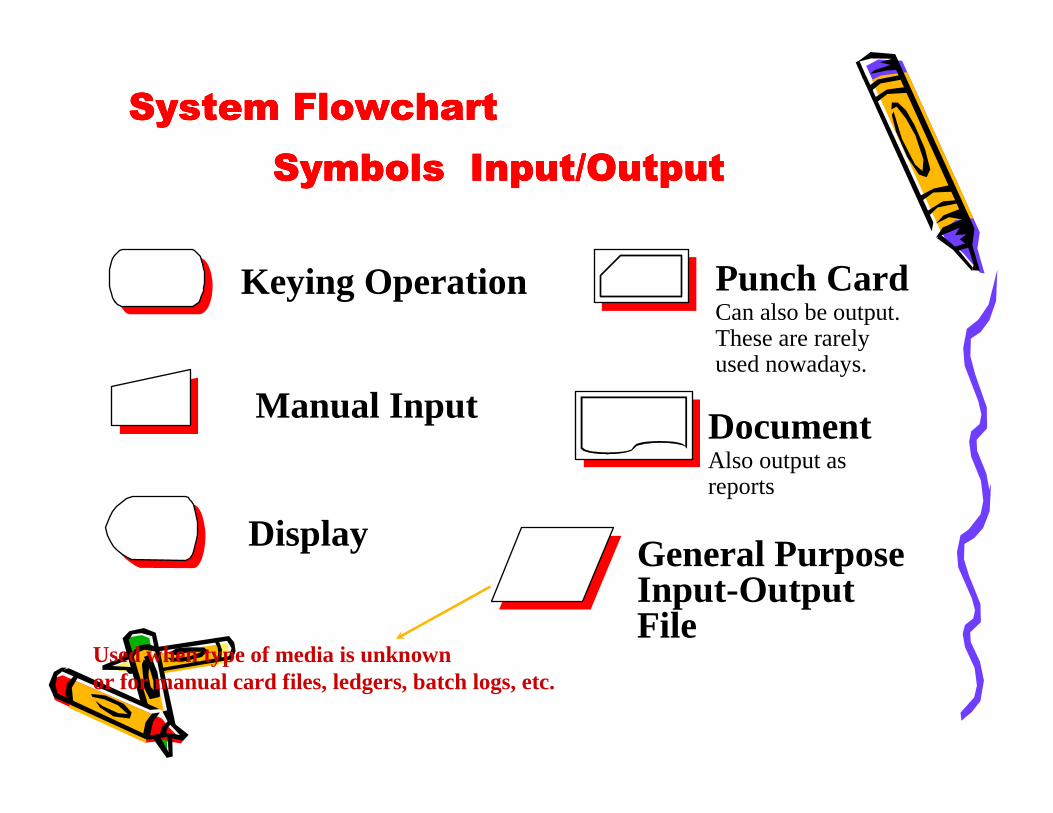
System FlowchartSystem FlowchartSystem FlowchartSystem Flowchart
Symbols Input/OutputSymbols Input/OutputSymbols Input/OutputSymbols Input/Output
Manual Input
Keying Operation
Display
Punch CardCan also be output.These are rarelyused nowadays.
DocumentAlso output asreports
General PurposeInput-OutputFile
Used when type of media is unknownor for manual card files, ledgers, batch logs, etc.
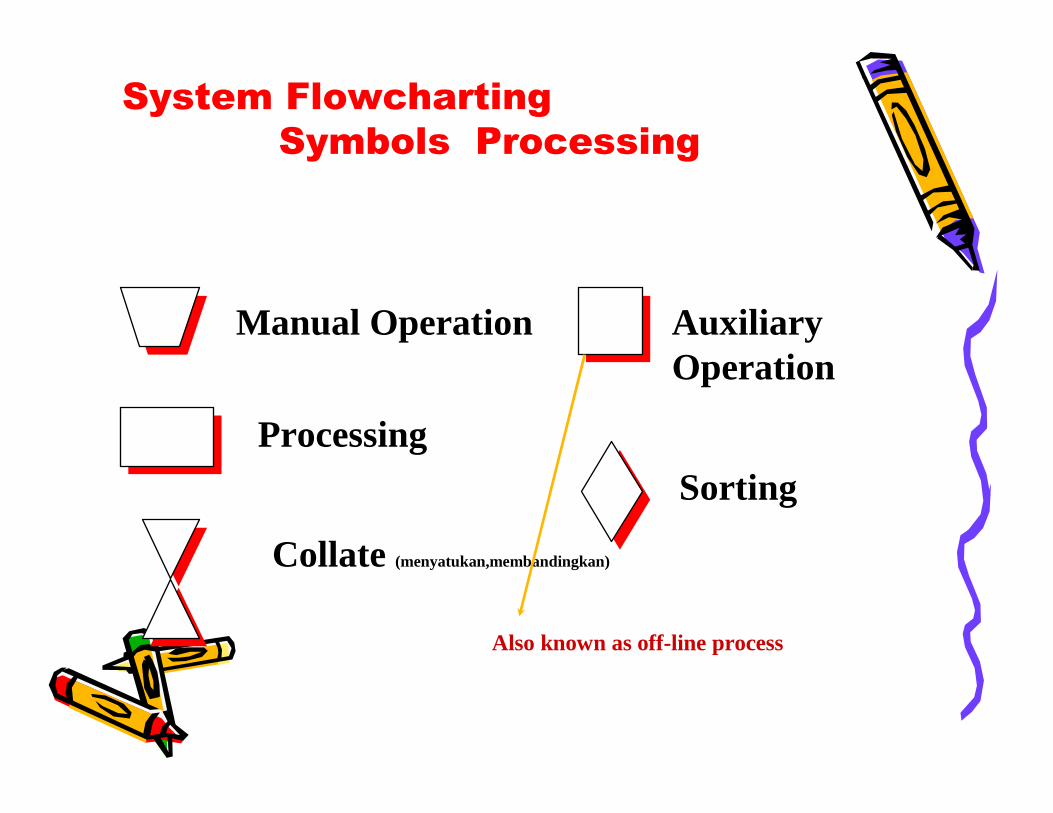
System Flowcharting
Symbols Processing
Manual Operation
Processing
Collate (menyatukan,membandingkan)
Sorting
AuxiliaryOperation
Also known as off-line process
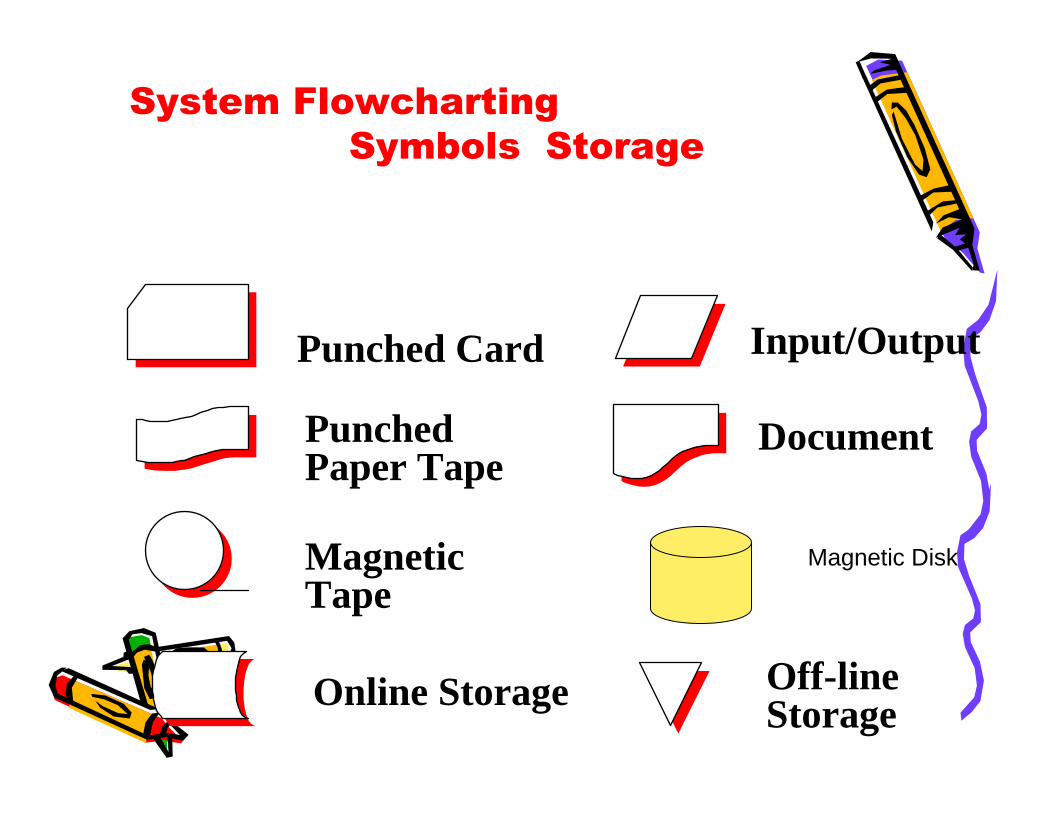
System Flowcharting
Symbols Storage
Punched Card
PunchedPaper Tape
MagneticTape
Input/Output
Document
Online Storage Off-lineStorage
Magnetic Disk

Systems Flowcharting
Symbols Connectors
Start/StopStart/Stop TerminalCan also be an externalentity
AAOn-pageconnector
Off-pageConnector
Logic Flow
TelecommunicationLink
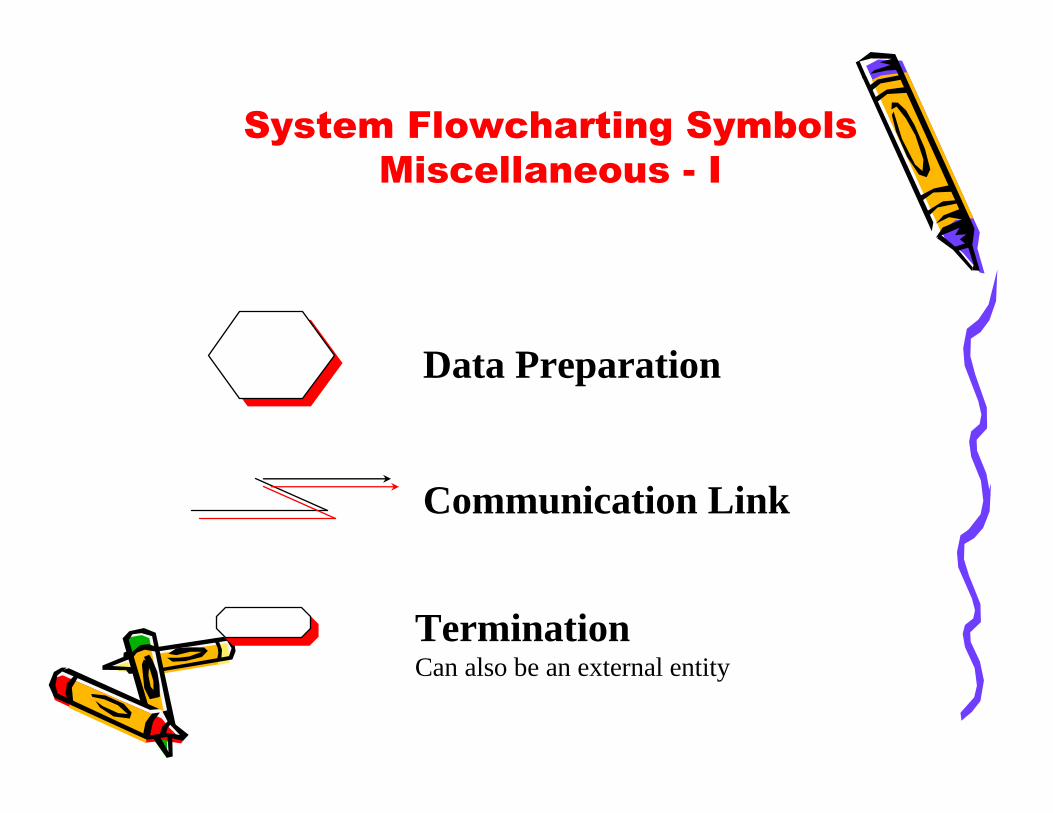
TerminationCan also be an external entity
Communication Link
Data Preparation
System Flowcharting Symbols
Miscellaneous - I
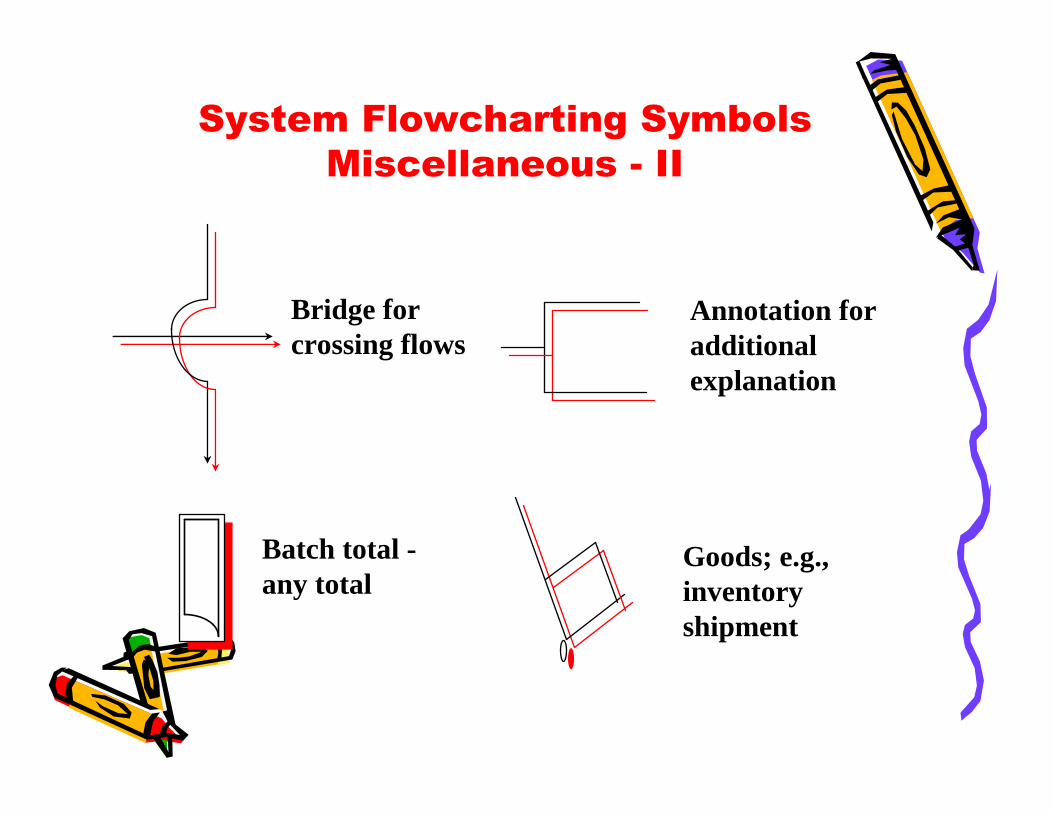
Annotation foradditional explanation
Bridge forcrossing flows
Batch total -any total
Goods; e.g.,inventoryshipment
System Flowcharting Symbols
Miscellaneous - II

• 1) Aliran dimulai dari sisi kiri atas suatu halamankertas dan bergerak dari sisi kiri ke arah kanan, dari atas kebawah
• 2) Semua tahap digambarkan berurutan secarajelas. Tidak ada prosedur yang terlewatkan.
• 3) Simbol yg digunakan selalu konsisten. Misalnyasimbul pemrosesan manual ( bentuk trapesium) harus dimunculkan pada saat petugas melakukansuatu tahap prosedur.
• 5 simbol yg digunakan sbb
Figure 2-9
Basic Rules of Flowcharting - I
dokumen terminalProses ygDilakukanScr manual
keputusan
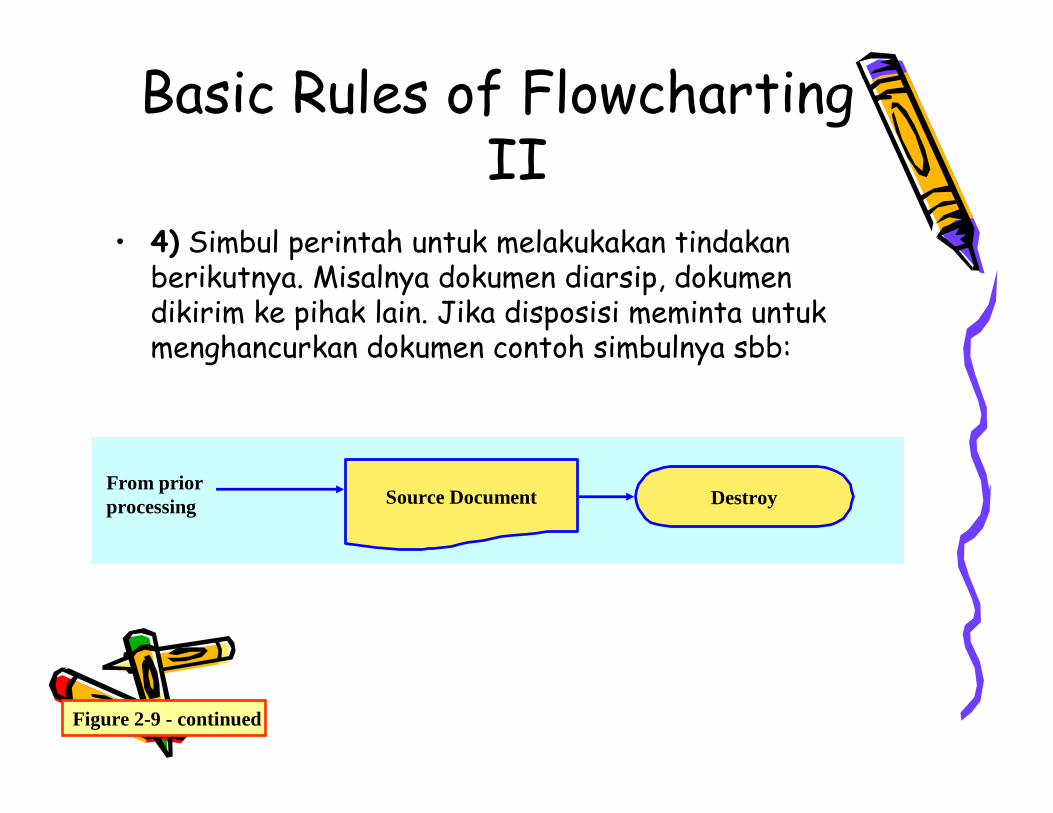
Source Document DestroyFrom priorprocessing
Basic Rules of Flowcharting -II
• 4) Simbul perintah untuk melakukakan tindakanberikutnya. Misalnya dokumen diarsip, dokumendikirim ke pihak lain. Jika disposisi meminta untukmenghancurkan dokumen contoh simbulnya sbb:
Figure 2-9 - continued
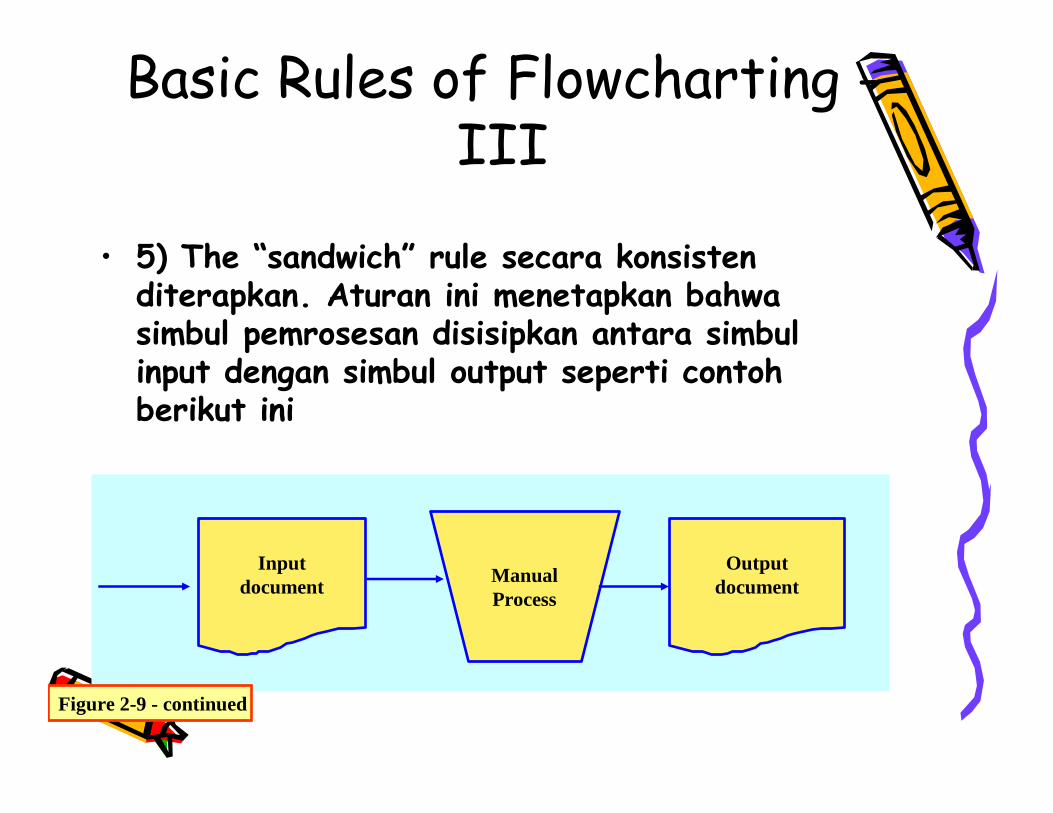
• 5) The “sandwich” rule secara konsistenditerapkan. Aturan ini menetapkan bahwasimbul pemrosesan disisipkan antara simbulinput dengan simbul output seperti contohberikut ini
Inputdocument
Outputdocument
ManualProcess
Figure 2-9 - continued
Basic Rules of Flowcharting -III
• 6) When a document crosses an organizational line within the flowchart, the document is pictured again in the new organizational unit. However, the repetition is not usually necessary in some instances if the organizational units are adjacent
• 7) All symbols contain a brief but specific label written inside the symbols
• 8) Multiple copies of documents are drawn as an overlapping group and are numbered in the upper right-hand corners; these numbers remain the copies during their flows through the procedureFigure 2-9 - continued
Basic Rules of Flowcharting -IV
• 9) Added comments are included within annotation symbols and are attached to appropriate symbols, such as the processing symbols to which the comments are related
• 10) Ample connections (cross-references) are provided. The symbols used in forming the connections depend on the situation. Thus, if two sheets are needed to to contain the flowchart, the flows between pages are formed by off-page connector symbols. In those cases where the procedure being flowcharted links to an adjoining procedure, the connection can be formed by a terminal symbol
Figure 2-9 - continued
Basic Rules of Flowcharting - V
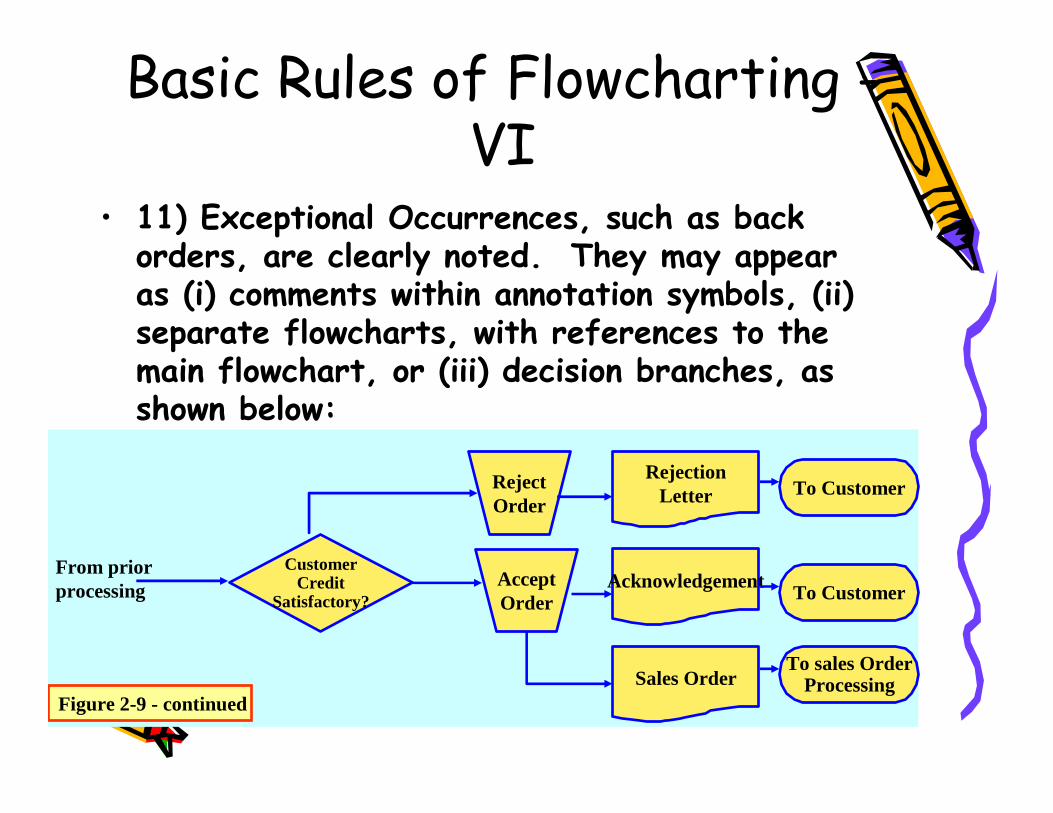
• 11) Exceptional Occurrences, such as back orders, are clearly noted. They may appear as (i) comments within annotation symbols, (ii) separate flowcharts, with references to the main flowchart, or (iii) decision branches, as shown below:
CustomerCredit
Satisfactory?
RejectOrder
AcceptOrder
RejectionLetter
Acknowledgement
Sales Order
To Customer
To Customer
To sales OrderProcessing
From priorprocessing
Figure 2-9 - continued
Basic Rules of Flowcharting -VI
Data-Flow Diagrams
• Data-flow diagram menggambarkan aliran data physik (physical flows data) dan aliran data logis (Logical flows data) dari suatu sistem pemrosesan transaksi
• Bagan ini merupakan gambaran ringkas aliran data dari suatu proses transaksi secara garis besar (pokok-pokoknya) sehingga hanya ada 4 simbul
Symbols used in Data Flow Diagrams
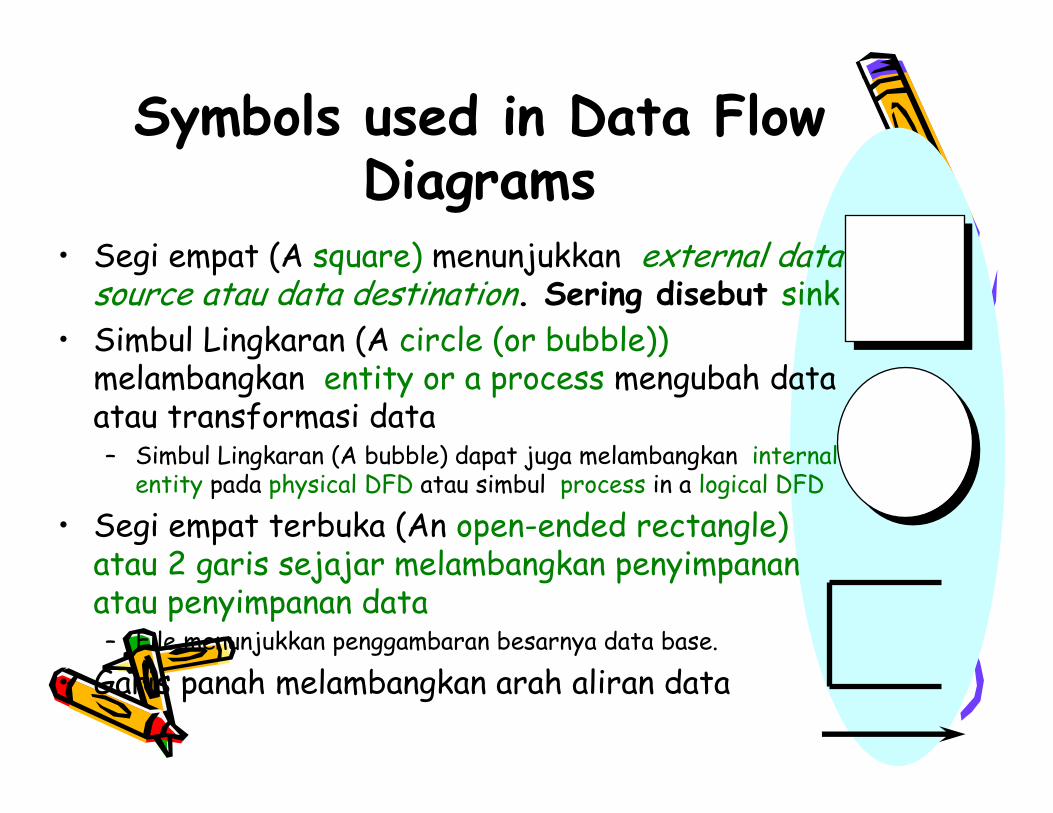
• Segi empat (A square) menunjukkan external data source atau data destination. Sering disebut sink
• Simbul Lingkaran (A circle (or bubble))melambangkan entity or a process mengubah data atau transformasi data – Simbul Lingkaran (A bubble) dapat juga melambangkan internal
entity pada physical DFD atau simbul process in a logical DFD
• Segi empat terbuka (An open-ended rectangle) atau 2 garis sejajar melambangkan penyimpananatau penyimpanan data– File menunjukkan penggambaran besarnya data base.
• Garis panah melambangkan arah aliran data
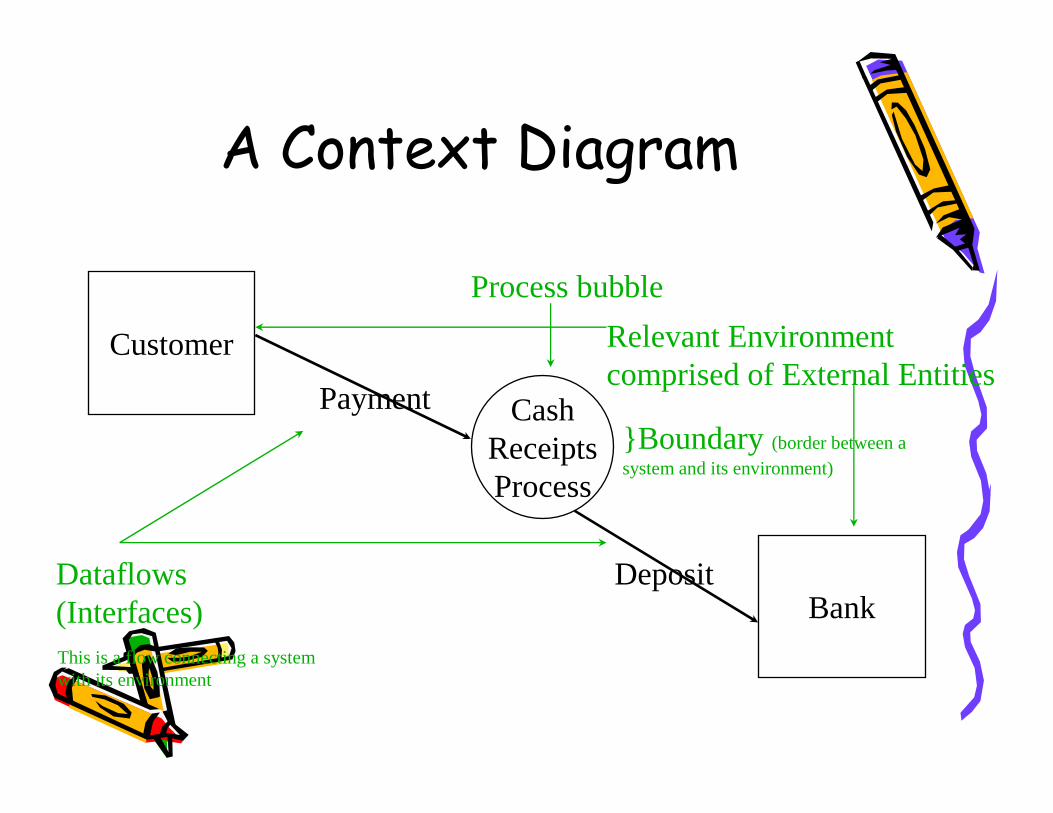
A Context Diagram
Customer
CashReceiptsProcess
Bank
Payment
DepositDataflows(Interfaces)
Process bubble
}Boundary (border between asystem and its environment)
Relevant Environmentcomprised of External Entities
This is a flow connecting a systemwith its environment
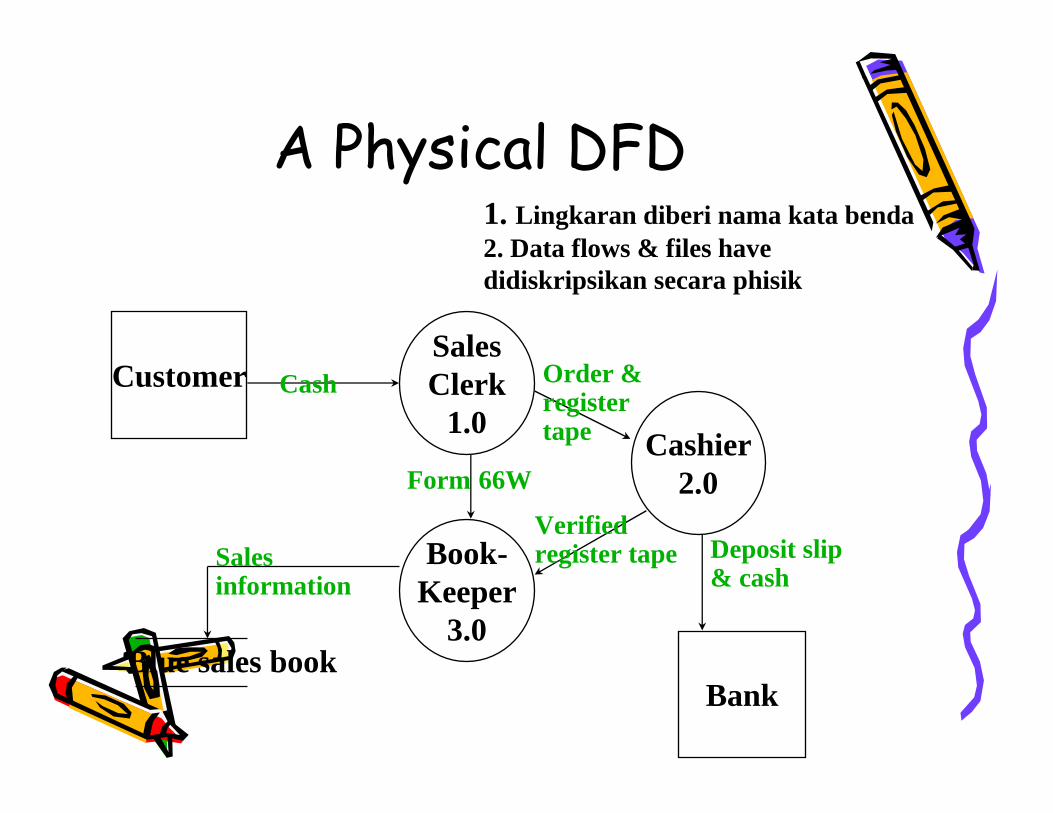
A Physical DFD
CustomerSalesClerk
1.0
Book-Keeper
3.0
Cashier2.0
BankBlue sales book
Cash Order ®istertape
Verifiedregister tape Deposit slip
& cashSalesinformation
Form 66W
1. Lingkaran diberi nama kata benda2. Data flows & files havedidiskripsikan secara phisik
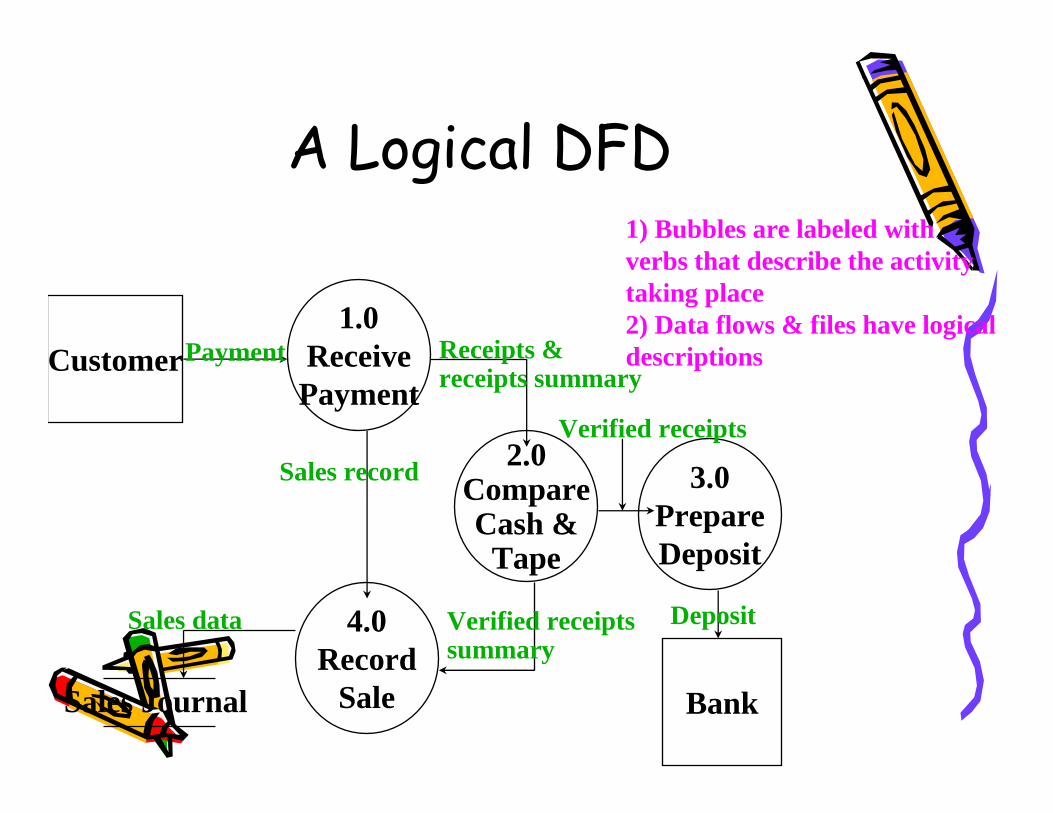
A Logical DFD
Customer1.0
ReceivePayment
2.0CompareCash &
Tape
4.0Record
Sale
3.0PrepareDeposit
BankSales Journal
Payment Receipts &receipts summary
Sales record
Verified receiptssummary
Sales data
Verified receipts
Deposit
1) Bubbles are labeled withverbs that describe the activitytaking place2) Data flows & files have logicaldescriptions
Physical DFDs
• A Physical DFD documents the physical structure of an existing system. It answers questions such as Where an entity works, How an entity works, the work is done by Whom, etc.
• Given the very “physical” focus of a physical DFD, it changes whenever the entities, technology used to implement the system, etc. changes
• Physical DFDs have no lower levels• This limitation makes physical DFDscumbersome to work with, and usually of limited value

Logical DFDs - I
• Logical Data flow diagrams are usually drawn in levels that include increasing amounts of detail
• A top level (or high-level) DFD that provides an overall picture of an application or system is called a context diagram
• A context diagram is then decomposed, or broken down, into successively lower levels of detail
Logical DFDs - II
• Logical Data flow diagramsdocument the processes in an existing or proposed system (What tasks)
• Because the logic of a system changes infrequently, relative to its physical nature, a logical DFD will remain relatively constant over time
• Logical Data flow diagrams typically have levels below the level-0
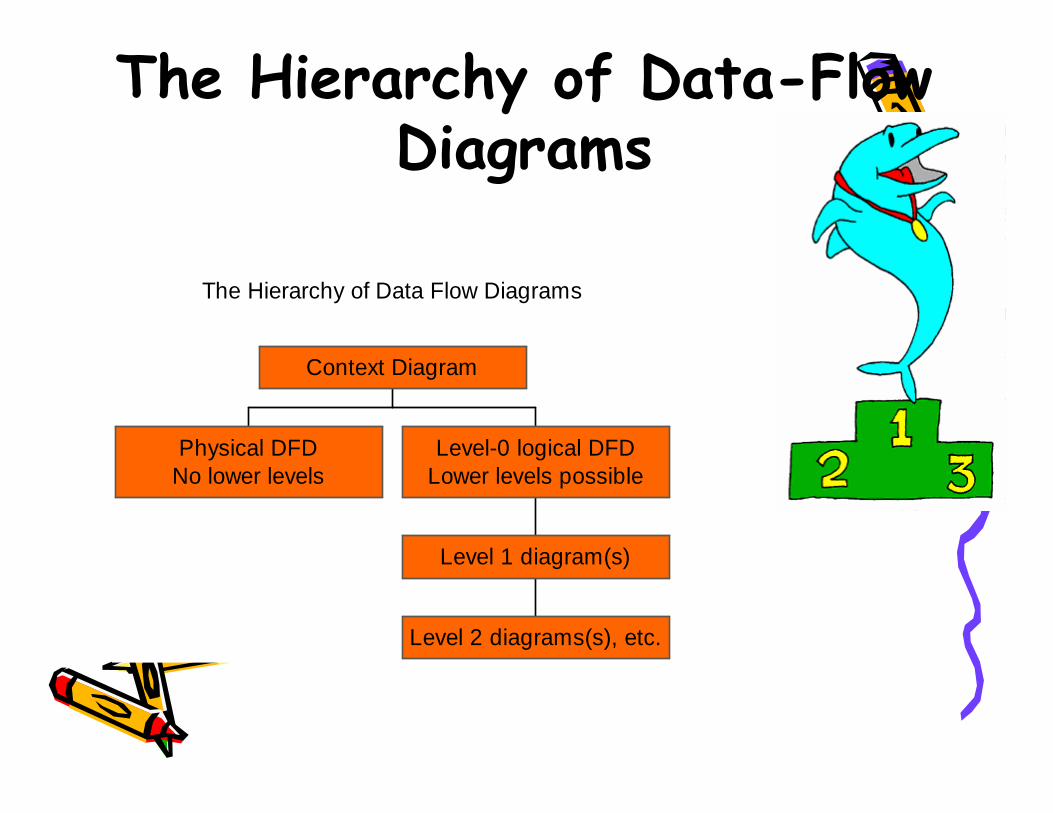
The Hierarchy of Data-Flow Diagrams
The Hierarchy of Data Flow Diagrams
Physical DFDNo lower levels
Level 2 diagrams(s), etc.
Level 1 diagram(s)
Level-0 logical DFDLower levels possible
Context Diagram