pengantar sig untuk mahasiswa - gadjah mada...
TRANSCRIPT

Taufik Hery Purwanto, S.Si., M.Si.Taufik Hery Purwanto, S.Si., M.Si.Laboratorium SIG Prodi Kartografi dan Penginderaan JauhLaboratorium SIG Prodi Kartografi dan Penginderaan Jauh
Jurusan Sains Informasi Geografis dan Pengembangan WilayahJurusan Sains Informasi Geografis dan Pengembangan WilayahFakultas GeografiFakultas Geografi Universitas Gadjah MadaUniversitas Gadjah Mada


Information has always been the cornerstone of effective decisions.
Spatial information is particularly complex as it requires two descriptors—Where is What

Longley, 2005

Non-Spasial Spasial
Sistem Informasi
Non-Geografi Sistem Informasi
CAD/CAM
Liputan Lahan Penduduk
Non-Geografi Sistem InformasiGeografis
Sosioekonomi ……..

GIS is fundamentally about solvingreal-world problems.real-world problems.

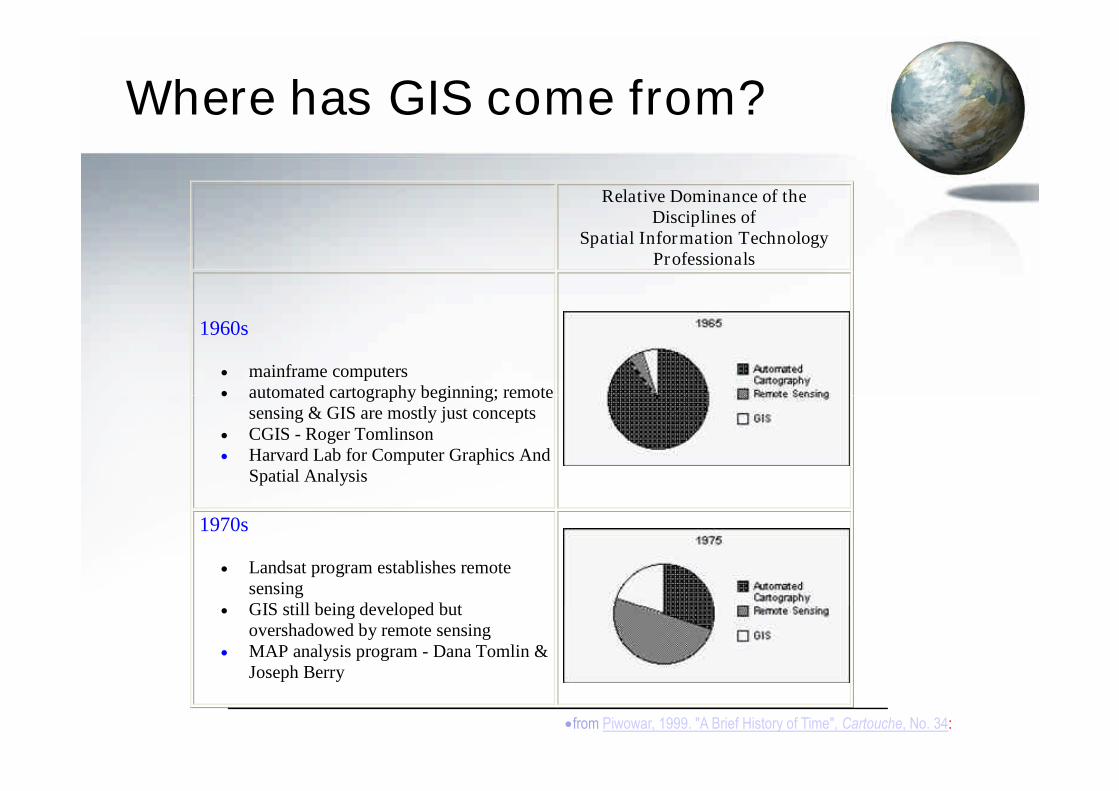
Where has GIS come from?
Relative Dominance of theDisciplines of
Spatial Information TechnologyProfessionals
1960s
mainframe computers automated cartography beginning; remote automated cartography beginning; remote
sensing & GIS are mostly just concepts CGIS - Roger Tomlinson Harvard Lab for Computer Graphics And
Spatial Analysis
1970s
Landsat program establishes remotesensing
GIS still being developed butovershadowed by remote sensing
MAP analysis program - Dana Tomlin &Joseph Berry
from Piwowar, 1999. "A Brief History of Time", Cartouche, No. 34:

Where has GIS come from?
1980s
GIS comes of age: ARC/INFO, GRASS,SPANS
IBM PC begins the desktop computingrevolution
Automated Cartography practitionersevolve into GIS practitioners
from Piwowar, 1999. "A Brief History of Time", Cartouche, No. 34:
evolve into GIS practitioners remote sensing seen by increasing
numbers as just another GIS data source

Where has GIS come from?
1990s
GIS dominates spatial informationtechnologies
GISs are now being used by people whohave no formal training in geography,cartography or remote sensing
o on one hand, this can be seen as ameasure of the success of GIS
o it should also be viewed as awarning flag that some of thiswarning flag that some of thisdevelopment may be happeningtoo quickly: sound principles ofmap design are frequently abusedin GIS output
"Geomatics" term adopted by theCanadian government to encompass allthe spatial information technologydisciplines
GPS becomes an important tool (seePiwowar, 1988. "A GPSPrimer",Cartouche, No. 27).
first-generation spatial data archives arebecoming obsolete (see Piwowar, 1988."Putting Your Data Out to Pasture",Cartouche, No. 29).

Where has GIS come from?
2000s
renewed interest in remote sensing as asuite of new generation of high-resolution and hyperspectral sensors arelaunched (see Piwowar, 1998. "RemoteSensing: The Next Generation",Cartouche, No. 28).
the emergence of seamlessly integrated"spatial information systems" whichembrace the traditional sub-disciplines ofcartography, remote sensing and GIS in acartography, remote sensing and GIS in aunified package
these new GISs will also become moreintegrated into our everyday lives so that,in many cases, we may not even be awarethat we are using a GIS (see Piwowar,1998. "2001: A Societal GIS Odyssey",Cartouche, No. 31 and Homes Online)
the internet (or its successors) willbecome the medium for spatial datadistribution and communication (seePiwowar, 1998. "Interactive Web MapPublishing", Cartouche, No. 30 and TheNational Atlas of Canada Online).
there will be a paradigm change in themap itself - virtual maps will become areality (see Virtual Cities ResourceCentre:www.casa.ucl.ac.uk/vc/cities.htm)


• Geographic Informationinformation about places on the earth's surfaceknowledge about "what is where“
• Geographic Information TechnologiesAutomated CartographyAutomated CartographyRemote Sensing (RS)Global Positioning Systems (GPS)Geographic Information Systems (GIS)
• GIS--what's in the S?Systems : teknologinyaScience : konsep dan teoriStudies : aplikasi (untuk membantu kehidupan manusia)
(Briggs, 1999)

System:Technology for the acquisition and management of spatialinformation
Science:Comprehending the under-laying conceptual issues ofrepresenting data and process in space-time.representing data and process in space-time.The science (or theory and concepts) behind the technology
Studies:Understanding the social, legal and ethical issues associated withthe application of GISy and GISc.
(Briggs, 1999)

GIS is an acronym for:
• Geographic Information Systems (US)
• Geographical Information Systems (UK, Aust.,Canada)
• Geographic Information Science (Academia)
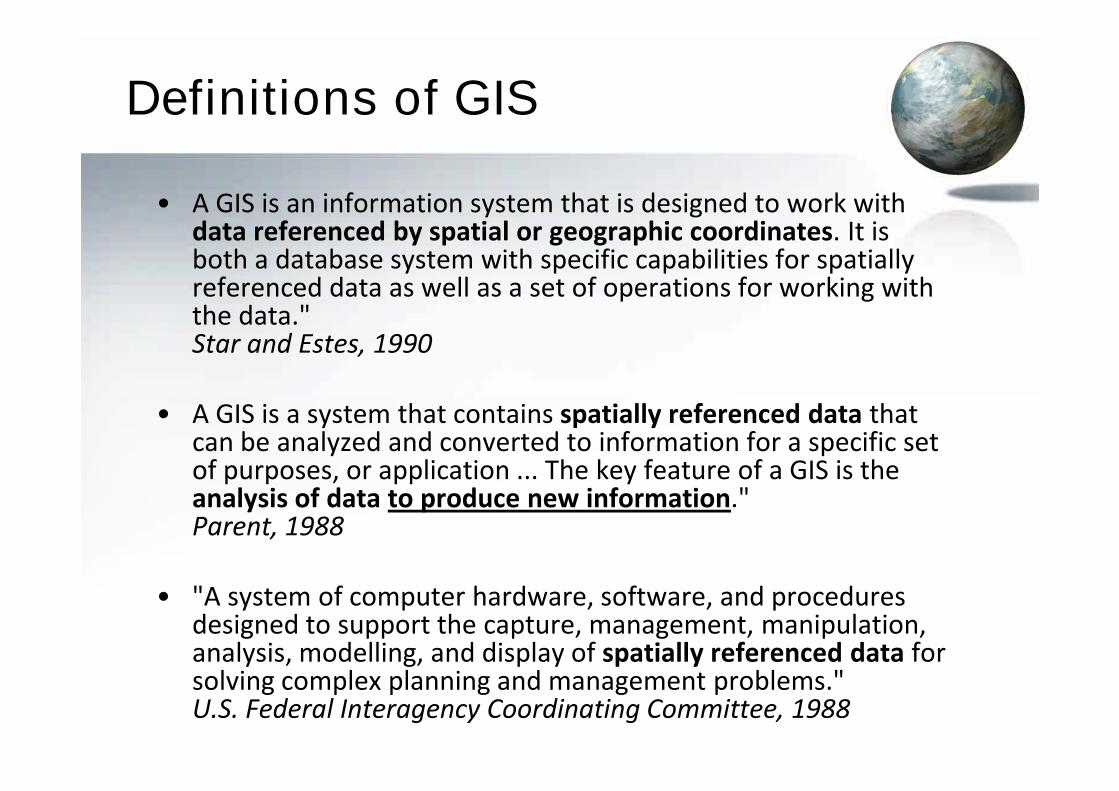
Definitions of GIS
• A GIS is an information system that is designed to work withdata referenced by spatial or geographic coordinates. It isboth a database system with specific capabilities for spatiallyreferenced data as well as a set of operations for working withthe data."Star and Estes, 1990
• A GIS is a system that contains spatially referenced data that• A GIS is a system that contains spatially referenced data thatcan be analyzed and converted to information for a specific setof purposes, or application ... The key feature of a GIS is theanalysis of data to produce new information."Parent, 1988
• "A system of computer hardware, software, and proceduresdesigned to support the capture, management, manipulation,analysis, modelling, and display of spatially referenced data forsolving complex planning and management problems."U.S. Federal Interagency Coordinating Committee, 1988

Definitions of GIS
• A GIS is a computer-based system that provides the followingfour sets of capabilities to handle georeferenced data:
input data management (data storage and retrieval) manipulation and analysis output output
Aronoff, 1989
• A geographic information system (GIS) integrates hardware,software, and data for capturing, managing, analyzing, anddisplaying all forms of geographically referencedinformation.ESRI, 1997

• ‘A powerful set of tools for collecting, storing, retrieving atwill, transforming and displaying spatial data from the realworld for a particular set of purposes’.Burrough and McDonnell, 1998.
Definitions of GIS
Burrough and McDonnell, 1998.
• ‘…tools that allow for the processing of spatial data intoinformation…and used to make decisions about, some portionof the earth’.De Mers, 1997.
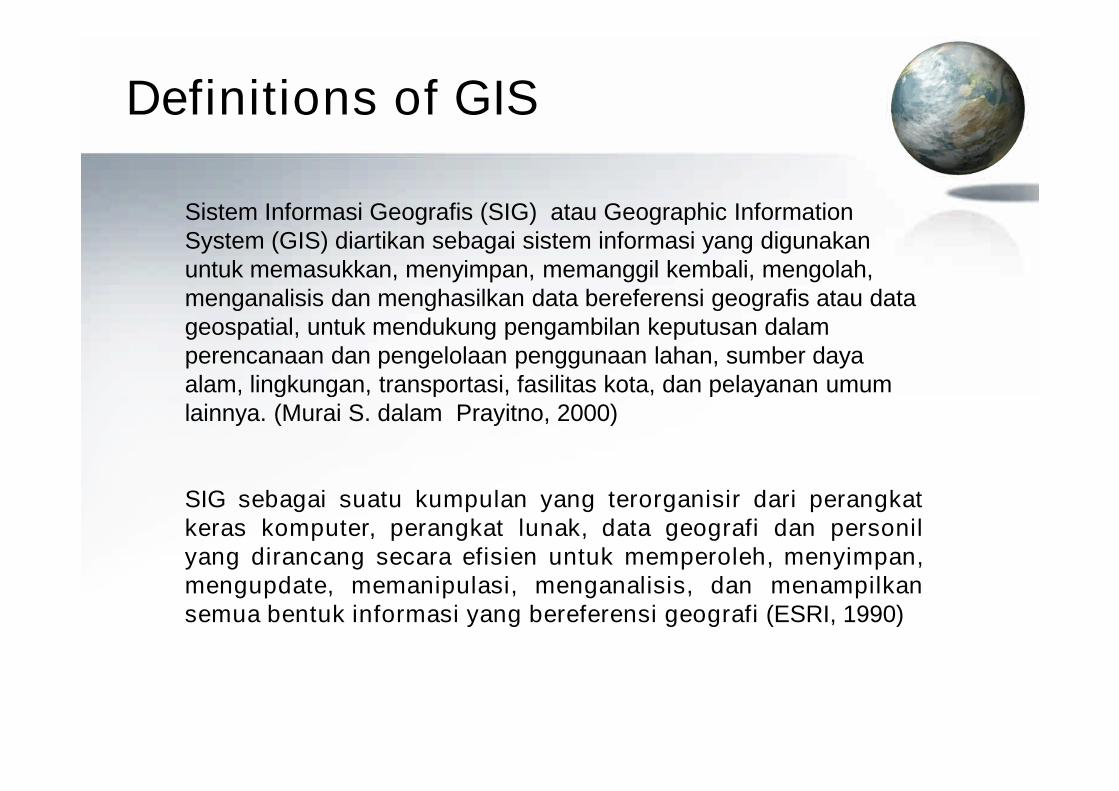
Sistem Informasi Geografis (SIG) atau Geographic InformationSystem (GIS) diartikan sebagai sistem informasi yang digunakanuntuk memasukkan, menyimpan, memanggil kembali, mengolah,menganalisis dan menghasilkan data bereferensi geografis atau datageospatial, untuk mendukung pengambilan keputusan dalamperencanaan dan pengelolaan penggunaan lahan, sumber dayaalam, lingkungan, transportasi, fasilitas kota, dan pelayanan umum
Definitions of GIS
alam, lingkungan, transportasi, fasilitas kota, dan pelayanan umumlainnya. (Murai S. dalam Prayitno, 2000)
SIG sebagai suatu kumpulan yang terorganisir dari perangkatkeras komputer, perangkat lunak, data geografi dan personilyang dirancang secara efisien untuk memperoleh, menyimpan,mengupdate, memanipulasi, menganalisis, dan menampilkansemua bentuk informasi yang bereferensi geografi (ESRI, 1990)

The GI Science–System cycle (after Fisher, 1998)

Teknologi Peranan teknologi dalam rangka peningkatan kemampuan teknologi GIS
Data Base Management System
(DBMS)
Menyimpan atribut untuk ditampilkan di GIS; Pelacakan data, penyortiran, penggabungan,
penambahan, memperbarui, restrukturisasi, terkait table dan field-field..
Computer Aided Design (CAD) Memperluas geometri data 2D menjadi data GIS 3D
Kemampuan dalam rendering.
Land Information System (LIS) Memperluas kemampuan GIS untuk survei tanah dan perekamannya dalam aspek
legal/hukum, administrasi dan untuk tujuan perencanaan dan pembangunan.
Automated Mapping/Facilities
Mapping (AM/FM)
Meningkatkan fungsi GIS dalam pemetaan automatis dan
peta pemeliharaan utilitas untuk umum seperti
air, drainase, gas dan listrik.
GPS Meningkatkan akurasi lokasi dan obyek
memverifikasi akurasi atribut dalam SIG;memverifikasi akurasi atribut dalam SIG;
Kemampuan dalam navigasi dan tracking/pelacakan.
Remote sensing and
Photogrammetry (RSP)
Integrasi fungsi-fungsi SIG dan analisis dan hasil pengolahan data dan analisis data
Sumber data Raster
Statistical Software (SS) Integrasi GIS dan prosedur statistik
Spatial Decision Support Systems
(SDSS)
Memperluas fungsi GIS untuk pengambilan keputusan
SES (Spatial Expert Systems) Mengintegrasikan kemampuan Expert Systems dan fungsi GIS
PSS (Planning Support Systems) Memperluas fungsi GIS untuk perencanaan
Multimedia Systems (MS) Meningkatkan visualisasi dari informasi geografi dengan penggunaan suara, video, gambar,
hypertext dan hotlink
Internet-based Systems (IS) Meningkatkan komunikasi, berbagi data (data sharing), joint task operation dan layanan
online GIS
Groupware Systems (GW) Mengaktifkan beberapa pengguna (multiple users) di lokasi yang berbeda
untuk melakukan tugas-tugas yang terkait dengan perencanaan dan pengambilan keputusan


35.000 tahun
yang lalu, di dinding guaLascaux, Perancis, parapemburu Cro-Magnonmenggambar hewanmangsa mereka, jugagaris yang dipercayasebagai rute migrasihewan-hewan tersebut.hewan-hewan tersebut.Catatan awal ini sejalandengan dua elemenstruktur pada sisteminformasi gegrafismodern sekarang ini,arsip grafis yangterhubung ke databaseatribut.
http://id.wikipedia.org/wiki/Sistem_informasi_geografis

Today, biologists usecollar transmitters andsatellite receivers totrack the migrationroutes of caribou andpolar bears to helpdesign programs toprotect the animals. In aGIS, the migration routeswere indicated bywere indicated bydifferent colors for eachmonth for 21 months (fig.2). Researchers thenused the GIS tosuperimpose themigration routes on mapsof oil development plansto determine the potentialfor interference with theanimals.
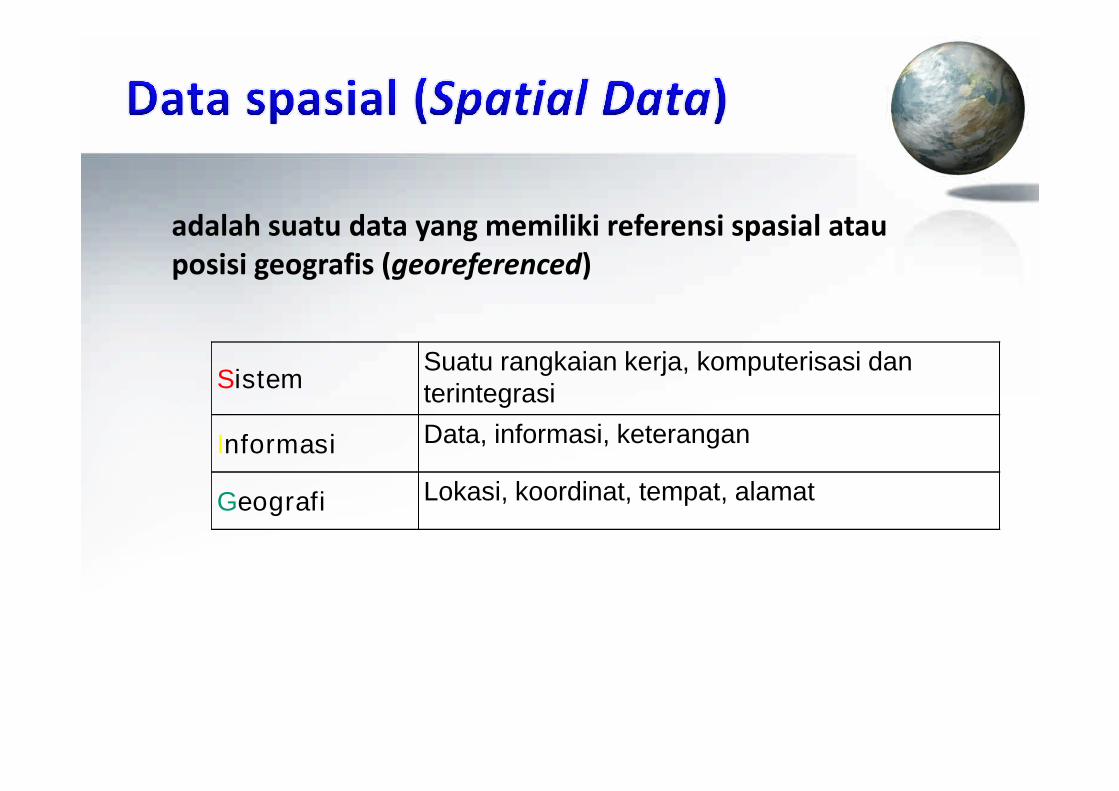
adalah suatu data yang memiliki referensi spasial atauposisi geografis (georeferenced)
SistemSuatu rangkaian kerja, komputerisasi danterintegrasiterintegrasi
Informasi Data, informasi, keterangan
Geografi Lokasi, koordinat, tempat, alamat

Spasial adalah aspek keruangan suatu objek atau kejadian yang mencakuplokasi, letak, dan posisinya.
Geospasial atau ruang kebumian adalah aspek keruangan yang menunjukkanlokasi, letak, dan posisi suatu objek atau kejadian yang berada di bawah,pada, atau di atas permukaan bumi yang dinyatakan dalam sistemkoordinat tertentu.
Data Geospasial adalah data tentang lokasi geografis, dimensi atau ukuran,Data Geospasial adalah data tentang lokasi geografis, dimensi atau ukuran,dan/atau karakteristik objek alam dan/atau buatan manusia yang beradadi bawah, pada, atau di atas permukaan bumi.
Informasi Geospasial adalah Data Geospasial yang sudah diolah sehingga dapatdigunakan sebagai alat bantu dalam perumusan kebijakan, pengambilankeputusan, dan/atau pelaksanaan kegiatan yang berhubungan denganruang kebumian

++
Information SystemInformation System
=
A means of storing, retrieving,sorting, and comparing spatialspatialdatadata to support some analyticprocess.
++Geographic PositionGeographic Position
=
to producenew information
accuratedecisionmaking


– explicit geographic reference, is absolutely tied to the earthsuch as a latitude and longitude or national grid coordinate.Data from GPS units.
– implicit geographic reference such as an address, postal
Geographic referencing
– implicit geographic reference such as an address, postalcode, census tract name, forest stand identifier, road nameor county, can be included by joining tables or using anautomated process called "geocoding."

Contoh
34°26'41.00"N
119°48'26"W

Contoh6°29'30.00"S
106°50'58.00“E

• 80% of all information held in databases anywherein the world contains some kind of geographicelement, Ron Brigs, 1997.
• an estimated 90% of all information used by• an estimated 90% of all information used bygovernment has spatial characteristics or attributesJoep Crompvoets, 2003.
• Data from most sciences can be analyzed“spatially” (ESRI)


DATA SIG(Geographical
data)
Link
REAL WORLD
Data AttributRaster
DATA SPASIAL (SIG)
QualitativeData
Link
- Siapa/Apa ….. ?(What is at …. ?)
- Dimana ……. ?(Where is it … ?)
Grafis(Geometric Data)
• Titik (Point)• Garis (Arc/Line)• Poligon (region/Polygon)• Permukaan (Surface)
Data Attribut(Attribute Data)mis.: *.dbf
Smart Map(linking a database to the map)
Vektor
Data
QuantitativeData− Ordinal− Interval− Ratio

Components of geographic data
• Three general components to geographic information
Streets
Attributes Geometry Behavior
Rules
Streets andhighways maynot intersect

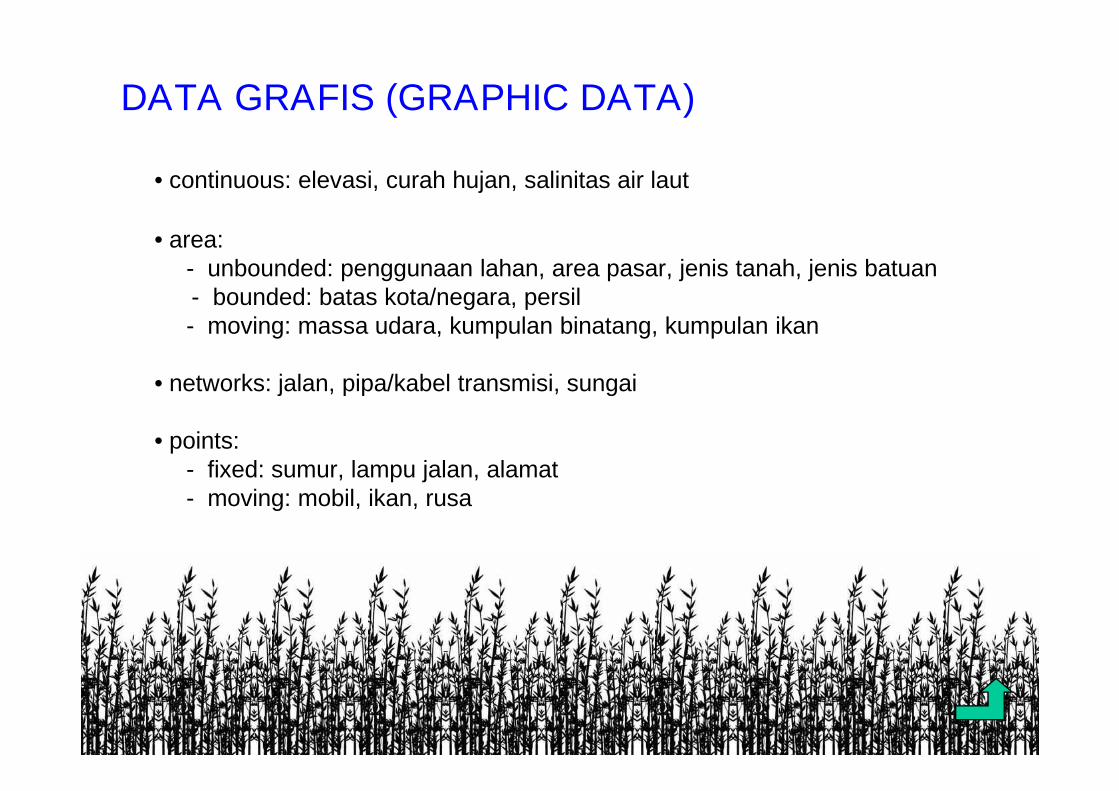
• continuous: elevasi, curah hujan, salinitas air laut
• area:- unbounded: penggunaan lahan, area pasar, jenis tanah, jenis batuan- bounded: batas kota/negara, persil- moving: massa udara, kumpulan binatang, kumpulan ikan
• networks: jalan, pipa/kabel transmisi, sungai
DATA GRAFIS (GRAPHIC DATA)
• networks: jalan, pipa/kabel transmisi, sungai
• points:- fixed: sumur, lampu jalan, alamat- moving: mobil, ikan, rusa
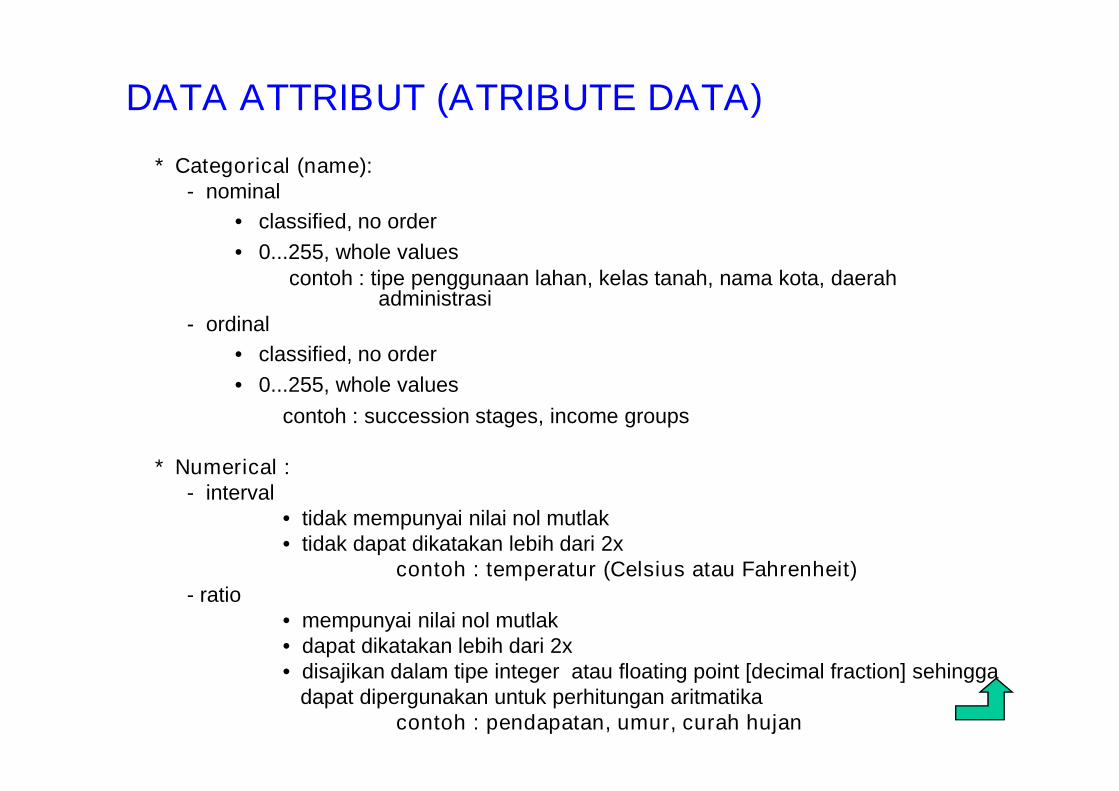
* Categorical (name):- nominal
• classified, no order
• 0...255, whole valuescontoh : tipe penggunaan lahan, kelas tanah, nama kota, daerah
administrasi- ordinal
• classified, no order
• 0...255, whole values
DATA ATTRIBUT (ATRIBUTE DATA)
• 0...255, whole values
contoh : succession stages, income groups
* Numerical :- interval
• tidak mempunyai nilai nol mutlak• tidak dapat dikatakan lebih dari 2x
contoh : temperatur (Celsius atau Fahrenheit)- ratio
• mempunyai nilai nol mutlak• dapat dikatakan lebih dari 2x• disajikan dalam tipe integer atau floating point [decimal fraction] sehingga
dapat dipergunakan untuk perhitungan aritmatikacontoh : pendapatan, umur, curah hujan


data typedescriptionattributes
domain example
boolean boolean 0 (false), 1 (true)suitable/unsuitable, visible/non visible
nominal classified, no order0...255, wholevalues
soil classes,administrativeregions
ordinal classified, order0...255, wholevalues
succession stages,income groups
-scalar continuous, lineair
-10exp(37)...10exp(37), real values
elevation,temperature
directionalcontinuous,directional
0 to 2 pi (radians),or to 360 (degrees),and -1 (nodirection), realvalues
aspect
lddlocal drain directionto neighbour cell
1...9 (codes ofdrain directions)
drainage networks,wind directions


• Vector – points, lines andpolygons
• Raster – gridded, classifiedspace


Representations of Geographic Data
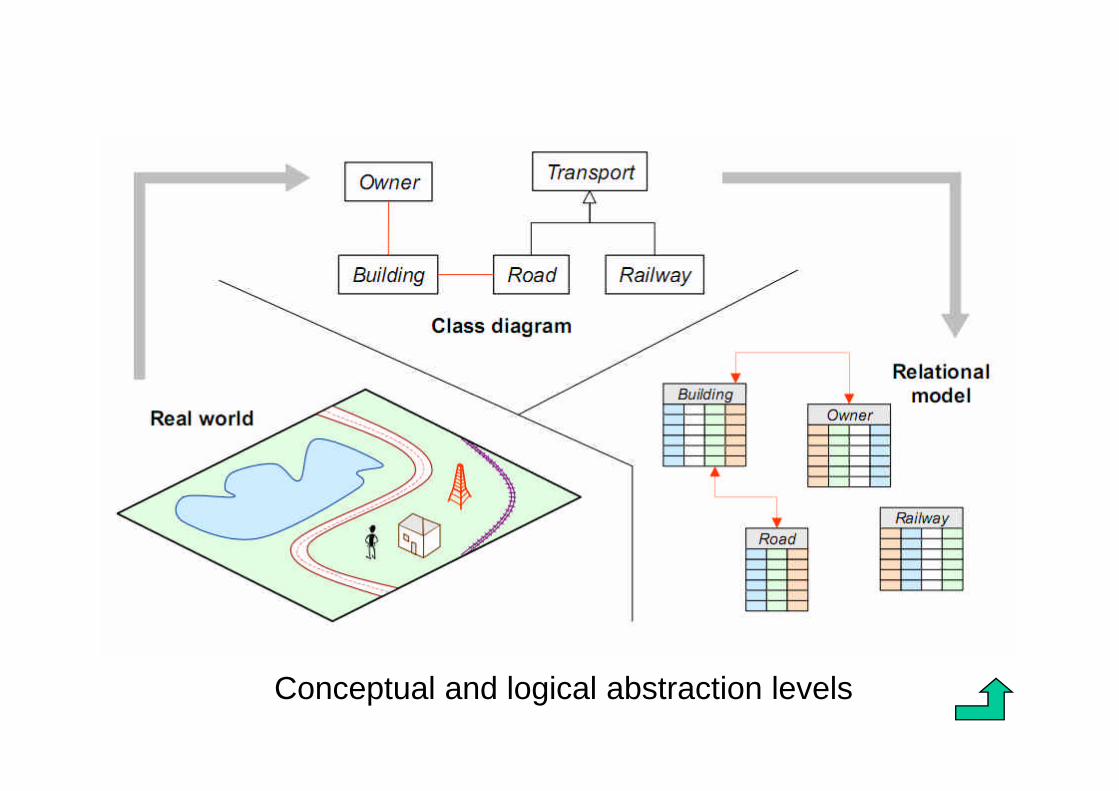
Conceptual and logical abstraction levels

STRUKTUR DATA VEKTOR

* Titik (node/point): 0-dimension• koordinat tunggal (x,y)• area/luasan nol
contoh : pohon, sumur minyak, penempatanlabel
* Garis (arc/line): 1-dimension 2
1
2
7 8
x=7 Point: 7,2
y=2
1
2
7 8
STRUKTUR DATA VEKTOR
* Garis (arc/line): 1-dimension• dua ( atau lebih ] koordinat x,y yang
dihubungkan
contoh : jalan, sungai
* Poligon (polygon/region) : 2-dimensions• empat atau lebih koordinat x,y yang
dihubungkan• koordinat awal dan akhir sama• area yang tertutup
Contoh : daerah/propinsi, danau
Line: 7,2 8,11
2
7 8
Polygon: 7,2 8,1 7,1 7,2
1
2
7 8

STRUKTUR DATA RASTER

STRUKTUR DATA RASTER
• Header : berisi informasi penting mengenai kode file, jumlah banddata yang dikandung, baris, kolom, tipe data, dan sebagainya.
• Data : blok data layer raster.
• Ancillary : berisi informasi tambahan yang biasanya meliputi datastatistik citra yang bersangkutan.
• Layer raster disimpan dalam format standar BIP (band-interleavedby pixel), BIL (band-interleaved by line), dan BSQ (BandSequential), serta fomat kompresi RLE (run-length encoding)

STRUKTUR DATA RASTER
Contoh penyimpanan Layer(s) Raster:Contoh penyimpanan Layer(s) Raster:


Raster Vector
Advantages
Good for complex analysisEfficient for overlaysData structure common forimagery
Compact data structureEfficient for encodingtopologyTrue representation of
imageryTrue representation ofshape
DisadvantagesLarge datasetsTopology hard to representMaps less "realistic"
Complex structureOverlay operations difficultMight imply false sense ofaccuracy

KONSEP LAYER PADA DATA SIG

Source: GAO (2004), p. 5.


7 (tujuh) fenomena geografis

1. Perangkat keras (hardware)Komputer (komputer tunggal, komputer sistem jaringan dengan server,komputer dengan jaringan global internet) dan periperalnya. Perangkaat kerasuntuk SIG mepliputi perangkat keras : pemasukan data, pemrosesan data,dan penyajian hasil, serta peyimpanan (storage).
2. Perangkat Lunak (software)Perangkat lunak yang mempunyai fungsi di atas dan fasilitas untukpenyimpanan, analisis, dan penayangan informasi geografi. Persyaratan yangpenting harus dipenuhi software SIG, adalah :merupakan DatabaseManagement System (DBMS), fasilitas untuk pemasukan dan manipulasi datageografis, fasilitas untuk query, analisis , dan visualisasi,Graphical UserInterface (GUI) yang baik untuk mempermudah akses fasilitas yang ada.
3. Data (Data)3. Data (Data)Data merupakan komponen yang penting dalam SIG. Keakurasian datadituntut dalam SIG. Dikenal konsep GIGO (Garbage In Garbage Out)sebaliknya Gold In Gold Out.
4. Sumberdaya Manusia (people)Teknologi SIG menjadi sangat terbatas kemampuannya jika tidak adasumberdaya yang mengelola sistem dan mengembangkan untuk aplikasi yangsesuai. Pengguna dan pembuat sistem harus saling bekerjasama untukmengembangkan teknologi SIG.
5. Metode (methods)Model dan teknik pemrosesan perlu dibuat untuk berbagai aplikasi SIG.
6. NetworkWith rapid development of IT, today the most fundamental of these is probablythe network, without which no rapid communication or sharing of digitalinformation could occur. GIS today relies heavily on the Internet, acquiring andsharing large geographic data sets.
Paul A. Longley University College London, UK, 2005


?
InformationManagement
1970 1980 1990 2000
Internet
EraKomputer/
GIS
EVOLUSI PEMANFAATAN DATA SPASIALEVOLUSI PEMANFAATAN DATA SPASIAL
SDI 2
1970 1980
SIG SDI 1
SistemmenggunakanPeta Cetak
Spatial InformationManagement
1970 1980 1990 2000
Era ICT
Pemetaan DigitalSeamless/Scalable/Multi-dimensional
1970 1980
PemetaanKonvensional
1:25K
1:100K1:250K

"The Model-driven Approach to Geographic Information System Standardisation- Lessons Learned - "Dr. Arne J. Berre SINTEF, Oslo, Norway, SINTEF


• Scientific visualization and computergraphics will be increasingly integrated withGIS capabilities
• Animated maps
• Interactive maps
• Augmented reality


MANAJEMEN INFORMASI (GEO)SPASIAL
Tahapan SIG Pekerjaan Manual
Penyimpanan Database digital dan terpadu Skala dan standart berbeda
Perbandingan dalam manajemen Informasi Geospasial
Penyimpanan Database digital dan terpadu Skala dan standart berbeda
Pemanggilan kembali Pencarian dengan komputer Cek manual
Pemuktahiran Sistematis Mahal dan memakan waktu
Analisis data Attribut Sangat cepat Memakan waktu dan tenaga
Analisis data spasial Mudah Rumit
Penyangan Murah dan cepat Mahal

The following matrix is a comparison of digital andmanual mapping with respect to key activities:
ACTIVITIES: DIGITAL MAPPING PAPER MAPPING
PREPARATION Initial version tedious to prepare butquick and efficient to monitor
Start from scratch every time
STORAGE Digital Database Standardized andintegrated, compact memorycapacity
Different scales on differentstandards, voluminous and bulky
RETRIEVAL Quick retrieval Paper maps and tablesRETRIEVAL Quick retrieval Paper maps and tables
UPDATING Automatic search and replace bycomputer
Manual check and revision
OVERLAY Systematically doneFaster integration of complex,multiple spatial and non spatial datasets
Expensive and time consuming
SPATIAL ANALYSIS Faster Time and energy consuming,slow
DISPLAY Easier and faster to prepareBetter quality Slow
Tedious and time-consuming

1. Analysis of spatial data in a complex environment2. Ability to integrate different databases into one
environment3. Ability to display and manage spatial data in a
spatial contextspatial context4. Rapid production of specialized maps and graphic
products5. Performs complex spatial analysis

1. better work flow;
2. higher quality information for decision-making;
3. better integration among different offices /departments;
4. quicker access to information;
5. more efficient information dissemination.
All these lead to possible cost reduction and cost effectiveness.


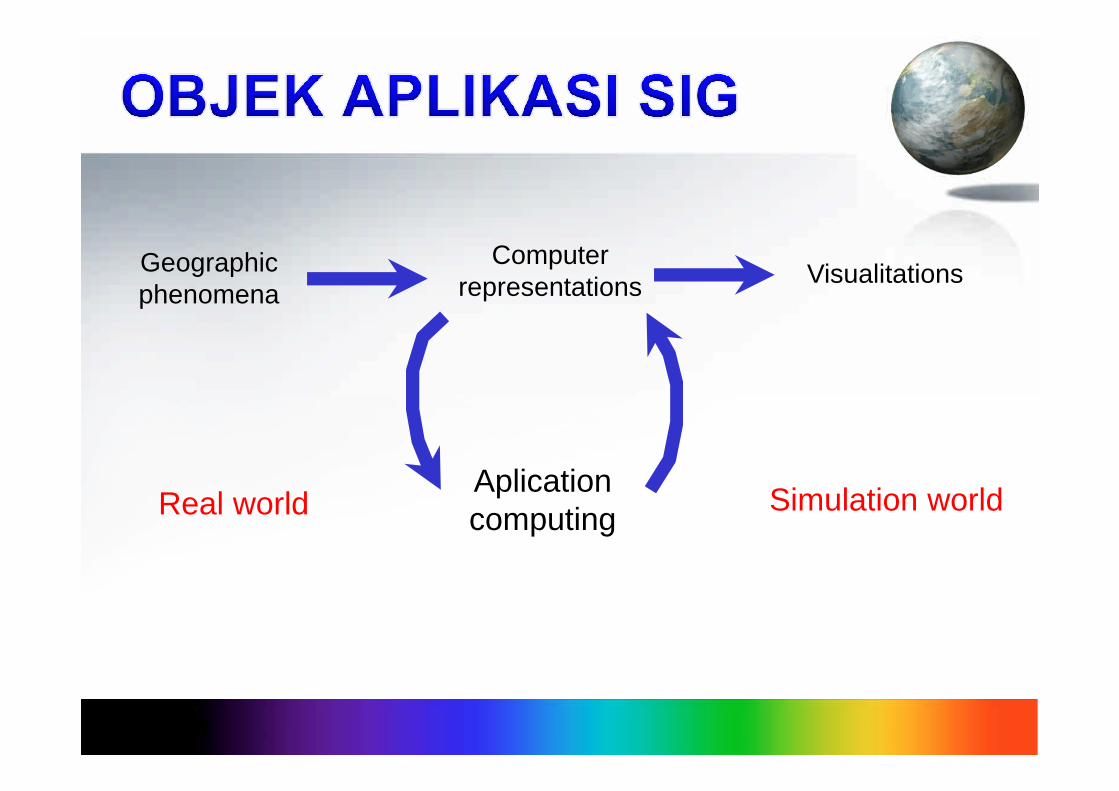
Geographicphenomena
Computerrepresentations Visualitations
Real worldAplicationcomputing
Simulation world

In order to bring the real world into GIS, one has to makeuse of simplified models of the real world (Bernhardsen)

DATA MODEL
Modelling process. The transformation of the real world into GISproducts is achieved by means of simplification and models(Bernhardsen)
DATA MODEL
DATA BASE
MAP WITH SYMBOLS


1. Data Retrieval
2. Map Generalization
3. Map Abstractions
4. Map Sheet Manipulation
5. Buffer Generation
6. Polgygon Overlay And Dissolve
7. Grid Cell Analysis - Network Analysis
8. Measurement
9. Digital Terrain Analysis, And
10. Output Techniques


• Peta (Map Layout)
• Tabel (Tables)
• Grafik (Chart)
• Laporan (Report)
• Kombinasinya
Hardcopy/Softcopy
• Kombinasinya


1. Pengukuran (Measurement)
2. Pemetaan (Mapping)
3. Pemantauan (Monitoring)
4. Pembuatan Model (Modelling)
Data PJ
SurveyLapangan
Pengolahan CitraManual/Digital
Peta/Data Sekunder:Topografi, Geologi, Tanah, dll.
InformasiMutakhir
Editing, Transformasi,Tagging
InformasiSekunder
4. Pembuatan Model (Modelling)
(Estes, 1990)Integrasi
Pemetaan,Inventarisasi
Pemantauan,Monitoring
Evaluasi
PembuatanModel
PerubahanPeng. Lahan
Kebakaranhutan
KemampuanLahan
Prediksi
Site Selection Kekeringan
Pemetaan


T E R I M A K A S I HT E R I M A K A S I H