optimasi ekonomi manajerial s5
DESCRIPTION
Optimasi Ekonomi Manajerial S5TRANSCRIPT

OPTIMASI EKONOMI
OLEH:FIEN ZULFIKARIJAH

Michael R. Baye, Managerial Economics and Business Strategy, 3e. ©The McGraw-Hill
Companies, Inc. , 1999
TEORI PERUSAHAAN
• Perusahaan adalah kombinasi dari berbagai sumberdaya
• Tujuan perusahaan adalah memperoleh keuntungan
• Adanya ketidakpastian menyebabkan perusahaan bergeser untuk memaksimalkan kekayaan /nilai

Michael R. Baye, Managerial Economics and Business Strategy, 3e. ©The McGraw-Hill
Companies, Inc. , 1999
Pengertian nilai• Nilai perusahaan adalah nilai sekarang (PV) darialiran
kas suatu perusahaan yang diharapkan akan diterima di masa yang akan datang
• Present value (PV) of an amount (FV) to be received at the end of “n” periods when the per-period interest rate is “i”:
PVFV
i n1

Michael R. Baye, Managerial Economics and Business Strategy, 3e. ©The McGraw-Hill
Companies, Inc. , 1999
Present Value of a Series
• Present value of a stream of future amounts (FVt) received at the end of each period for “n” periods:
PVFV
i
FV
i
FV
inn
11
221 1 1. . .

Michael R. Baye, Managerial Economics and Business Strategy, 3e. ©The McGraw-Hill
Companies, Inc. , 1999
Net Present Value• Suppose a manager can purchase a stream of
future receipts (FVt ) by spending “C0” dollars today. The NPV of such a decision is
NPV CFV
i
FV
i
FV
inn
011
221 1 1. . .
NPV < 0: RejectNPV > 0: Accept

Michael R. Baye, Managerial Economics and Business Strategy, 3e. ©The McGraw-Hill
Companies, Inc. , 1999
KENDALA DALAM TEORI PERUSAHAAN
• Accounting Profits– Total revenue (sales) minus dollar cost of
producing goods or services– Reported on the firm’s income statement
• Economic Profits– Total revenue minus total opportunity cost

Michael R. Baye, Managerial Economics and Business Strategy, 3e. ©The McGraw-Hill
Companies, Inc. , 1999
• Accounting Profits– Total revenue (sales) minus dollar cost of
producing goods or services– Reported on the firm’s income statement
• Economic Profits– Total revenue minus total opportunity cost
Michael R. Baye, Managerial Economics and Business Strategy, 3e. ©The McGraw-Hill
Companies, Inc. , 1999
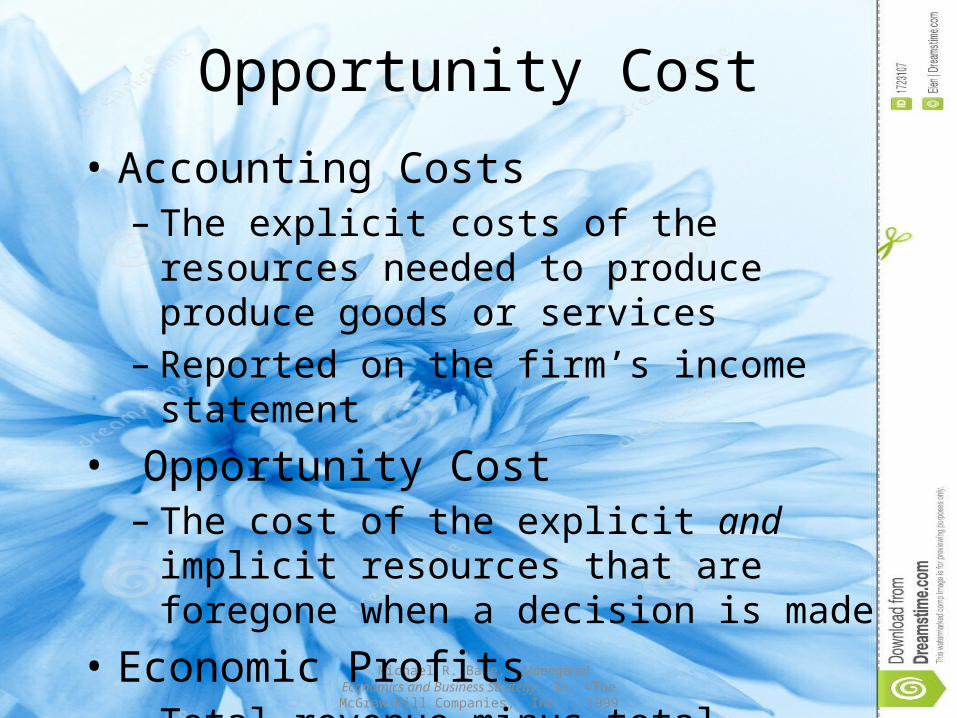
Opportunity Cost
• Accounting Costs– The explicit costs of the resources needed to
produce produce goods or services– Reported on the firm’s income statement
• Opportunity Cost– The cost of the explicit and implicit resources
that are foregone when a decision is made• Economic Profits– Total revenue minus total opportunity cost

Michael R. Baye, Managerial Economics and Business Strategy, 3e. ©The McGraw-Hill
Companies, Inc. , 1999
Market Interactions• Consumer-Producer Rivalry– Consumers attempt to locate low prices, while
producers attempt to charge high prices• Consumer-Consumer Rivalry– Scarcity of goods reduces the negotiating power of
consumers as they compete for the right to those goods
• Producer-Producer Rivalry– Scarcity of consumers causes producers to compete
with one another for the right to service customers• The Role of Government– Disciplines the market process
Michael R. Baye, Managerial Economics and Business Strategy, 3e. ©The McGraw-Hill
Companies, Inc. , 1999
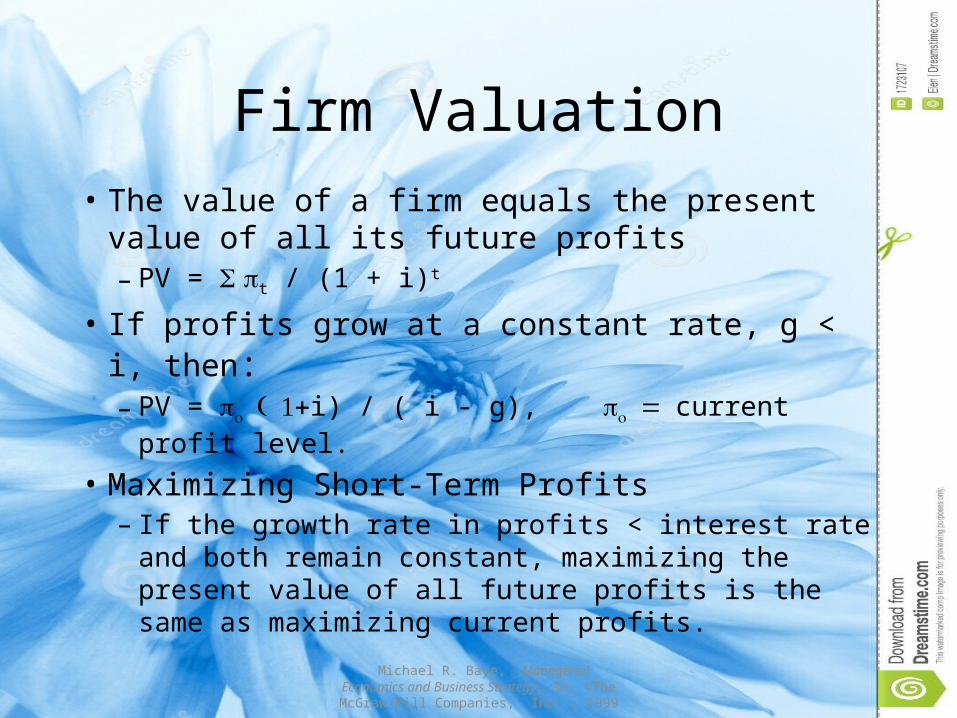
Firm Valuation• The value of a firm equals the present value of
all its future profits– PV = S pt / (1 + i)t
• If profits grow at a constant rate, g < i, then:– PV = po ( 1+i) / ( i - g), po = current profit level.
• Maximizing Short-Term Profits– If the growth rate in profits < interest rate and both
remain constant, maximizing the present value of all future profits is the same as maximizing current profits.

Michael R. Baye, Managerial Economics and Business Strategy, 3e. ©The McGraw-Hill
Companies, Inc. , 1999
• Control Variables– Output– Price– Product Quality– Advertising– R&D
• Basic Managerial Question: How much of the control variable should be used to maximize net benefits?
Marginal (Incremental) Analysis

Michael R. Baye, Managerial Economics and Business Strategy, 3e. ©The McGraw-Hill
Companies, Inc. , 1999
Net Benefits
• Net Benefits = Total Benefits - Total Costs• Profits = Revenue - Costs
Michael R. Baye, Managerial Economics and Business Strategy, 3e. ©The McGraw-Hill
Companies, Inc. , 1999
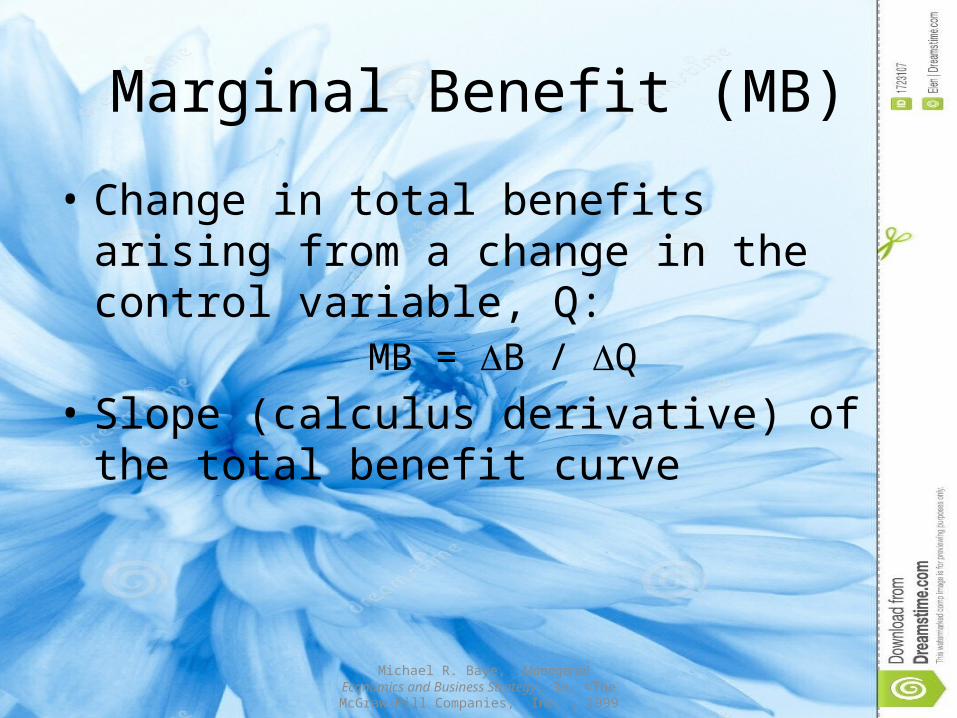
Marginal Benefit (MB)
• Change in total benefits arising from a change in the control variable, Q:
MB = DB / DQ• Slope (calculus derivative) of the total benefit
curve
Michael R. Baye, Managerial Economics and Business Strategy, 3e. ©The McGraw-Hill
Companies, Inc. , 1999
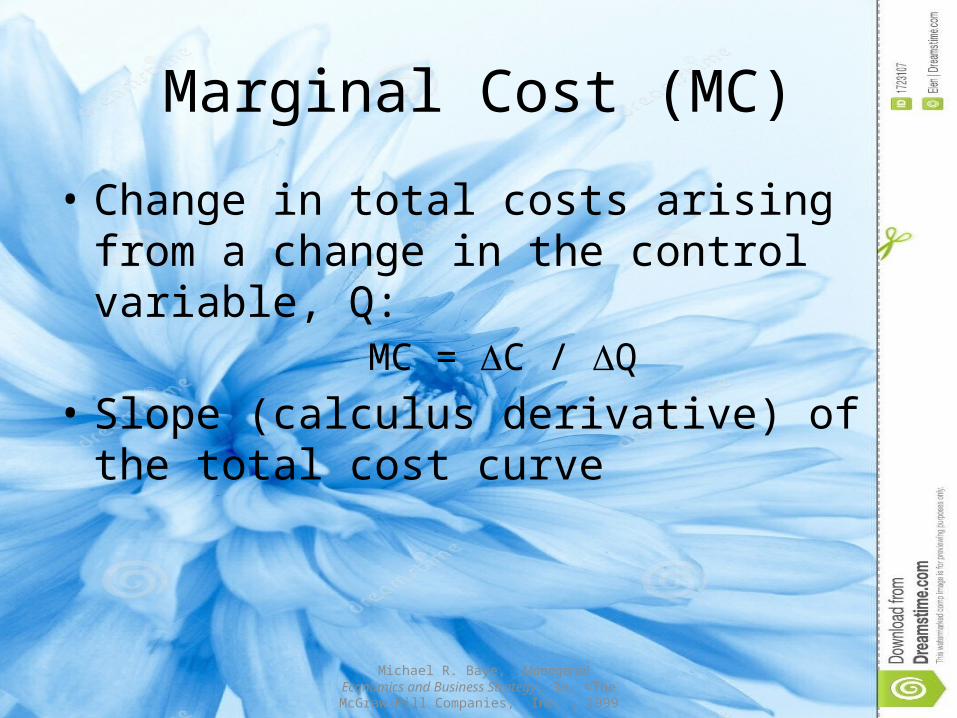
Marginal Cost (MC)
• Change in total costs arising from a change in the control variable, Q:
MC = DC / DQ• Slope (calculus derivative) of the total cost
curve

Michael R. Baye, Managerial Economics and Business Strategy, 3e. ©The McGraw-Hill
Companies, Inc. , 1999
Marginal Principle
• To maximize net benefits, the managerial control variable should be increased up to the point where MB = MC
• MB > MC means the last unit of the control variable increased benefits more than it increased costs
• MB < MC means the last unit of the control variable increased costs more than it increased benefits

Michael R. Baye, Managerial Economics and Business Strategy, 3e. ©The McGraw-Hill
Companies, Inc. , 1999
The Geometry of Optimization
Q
Benefits & CostsBenefits
Costs
Q*
B
CSlope = MC
Slope =MB
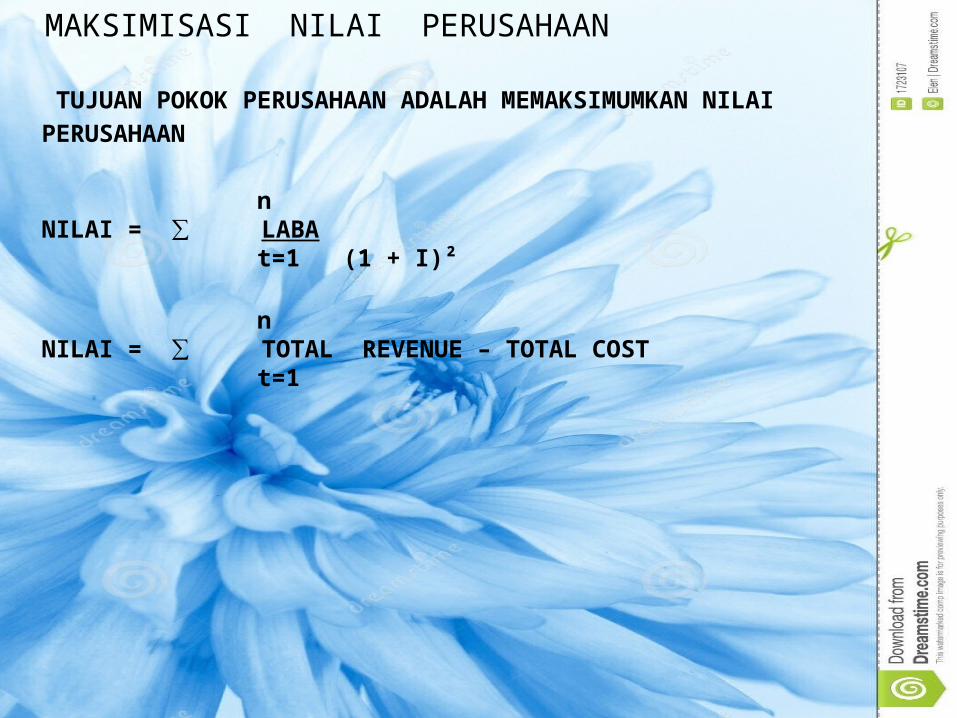
MAKSIMISASI NILAI PERUSAHAAN
TUJUAN POKOK PERUSAHAAN ADALAH MEMAKSIMUMKAN NILAI
PERUSAHAAN
nNILAI = ∑ LABA t=1 (1 + I)²
nNILAI = ∑ TOTAL REVENUE – TOTAL COST t=1
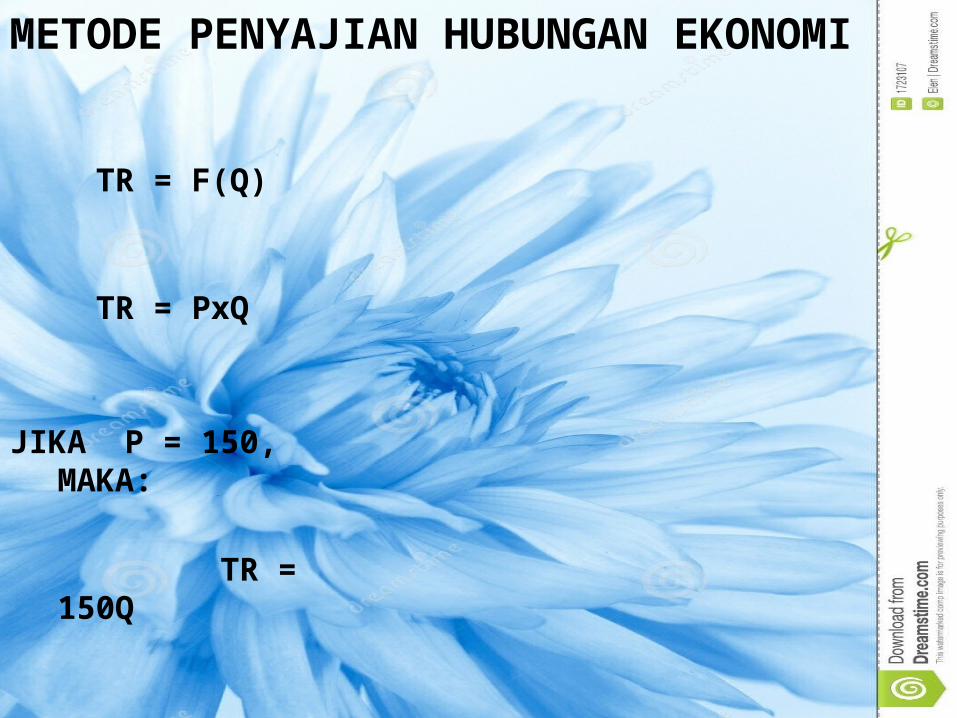
METODE PENYAJIAN HUBUNGAN EKONOMI
TR = F(Q) TR = PxQ
JIKA P = 150, MAKA:
TR = 150Q
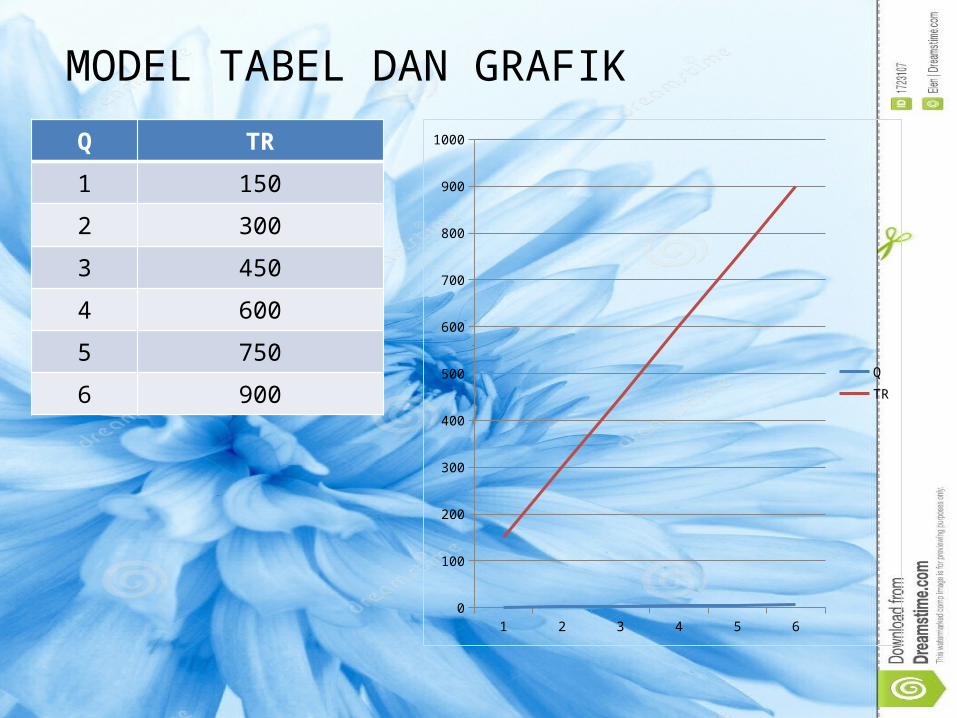
MODEL TABEL DAN GRAFIKQ TR
1 150
2 300
3 450
4 600
5 750
6 900
1 2 3 4 5 60
100
200
300
400
500
600
700
800
900
1000
QTR

HUBUNGAN ANTARA NILAI TOTAL, RATA-RATA DAN MARGINAL
A. HUBUNGAN ANTARA NILAITOTAL DANMARGINAL
Q LABA TOTAL LABA MARGINAL
LABA RATA-RATA
1 0 - -
2 19 19 19
3 52 33 26
4 93 41 31
5 136 43 34
6 175 39 35
7 210 35 35
8 217 7 21
9 208 -9 26
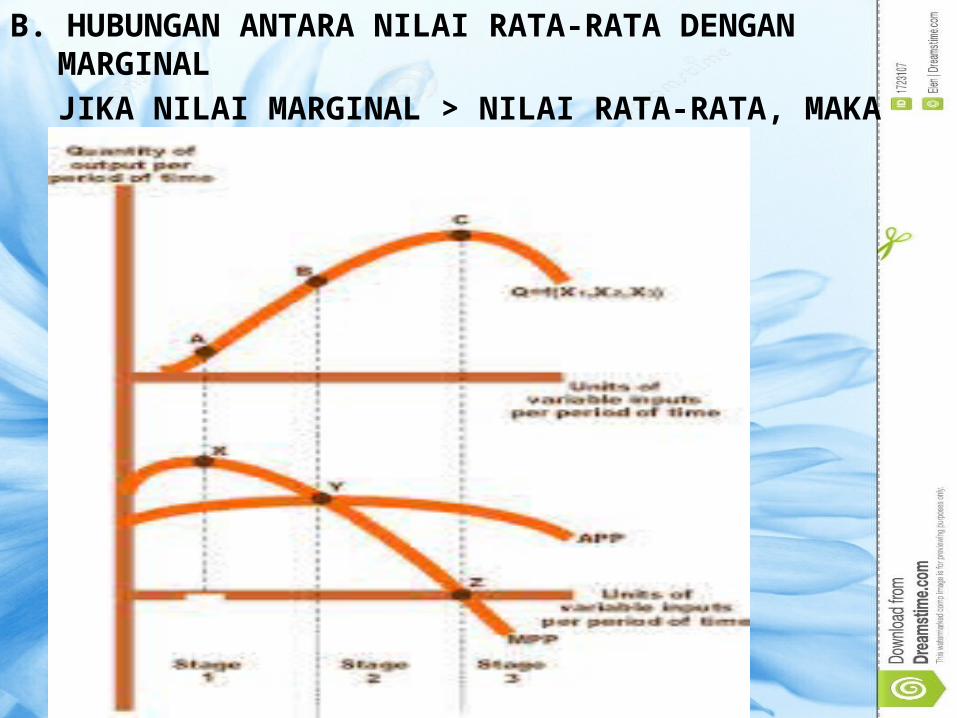
B. HUBUNGAN ANTARA NILAI RATA-RATA DENGAN MARGINALJIKA NILAI MARGINAL > NILAI RATA-RATA, MAKA NILAI RATA-RATA SEDANG NAIK

C. KALKULUS DIFFERENSIAL
Y =f(X)
marginal Y = dY/dX
dY = Y2 – Y1/X2 –X1
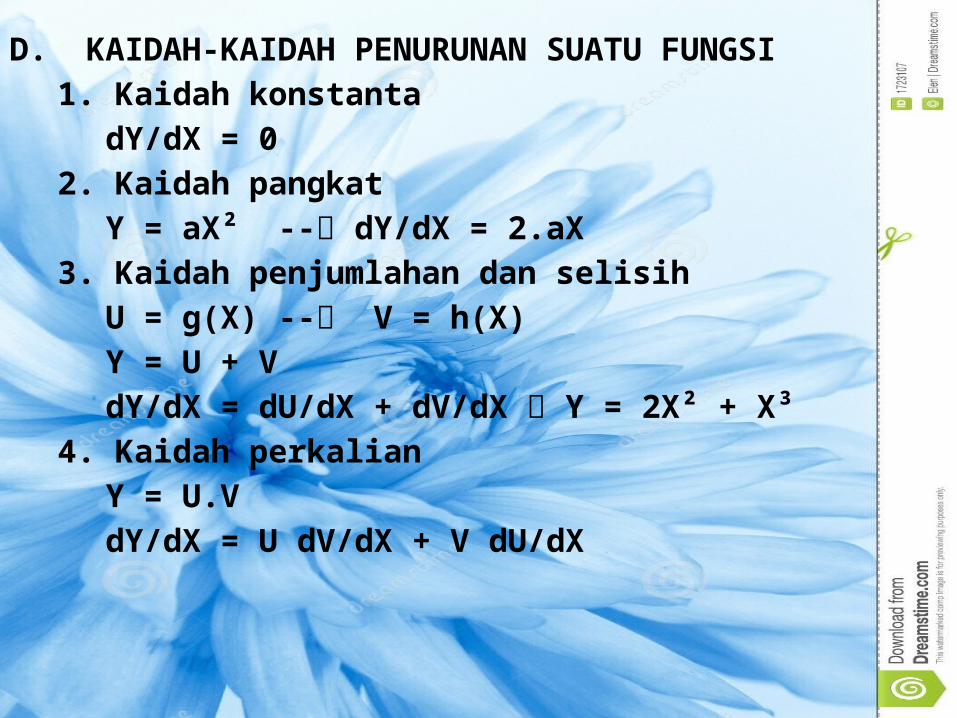
D. KAIDAH-KAIDAH PENURUNAN SUATU FUNGSI1. Kaidah konstanta
dY/dX = 02. Kaidah pangkat
Y = aX² -- dY/dX = 2.aX
3. Kaidah penjumlahan dan selisih
U = g(X) -- V = h(X)
Y = U + V
dY/dX = dU/dX + dV/dX Y = 2X² + X³
4. Kaidah perkalian
Y = U.V
dY/dX = U dV/dX + V dU/dX

4. Kaidah perkalian
Y = U.V
dY/dX = U dV/dX + V dU/dX
contoh:
Y = 3X²(3-X)
dY/dX = 3X²(dV/dX) + (3-X) (dU/dX)
= 3X²(-1) + (3-X) (6X)
= 3X² + 18X -6X² = 18X – 9X²

5. Kaidah hasil bagi
Y = U/V
dY/dX = V dU/dX - U dV/dX
V²
contoh:
Y = 2X – 3
6X²
dY/dX = 6X².2 – (2X- 3) 12X
36X
= 12X² - 24X² + 36X
36X
= 36X - 12X²
3X³
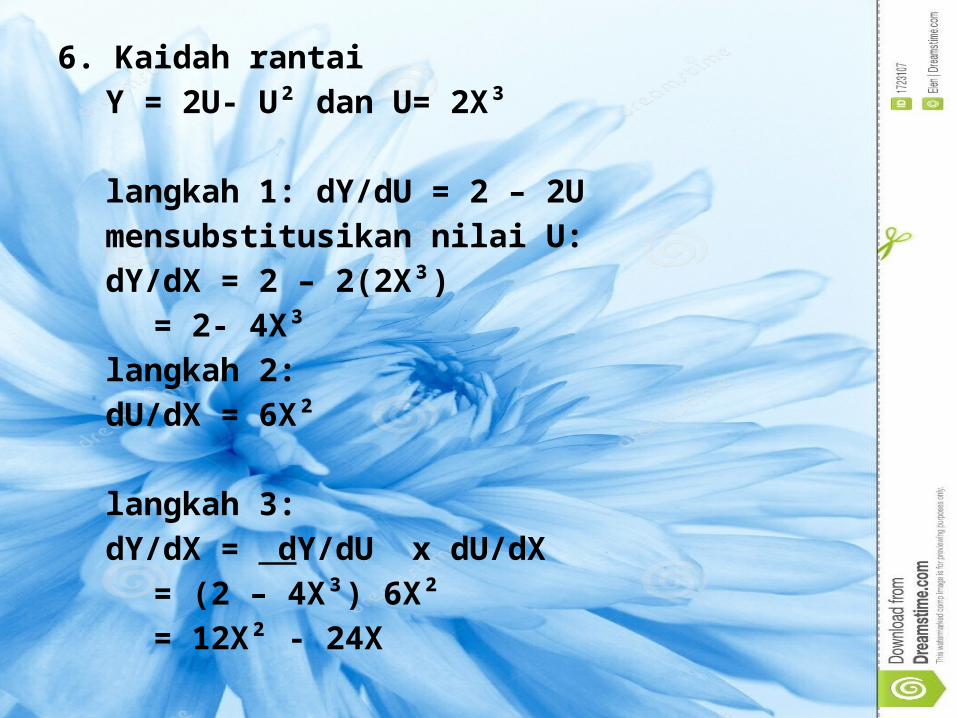
6. Kaidah rantai
Y = 2U- U² dan U= 2X³
langkah 1: dY/dU = 2 – 2U
mensubstitusikan nilai U:
dY/dX = 2 – 2(2X³)
= 2- 4X³
langkah 2:
dU/dX = 6X²
langkah 3:
dY/dX = dY/dU x dU/dX
= (2 – 4X³) 6X²
= 12X² - 24X

PENGGUNAAN TURUNAN UNTUK MEMAKSIMUMKAN/MEMINIMUMKAN FUNGSI
Contoh:
∏ = -10.000 + 400Q – 2Q²
d ∏/dQ = 400 – 4Q
= 400 – 4Q = 0
Q = 400/4 = 100
Turunan fungsi ditunjukkan oleh nilai marginalnya, fungsi dikatakan maksimum atau minimum jika marginalnya sama dengan nol
Jadi keuntungan maksimal sebesar !0.000, pada saat Q = 100 unit
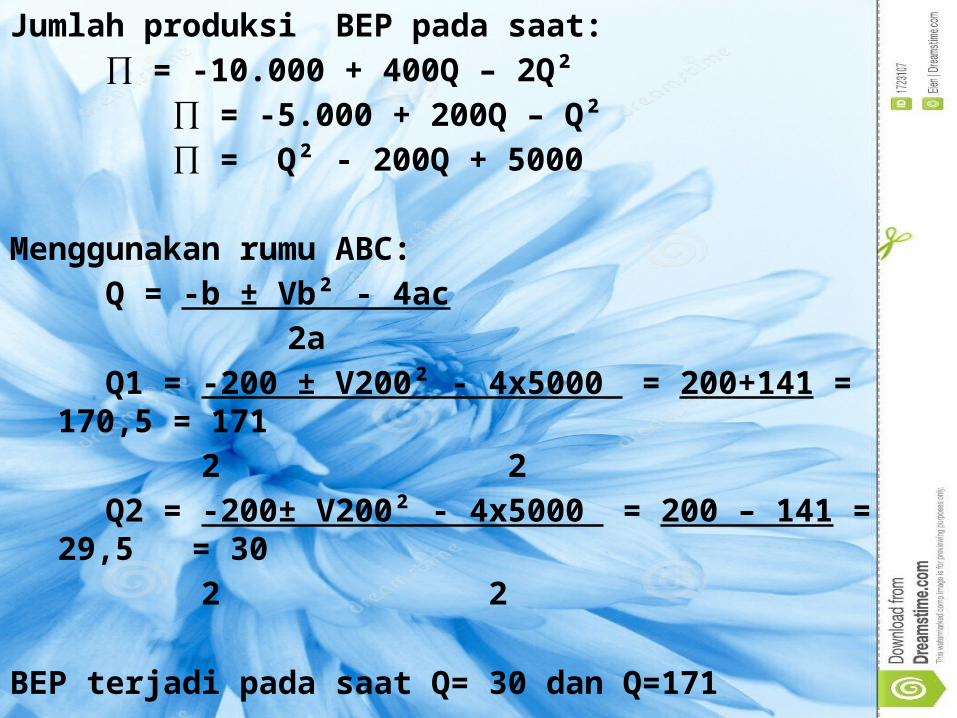
Jumlah produksi BEP pada saat:
∏ = -10.000 + 400Q – 2Q²
∏ = -5.000 + 200Q – Q²
∏ = Q² - 200Q + 5000
Menggunakan rumu ABC:
Q = -b ± Vb² - 4ac
2a
Q1 = -200 ± V200² - 4x5000 = 200+141 = 170,5 = 171
2 2
Q2 = -200± V200² - 4x5000 = 200 – 141 = 29,5 = 30
2 2
BEP terjadi pada saat Q= 30 dan Q=171

Laba sebagai output
10000
30 s 100 10000
jadi

PEMBEDAAN NILAI MAKSIMUM DAN MINIMUM
Contoh:
∏ = a – bQ + cQ² - dQ³
turunan pertama:
d ∏ /dQ = -b +2CQ – 3dQ²
turunan kedua
d² ∏/dQ² = 2C – 6dQ
Konsep turunan kedua digunakan untuk membedakan nilai maksimum dan minimum dari suatu fungsi Jika turunan kedua negatif titik yang ditentukan
maksimum Jika turunan kedua positif titik yang ditentukan minimum

Contoh:
∏ = 3000 – 2400Q + 3500Q² - 8,333Q³
turunan pertama:
d ∏ /dQ = -2400 +700Q – 25Q²
turunan kedua
d² ∏/dQ² = 700 – 50Q
pada tingkat output Q=4:
d² ∏/dQ² = 700 – 50(4) = 500 laba minimal
pada tingkat output Q=24:
d² ∏/dQ² = 700 – 50(24) = -500 laba maksimal
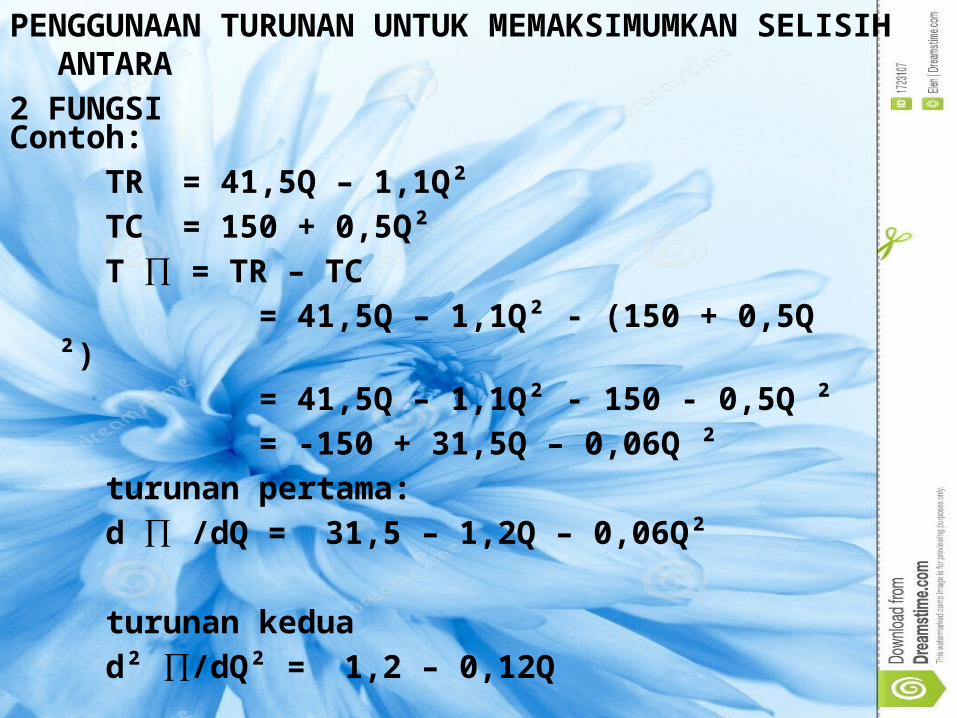
PENGGUNAAN TURUNAN UNTUK MEMAKSIMUMKAN SELISIH ANTARA2 FUNGSI
Contoh:
TR = 41,5Q – 1,1Q²
TC = 150 + 0,5Q²
T ∏ = TR – TC
= 41,5Q – 1,1Q² - (150 + 0,5Q ²)
= 41,5Q – 1,1Q² - 150 - 0,5Q ²
= -150 + 31,5Q – 0,06Q ²
turunan pertama:
d ∏ /dQ = 31,5 – 1,2Q – 0,06Q²
turunan kedua
d² ∏/dQ² = 1,2 – 0,12Q