· maksud dan tujuan maksud dan tujuan survei perusahaan ... lebih pendek. karakteristik yang...
TRANSCRIPT
https:
//www.b
ps.go.id
https:
//www.b
ps.go.id
Indikator Konstruksi Triwulanan IV - 2018
Construction Indocator, 4th Quarter - 2018
ISSN: 1979-8024
No. Publikasi/Publication Number: 05340.1902
Katalog/Catalog: 6302002
Ukuran Buku/Book Size: 18,2 x 25,7 cm
Jumlah Halaman/Number of Pages: xx + 35 halaman/pages
Naskah/Manuscript:
Subdirektorat Statistik Konstruksi (Sub-directorat of Construction Statistics)
Penyunting/Editor:
Subdirektorat Statistik Konstruksi (Sub-directorat of Construction Statistics)
Gambar Kover oleh/Cover Designed by:
Subdirektorat Publikasi dan Kompilasi Statistik Sub-directorate of Statistical Compilation and Publication
Diterbitkan oleh/Published by:
© BPS RI/BPS-Statistics Indonesia
Dilarang mengumumkan, mendistribusikan, mengkomunikasikan,
dan/atau menggandakan sebagian atau seluruh isi buku ini untuk
tujuan komersial tanpa izin tertulis dari Badan Pusat Statistik Prohibited to announce, distribute, communicate, and/or copy part of all this
book for commercial purpose without permission from BPS-Statistics
Indonesia
https:
//www.b
ps.go.id
KATA PENGANTAR
Kontribusi konstruksi dalam perekonomian Indonesia cukup besar, 11,11
persen terhadap Produk Domestik Bruto (PDB) Indonesia pada triwulan IV tahun
2018. Badan Pusat Statistik (BPS) memantau perkembangan konstruksi melalui
Survei Konstruksi Triwulanan yang dilakukan terhadap perusahaan konstruksi
berbadan hukum (kualifikasi M1, M2, B1, dan B2) di Indonesia.
Publikasi ini menyajikan data dan informasi hasil Survei Perusahaan
Konstruksi Triwulan IV Tahun 2018. Data yang disajikan dalam publikasi ini
terdiri atas indeks pekerja tetap, hari orang pekerja harian, balas jasa dan upah,
nilai konstruksi, kondisi bisnis, prospek bisnis, dan masalah bisnis.
Akhirnya pada kesempatan ini kami mengucapkan terima kasih dan
penghargaan kepada semua pihak yang terlibat pada pekerjaan lapangan,
pengolahan data, dan kepada para pengusaha konstruksi yang telah membantu
kelancaran pelaksanaan survei tersebut.
Jakarta, April 2019 Kepala Badan Pusat Statistik
Dr. Suhariyanto
https:
//www.b
ps.go.id
FOREWORD
Construction have significant role in Indonesian economy, 11.11 percent to
Indonesia’s Gross Domestic Bruto (GDP) in the fourth quarter 2018. BPS-Statistics
Indonesia has conducted Quarterly Construction Legal Establishment Survey
(qualification M1, M2, B1 and B2) to provide the information of the growth of
construction sector.
This publication presents some construction indices based on the
Quarterly Construction Establishment Survey in the fourth quarter 2018, such
as indices of permanent workers, man-days of daily workers, compensation and
wages, value of construction, business condition, business prospect, and business
problem.
Finally, we would like to express our gratitude to all parties, who have given
contribution in collecting, processing data, and the executives of construction
establishments who have supported in providing data for the survey.
Jakarta, April 2019
BPS-Statistics Indonesia,
Dr. Suhariyanto Chief Statistician
https:
//www.b
ps.go.id
v
DAFTAR ISI
CONTENTS
Halaman/Pages
KATA PENGANTAR / FOREWORD .................................................................................. iii DAFTAR ISI / CONTENTS ................................................................................................. v PENJELASAN / EXPLANATION ........................................................................................ vii ULASAN SINGKAT/ REVIEW ............................................................................................ xvi TABEL-TABEL / TABLES :
Indeks (2010=100) dan Pertumbuhan (Persen) Konstruksi Triwulanan Tahun 2017 – 2018 Triwulan IV
Quarterly Construction Indices (2010=100) and Growth (Percent) 2017 – the fourth quarter 2018
1. Indonesia : ................................................................................................................... 1
2. Provinsi/Province : Aceh ............................................................................................. 2
3. Provinsi/Province : Sumatera Utara ............................................................................ 3
4. Provinsi/Province : Sumatera Barat ............................................................................ 4
5. Provinsi/Province : Riau .............................................................................................. 5
6. Provinsi/Province : Jambi ............................................................................................ 6
7. Provinsi/Province : Sumatera Selatan ........................................................................ 7
8. Provinsi/Province : Bengkulu ..................................................................................... 8
9. Provinsi/Province : Lampung ..................................................................................... 9
10. Provinsi/Province : Bangka Belitung .......................................................................... 10
11. Provinsi/Province : Kepulauan Riau .......................................................................... 11
12. Provinsi/Province : DKI Jakarta ................................................................................. 12
13. Provinsi/Province : Jawa Barat .................................................................................. 13
14. Provinsi/Province : Jawa Tengah ............................................................................... 14
15. Provinsi/Province : D I Yogyakarta .............................................................................. 15
https:
//www.b
ps.go.id
vi
16. Provinsi/Province : Jawa Timur .................................................................................... 16
17. Provinsi/Province : Banten .......................................................................................... 17
18. Provinsi/Province : Bali .......................................................................................... 18
19. Provinsi/Province : Nusa Tenggara Barat .................................................................. 19
20. Provinsi/Province : Nusa Tenggara Timur .................................................................. 20
21. Provinsi/Province : Kalimantan Barat ........................................................................ 21
22. Provinsi/Province : Kalimantan Tengah ..................................................................... 22
23. Provinsi/Province : Kalimantan Selatan ..................................................................... 23
24. Provinsi/Province : Kalimantan Timur ........................................................................ 24
25. Provinsi/Province : Kalimantan Utara ........................................................................ 25
26. Provinsi/Province : Sulawesi Utara ........................................................................... 26
27. Provinsi/Province : Sulawesi Tengah ......................................................................... 27
28. Provinsi/Province : Sulawesi Selatan ......................................................................... 28
29. Provinsi/Province : Sulawesi Tenggara ..................................................................... 29
30. Provinsi/Province : Sulawesi Gorontalo ..................................................................... 30
31. Provinsi/Province : Sulawesi Barat ............................................................................ 31
32. Provinsi/Province : Maluku ......................................................................................... 32
33. Provinsi/Province : Maluku Utara ............................................................................... 33
34. Provinsi/Province : Papua Barat ................................................................................ 34
35. Provinsi/Province : Papua ......................................................................................... 35 https:
//www.b
ps.go.id
vii
PENJELASAN
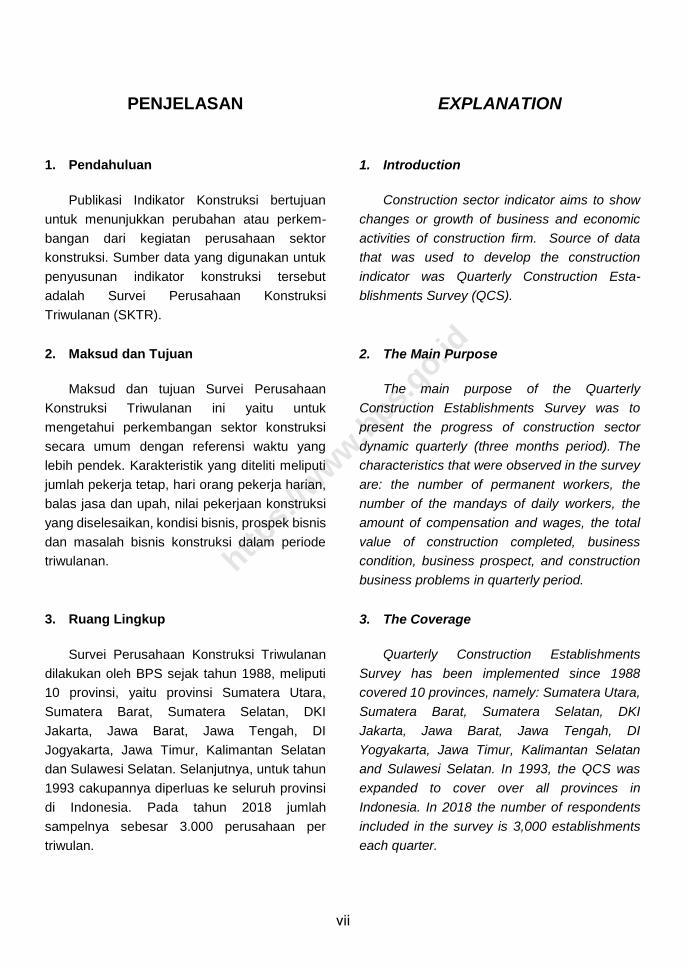
1. Pendahuluan
Publikasi Indikator Konstruksi bertujuan
untuk menunjukkan perubahan atau perkem-
bangan dari kegiatan perusahaan sektor
konstruksi. Sumber data yang digunakan untuk
penyusunan indikator konstruksi tersebut
adalah Survei Perusahaan Konstruksi
Triwulanan (SKTR).
EXPLANATION
1. Introduction
Construction sector indicator aims to show
changes or growth of business and economic
activities of construction firm. Source of data
that was used to develop the construction
indicator was Quarterly Construction Esta-
blishments Survey (QCS).
2. Maksud dan Tujuan
Maksud dan tujuan Survei Perusahaan
Konstruksi Triwulanan ini yaitu untuk
mengetahui perkembangan sektor konstruksi
secara umum dengan referensi waktu yang
lebih pendek. Karakteristik yang diteliti meliputi
jumlah pekerja tetap, hari orang pekerja harian,
balas jasa dan upah, nilai pekerjaan konstruksi
yang diselesaikan, kondisi bisnis, prospek bisnis
dan masalah bisnis konstruksi dalam periode
triwulanan.
2. The Main Purpose
The main purpose of the Quarterly
Construction Establishments Survey was to
present the progress of construction sector
dynamic quarterly (three months period). The
characteristics that were observed in the survey
are: the number of permanent workers, the
number of the mandays of daily workers, the
amount of compensation and wages, the total
value of construction completed, business
condition, business prospect, and construction
business problems in quarterly period.
3. Ruang Lingkup
Survei Perusahaan Konstruksi Triwulanan
dilakukan oleh BPS sejak tahun 1988, meliputi
10 provinsi, yaitu provinsi Sumatera Utara,
Sumatera Barat, Sumatera Selatan, DKI
Jakarta, Jawa Barat, Jawa Tengah, DI
Jogyakarta, Jawa Timur, Kalimantan Selatan
dan Sulawesi Selatan. Selanjutnya, untuk tahun
1993 cakupannya diperluas ke seluruh provinsi
di Indonesia. Pada tahun 2018 jumlah
sampelnya sebesar 3.000 perusahaan per
triwulan.
3. The Coverage
Quarterly Construction Establishments
Survey has been implemented since 1988
covered 10 provinces, namely: Sumatera Utara,
Sumatera Barat, Sumatera Selatan, DKI
Jakarta, Jawa Barat, Jawa Tengah, DI
Yogyakarta, Jawa Timur, Kalimantan Selatan
and Sulawesi Selatan. In 1993, the QCS was
expanded to cover over all provinces in
Indonesia. In 2018 the number of respondents
included in the survey is 3,000 establishments
each quarter.
https:
//www.b
ps.go.id
viii
4. Metodologi
a. Kerangka sampel
Survei perusahaan konstruksi triwulanan
merupakan sub sampel dari survei perusahaan
konstruksi tahunan, sehingga kerangka sampel
perusahaan konstruksi untuk konstruksi
triwulanan adalah daftar perusahaan konstruksi
yang terpilih pada survei perusahaan konstruksi
tahunan.
4. Methodology
a. Sampling frame
The quarterly construction establishment
survey is a sub sample of the annual
construction establishment survey. Therefore,
the sampling frame of the quarterly survey is the
list of establishments which are selected in the
annual construction establishments survey.
b. Rancangan Penarikan Sampel
Jumlah sampel survei perusahaan
konstruksi triwulanan tahun 2018 adalah
sebanyak 3.000 perusahaan, sehingga dalam
kurun waktu setahun jumlah sampelnya ada-
lah 12.000 perusahaan.
Jumlah sampel untuk kualifikasi perusahaan
konstruksi adalah sebagai berikut :
i. Jumlah sampel perusahaan konstruksi
besar (kualifikasi B) adalah 1.060, seluruh
perusahaan konstruksi besar yang ada
dilakukan pencacahan lengkap (take all).
ii. Jumlah sampel perusahaan konstruksi
sedang (kualifikasi M1 dan M2) adalah
1.940, pencacahan dilakukan hanya pada
perusahaan konstruksi sedang terpilih (take
some).
iii. Sedangkan untuk perusahaan konstruksi
kecil (kualifikasi K1, K2, dan K3) tidak
terpilih sampel
b. Sampling Method
The sample size of the construction
establishments quarterly survey in 2018 is 3,000
establishments. Therefore, the sample size for
the whole year 2018 is 12.000 establishments.
Number of establishments in each
establishment qualification are listed as follows:
i. Number of establishments samples in the
big construction establish-ment/business
group (qualification B) is 1,060, the
enumeration is conducted for all big
construction establishments (take all).
ii. Number of establishments samples in the
medium construction establishments group
(qualification M1 and M2) is 1,940, the
enumeration is conducted only for the
selected medium construction
establishments (take some).
iii. Meanwhile, for small construction
establishments (qualification K1, K2, and
K3) is not selected in the sample.
5. Indeks Divisia Konstruksi
Rasio Konstruksi adalah perhitungan rasio
variabel konstruksi yang meliputi: pekerja tetap,
5. Divisia Index Construction
The ratio of construction is a calculation of
the ratio of variable construction include:
https:
//www.b
ps.go.id
ix
hari orang, balas jasa dan upah serta nilai
konstruksi yang diselesaikan triwulanan
menggunakan formula sebagai berikut:
permanent workers, man days, fringe benefits
and wages and the value of construction
completed quarterly using the following formula:
a. Rasio proyek a. The ratio of the project
1
2
ijk
ijk
Q
Q
ijkR
dimana:
Rijk adalah rasio proyek k, perusahaan j, KBLI 5
digit i antar triwulan 2 dan 1
Qijk2 adalah proyek k, perusahaan j, KBLI 5 digit
i antar triwulan 2
Qijk1 adalah proyek k, perusahaan j, KBLI 5 digit
i antar triwulan 1
where :
Rijk is the ratio of the project k, company j, ISIC
5 digits i between quarter 2 and 1
Qijk2 is project k, company j, ISIC 5 digits i
between quarter 2
Qijk1 is project k, company j, ISIC 5 digits i
between quarter 1
b. Rasio perusahaan b. The ratio of the company
ijk
k ijk
ijk ReR
V
V
ij
ln
dimana:
Rij adalah rasio perusahaan j dalam KBLI 5 digit
i pada triwulan ke-2 terhadap triwulan ke-1
Vijk adalah variabel konstruksi dari proyek k
untuk perusahaan j dalam KBLI 5 digit i selama
periode dua triwulan.
where :
Rij is the ratio of the company j in ISIC 5 digits i
in quarter 2 to quarter 1
Vijk is the construction of the project variables k
for companies j in ISIC 5 digits i over a period
of two quarters.
c. Rasio KBLI c. ISIC ratio
)ln( ij
j ij
ijR
V
V
ieR
..................................... (1.1)
..................................... (1.2)
..................................... (1.3)
https:
//www.b
ps.go.id
x
dimana:
Ri adalah rasio KBLI 2 digit i pada triwulan ke-2
terhadap triwulan ke-1
Vij adalah variabel konstruksi untuk perusahaan
j dalam KBLI 2 digit i pada periode dua
triwulan, dimana:
k
ijkij VV
where:
Ri is the ratio of ISIC 2 digits i quarter 2 to
quarter 1
Vij is the variable construction for the company j
in ISIC 2 digits i in second period quarterly,
where :
k
ijkij VV
d. Rasio total d. Total ratio
)ln( i
i
i RV
V
toteR
dimana:
Rtot adalah rasio total
Vi adalah variabel konstruksi untuk perusahaan
j dalam KBLI 2 digit i pada periode 2 triwulan,
dimana:
j
iji VV
where:
Rtot is total ratio
Vi is the variable construction for the company j
in ISIC 2 digits i in second period quarterly,
where :
j
iji VV
e. Total Indeks Divisia Konstruksi e. Total Divisia Index Construction
.)1( tottt
RII
dimana:
It : Indeks konstruksi pada triwulan ke t
It-1 : Indeks konstruksi pada triwulan ke t-1
Rtot : Rasio total konstruksi pada triwulan ke t
where:
It : Index construction in quarter t
It-1 : Index construction in quarter t-1
Rtot : Total ratio construction in quarter t
..................................... (1.4)
...................................... (1.5)
https:
//www.b
ps.go.id
xi
6. Indeks Diffusion
Metode indeks diffusion digunakan untuk
menghitung indeks kondisi dan prospek bisnis
pengusaha. Formula dari indeks diffusion
sebagai berikut:
2
%%
tetapmeningkatID . . . (2.1)
6. Diffusion Indices
Condition and business prospect are
calculated by diffusion indices method. The
diffusion indices formula is:
2
%%
sameincreaseID . . . (2.1)
dimana,
ID = indeks diffusion
%meningkat = persentase pendapat
pengusaha yang menyatakan
kondisi usahanya pada
periode tertentu meningkat
dibanding dengan periode
sebelumnya
% tetap = persentase pendapat
pengusaha yang
menyatakan kondisi
usahanya pada periode
tertentu tetap dibanding
dengan periode sebelumnya
Nilai Indeks Diffusion (ID) akan terletak
dalam range 0 - 100 % yang diinterpretasikan
sebagai berikut:
ID = 100% : Semua pengusaha menyatakan
kondisi usahanya meningkat
ID>50% : Jumlah pengusaha yang
menyatakan kondisi usahanya
meningkat lebih banyak
dibandingkan yang menyatakan
menurun, umumnya pengusaha
cenderung optimis akan kondisi
usahanya
ID = 50 % : Jumlah pengusaha yang
menyatakan kondisi usahanya
meningkat sama dengan yang
where,
ID = diffusion indices
% higher = percentage of responses
reporting “increase” compare to
previous period
% same = percentage of responses
reporting “same” compare to
previous period
Diffusion index (ID) value are bounded
between 0 to 100 percent where summarized by:
ID = 100 % : all the response stated that the
business condition are “increase”
ID > 50 % : most of the response (more than
50%) stated that the business
condition are “increase”. They
are optimist about the business.
ID = 50 % : number of response
‘incerase” and ‘decrease”
are equal
https:
//www.b
ps.go.id
xii
menyatakan menurun
ID<50% : Jumlah pengusaha yang
menyatakan kondisi usahanya
menurun lebih banyak
dibandingkan yang menyatakan
meningkat, umumnya
pengusaha cenderung pesimis
akan kondisi usahanya
ID = 0 % : Semua pengusaha menyatakan
kondisi usahanya menurun
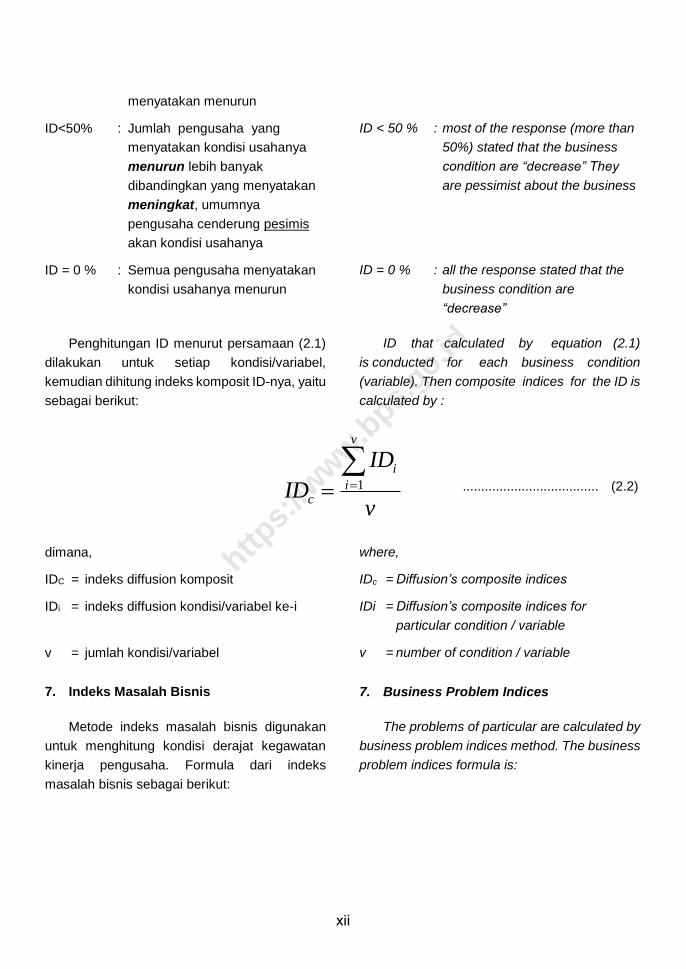
Penghitungan ID menurut persamaan (2.1)
dilakukan untuk setiap kondisi/variabel,
kemudian dihitung indeks komposit ID-nya, yaitu
sebagai berikut:
ID < 50 % : most of the response (more than
50%) stated that the business
condition are “decrease” They
are pessimist about the business
ID = 0 % : all the response stated that the
business condition are
“decrease”
ID that calculated by equation (2.1)
is conducted for each business condition
(variable). Then composite indices for the ID is
calculated by :
v
ID
ID
v
i
i
c
1
dimana,
IDC = indeks diffusion komposit
IDi = indeks diffusion kondisi/variabel ke-i
v = jumlah kondisi/variabel
where,
IDc = Diffusion’s composite indices
IDi = Diffusion’s composite indices for
particular condition / variable
v = number of condition / variable
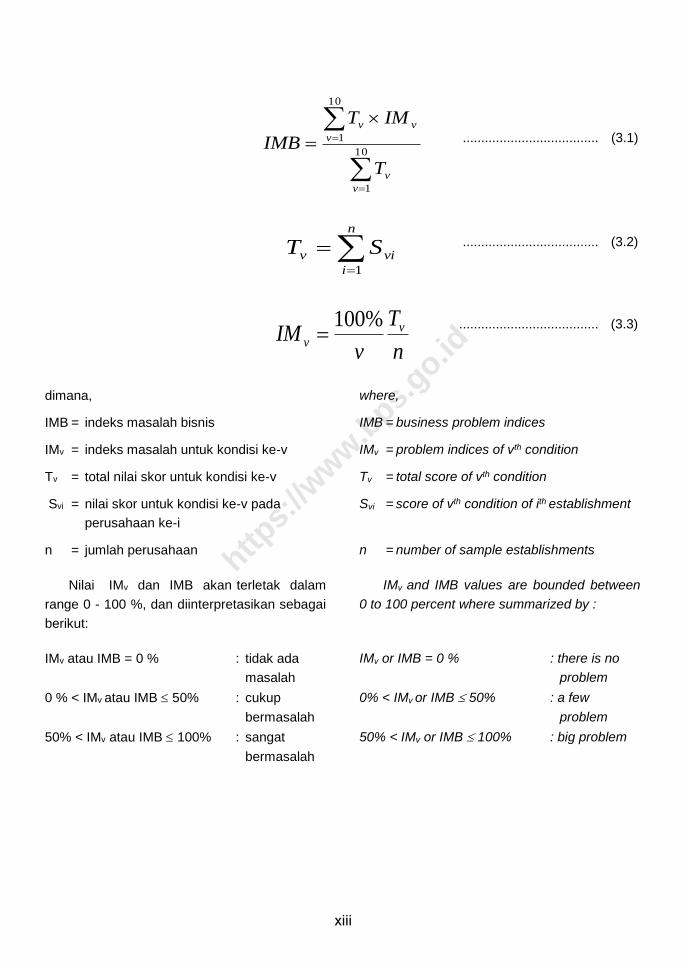
7. Indeks Masalah Bisnis
Metode indeks masalah bisnis digunakan
untuk menghitung kondisi derajat kegawatan
kinerja pengusaha. Formula dari indeks
masalah bisnis sebagai berikut:
7. Business Problem Indices
The problems of particular are calculated by
business problem indices method. The business
problem indices formula is:
..................................... (2.2)
https:
//www.b
ps.go.id
xiii
10
1
10
1
v
v
v
vv
T
IMT
IMB
n
i
viv ST1
n
T
vIM v
v
%100
dimana,
IMB = indeks masalah bisnis
IMv = indeks masalah untuk kondisi ke-v
Tv = total nilai skor untuk kondisi ke-v
Svi = nilai skor untuk kondisi ke-v pada
perusahaan ke-i
n = jumlah perusahaan
Nilai IMv dan IMB akan terletak dalam
range 0 - 100 %, dan diinterpretasikan sebagai
berikut:
IMv atau IMB = 0 % : tidak ada
masalah
0 % < IMv atau IMB 50% : cukup
bermasalah
50% < IMv atau IMB 100% : sangat
bermasalah
where,
IMB = business problem indices
IMv = problem indices of vth condition
Tv = total score of vth condition
Svi = score of vth condition of ith establishment
n = number of sample establishments
IMv and IMB values are bounded between
0 to 100 percent where summarized by :
IMv or IMB = 0 % : there is no
problem
0% < IMv or IMB 50% : a few
problem
50% < IMv or IMB 100% : big problem
..................................... (3.1)
..................................... (3.2)
...................................... (3.3)
https:
//www.b
ps.go.id
xiv
8. Konsep dan Definisi
8.1. Nilai Konstruksi yang diselesaikan
Nilai konstruksi yang diselesaikan adalah
besarnya nilai pekerjaan yang diselesaikan
secara fisik selama jangka waktu tertentu (tidak
termasuk harga tanah) oleh pihak pembo-
rong/kontraktor atas pekerjaan yang diperoleh
baik berdasarkan surat perjanjian kontrak atau
berdasarkan surat perintah kerja antara pemilik
(bouwheer) dengan kontraktor.
8. The Concepts and The Definitions
8.1. The Value of Construction completed
The value of construction completed is
defined as the total value of work completed by
contractor (excluding value of land) based on the
letter of agreement signed by the owner and the
contractor in the certain period of time.
8.2. Pekerja
Tenaga kerja dibagi dalam dua kategori,
yaitu pekerja tetap dan pekerja harian. Pekerja
tetap adalah pekerja yang bekerja pada
perusahaan dengan menerima upah/gaji secara
tetap, baik ada kegiatan maupun tidak ada
kegiatan. Pekerja harian adalah pekerja yang
tidak terikat secara tetap dengan perusahaan,
dimana mereka hanya bekerja selama
pekerjaan/proyek ada dan bila pekerjaan/proyek
telah selesai maka secara otomatis mereka
tidak mempunyai hubungan kerja lagi dengan
perusahaan.
8.2. The Workers
The workers is divided into two categories,
namely: permanent workers (skilled labor
workers) and daily workers. Permanent worker
is a worker who works at the company on a fixed
wages/salaries basis whether there is activities
or not in their company. Daily workers is a
worker who works freely at the company as long
as the project is still going on and doesn't have
permanent relationship with the company if the
work of the project has been completed.
8.3. Hari Orang Pekerja Harian
Hari orang adalah jumlah pekerja harian
dalam satu hari untuk menyelesaikan satu
pekerjaan.
8.3. Man-days of daily Worker
Man-days is the number of daily worker
finishing a job during one day
8.4. Balas Jasa dan Upah
Balas Jasa dan upah adalah seluruh
pengeluaran yang dibayarkan kepada pekerja
tetap dan pekerja harian berupa upah gaji, upah
lembur, hadiah, bonus, dana pensiun, tunjangan
kecelakaan dan pengeluaran lainnya yang
dibayarkan dalam bentuk uang maupun barang
8.4. Compensation and Wages
Compensation and wages is all
expenditures paid to both permanent workers
and daily workers in the form of wages/salaries,
overtime payment, gifts, bonuses, pension
benefits, accident allowances and other
expenditures either in the form of money or
https:
//www.b
ps.go.id
xv
sebagai balas jasa dan upah. goods as compensation and wages.
8.5. Laju Pertumbuhan
Laju pertumbuhan menunjukkan per-
gerakan agregat yang berfluktuasi dari satu
waktu tertentu terhadap waktu sebelumnya.
Laju pertumbuhan diperoleh dengan cara
mengurangi angka indeks yang diperoleh pada
tahun n dikurangi 100 persen.
8.5. Growth Rate
The growth rate showed a fluctuation
aggregate movement from time to time. The
growth rate is derived by subtracting the indices
derived in the year n by 100 percent.
https:
//www.b
ps.go.id
xvi
ULASAN SINGKAT
1. Indeks Konstruksi Triwulanan
Pola aktivitas konstruksi triwulanan selama
2017 − 2018 triwulan IV menunjukkan adanya
fluktuasi, pada jumlah pekerja, balas jasa dan
upah pekerja, nilai pekerjaan konstruksi, kondisi
bisnis, dan prospek bisnis serta masalah bisnis
konstruksi.
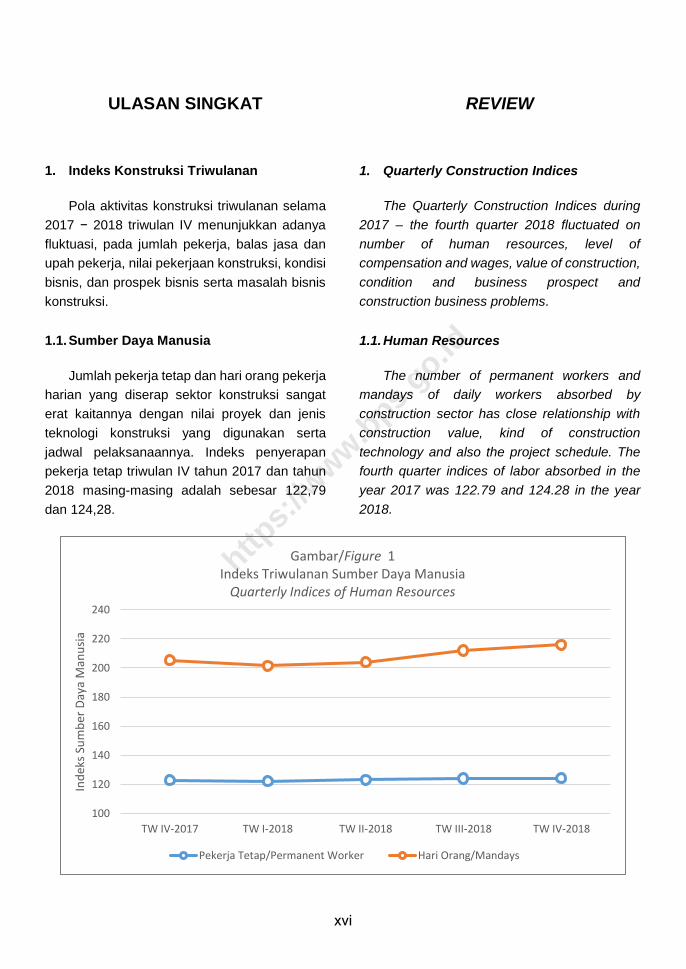
1.1. Sumber Daya Manusia
Jumlah pekerja tetap dan hari orang pekerja
harian yang diserap sektor konstruksi sangat
erat kaitannya dengan nilai proyek dan jenis
teknologi konstruksi yang digunakan serta
jadwal pelaksanaannya. Indeks penyerapan
pekerja tetap triwulan IV tahun 2017 dan tahun
2018 masing-masing adalah sebesar 122,79
dan 124,28.
REVIEW
1. Quarterly Construction Indices
The Quarterly Construction Indices during
2017 – the fourth quarter 2018 fluctuated on
number of human resources, level of
compensation and wages, value of construction,
condition and business prospect and
construction business problems.
1.1. Human Resources
The number of permanent workers and
mandays of daily workers absorbed by
construction sector has close relationship with
construction value, kind of construction
technology and also the project schedule. The
fourth quarter indices of labor absorbed in the
year 2017 was 122.79 and 124.28 in the year
2018.
100
120
140
160
180
200
220
240
TW IV-2017 TW I-2018 TW II-2018 TW III-2018 TW IV-2018
Ind
eks
Sum
ber
Day
a M
anu
sia
Gambar/Figure 1Indeks Triwulanan Sumber Daya Manusia
Quarterly Indices of Human Resources
Pekerja Tetap/Permanent Worker Hari Orang/Mandays
https:
//www.b
ps.go.id
xvii
Di lain pihak hari orang pekerja harian
mempunyai indeks triwulan IV sebesar 205,16
pada tahun 2017 dan 215,82 pada tahun 2018.
Adapun untuk melihat fluktuasi angka indeks
sumber daya manusia disajikan pada gambar 1.
On the other side, man-days of daily workers
indices in the fourth quarter was 205.16 in the
year 2017 and 215.82 in the year 2018. Figure 1
displays the fluctuation of human resources
indices.
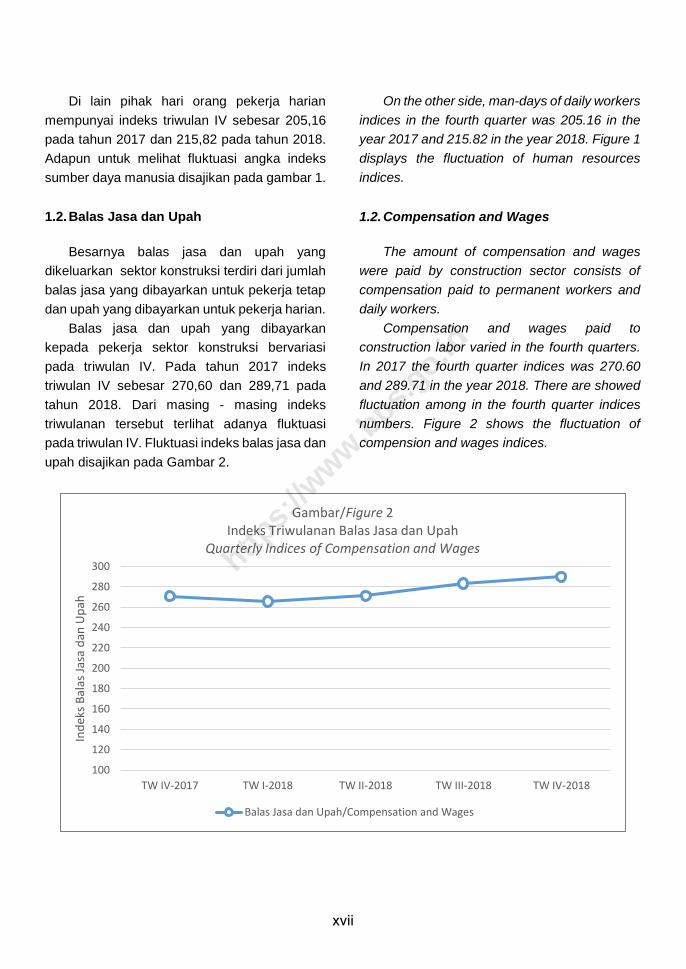
1.2. Balas Jasa dan Upah
Besarnya balas jasa dan upah yang
dikeluarkan sektor konstruksi terdiri dari jumlah
balas jasa yang dibayarkan untuk pekerja tetap
dan upah yang dibayarkan untuk pekerja harian.
Balas jasa dan upah yang dibayarkan
kepada pekerja sektor konstruksi bervariasi
pada triwulan IV. Pada tahun 2017 indeks
triwulan IV sebesar 270,60 dan 289,71 pada
tahun 2018. Dari masing - masing indeks
triwulanan tersebut terlihat adanya fluktuasi
pada triwulan IV. Fluktuasi indeks balas jasa dan
upah disajikan pada Gambar 2.
1.2. Compensation and Wages
The amount of compensation and wages
were paid by construction sector consists of
compensation paid to permanent workers and
daily workers.
Compensation and wages paid to
construction labor varied in the fourth quarters.
In 2017 the fourth quarter indices was 270.60
and 289.71 in the year 2018. There are showed
fluctuation among in the fourth quarter indices
numbers. Figure 2 shows the fluctuation of
compension and wages indices.
100
120
140
160
180
200
220
240
260
280
300
TW IV-2017 TW I-2018 TW II-2018 TW III-2018 TW IV-2018
Ind
eks
Bal
as J
asa
dan
Up
ah
Gambar/Figure 2Indeks Triwulanan Balas Jasa dan Upah
Quarterly Indices of Compensation and Wages
Balas Jasa dan Upah/Compensation and Wages
https:
//www.b
ps.go.id
xviii
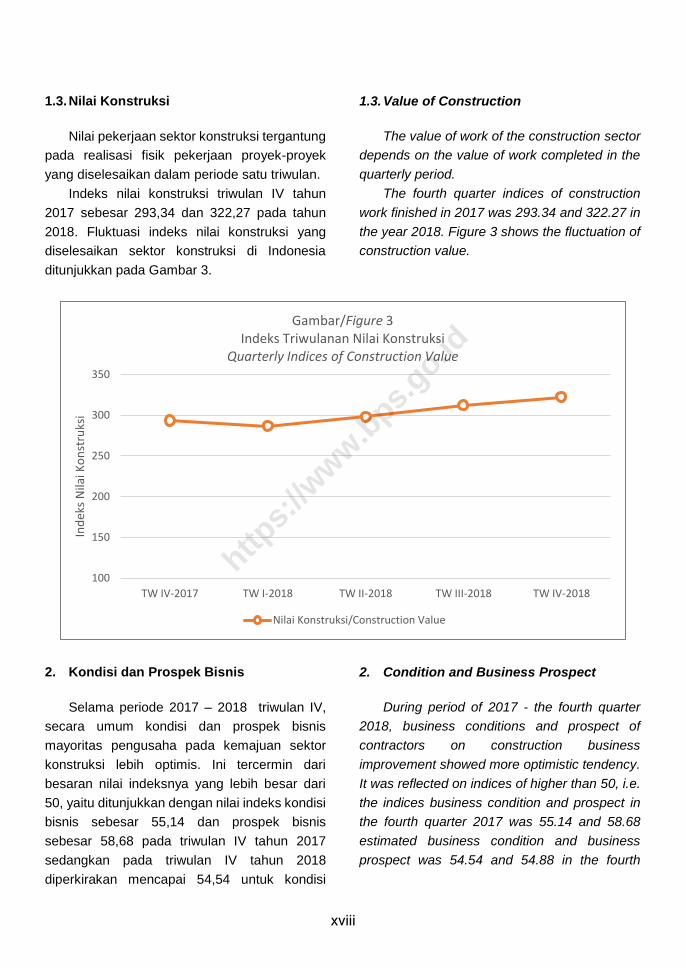
1.3. Nilai Konstruksi
Nilai pekerjaan sektor konstruksi tergantung
pada realisasi fisik pekerjaan proyek-proyek
yang diselesaikan dalam periode satu triwulan.
Indeks nilai konstruksi triwulan IV tahun
2017 sebesar 293,34 dan 322,27 pada tahun
2018. Fluktuasi indeks nilai konstruksi yang
diselesaikan sektor konstruksi di Indonesia
ditunjukkan pada Gambar 3.
1.3. Value of Construction
The value of work of the construction sector
depends on the value of work completed in the
quarterly period.
The fourth quarter indices of construction
work finished in 2017 was 293.34 and 322.27 in
the year 2018. Figure 3 shows the fluctuation of
construction value.
2. Kondisi dan Prospek Bisnis
Selama periode 2017 – 2018 triwulan IV,
secara umum kondisi dan prospek bisnis
mayoritas pengusaha pada kemajuan sektor
konstruksi lebih optimis. Ini tercermin dari
besaran nilai indeksnya yang lebih besar dari
50, yaitu ditunjukkan dengan nilai indeks kondisi
bisnis sebesar 55,14 dan prospek bisnis
sebesar 58,68 pada triwulan IV tahun 2017
sedangkan pada triwulan IV tahun 2018
diperkirakan mencapai 54,54 untuk kondisi
2. Condition and Business Prospect
During period of 2017 - the fourth quarter
2018, business conditions and prospect of
contractors on construction business
improvement showed more optimistic tendency.
It was reflected on indices of higher than 50, i.e.
the indices business condition and prospect in
the fourth quarter 2017 was 55.14 and 58.68
estimated business condition and business
prospect was 54.54 and 54.88 in the fourth
100
150
200
250
300
350
TW IV-2017 TW I-2018 TW II-2018 TW III-2018 TW IV-2018
Ind
eks
Nila
i Ko
nst
ruks
i
Gambar/Figure 3Indeks Triwulanan Nilai Konstruksi
Quarterly Indices of Construction Value
Nilai Konstruksi/Construction Value
https:
//www.b
ps.go.id
xix
bisnis dan prospek bisnis sebesar 54,88. quarter 2018.
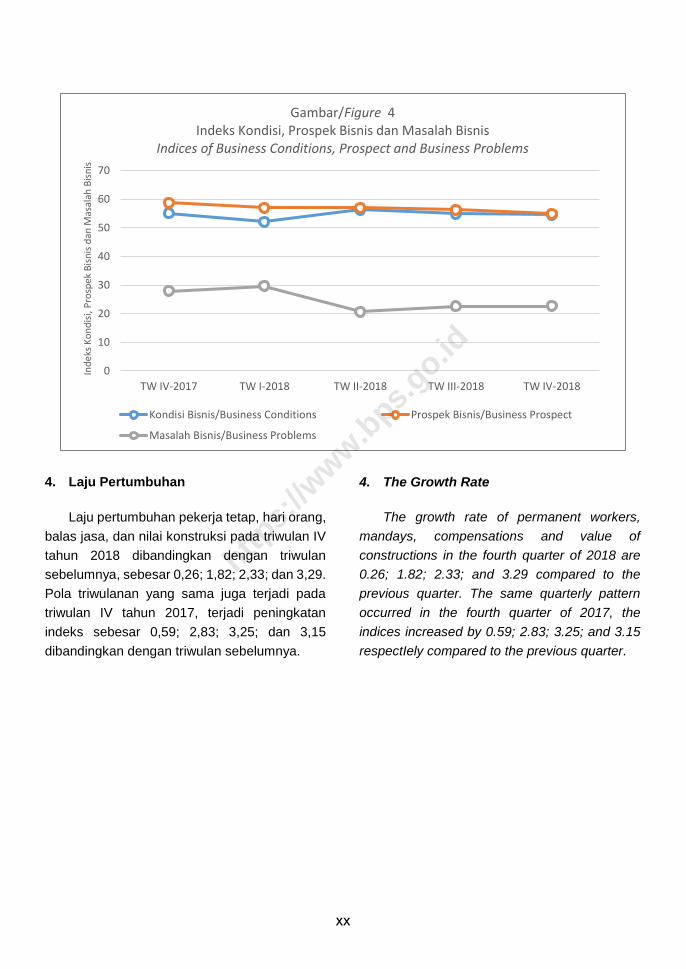
3. Masalah Bisnis
Pada periode ini pengusaha konstruksi juga
masih menganggap cukup bermasalah dalam
menjalankan bisnisnya dibanding triwulan
sebelumnya, yang ditunjukkan dengan Indeks
Umum masalah bisnis yang nilainya sebesar
27,91 pada triwulan IV tahun 2017 dan 22,66
pada triwulan IV tahun 2018. Ada tiga masalah
utama yang dihadapi oleh para pengusaha yaitu
tidak stabilnya harga bahan bangunan,
penurunan permintaan, dan tingkat persaingan
yang tinggi. Harga bahan bangunan sangat
menentukan kontrak pekerjaan. Bila harga
bahan bangunan tidak stabil akan merugikan
kontraktor karena rentang waktu antara kontrak
dan pelaksanaan berbeda. Fluktuasi nilai indeks
kondisi bisnis, prospek bisnis dan masalah
bisnis ditunjukkan pada Gambar 4.
Hubungan Kondisi, Prospek dan Masalah
Bisnis pada triwulan IV tahun 2018 ini
menunjukkan angka indeks yang cukup
signifikan, dimana kondisi bisnis 54,54 (>50),
prospek bisnis 54,88 (>50) dan diikuti masalah
bisnis 22,66 (<50). Hubungan ini membuat
pengusaha atau pengembang jasa konstruksi
cenderung optimis di masa yang akan datang.
3. Problem Business
In this period, several contractors still faced
business problem as seen in the value of
general index of business problems, where the
indicators from the fourth quarter 2017 was
27.91 and the fourth quarter 2018 was 22.66.
There were three serious problems faced by
contractors; they were unstable of constructor
material prices, decreasing demand & tight
competitions among them. As prices of
construction material determine a contract
value, unstable price of materials will make
contractors loss because there is a time lag
between a contract signed and work under
taken. Figure 4 shows the fluctuation of indices
of business conditions, business prospect and
business problems.
Relations Conditions, Prospect and
Business Problems in the fourth quarter 2018
figures are showing a significant indices, where
the conditions of business 54.54 (>50),
prospects of business 54.88 (>50) and followed
by a business problem 22.66 (<50). This
relationship makes entrepreneur or developer
optimist construction services in the future.
https:
//www.b
ps.go.id
xx
4. Laju Pertumbuhan
Laju pertumbuhan pekerja tetap, hari orang,
balas jasa, dan nilai konstruksi pada triwulan IV
tahun 2018 dibandingkan dengan triwulan
sebelumnya, sebesar 0,26; 1,82; 2,33; dan 3,29.
Pola triwulanan yang sama juga terjadi pada
triwulan IV tahun 2017, terjadi peningkatan
indeks sebesar 0,59; 2,83; 3,25; dan 3,15
dibandingkan dengan triwulan sebelumnya.
4. The Growth Rate
The growth rate of permanent workers,
mandays, compensations and value of
constructions in the fourth quarter of 2018 are
0.26; 1.82; 2.33; and 3.29 compared to the
previous quarter. The same quarterly pattern
occurred in the fourth quarter of 2017, the
indices increased by 0.59; 2.83; 3.25; and 3.15
respectIely compared to the previous quarter.
0
10
20
30
40
50
60
70
TW IV-2017 TW I-2018 TW II-2018 TW III-2018 TW IV-2018
Ind
eks
Ko
nd
isi,
Pro
spek
Bis
nis
dan
Mas
alah
Bis
nis
Gambar/Figure 4Indeks Kondisi, Prospek Bisnis dan Masalah Bisnis
Indices of Business Conditions, Prospect and Business Problems
Kondisi Bisnis/Business Conditions Prospek Bisnis/Business Prospect
Masalah Bisnis/Business Problems
https:
//www.b
ps.go.id
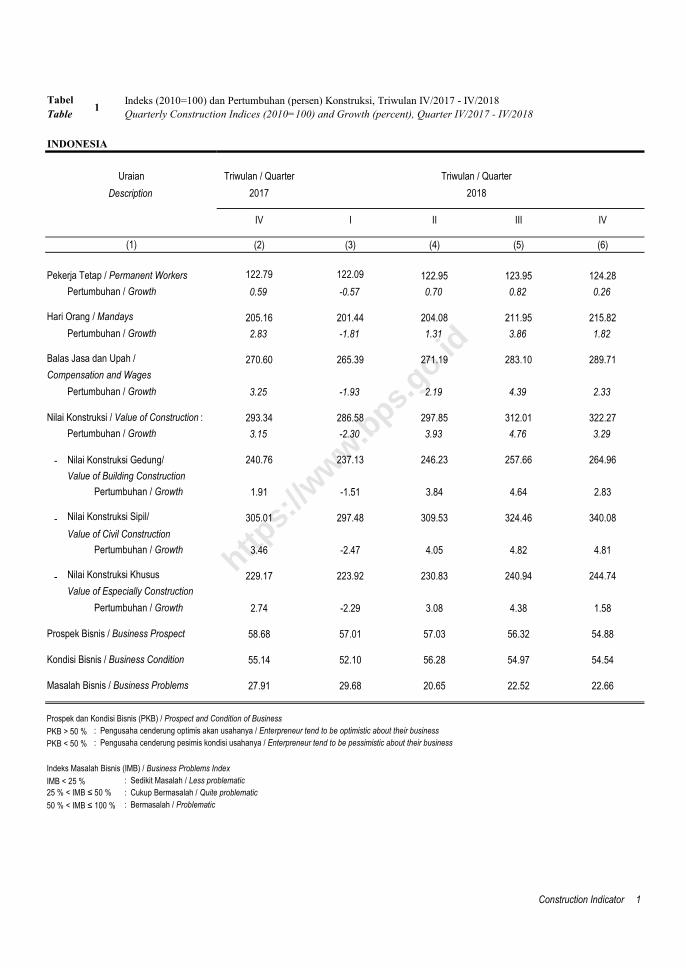
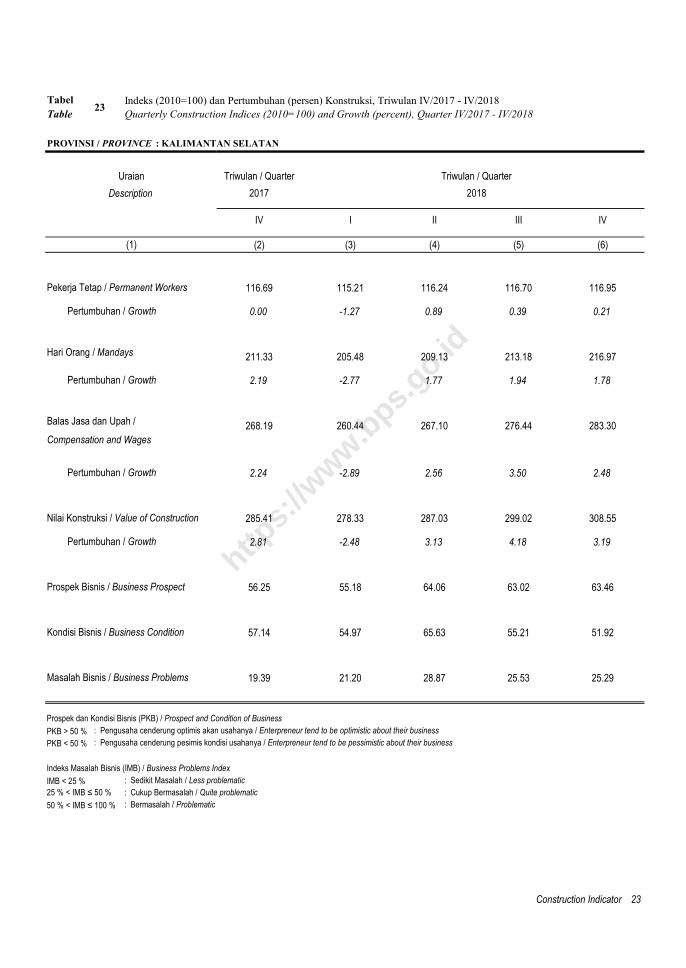
Tabel Indeks (2010=100) dan Pertumbuhan (persen) Konstruksi, Triwulan IV/2017 - IV/2018
Table Quarterly Construction Indices (2010=100) and Growth (percent), Quarter IV/2017 - IV/2018
INDONESIA
IV I II III IV
(2) (3) (4) (5) (6)
Pekerja Tetap / Permanent Workers 122.79 122.09 122.95 123.95 124.28
Pertumbuhan / Growth 0.59 -0.57 0.70 0.82 0.26
Hari Orang / Mandays 205.16 201.44 204.08 211.95 215.82
Pertumbuhan / Growth 2.83 -1.81 1.31 3.86 1.82
Balas Jasa dan Upah / 270.60 265.39 271.19 283.10 289.71
Compensation and Wages
Pertumbuhan / Growth 3.25 -1.93 2.19 4.39 2.33
Nilai Konstruksi / Value of Construction : 293.34 286.58 297.85 312.01 322.27
Pertumbuhan / Growth 3.15 -2.30 3.93 4.76 3.29
- Nilai Konstruksi Gedung/ 240.76 237.13 246.23 257.66 264.96
Value of Building Construction
Pertumbuhan / Growth 1.91 -1.51 3.84 4.64 2.83
- Nilai Konstruksi Sipil/ 305.01 297.48 309.53 324.46 340.08
Value of Civil Construction
Pertumbuhan / Growth 3.46 -2.47 4.05 4.82 4.81
- Nilai Konstruksi Khusus 229.17 223.92 230.83 240.94 244.74
Value of Especially Construction
Pertumbuhan / Growth 2.74 -2.29 3.08 4.38 1.58
Prospek Bisnis / Business Prospect 58.68 57.01 57.03 56.32 54.88
Kondisi Bisnis / Business Condition 55.14 52.10 56.28 54.97 54.54
Masalah Bisnis / Business Problems 27.91 29.68 20.65 22.52 22.66
Prospek dan Kondisi Bisnis (PKB) / Prospect and Condition of Business
PKB > 50 % : Pengusaha cenderung optimis akan usahanya / Enterpreneur tend to be optimistic about their business
PKB < 50 % : Pengusaha cenderung pesimis kondisi usahanya / Enterpreneur tend to be pessimistic about their business
Indeks Masalah Bisnis (IMB) / Business Problems Index
IMB < 25 % : Sedikit Masalah / Less problematic
25 % < IMB ≤ 50 % : Cukup Bermasalah / Quite problematic
50 % < IMB ≤ 100 % : Bermasalah / Problematic
Construction Indicator 1
Triwulan / Quarter
2018
Triwulan / Quarter
2017
1
Uraian
Description
(1)
https:
//www.b
ps.go.id

Tabel Indeks (2010=100) dan Pertumbuhan (persen) Konstruksi, Triwulan IV/2017 - IV/2018
Table Quarterly Construction Indices (2010=100) and Growth (percent), Quarter IV/2017 - IV/2018
PROVINSI / PROVINCE : ACEH
IV I II III IV
(2) (3) (4) (5) (6)
Pekerja Tetap / Permanent Workers 123.68 121.64 122.61 123.09 123.45
Pertumbuhan / Growth 0.60 -1.65 0.80 0.39 0.29
Hari Orang / Mandays 176.74 173.10 175.27 177.79 180.16
Pertumbuhan / Growth 2.45 -2.06 1.25 1.44 1.34
Balas Jasa dan Upah / 213.54 209.63 213.98 219.74 224.57
Compensation and Wages
Pertumbuhan / Growth 2.51 -1.83 2.07 2.69 2.20
Nilai Konstruksi / Value of Construction 228.17 223.15 230.15 236.47 241.88
Pertumbuhan / Growth 2.22 -2.20 3.14 2.75 2.29
Prospek Bisnis / Business Prospect 59.72 58.64 67.19 63.07 56.25
Kondisi Bisnis / Business Condition 55.21 54.19 68.75 57.39 62.11
Masalah Bisnis / Business Problems 27.03 25.83 23.21 18.40 19.55
Prospek dan Kondisi Bisnis (PKB) / Prospect and Condition of Business
PKB > 50 % : Pengusaha cenderung optimis akan usahanya / Enterpreneur tend to be optimistic about their business
PKB < 50 % : Pengusaha cenderung pesimis kondisi usahanya / Enterpreneur tend to be pessimistic about their business
Indeks Masalah Bisnis (IMB) / Business Problems Index
IMB < 25 % : Sedikit Masalah / Less problematic
25 % < IMB ≤ 50 % : Cukup Bermasalah / Quite problematic
50 % < IMB ≤ 100 % : Bermasalah / Problematic
2 Indikator Konstruksi
Triwulan / Quarter
2018
Triwulan / Quarter
Description
(1)
2
Uraian
2017
https:
//www.b
ps.go.id

Tabel Indeks (2010=100) dan Pertumbuhan (persen) Konstruksi, Triwulan IV/2017 - IV/2018
Table Quarterly Construction Indices (2010=100) and Growth (percent), Quarter IV/2017 - IV/2018
PROVINSI / PROVINCE : SUMATERA UTARA
IV I II III IV
(2) (3) (4) (5) (6)
Pekerja Tetap / Permanent Workers 126.16 124.97 125.41 125.57 125.80
Pertumbuhan / Growth 0.71 -0.95 0.35 0.13 0.19
Hari Orang / Mandays 206.08 202.64 205.09 209.46 213.92
Pertumbuhan / Growth 2.90 -1.67 1.21 2.13 2.13
Balas Jasa dan Upah / 260.57 258.06 263.48 274.44 279.64
Compensation and Wages
Pertumbuhan / Growth 3.04 -0.96 2.10 4.16 1.89
Nilai Konstruksi / Value of Construction 281.27 277.92 288.61 303.20 312.38
Pertumbuhan / Growth 3.06 -1.19 3.85 5.05 3.03
Prospek Bisnis / Business Prospect 53.79 55.91 52.40 52.33 50.98
Kondisi Bisnis / Business Condition 49.11 52.56 54.81 64.83 58.58
Masalah Bisnis / Business Problems 20.58 27.73 22.54 18.63 18.48
Prospek dan Kondisi Bisnis (PKB) / Prospect and Condition of Business
PKB > 50 % : Pengusaha cenderung optimis akan usahanya / Enterpreneur tend to be optimistic about their business
PKB < 50 % : Pengusaha cenderung pesimis kondisi usahanya / Enterpreneur tend to be pessimistic about their business
Indeks Masalah Bisnis (IMB) / Business Problems Index
IMB < 25 % : Sedikit Masalah / Less problematic
25 % < IMB ≤ 50 % : Cukup Bermasalah / Quite problematic
50 % < IMB ≤ 100 % : Bermasalah / Problematic
Construction Indicator 3
Triwulan / Quarter
2018
Uraian
3
(1)
Description
Triwulan / Quarter
2017
https:
//www.b
ps.go.id

Tabel Indeks (2010=100) dan Pertumbuhan (persen) Konstruksi, Triwulan IV/2017 - IV/2018
Table Quarterly Construction Indices (2010=100) and Growth (percent), Quarter IV/2017 - IV/2018
PROVINSI / PROVINCE : SUMATERA BARAT
IV I II III IV
(2) (3) (4) (5) (6)
Pekerja Tetap / Permanent Workers 116.54 115.41 115.87 115.91 115.95
Pertumbuhan / Growth 0.72 -0.97 0.40 0.03 0.03
Hari Orang / Mandays 185.57 182.64 185.03 186.98 190.05
Pertumbuhan / Growth 2.11 -1.58 1.31 1.06 1.64
Balas Jasa dan Upah / 219.22 214.83 219.89 224.51 229.06
Compensation and Wages
Pertumbuhan / Growth 2.12 -2.01 2.36 2.10 2.03
Nilai Konstruksi / Value of Construction 235.10 231.74 240.36 249.07 256.44
Pertumbuhan / Growth 2.19 -1.43 3.72 3.63 2.96
Prospek Bisnis / Business Prospect 62.50 57.28 50.00 49.53 52.18
Kondisi Bisnis / Business Condition 58.33 54.62 50.00 50.63 54.80
Masalah Bisnis / Business Problems 50.00 25.65 18.25 13.40 21.18
Prospek dan Kondisi Bisnis (PKB) / Prospect and Condition of Business
PKB > 50 % : Pengusaha cenderung optimis akan usahanya / Enterpreneur tend to be optimistic about their business
PKB < 50 % : Pengusaha cenderung pesimis kondisi usahanya / Enterpreneur tend to be pessimistic about their business
Indeks Masalah Bisnis (IMB) / Business Problems Index
IMB < 25 % : Sedikit Masalah / Less problematic
25 % < IMB ≤ 50 % : Cukup Bermasalah / Quite problematic
50 % < IMB ≤ 100 % : Bermasalah / Problematic
4 Indikator Konstruksi
Triwulan / Quarter
2018
Triwulan / Quarter
2017Description
(1)
4
Uraian
https:
//www.b
ps.go.id

Tabel Indeks (2010=100) dan Pertumbuhan (persen) Konstruksi, Triwulan IV/2017 - IV/2018
Table Quarterly Construction Indices (2010=100) and Growth (percent), Quarter IV/2017 - IV/2018
PROVINSI / PROVINCE : R I A U
IV I II III IV
(2) (3) (4) (5) (6)
Pekerja Tetap / Permanent Workers 127.83 126.86 127.62 127.84 128.06
Pertumbuhan / Growth 0.41 -0.76 0.60 0.17 0.17
Hari Orang / Mandays 223.10 218.30 220.85 226.51 229.34
Pertumbuhan / Growth 2.52 -2.15 1.17 2.56 1.25
Balas Jasa dan Upah / 275.15 270.94 277.32 290.76 297.98
Compensation and Wages
Pertumbuhan / Growth 2.74 -1.53 2.36 4.85 2.48
Nilai Konstruksi / Value of Construction 301.88 299.55 309.04 324.53 334.74
Pertumbuhan / Growth 2.92 -0.77 3.17 5.01 3.14
Prospek Bisnis / Business Prospect 56.62 59.86 62.56 62.36 62.18
Kondisi Bisnis / Business Condition 50.74 51.60 56.73 49.68 49.50
Masalah Bisnis / Business Problems 21.18 29.24 21.43 25.07 25.51
Prospek dan Kondisi Bisnis (PKB) / Prospect and Condition of Business
PKB > 50 % : Pengusaha cenderung optimis akan usahanya / Enterpreneur tend to be optimistic about their business
PKB < 50 % : Pengusaha cenderung pesimis kondisi usahanya / Enterpreneur tend to be pessimistic about their business
Indeks Masalah Bisnis (IMB) / Business Problems Index
IMB < 25 % : Sedikit Masalah / Less problematic
25 % < IMB ≤ 50 % : Cukup Bermasalah / Quite problematic
50 % < IMB ≤ 100 % : Bermasalah / Problematic
Triwulan / Quarter
2018
Construction Indicator 5
Triwulan / Quarter
(1)
5
Uraian
Description 2017
https:
//www.b
ps.go.id

Tabel Indeks (2010=100) dan Pertumbuhan (persen) Konstruksi, Triwulan IV/2017 - IV/2018
Table Quarterly Construction Indices (2010=100) and Growth (percent), Quarter IV/2017 - IV/2018
PROVINSI / PROVINCE : J A M B I
IV I II III IV
(2) (3) (4) (5) (6)
Pekerja Tetap / Permanent Workers 117.02 115.98 116.31 117.11 117.16
Pertumbuhan / Growth 0.00 -0.89 0.28 0.69 0.04
Hari Orang / Mandays 159.04 155.79 156.99 159.60 161.27
Pertumbuhan / Growth 1.57 -2.04 0.77 1.66 1.05
Balas Jasa dan Upah / 200.61 197.90 201.51 207.15 210.98
Compensation and Wages
Pertumbuhan / Growth 1.59 -1.35 1.82 2.80 1.85
Nilai Konstruksi / Value of Construction 217.64 215.40 220.38 228.18 233.43
Pertumbuhan / Growth 1.83 -1.03 2.31 3.54 2.30
Prospek Bisnis / Business Prospect 63.13 59.69 50.00 59.54 55.99
Kondisi Bisnis / Business Condition 61.88 56.27 50.00 43.75 51.56
Masalah Bisnis / Business Problems 14.29 17.21 37.50 17.35 21.48
Prospek dan Kondisi Bisnis (PKB) / Prospect and Condition of Business
PKB > 50 % : Pengusaha cenderung optimis akan usahanya / Enterpreneur tend to be optimistic about their business
PKB < 50 % : Pengusaha cenderung pesimis kondisi usahanya / Enterpreneur tend to be pessimistic about their business
Indeks Masalah Bisnis (IMB) / Business Problems Index
IMB < 25 % : Sedikit Masalah / Less problematic
25 % < IMB ≤ 50 % : Cukup Bermasalah / Quite problematic
50 % < IMB ≤ 100 % : Bermasalah / Problematic
6 Indikator Konstruksi
Triwulan / Quarter
20182017
(1)
6
Uraian
Description
Triwulan / Quarter
https:
//www.b
ps.go.id

Tabel Indeks (2010=100) dan Pertumbuhan (persen) Konstruksi, Triwulan IV/2017 - IV/2018
Table Quarterly Construction Indices (2010=100) and Growth (percent), Quarter IV/2017 - IV/2018
PROVINSI / PROVINCE : SUMATERA SELATAN
IV I II III IV
(2) (3) (4) (5) (6)
Pekerja Tetap / Permanent Workers 127.63 127.96 129.00 129.42 129.53
Pertumbuhan / Growth 1.85 0.26 0.81 0.33 0.08
Hari Orang / Mandays 213.15 215.43 218.21 224.70 227.28
Pertumbuhan / Growth 3.40 1.07 1.29 2.97 1.15
Balas Jasa dan Upah / 264.40 266.54 272.24 284.02 287.61
Compensation and Wages
Pertumbuhan / Growth 4.13 0.81 2.14 4.33 1.26
Nilai Konstruksi / Value of Construction 273.69 276.71 284.92 299.50 304.94
Pertumbuhan / Growth 3.11 1.10 2.96 5.12 1.82
Prospek Bisnis / Business Prospect 55.11 55.87 55.27 56.37 52.69
Kondisi Bisnis / Business Condition 51.70 52.55 48.63 54.60 52.69
Masalah Bisnis / Business Problems 18.66 27.08 18.51 20.08 15.70
Prospek dan Kondisi Bisnis (PKB) / Prospect and Condition of Business
PKB > 50 % : Pengusaha cenderung optimis akan usahanya / Enterpreneur tend to be optimistic about their business
PKB < 50 % : Pengusaha cenderung pesimis kondisi usahanya / Enterpreneur tend to be pessimistic about their business
Indeks Masalah Bisnis (IMB) / Business Problems Index
IMB < 25 % : Sedikit Masalah / Less problematic
25 % < IMB ≤ 50 % : Cukup Bermasalah / Quite problematic
50 % < IMB ≤ 100 % : Bermasalah / Problematic
2018
Construction Indicator 7
Triwulan / QuarterTriwulan / Quarter
(1)
7
Uraian
Description 2017
https:
//www.b
ps.go.id

Tabel Indeks (2010=100) dan Pertumbuhan (persen) Konstruksi, Triwulan IV/2017 - IV/2018
Table Quarterly Construction Indices (2010=100) and Growth (percent), Quarter IV/2017 - IV/2018
PROVINSI / PROVINCE : BENGKULU
IV I II III IV
(2) (3) (4) (5) (6)
Pekerja Tetap / Permanent Workers 116.04 114.31 114.97 115.64 116.36
Pertumbuhan / Growth 0.37 -1.50 0.58 0.58 0.63
Hari Orang / Mandays 167.92 166.75 168.47 171.70 173.83
Pertumbuhan / Growth 1.21 -0.70 1.03 1.92 1.24
Balas Jasa dan Upah / 195.36 192.25 196.29 201.41 206.00
Compensation and Wages
Pertumbuhan / Growth 1.80 -1.59 2.10 2.61 2.28
Nilai Konstruksi / Value of Construction 202.16 196.94 201.60 208.48 214.21
Pertumbuhan / Growth 1.58 -2.58 2.36 3.41 2.75
Prospek Bisnis / Business Prospect 75.00 55.20 54.40 57.29 59.57
Kondisi Bisnis / Business Condition 67.19 50.91 54.17 53.33 56.45
Masalah Bisnis / Business Problems 29.17 30.67 15.82 18.06 19.74
Prospek dan Kondisi Bisnis (PKB) / Prospect and Condition of Business
PKB > 50 % : Pengusaha cenderung optimis akan usahanya / Enterpreneur tend to be optimistic about their business
PKB < 50 % : Pengusaha cenderung pesimis kondisi usahanya / Enterpreneur tend to be pessimistic about their business
Indeks Masalah Bisnis (IMB) / Business Problems Index
IMB < 25 % : Sedikit Masalah / Less problematic
25 % < IMB ≤ 50 % : Cukup Bermasalah / Quite problematic
50 % < IMB ≤ 100 % : Bermasalah / Problematic
8 Indikator Konstruksi
Triwulan / Quarter
2018
8
Uraian
Description
(1)
Triwulan / Quarter
2017
https:
//www.b
ps.go.id

Tabel Indeks (2010=100) dan Pertumbuhan (persen) Konstruksi, Triwulan IV/2017 - IV/2018
Table Quarterly Construction Indices (2010=100) and Growth (percent), Quarter IV/2017 - IV/2018
PROVINSI / PROVINCE : LAMPUNG
IV I II III IV
(2) (3) (4) (5) (6)
Pekerja Tetap / Permanent Workers 113.05 112.29 113.09 113.14 113.16
Pertumbuhan / Growth 0.00 -0.67 0.71 0.04 0.02
Hari Orang / Mandays 184.03 180.05 182.43 186.36 188.41
Pertumbuhan / Growth 2.16 -2.16 1.32 2.16 1.10
Balas Jasa dan Upah / 212.22 209.74 214.09 220.88 225.57
Compensation and Wages
Pertumbuhan / Growth 2.35 -1.17 2.07 3.17 2.12
Nilai Konstruksi / Value of Construction 225.61 222.02 228.78 236.83 244.08
Pertumbuhan / Growth 2.02 -1.59 3.05 3.52 3.06
Prospek Bisnis / Business Prospect 72.92 60.64 58.33 57.07 61.20
Kondisi Bisnis / Business Condition 66.67 55.96 68.75 55.98 57.81
Masalah Bisnis / Business Problems 36.67 30.63 37.50 20.75 21.38
Prospek dan Kondisi Bisnis (PKB) / Prospect and Condition of Business
PKB > 50 % : Pengusaha cenderung optimis akan usahanya / Enterpreneur tend to be optimistic about their business
PKB < 50 % : Pengusaha cenderung pesimis kondisi usahanya / Enterpreneur tend to be pessimistic about their business
Indeks Masalah Bisnis (IMB) / Business Problems Index
IMB < 25 % : Sedikit Masalah / Less problematic
25 % < IMB ≤ 50 % : Cukup Bermasalah / Quite problematic
50 % < IMB ≤ 100 % : Bermasalah / Problematic
Triwulan / Quarter
2018
Construction Indicator 9
Triwulan / Quarter
2017
9
Uraian
Description
(1)
https:
//www.b
ps.go.id

Tabel Indeks (2010=100) dan Pertumbuhan (persen) Konstruksi, Triwulan IV/2017 - IV/2018
Table Quarterly Construction Indices (2010=100) and Growth (percent), Quarter IV/2017 - IV/2018
PROVINSI / PROVINCE : BANGKA BELITUNG
IV I II III IV
(2) (3) (4) (5) (6)
Pekerja Tetap / Permanent Workers 111.96 111.14 111.25 111.64 111.98
Pertumbuhan / Growth 1.50 -0.73 0.10 0.35 0.30
Hari Orang / Mandays 170.07 167.12 168.83 171.89 173.78
Pertumbuhan / Growth 2.38 -1.73 1.02 1.81 1.10
Balas Jasa dan Upah / 199.72 198.44 202.53 207.86 211.99
Compensation and Wages
Pertumbuhan / Growth 2.71 -0.64 2.06 2.63 1.99
Nilai Konstruksi / Value of Construction 209.33 204.18 210.33 217.13 222.15
Pertumbuhan / Growth 2.49 -2.46 3.01 3.23 2.32
Prospek Bisnis / Business Prospect 68.75 62.02 54.76 54.75 55.56
Kondisi Bisnis / Business Condition 68.75 59.36 50.60 46.50 49.77
Masalah Bisnis / Business Problems 50.00 34.99 25.67 21.23 21.25
Prospek dan Kondisi Bisnis (PKB) / Prospect and Condition of Business
PKB > 50 % : Pengusaha cenderung optimis akan usahanya / Enterpreneur tend to be optimistic about their business
PKB < 50 % : Pengusaha cenderung pesimis kondisi usahanya / Enterpreneur tend to be pessimistic about their business
Indeks Masalah Bisnis (IMB) / Business Problems Index
IMB < 25 % : Sedikit Masalah / Less problematic
25 % < IMB ≤ 50 % : Cukup Bermasalah / Quite problematic
50 % < IMB ≤ 100 % : Bermasalah / Problematic
10 Indikator Konstruksi
20182017
Triwulan / QuarterTriwulan / Quarter
Description
(1)
10
Uraian
https:
//www.b
ps.go.id

Tabel Indeks (2010=100) dan Pertumbuhan (persen) Konstruksi, Triwulan IV/2017 - IV/2018
Table Quarterly Construction Indices (2010=100) and Growth (percent), Quarter IV/2017 - IV/2018
PROVINSI / PROVINCE : KEPULAUAN R I A U
IV I II III IV
(2) (3) (4) (5) (6)
Pekerja Tetap / Permanent Workers 133.85 132.77 132.84 133.36 134.15
Pertumbuhan / Growth 0.99 -0.81 0.05 0.40 0.59
Hari Orang / Mandays 185.62 183.78 185.66 188.75 190.68
Pertumbuhan / Growth 2.41 -0.99 1.02 1.67 1.02
Balas Jasa dan Upah / 232.10 228.20 233.16 239.86 244.35
Compensation and Wages
Pertumbuhan / Growth 2.12 -1.68 2.18 2.87 1.87
Nilai Konstruksi / Value of Construction 252.74 248.64 256.17 264.02 270.57
Pertumbuhan / Growth 2.28 -1.62 3.03 3.06 2.48
Prospek Bisnis / Business Prospect 55.00 56.73 52.34 51.81 51.81
Kondisi Bisnis / Business Condition 53.13 52.20 52.73 51.61 51.61
Masalah Bisnis / Business Problems 24.73 31.35 24.28 15.86 16.04
Prospek dan Kondisi Bisnis (PKB) / Prospect and Condition of Business
PKB > 50 % : Pengusaha cenderung optimis akan usahanya / Enterpreneur tend to be optimistic about their business
PKB < 50 % : Pengusaha cenderung pesimis kondisi usahanya / Enterpreneur tend to be pessimistic about their business
Indeks Masalah Bisnis (IMB) / Business Problems Index
IMB < 25 % : Sedikit Masalah / Less problematic
25 % < IMB ≤ 50 % : Cukup Bermasalah / Quite problematic
50 % < IMB ≤ 100 % : Bermasalah / Problematic
Triwulan / Quarter
2018
Construction Indicator 11
Triwulan / Quarter
(1)
11
Uraian
Description 2017
https:
//www.b
ps.go.id

Tabel Indeks (2010=100) dan Pertumbuhan (persen) Konstruksi, Triwulan IV/2017 - IV/2018
Table Quarterly Construction Indices (2010=100) and Growth (percent), Quarter IV/2017 - IV/2018
PROVINSI / PROVINCE : DKI JAKARTA
IV I II III IV
(2) (3) (4) (5) (6)
Pekerja Tetap / Permanent Workers 121.82 121.46 122.73 124.55 124.71
Pertumbuhan / Growth 0.59 -0.30 1.05 1.48 0.12
Hari Orang / Mandays 230.20 225.88 230.49 238.69 243.42
Pertumbuhan / Growth 3.03 -1.87 2.04 3.56 1.98
Balas Jasa dan Upah / 278.68 272.55 280.50 295.22 302.74
Compensation and Wages
Pertumbuhan / Growth 3.49 -2.20 2.92 5.25 2.55
Nilai Konstruksi / Value of Construction 307.35 298.55 314.04 333.72 345.02
Pertumbuhan / Growth 3.28 -2.86 5.19 6.27 3.38
Prospek Bisnis / Business Prospect 58.99 56.61 54.39 55.88 51.44
Kondisi Bisnis / Business Condition 54.53 54.63 59.15 59.74 60.01
Masalah Bisnis / Business Problems 39.40 42.78 33.95 40.31 40.23
Prospek dan Kondisi Bisnis (PKB) / Prospect and Condition of Business
PKB > 50 % : Pengusaha cenderung optimis akan usahanya / Enterpreneur tend to be optimistic about their business
PKB < 50 % : Pengusaha cenderung pesimis kondisi usahanya / Enterpreneur tend to be pessimistic about their business
Indeks Masalah Bisnis (IMB) / Business Problems Index
IMB < 25 % : Sedikit Masalah / Less problematic
25 % < IMB ≤ 50 % : Cukup Bermasalah / Quite problematic
50 % < IMB ≤ 100 % : Bermasalah / Problematic
12 Indikator Konstruksi
Triwulan / Quarter
2018
12
Uraian
Description
(1)
Triwulan / Quarter
2017
https:
//www.b
ps.go.id

Tabel Indeks (2010=100) dan Pertumbuhan (persen) Konstruksi, Triwulan IV/2017 - IV/2018
Table Quarterly Construction Indices (2010=100) and Growth (percent), Quarter IV/2017 - IV/2018
PROVINSI / PROVINCE : JAWA BARAT
IV I II III IV
(2) (3) (4) (5) (6)
Pekerja Tetap / Permanent Workers 127.45 126.13 127.06 128.47 128.90
Pertumbuhan / Growth 1.80 -1.04 0.74 1.11 0.33
Hari Orang / Mandays 222.78 216.88 221.04 229.16 233.88
Pertumbuhan / Growth 2.45 -2.65 1.92 3.67 2.06
Balas Jasa dan Upah / 320.09 315.74 324.85 341.10 350.88
Compensation and Wages
Pertumbuhan / Growth 3.40 -1.36 2.88 5.00 2.87
Nilai Konstruksi / Value of Construction 348.41 342.21 356.30 377.49 391.73
Pertumbuhan / Growth 3.21 -1.78 4.12 5.95 3.77
Prospek Bisnis / Business Prospect 61.25 60.64 61.61 55.25 56.38
Kondisi Bisnis / Business Condition 60.63 55.42 58.04 55.75 54.13
Masalah Bisnis / Business Problems 22.99 21.25 14.35 15.94 16.33
Prospek dan Kondisi Bisnis (PKB) / Prospect and Condition of Business
PKB > 50 % : Pengusaha cenderung optimis akan usahanya / Enterpreneur tend to be optimistic about their business
PKB < 50 % : Pengusaha cenderung pesimis kondisi usahanya / Enterpreneur tend to be pessimistic about their business
Indeks Masalah Bisnis (IMB) / Business Problems Index
IMB < 25 % : Sedikit Masalah / Less problematic
25 % < IMB ≤ 50 % : Cukup Bermasalah / Quite problematic
50 % < IMB ≤ 100 % : Bermasalah / Problematic
2018
Construction Indicator 13
Triwulan / Quarter
13
Uraian
Description
(1)
Triwulan / Quarter
2017
https:
//www.b
ps.go.id

Tabel Indeks (2010=100) dan Pertumbuhan (persen) Konstruksi, Triwulan IV/2017 - IV/2018
Table Quarterly Construction Indices (2010=100) and Growth (percent), Quarter IV/2017 - IV/2018
PROVINSI / PROVINCE : JAWA TENGAH
IV I II III IV
(2) (3) (4) (5) (6)
Pekerja Tetap / Permanent Workers 127.24 126.21 127.40 128.70 129.22
Pertumbuhan / Growth 0.41 -0.81 0.94 1.02 0.40
Hari Orang / Mandays 219.58 217.25 221.53 228.73 233.52
Pertumbuhan / Growth 2.24 -1.06 1.97 3.25 2.09
Balas Jasa dan Upah / 301.94 298.41 307.51 320.85 327.50
Compensation and Wages
Pertumbuhan / Growth 2.95 -1.17 3.05 4.34 2.07
Nilai Konstruksi / Value of Construction 323.05 320.39 333.05 350.90 362.33
Pertumbuhan / Growth 3.03 -0.82 3.95 5.36 3.26
Prospek Bisnis / Business Prospect 61.25 58.23 61.65 57.95 57.45
Kondisi Bisnis / Business Condition 58.33 53.08 61.36 61.51 58.78
Masalah Bisnis / Business Problems 26.94 28.00 16.06 18.70 18.94
Prospek dan Kondisi Bisnis (PKB) / Prospect and Condition of Business
PKB > 50 % : Pengusaha cenderung optimis akan usahanya / Enterpreneur tend to be optimistic about their business
PKB < 50 % : Pengusaha cenderung pesimis kondisi usahanya / Enterpreneur tend to be pessimistic about their business
Indeks Masalah Bisnis (IMB) / Business Problems Index
IMB < 25 % : Sedikit Masalah / Less problematic
25 % < IMB ≤ 50 % : Cukup Bermasalah / Quite problematic
50 % < IMB ≤ 100 % : Bermasalah / Problematic
14 Indikator Konstruksi
Triwulan / Quarter
20182017
14
Uraian
Description
(1)
Triwulan / Quarter
https:
//www.b
ps.go.id
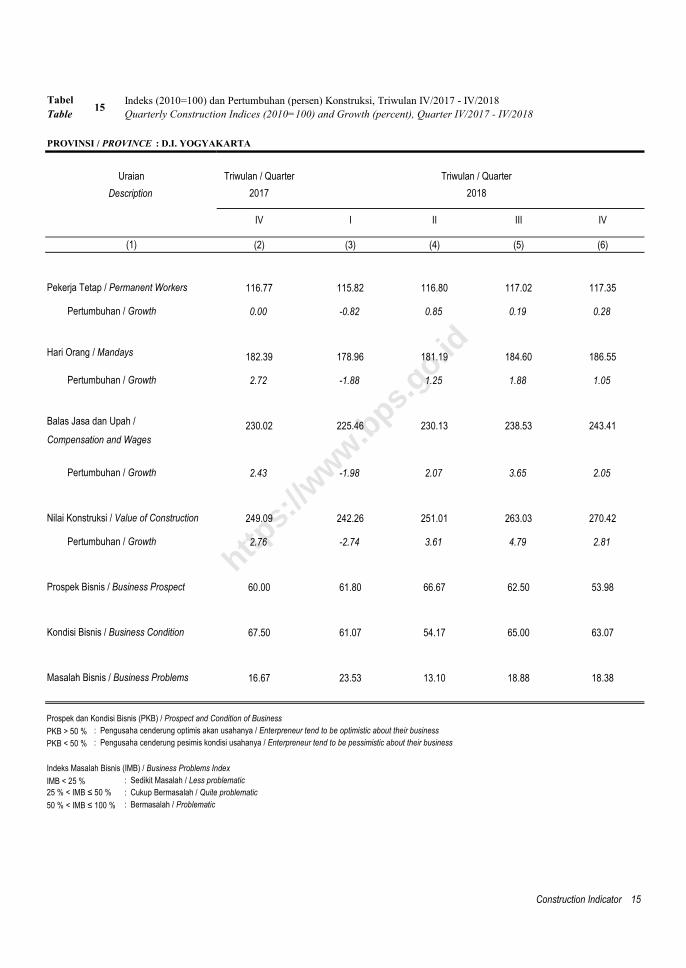
Tabel Indeks (2010=100) dan Pertumbuhan (persen) Konstruksi, Triwulan IV/2017 - IV/2018
Table Quarterly Construction Indices (2010=100) and Growth (percent), Quarter IV/2017 - IV/2018
PROVINSI / PROVINCE : D.I. YOGYAKARTA
IV I II III IV
(2) (3) (4) (5) (6)
Pekerja Tetap / Permanent Workers 116.77 115.82 116.80 117.02 117.35
Pertumbuhan / Growth 0.00 -0.82 0.85 0.19 0.28
Hari Orang / Mandays 182.39 178.96 181.19 184.60 186.55
Pertumbuhan / Growth 2.72 -1.88 1.25 1.88 1.05
Balas Jasa dan Upah / 230.02 225.46 230.13 238.53 243.41
Compensation and Wages
Pertumbuhan / Growth 2.43 -1.98 2.07 3.65 2.05
Nilai Konstruksi / Value of Construction 249.09 242.26 251.01 263.03 270.42
Pertumbuhan / Growth 2.76 -2.74 3.61 4.79 2.81
Prospek Bisnis / Business Prospect 60.00 61.80 66.67 62.50 53.98
Kondisi Bisnis / Business Condition 67.50 61.07 54.17 65.00 63.07
Masalah Bisnis / Business Problems 16.67 23.53 13.10 18.88 18.38
Prospek dan Kondisi Bisnis (PKB) / Prospect and Condition of Business
PKB > 50 % : Pengusaha cenderung optimis akan usahanya / Enterpreneur tend to be optimistic about their business
PKB < 50 % : Pengusaha cenderung pesimis kondisi usahanya / Enterpreneur tend to be pessimistic about their business
Indeks Masalah Bisnis (IMB) / Business Problems Index
IMB < 25 % : Sedikit Masalah / Less problematic
25 % < IMB ≤ 50 % : Cukup Bermasalah / Quite problematic
50 % < IMB ≤ 100 % : Bermasalah / Problematic
Triwulan / Quarter
2018
Construction Indicator 15
Triwulan / Quarter
2017
15
Uraian
Description
(1)
https:
//www.b
ps.go.id

Tabel Indeks (2010=100) dan Pertumbuhan (persen) Konstruksi, Triwulan IV/2017 - IV/2018
Table Quarterly Construction Indices (2010=100) and Growth (percent), Quarter IV/2017 - IV/2018
PROVINSI / PROVINCE : JAWA TIMUR
IV I II III IV
(2) (3) (4) (5) (6)
Pekerja Tetap / Permanent Workers 122.04 121.20 122.19 123.24 123.90
Pertumbuhan / Growth 0.09 -0.69 0.81 0.86 0.53
Hari Orang / Mandays 198.07 195.28 197.97 204.41 208.86
Pertumbuhan / Growth 2.92 -1.41 1.37 3.26 2.18
Balas Jasa dan Upah / 293.70 289.23 295.86 309.70 315.75
Compensation and Wages
Pertumbuhan / Growth 3.06 -1.52 2.29 4.68 1.95
Nilai Konstruksi / Value of Construction 307.71 300.84 313.37 330.40 341.48
Pertumbuhan / Growth 3.13 -2.23 4.16 5.43 3.35
Prospek Bisnis / Business Prospect 52.99 55.57 60.13 58.99 55.04
Kondisi Bisnis / Business Condition 47.28 52.63 59.05 57.13 55.50
Masalah Bisnis / Business Problems 24.82 32.58 17.74 18.09 18.04
Prospek dan Kondisi Bisnis (PKB) / Prospect and Condition of Business
PKB > 50 % : Pengusaha cenderung optimis akan usahanya / Enterpreneur tend to be optimistic about their business
PKB < 50 % : Pengusaha cenderung pesimis kondisi usahanya / Enterpreneur tend to be pessimistic about their business
Indeks Masalah Bisnis (IMB) / Business Problems Index
IMB < 25 % : Sedikit Masalah / Less problematic
25 % < IMB ≤ 50 % : Cukup Bermasalah / Quite problematic
50 % < IMB ≤ 100 % : Bermasalah / Problematic
16 Indikator Konstruksi
Triwulan / Quarter
2018
Triwulan / Quarter
2017
(1)
16
Uraian
Description
https:
//www.b
ps.go.id

Tabel Indeks (2010=100) dan Pertumbuhan (persen) Konstruksi, Triwulan IV/2017 - IV/2018
Table Quarterly Construction Indices (2010=100) and Growth (percent), Quarter IV/2017 - IV/2018
PROVINSI / PROVINCE : B A N T E N
IV I II III IV
(2) (3) (4) (5) (6)
Pekerja Tetap / Permanent Workers 115.33 114.21 114.98 115.14 115.61
Pertumbuhan / Growth 0.40 -0.97 0.67 0.14 0.41
Hari Orang / Mandays 218.77 211.14 215.20 220.21 222.87
Pertumbuhan / Growth 2.57 -3.49 1.93 2.33 1.21
Balas Jasa dan Upah / 274.57 267.57 275.49 285.70 291.09
Compensation and Wages
Pertumbuhan / Growth 3.10 -2.55 2.96 3.71 1.89
Nilai Konstruksi / Value of Construction 291.50 283.37 294.63 309.32 318.55
Pertumbuhan / Growth 3.00 -2.79 3.97 4.99 2.98
Prospek Bisnis / Business Prospect 55.39 60.67 59.25 62.91 53.26
Kondisi Bisnis / Business Condition 54.74 57.81 55.75 62.23 62.76
Masalah Bisnis / Business Problems 23.77 29.04 10.97 17.76 18.91
Prospek dan Kondisi Bisnis (PKB) / Prospect and Condition of Business
PKB > 50 % : Pengusaha cenderung optimis akan usahanya / Enterpreneur tend to be optimistic about their business
PKB < 50 % : Pengusaha cenderung pesimis kondisi usahanya / Enterpreneur tend to be pessimistic about their business
Indeks Masalah Bisnis (IMB) / Business Problems Index
IMB < 25 % : Sedikit Masalah / Less problematic
25 % < IMB ≤ 50 % : Cukup Bermasalah / Quite problematic
50 % < IMB ≤ 100 % : Bermasalah / Problematic
Construction Indicator 17
Triwulan / Quarter
2018
17
Description
(1)
Uraian Triwulan / Quarter
2017
https:
//www.b
ps.go.id
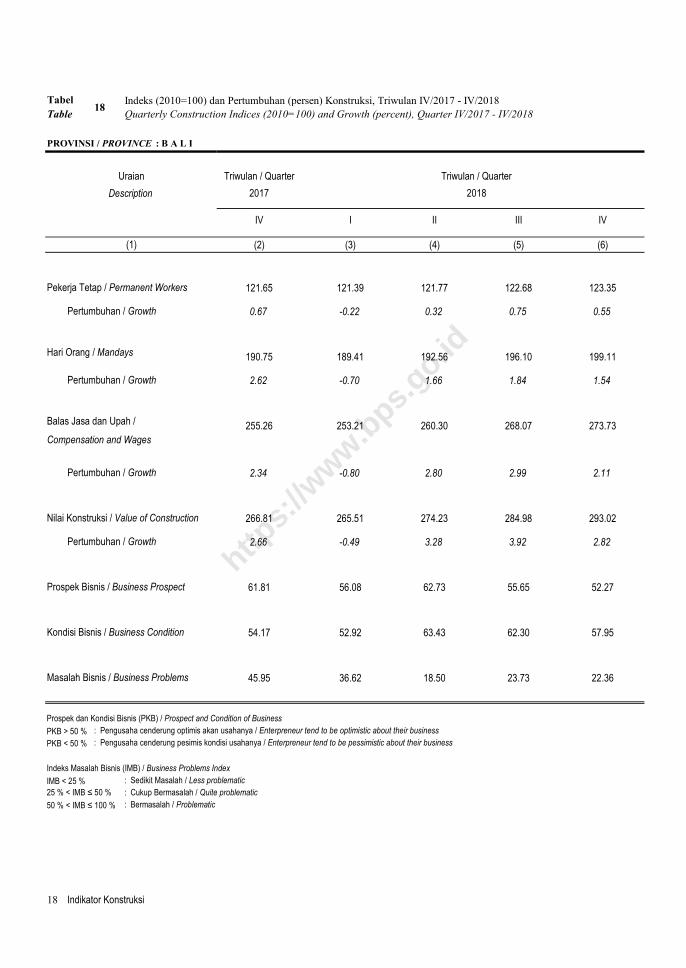
Tabel Indeks (2010=100) dan Pertumbuhan (persen) Konstruksi, Triwulan IV/2017 - IV/2018
Table Quarterly Construction Indices (2010=100) and Growth (percent), Quarter IV/2017 - IV/2018
PROVINSI / PROVINCE : B A L I
IV I II III IV
(2) (3) (4) (5) (6)
Pekerja Tetap / Permanent Workers 121.65 121.39 121.77 122.68 123.35
Pertumbuhan / Growth 0.67 -0.22 0.32 0.75 0.55
Hari Orang / Mandays 190.75 189.41 192.56 196.10 199.11
Pertumbuhan / Growth 2.62 -0.70 1.66 1.84 1.54
Balas Jasa dan Upah / 255.26 253.21 260.30 268.07 273.73
Compensation and Wages
Pertumbuhan / Growth 2.34 -0.80 2.80 2.99 2.11
Nilai Konstruksi / Value of Construction 266.81 265.51 274.23 284.98 293.02
Pertumbuhan / Growth 2.66 -0.49 3.28 3.92 2.82
Prospek Bisnis / Business Prospect 61.81 56.08 62.73 55.65 52.27
Kondisi Bisnis / Business Condition 54.17 52.92 63.43 62.30 57.95
Masalah Bisnis / Business Problems 45.95 36.62 18.50 23.73 22.36
Prospek dan Kondisi Bisnis (PKB) / Prospect and Condition of Business
PKB > 50 % : Pengusaha cenderung optimis akan usahanya / Enterpreneur tend to be optimistic about their business
PKB < 50 % : Pengusaha cenderung pesimis kondisi usahanya / Enterpreneur tend to be pessimistic about their business
Indeks Masalah Bisnis (IMB) / Business Problems Index
IMB < 25 % : Sedikit Masalah / Less problematic
25 % < IMB ≤ 50 % : Cukup Bermasalah / Quite problematic
50 % < IMB ≤ 100 % : Bermasalah / Problematic
18 Indikator Konstruksi
Triwulan / Quarter
2018
Triwulan / Quarter
2017
Uraian
Description
(1)
18
https:
//www.b
ps.go.id

Tabel Indeks (2010=100) dan Pertumbuhan (persen) Konstruksi, Triwulan IV/2017 - IV/2018
Table Quarterly Construction Indices (2010=100) and Growth (percent), Quarter IV/2017 - IV/2018
PROVINSI / PROVINCE : NUSA TENGGARA BARAT
IV I II III IV
(2) (3) (4) (5) (6)
Pekerja Tetap / Permanent Workers 112.53 112.21 112.64 113.08 113.41
Pertumbuhan / Growth 0.00 -0.29 0.39 0.39 0.29
Hari Orang / Mandays 171.52 167.41 169.75 173.14 175.34
Pertumbuhan / Growth 2.87 -2.40 1.40 2.00 1.27
Balas Jasa dan Upah / 204.39 199.10 202.93 210.69 215.26
Compensation and Wages
Pertumbuhan / Growth 2.68 -2.59 1.92 3.82 2.17
Nilai Konstruksi / Value of Construction 217.22 212.12 217.72 226.59 233.13
Pertumbuhan / Growth 2.68 -2.35 2.64 4.07 2.89
Prospek Bisnis / Business Prospect 51.39 52.32 66.07 55.54 55.54
Kondisi Bisnis / Business Condition 50.00 52.87 66.07 43.61 43.61
Masalah Bisnis / Business Problems 37.84 41.81 36.25 33.56 33.56
Prospek dan Kondisi Bisnis (PKB) / Prospect and Condition of Business
PKB > 50 % : Pengusaha cenderung optimis akan usahanya / Enterpreneur tend to be optimistic about their business
PKB < 50 % : Pengusaha cenderung pesimis kondisi usahanya / Enterpreneur tend to be pessimistic about their business
Indeks Masalah Bisnis (IMB) / Business Problems Index
IMB < 25 % : Sedikit Masalah / Less problematic
25 % < IMB ≤ 50 % : Cukup Bermasalah / Quite problematic
50 % < IMB ≤ 100 % : Bermasalah / Problematic
Construction Indicator 19
Triwulan / Quarter
2018Description
(1)
Uraian
19
Triwulan / Quarter
2017
https:
//www.b
ps.go.id

Tabel Indeks (2010=100) dan Pertumbuhan (persen) Konstruksi, Triwulan IV/2017 - IV/2018
Table Quarterly Construction Indices (2010=100) and Growth (percent), Quarter IV/2017 - IV/2018
PROVINSI / PROVINCE : NUSA TENGGARA TIMUR
IV I II III IV
(2) (3) (4) (5) (6)
Pekerja Tetap / Permanent Workers 115.67 113.97 114.61 115.12 115.58
Pertumbuhan / Growth 0.00 -1.47 0.56 0.44 0.40
Hari Orang / Mandays 151.29 147.01 148.00 150.43 152.83
Pertumbuhan / Growth 2.10 -2.83 0.68 1.64 1.60
Balas Jasa dan Upah / 186.80 182.68 185.50 190.03 193.92
Compensation and Wages
Pertumbuhan / Growth 1.84 -2.21 1.55 2.44 2.05
Nilai Konstruksi / Value of Construction 195.64 189.29 193.51 199.12 203.92
Pertumbuhan / Growth 1.90 -3.25 2.23 2.90 2.41
Prospek Bisnis / Business Prospect 70.19 52.51 47.83 55.51 55.51
Kondisi Bisnis / Business Condition 67.31 53.42 49.18 56.50 56.50
Masalah Bisnis / Business Problems 23.25 26.28 19.66 20.20 21.68
Prospek dan Kondisi Bisnis (PKB) / Prospect and Condition of Business
PKB > 50 % : Pengusaha cenderung optimis akan usahanya / Enterpreneur tend to be optimistic about their business
PKB < 50 % : Pengusaha cenderung pesimis kondisi usahanya / Enterpreneur tend to be pessimistic about their business
Indeks Masalah Bisnis (IMB) / Business Problems Index
IMB < 25 % : Sedikit Masalah / Less problematic
25 % < IMB ≤ 50 % : Cukup Bermasalah / Quite problematic
50 % < IMB ≤ 100 % : Bermasalah / Problematic
20 Indikator Konstruksi
Triwulan / Quarter
2018
20
Uraian
Description
(1)
Triwulan / Quarter
2017
https:
//www.b
ps.go.id

Tabel Indeks (2010=100) dan Pertumbuhan (persen) Konstruksi, Triwulan IV/2017 - IV/2018
Table Quarterly Construction Indices (2010=100) and Growth (percent), Quarter IV/2017 - IV/2018
PROVINSI / PROVINCE : KALIMANTAN BARAT
IV I II III IV
(2) (3) (4) (5) (6)
Pekerja Tetap / Permanent Workers 115.70 114.97 115.71 116.52 116.95
Pertumbuhan / Growth 0.41 -0.63 0.65 0.70 0.37
Hari Orang / Mandays 207.27 203.75 206.43 209.17 211.64
Pertumbuhan / Growth 2.53 -1.70 1.32 1.32 1.18
Balas Jasa dan Upah / 265.41 262.01 267.04 273.13 278.41
Compensation and Wages
Pertumbuhan / Growth 2.41 -1.28 1.92 2.28 1.93
Nilai Konstruksi / Value of Construction 277.05 269.96 277.18 284.56 291.67
Pertumbuhan / Growth 2.62 -2.56 2.68 2.66 2.50
Prospek Bisnis / Business Prospect 54.86 55.11 53.04 52.36 49.15
Kondisi Bisnis / Business Condition 45.83 53.24 56.79 55.12 54.07
Masalah Bisnis / Business Problems 36.27 28.81 19.91 19.49 21.15
Prospek dan Kondisi Bisnis (PKB) / Prospect and Condition of Business
PKB > 50 % : Pengusaha cenderung optimis akan usahanya / Enterpreneur tend to be optimistic about their business
PKB < 50 % : Pengusaha cenderung pesimis kondisi usahanya / Enterpreneur tend to be pessimistic about their business
Indeks Masalah Bisnis (IMB) / Business Problems Index
IMB < 25 % : Sedikit Masalah / Less problematic
25 % < IMB ≤ 50 % : Cukup Bermasalah / Quite problematic
50 % < IMB ≤ 100 % : Bermasalah / Problematic
Construction Indicator 21
Triwulan / Quarter
2018
Uraian
(1)
Description
21
Triwulan / Quarter
2017
https:
//www.b
ps.go.id

Tabel Indeks (2010=100) dan Pertumbuhan (persen) Konstruksi, Triwulan IV/2017 - IV/2018
Table Quarterly Construction Indices (2010=100) and Growth (percent), Quarter IV/2017 - IV/2018
PROVINSI / PROVINCE : KALIMANTAN TENGAH
IV I II III IV
(2) (3) (4) (5) (6)
Pekerja Tetap / Permanent Workers 118.37 117.42 118.23 118.60 118.85
Pertumbuhan / Growth 0.74 -0.80 0.69 0.31 0.21
Hari Orang / Mandays 181.06 177.24 180.75 185.28 188.17
Pertumbuhan / Growth 2.08 -2.11 1.98 2.50 1.56
Balas Jasa dan Upah / 243.26 236.69 241.53 250.80 255.78
Compensation and Wages
Pertumbuhan / Growth 2.25 -2.70 2.05 3.84 1.98
Nilai Konstruksi / Value of Construction 254.83 248.03 255.40 265.96 273.48
Pertumbuhan / Growth 2.29 -2.67 2.97 4.14 2.83
Prospek Bisnis / Business Prospect 60.27 59.83 51.56 54.55 50.00
Kondisi Bisnis / Business Condition 58.93 55.29 51.56 54.55 51.14
Masalah Bisnis / Business Problems 21.24 28.20 20.00 13.84 19.95
Prospek dan Kondisi Bisnis (PKB) / Prospect and Condition of Business
PKB > 50 % : Pengusaha cenderung optimis akan usahanya / Enterpreneur tend to be optimistic about their business
PKB < 50 % : Pengusaha cenderung pesimis kondisi usahanya / Enterpreneur tend to be pessimistic about their business
Indeks Masalah Bisnis (IMB) / Business Problems Index
IMB < 25 % : Sedikit Masalah / Less problematic
25 % < IMB ≤ 50 % : Cukup Bermasalah / Quite problematic
50 % < IMB ≤ 100 % : Bermasalah / Problematic
22 Indikator Konstruksi
Triwulan / Quarter
2018
(1)
Description
22
Uraian Triwulan / Quarter
2017
https:
//www.b
ps.go.id
Tabel Indeks (2010=100) dan Pertumbuhan (persen) Konstruksi, Triwulan IV/2017 - IV/2018
Table Quarterly Construction Indices (2010=100) and Growth (percent), Quarter IV/2017 - IV/2018
PROVINSI / PROVINCE : KALIMANTAN SELATAN
IV I II III IV
(2) (3) (4) (5) (6)
Pekerja Tetap / Permanent Workers 116.69 115.21 116.24 116.70 116.95
Pertumbuhan / Growth 0.00 -1.27 0.89 0.39 0.21
Hari Orang / Mandays 211.33 205.48 209.13 213.18 216.97
Pertumbuhan / Growth 2.19 -2.77 1.77 1.94 1.78
Balas Jasa dan Upah / 268.19 260.44 267.10 276.44 283.30
Compensation and Wages
Pertumbuhan / Growth 2.24 -2.89 2.56 3.50 2.48
Nilai Konstruksi / Value of Construction 285.41 278.33 287.03 299.02 308.55
Pertumbuhan / Growth 2.81 -2.48 3.13 4.18 3.19
Prospek Bisnis / Business Prospect 56.25 55.18 64.06 63.02 63.46
Kondisi Bisnis / Business Condition 57.14 54.97 65.63 55.21 51.92
Masalah Bisnis / Business Problems 19.39 21.20 28.87 25.53 25.29
Prospek dan Kondisi Bisnis (PKB) / Prospect and Condition of Business
PKB > 50 % : Pengusaha cenderung optimis akan usahanya / Enterpreneur tend to be optimistic about their business
PKB < 50 % : Pengusaha cenderung pesimis kondisi usahanya / Enterpreneur tend to be pessimistic about their business
Indeks Masalah Bisnis (IMB) / Business Problems Index
IMB < 25 % : Sedikit Masalah / Less problematic
25 % < IMB ≤ 50 % : Cukup Bermasalah / Quite problematic
50 % < IMB ≤ 100 % : Bermasalah / Problematic
Construction Indicator 23
Triwulan / Quarter
2018
23
Uraian
Description
(1)
Triwulan / Quarter
2017
https:
//www.b
ps.go.id

Tabel Indeks (2010=100) dan Pertumbuhan (persen) Konstruksi, Triwulan IV/2017 - IV/2018
Table Quarterly Construction Indices (2010=100) and Growth (percent), Quarter IV/2017 - IV/2018
PROVINSI / PROVINCE : KALIMANTAN TIMUR
IV I II III IV
(2) (3) (4) (5) (6)
Pekerja Tetap / Permanent Workers 139.35 139.14 139.92 140.04 140.66
Pertumbuhan / Growth 0.32 -0.15 0.56 0.09 0.44
Hari Orang / Mandays 212.60 211.09 214.57 220.36 223.92
Pertumbuhan / Growth 2.99 -0.71 1.65 2.70 1.62
Balas Jasa dan Upah / 292.88 291.54 299.80 311.90 318.46
Compensation and Wages
Pertumbuhan / Growth 3.15 -0.46 2.83 4.04 2.10
Nilai Konstruksi / Value of Construction 307.85 306.71 317.65 333.71 344.70
Pertumbuhan / Growth 3.00 -0.37 3.57 5.06 3.29
Prospek Bisnis / Business Prospect 54.17 58.92 54.00 52.72 52.74
Kondisi Bisnis / Business Condition 54.17 53.45 55.86 52.45 52.17
Masalah Bisnis / Business Problems 43.75 38.22 37.10 28.27 27.06
Prospek dan Kondisi Bisnis (PKB) / Prospect and Condition of Business
PKB > 50 % : Pengusaha cenderung optimis akan usahanya / Enterpreneur tend to be optimistic about their business
PKB < 50 % : Pengusaha cenderung pesimis kondisi usahanya / Enterpreneur tend to be pessimistic about their business
Indeks Masalah Bisnis (IMB) / Business Problems Index
IMB < 25 % : Sedikit Masalah / Less problematic
25 % < IMB ≤ 50 % : Cukup Bermasalah / Quite problematic
50 % < IMB ≤ 100 % : Bermasalah / Problematic
24 Indikator Konstruksi
Triwulan / Quarter
2018Description
(1)
24
Uraian Triwulan / Quarter
2017
https:
//www.b
ps.go.id

Tabel Indeks (2010=100) dan Pertumbuhan (persen) Konstruksi, Triwulan IV/2017 - IV/2018
Table Quarterly Construction Indices (2010=100) and Growth (percent), Quarter IV/2017 - IV/2018
PROVINSI / PROVINCE : KALIMANTAN UTARA
IV I II III IV
(2) (3) (4) (5) (6)
Pekerja Tetap / Permanent Workers 134.32 134.35 134.92 135.09 135.51
Pertumbuhan / Growth 0.62 0.02 0.42 0.13 0.31
Hari Orang / Mandays 218.47 218.70 221.80 227.35 229.66
Pertumbuhan / Growth 2.55 0.10 1.42 2.50 1.02
Balas Jasa dan Upah / 297.19 297.42 305.08 314.70 318.26
Compensation and Wages
Pertumbuhan / Growth 3.11 0.08 2.57 3.16 1.13
Nilai Konstruksi / Value of Construction 305.22 305.76 315.09 330.72 340.56
Pertumbuhan / Growth 2.66 0.18 3.05 4.96 2.98
Prospek Bisnis / Business Prospect 59.38 46.37 54.00 48.75 49.70
Kondisi Bisnis / Business Condition 50.00 42.06 52.75 46.88 47.02
Masalah Bisnis / Business Problems 50.00 40.20 36.15 36.87 36.58
Prospek dan Kondisi Bisnis (PKB) / Prospect and Condition of Business
PKB > 50 % : Pengusaha cenderung optimis akan usahanya / Enterpreneur tend to be optimistic about their business
PKB < 50 % : Pengusaha cenderung pesimis kondisi usahanya / Enterpreneur tend to be pessimistic about their business
Indeks Masalah Bisnis (IMB) / Business Problems Index
IMB < 25 % : Sedikit Masalah / Less problematic
25 % < IMB ≤ 50 % : Cukup Bermasalah / Quite problematic
50 % < IMB ≤ 100 % : Bermasalah / Problematic
Construction Indicator 25
Triwulan / Quarter
2018Description
(1)
25
Uraian Triwulan / Quarter
2017
https:
//www.b
ps.go.id

Tabel Indeks (2010=100) dan Pertumbuhan (persen) Konstruksi, Triwulan IV/2017 - IV/2018
Table Quarterly Construction Indices (2010=100) and Growth (percent), Quarter IV/2017 - IV/2018
PROVINSI / PROVINCE : SULAWESI UTARA
IV I II III IV
(2) (3) (4) (5) (6)
Pekerja Tetap / Permanent Workers 114.74 113.68 114.24 114.93 115.36
Pertumbuhan / Growth 0.00 -0.92 0.49 0.60 0.38
Hari Orang / Mandays 158.97 157.78 160.37 163.87 166.91
Pertumbuhan / Growth 1.68 -0.75 1.64 2.18 1.86
Balas Jasa dan Upah / 230.20 223.56 228.59 237.87 243.35
Compensation and Wages
Pertumbuhan / Growth 2.07 -2.89 2.25 4.06 2.30
Nilai Konstruksi / Value of Construction 247.69 241.59 249.08 260.32 268.50
Pertumbuhan / Growth 2.26 -2.46 3.10 4.51 3.14
Prospek Bisnis / Business Prospect 62.50 46.07 55.83 53.91 49.78
Kondisi Bisnis / Business Condition 51.56 42.02 62.50 55.73 49.35
Masalah Bisnis / Business Problems 35.42 26.10 12.10 16.46 22.75
Prospek dan Kondisi Bisnis (PKB) / Prospect and Condition of Business
PKB > 50 % : Pengusaha cenderung optimis akan usahanya / Enterpreneur tend to be optimistic about their business
PKB < 50 % : Pengusaha cenderung pesimis kondisi usahanya / Enterpreneur tend to be pessimistic about their business
Indeks Masalah Bisnis (IMB) / Business Problems Index
IMB < 25 % : Sedikit Masalah / Less problematic
25 % < IMB ≤ 50 % : Cukup Bermasalah / Quite problematic
50 % < IMB ≤ 100 % : Bermasalah / Problematic
26 Indikator Konstruksi
Triwulan / Quarter
2018
26
Uraian
Description
(1)
Triwulan / Quarter
2017
https:
//www.b
ps.go.id

Tabel Indeks (2010=100) dan Pertumbuhan (persen) Konstruksi, Triwulan IV/2017 - IV/2018
Table Quarterly Construction Indices (2010=100) and Growth (percent), Quarter IV/2017 - IV/2018
PROVINSI / PROVINCE : SULAWESI TENGAH
IV I II III IV
(2) (3) (4) (5) (6)
Pekerja Tetap / Permanent Workers 110.32 109.37 109.49 109.85 109.99
Pertumbuhan / Growth 0.82 -0.86 0.12 0.32 0.13
Hari Orang / Mandays 172.23 168.26 170.04 172.58 174.40
Pertumbuhan / Growth 2.12 -2.31 1.06 1.50 1.05
Balas Jasa dan Upah / 236.15 233.70 238.11 243.22 247.63
Compensation and Wages
Pertumbuhan / Growth 2.48 -1.04 1.89 2.15 1.81
Nilai Konstruksi / Value of Construction 250.02 246.15 253.33 260.33 267.78
Pertumbuhan / Growth 2.39 -1.55 2.92 2.76 2.86
Prospek Bisnis / Business Prospect 59.38 55.03 62.11 64.81 64.81
Kondisi Bisnis / Business Condition 52.08 52.40 61.33 56.94 56.94
Masalah Bisnis / Business Problems 33.64 39.21 24.93 24.37 25.36
Prospek dan Kondisi Bisnis (PKB) / Prospect and Condition of Business
PKB > 50 % : Pengusaha cenderung optimis akan usahanya / Enterpreneur tend to be optimistic about their business
PKB < 50 % : Pengusaha cenderung pesimis kondisi usahanya / Enterpreneur tend to be pessimistic about their business
Indeks Masalah Bisnis (IMB) / Business Problems Index
IMB < 25 % : Sedikit Masalah / Less problematic
25 % < IMB ≤ 50 % : Cukup Bermasalah / Quite problematic
50 % < IMB ≤ 100 % : Bermasalah / Problematic
Construction Indicator 27
Triwulan / Quarter
2018
(1)
27
Uraian
Description 2017
Triwulan / Quarter
https:
//www.b
ps.go.id

Tabel Indeks (2010=100) dan Pertumbuhan (persen) Konstruksi, Triwulan IV/2017 - IV/2018
Table Quarterly Construction Indices (2010=100) and Growth (percent), Quarter IV/2017 - IV/2018
PROVINSI / PROVINCE : SULAWESI SELATAN
IV I II III IV
(2) (3) (4) (5) (6)
Pekerja Tetap / Permanent Workers 127.89 126.31 127.28 127.30 127.38
Pertumbuhan / Growth 0.55 -1.23 0.77 0.01 0.07
Hari Orang / Mandays 206.68 203.68 206.89 212.97 217.16
Pertumbuhan / Growth 2.43 -1.45 1.58 2.94 1.97
Balas Jasa dan Upah / 263.49 257.77 265.15 277.80 283.91
Compensation and Wages
Pertumbuhan / Growth 2.74 -2.17 2.86 4.77 2.20
Nilai Konstruksi / Value of Construction 282.36 279.22 288.21 302.69 311.82
Pertumbuhan / Growth 2.95 -1.11 3.22 5.03 3.02
Prospek Bisnis / Business Prospect 60.16 56.43 55.16 57.20 59.46
Kondisi Bisnis / Business Condition 57.03 52.90 58.42 58.90 59.64
Masalah Bisnis / Business Problems 14.90 24.28 14.22 17.30 15.85
Prospek dan Kondisi Bisnis (PKB) / Prospect and Condition of Business
PKB > 50 % : Pengusaha cenderung optimis akan usahanya / Enterpreneur tend to be optimistic about their business
PKB < 50 % : Pengusaha cenderung pesimis kondisi usahanya / Enterpreneur tend to be pessimistic about their business
Indeks Masalah Bisnis (IMB) / Business Problems Index
IMB < 25 % : Sedikit Masalah / Less problematic
25 % < IMB ≤ 50 % : Cukup Bermasalah / Quite problematic
50 % < IMB ≤ 100 % : Bermasalah / Problematic
28 Indikator Konstruksi
Triwulan / Quarter
2018
(1)
Description
Uraian
28
Triwulan / Quarter
2017
https:
//www.b
ps.go.id

Tabel Indeks (2010=100) dan Pertumbuhan (persen) Konstruksi, Triwulan IV/2017 - IV/2018
Table Quarterly Construction Indices (2010=100) and Growth (percent), Quarter IV/2017 - IV/2018
PROVINSI / PROVINCE : SULAWESI TENGGARA
IV I II III IV
(2) (3) (4) (5) (6)
Pekerja Tetap / Permanent Workers 118.17 117.99 118.56 119.59 119.63
Pertumbuhan / Growth 1.79 -0.16 0.48 0.87 0.03
Hari Orang / Mandays 171.03 166.96 169.37 171.43 173.72
Pertumbuhan / Growth 1.52 -2.38 1.44 1.22 1.34
Balas Jasa dan Upah / 209.01 203.28 207.41 212.65 216.52
Compensation and Wages
Pertumbuhan / Growth 2.31 -2.74 2.03 2.53 1.82
Nilai Konstruksi / Value of Construction 231.23 224.75 231.47 238.44 245.46
Pertumbuhan / Growth 2.57 -2.80 2.99 3.01 2.94
Prospek Bisnis / Business Prospect 59.03 57.95 58.48 50.65 57.43
Kondisi Bisnis / Business Condition 60.42 53.85 55.36 53.91 49.41
Masalah Bisnis / Business Problems 19.59 28.63 17.67 16.63 17.03
Prospek dan Kondisi Bisnis (PKB) / Prospect and Condition of Business
PKB > 50 % : Pengusaha cenderung optimis akan usahanya / Enterpreneur tend to be optimistic about their business
PKB < 50 % : Pengusaha cenderung pesimis kondisi usahanya / Enterpreneur tend to be pessimistic about their business
Indeks Masalah Bisnis (IMB) / Business Problems Index
IMB < 25 % : Sedikit Masalah / Less problematic
25 % < IMB ≤ 50 % : Cukup Bermasalah / Quite problematic
50 % < IMB ≤ 100 % : Bermasalah / Problematic
2018
Construction Indicator 29
Triwulan / QuarterTriwulan / QuarterUraian
29
Description
(1)
2017
https:
//www.b
ps.go.id

Tabel Indeks (2010=100) dan Pertumbuhan (persen) Konstruksi, Triwulan IV/2017 - IV/2018
Table Quarterly Construction Indices (2010=100) and Growth (percent), Quarter IV/2017 - IV/2018
PROVINSI / PROVINCE : GORONTALO
IV I II III IV
(2) (3) (4) (5) (6)
Pekerja Tetap / Permanent Workers 121.16 121.02 121.94 122.16 122.39
Pertumbuhan / Growth 0.00 -0.12 0.76 0.19 0.18
Hari Orang / Mandays 168.27 167.09 169.40 171.23 173.75
Pertumbuhan / Growth 1.45 -0.70 1.38 1.08 1.47
Balas Jasa dan Upah / 220.68 218.92 223.60 229.73 234.22
Compensation and Wages
Pertumbuhan / Growth 1.82 -0.80 2.14 2.74 1.96
Nilai Konstruksi / Value of Construction 229.14 228.35 234.74 242.87 249.53
Pertumbuhan / Growth 1.69 -0.34 2.80 3.46 2.74
Prospek Bisnis / Business Prospect 62.50 56.99 53.68 61.96 61.72
Kondisi Bisnis / Business Condition 60.16 53.81 52.94 54.62 54.43
Masalah Bisnis / Business Problems 28.52 27.93 18.53 21.92 16.30
Prospek dan Kondisi Bisnis (PKB) / Prospect and Condition of Business
PKB > 50 % : Pengusaha cenderung optimis akan usahanya / Enterpreneur tend to be optimistic about their business
PKB < 50 % : Pengusaha cenderung pesimis kondisi usahanya / Enterpreneur tend to be pessimistic about their business
Indeks Masalah Bisnis (IMB) / Business Problems Index
IMB < 25 % : Sedikit Masalah / Less problematic
25 % < IMB ≤ 50 % : Cukup Bermasalah / Quite problematic
50 % < IMB ≤ 100 % : Bermasalah / Problematic
30 Indikator Konstruksi
Triwulan / Quarter
2018Description
(1)
Uraian
30
Triwulan / Quarter
2017
https:
//www.b
ps.go.id

Tabel Indeks (2010=100) dan Pertumbuhan (persen) Konstruksi, Triwulan IV/2017 - IV/2018
Table Quarterly Construction Indices (2010=100) and Growth (percent), Quarter IV/2017 - IV/2018
PROVINSI / PROVINCE : SULAWESI BARAT
IV I II III IV
(2) (3) (4) (5) (6)
Pekerja Tetap / Permanent Workers 112.49 110.15 110.76 111.36 111.60
Pertumbuhan / Growth 0.00 -2.08 0.55 0.54 0.22
Hari Orang / Mandays 150.26 146.25 147.81 149.44 151.04
Pertumbuhan / Growth 2.01 -2.67 1.07 1.10 1.07
Balas Jasa dan Upah / 191.16 187.64 191.11 196.14 199.71
Compensation and Wages
Pertumbuhan / Growth 1.98 -1.84 1.85 2.63 1.82
Nilai Konstruksi / Value of Construction 214.93 211.77 216.60 222.71 228.54
Pertumbuhan / Growth 2.17 -1.47 2.28 2.82 2.62
Prospek Bisnis / Business Prospect 45.83 48.47 63.39 48.86 44.79
Kondisi Bisnis / Business Condition 45.83 49.08 61.61 48.30 42.71
Masalah Bisnis / Business Problems 44.44 22.46 18.96 16.90 22.11
Prospek dan Kondisi Bisnis (PKB) / Prospect and Condition of Business
PKB > 50 % : Pengusaha cenderung optimis akan usahanya / Enterpreneur tend to be optimistic about their business
PKB < 50 % : Pengusaha cenderung pesimis kondisi usahanya / Enterpreneur tend to be pessimistic about their business
Indeks Masalah Bisnis (IMB) / Business Problems Index
IMB < 25 % : Sedikit Masalah / Less problematic
25 % < IMB ≤ 50 % : Cukup Bermasalah / Quite problematic
50 % < IMB ≤ 100 % : Bermasalah / Problematic
Triwulan / Quarter
2018
Construction Indicator 31
Description
(1)
31
Uraian Triwulan / Quarter
2017
https:
//www.b
ps.go.id

Tabel Indeks (2010=100) dan Pertumbuhan (persen) Konstruksi, Triwulan IV/2017 - IV/2018
Table Quarterly Construction Indices (2010=100) and Growth (percent), Quarter IV/2017 - IV/2018
PROVINSI / PROVINCE : MALUKU
IV I II III IV
(2) (3) (4) (5) (6)
Pekerja Tetap / Permanent Workers 116.14 113.52 114.06 114.11 114.76
Pertumbuhan / Growth 0.00 -2.26 0.47 0.05 0.57
Hari Orang / Mandays 181.03 177.95 180.53 182.77 184.65
Pertumbuhan / Growth 2.34 -1.70 1.45 1.24 1.03
Balas Jasa dan Upah / 222.48 217.21 221.87 226.63 230.92
Compensation and Wages
Pertumbuhan / Growth 2.55 -2.37 2.15 2.15 1.89
Nilai Konstruksi / Value of Construction 225.61 221.27 228.39 235.45 242.46
Pertumbuhan / Growth 2.38 -1.92 3.22 3.09 2.97
Prospek Bisnis / Business Prospect 69.71 61.49 55.71 57.50 57.50
Kondisi Bisnis / Business Condition 69.71 53.63 50.18 50.25 50.25
Masalah Bisnis / Business Problems 18.07 30.99 18.00 19.81 17.92
Prospek dan Kondisi Bisnis (PKB) / Prospect and Condition of Business
PKB > 50 % : Pengusaha cenderung optimis akan usahanya / Enterpreneur tend to be optimistic about their business
PKB < 50 % : Pengusaha cenderung pesimis kondisi usahanya / Enterpreneur tend to be pessimistic about their business
Indeks Masalah Bisnis (IMB) / Business Problems Index
IMB < 25 % : Sedikit Masalah / Less problematic
25 % < IMB ≤ 50 % : Cukup Bermasalah / Quite problematic
50 % < IMB ≤ 100 % : Bermasalah / Problematic
32 Indikator Konstruksi
Triwulan / QuarterTriwulan / Quarter
2018
Uraian
32
Description
(1)
2017
https:
//www.b
ps.go.id

Tabel Indeks (2010=100) dan Pertumbuhan (persen) Konstruksi, Triwulan IV/2017 - IV/2018
Table Quarterly Construction Indices (2010=100) and Growth (percent), Quarter IV/2017 - IV/2018
PROVINSI / PROVINCE : MALUKU UTARA
IV I II III IV
(2) (3) (4) (5) (6)
Pekerja Tetap / Permanent Workers 115.63 114.42 114.82 115.00 115.33
Pertumbuhan / Growth 1.98 -1.04 0.35 0.16 0.29
Hari Orang / Mandays 154.85 153.28 155.31 156.97 158.67
Pertumbuhan / Growth 1.72 -1.01 1.33 1.06 1.08
Balas Jasa dan Upah / 211.68 208.34 213.07 218.83 222.42
Compensation and Wages
Pertumbuhan / Growth 2.06 -1.58 2.27 2.70 1.64
Nilai Konstruksi / Value of Construction 219.68 215.68 221.95 229.30 235.85
Pertumbuhan / Growth 2.10 -1.82 2.91 3.31 2.86
Prospek Bisnis / Business Prospect 51.70 61.40 60.07 56.60 56.60
Kondisi Bisnis / Business Condition 48.86 57.44 60.07 60.94 60.94
Masalah Bisnis / Business Problems 40.17 32.10 15.23 19.42 19.46
Prospek dan Kondisi Bisnis (PKB) / Prospect and Condition of Business
PKB > 50 % : Pengusaha cenderung optimis akan usahanya / Enterpreneur tend to be optimistic about their business
PKB < 50 % : Pengusaha cenderung pesimis kondisi usahanya / Enterpreneur tend to be pessimistic about their business
Indeks Masalah Bisnis (IMB) / Business Problems Index
IMB < 25 % : Sedikit Masalah / Less problematic
25 % < IMB ≤ 50 % : Cukup Bermasalah / Quite problematic
50 % < IMB ≤ 100 % : Bermasalah / Problematic
2018
Construction Indicator 33
Triwulan / QuarterTriwulan / Quarter
33
Uraian
Description
(1)
2017
https:
//www.b
ps.go.id

Tabel Indeks (2010=100) dan Pertumbuhan (persen) Konstruksi, Triwulan IV/2017 - IV/2018
Table Quarterly Construction Indices (2010=100) and Growth (percent), Quarter IV/2017 - IV/2018
PROVINSI / PROVINCE : PAPUA BARAT
IV I II III IV
(2) (3) (4) (5) (6)
Pekerja Tetap / Permanent Workers 127.56 125.15 126.29 127.23 127.54
Pertumbuhan / Growth 1.02 -1.89 0.91 0.75 0.24
Hari Orang / Mandays 208.75 203.18 205.64 208.11 211.19
Pertumbuhan / Growth 2.43 -2.67 1.21 1.20 1.48
Balas Jasa dan Upah / 282.82 277.39 285.07 292.99 298.30
Compensation and Wages
Pertumbuhan / Growth 2.52 -1.92 2.77 2.78 1.81
Nilai Konstruksi / Value of Construction 299.16 291.26 300.43 312.10 321.15
Pertumbuhan / Growth 2.80 -2.64 3.15 3.88 2.90
Prospek Bisnis / Business Prospect 76.04 61.15 53.31 53.31 53.13
Kondisi Bisnis / Business Condition 71.88 51.81 48.16 44.85 45.14
Masalah Bisnis / Business Problems 25.00 27.46 19.51 21.07 19.51
Prospek dan Kondisi Bisnis (PKB) / Prospect and Condition of Business
PKB > 50 % : Pengusaha cenderung optimis akan usahanya / Enterpreneur tend to be optimistic about their business
PKB < 50 % : Pengusaha cenderung pesimis kondisi usahanya / Enterpreneur tend to be pessimistic about their business
Indeks Masalah Bisnis (IMB) / Business Problems Index
IMB < 25 % : Sedikit Masalah / Less problematic
25 % < IMB ≤ 50 % : Cukup Bermasalah / Quite problematic
50 % < IMB ≤ 100 % : Bermasalah / Problematic
34 Indikator Konstruksi
Triwulan / Quarter
20182017
Triwulan / QuarterUraian
(1)
34
Description
https:
//www.b
ps.go.id

Tabel Indeks (2010=100) dan Pertumbuhan (persen) Konstruksi, Triwulan IV/2017 - IV/2018
Table Quarterly Construction Indices (2010=100) and Growth (percent), Quarter IV/2017 - IV/2018
PROVINSI / PROVINCE : PAPUA
IV I II III IV
(2) (3) (4) (5) (6)
Pekerja Tetap / Permanent Workers 120.87 119.62 120.45 121.36 121.61
Pertumbuhan / Growth 0.36 -1.04 0.69 0.76 0.21
Hari Orang / Mandays 185.71 180.86 184.06 186.17 188.09
Pertumbuhan / Growth 2.18 -2.61 1.77 1.15 1.03
Balas Jasa dan Upah / 236.92 232.92 238.94 245.84 250.65
Compensation and Wages
Pertumbuhan / Growth 2.39 -1.69 2.58 2.89 1.96
Nilai Konstruksi / Value of Construction 256.99 249.72 257.26 267.28 274.53
Pertumbuhan / Growth 2.16 -2.83 3.02 3.89 2.71
Prospek Bisnis / Business Prospect 59.91 61.79 52.34 62.50 64.06
Kondisi Bisnis / Business Condition 53.52 53.57 51.56 51.79 51.56
Masalah Bisnis / Business Problems 27.21 29.21 23.62 22.70 22.70
Prospek dan Kondisi Bisnis (PKB) / Prospect and Condition of Business
PKB > 50 % : Pengusaha cenderung optimis akan usahanya / Enterpreneur tend to be optimistic about their business
PKB < 50 % : Pengusaha cenderung pesimis kondisi usahanya / Enterpreneur tend to be pessimistic about their business
Indeks Masalah Bisnis (IMB) / Business Problems Index
IMB < 25 % : Sedikit Masalah / Less problematic
25 % < IMB ≤ 50 % : Cukup Bermasalah / Quite problematic
50 % < IMB ≤ 100 % : Bermasalah / Problematic
Triwulan / Quarter
2018
Construction Indicator 35
Uraian
(1)
35
Description
Triwulan / Quarter
2017
https:
//www.b
ps.go.id
https:
//www.b
ps.go.id