dwi aneka jaya kemasindo, tbk - idx.co.id · yang berbasis di indonesia terutama bergerak dalam...
TRANSCRIPT


8 Oktober 2015 Halaman 1 dari 12
Kontak: Equity & Index Valuation Division Phone: (6221) 7884 0200 [email protected]
“Pernyataan disclaimer pada halaman akhir
merupakan bagian yang tidak terpisahkan dari
dokumen ini”
www.PEFINDO Riset dan Konsultasi.com
Dwi Aneka Jaya Kemasindo, Tbk
Laporan Utama
Equity Valuation
8 Oktober 2015
Target Harga
Terendah Tertinggi 620 705
Percetakan Offset y
Kinerja Saham
0
100
200
300
400
500
600
700
800
900
3,000
3,300
3,600
3,900
4,200
4,500
4,800
5,100
5,400
5,700
Aug-14 Oct-14 Dec-14 Feb-15 Apr-15 Jun-15 Aug-15
DAJKIHSG
IHSG DAJK
Sumber : Bloomberg, PEFINDO Riset dan Konsultasi - Divisi
Valuasi Saham & Indexing
Informasi Saham Rp
Kode Saham DAJK
Harga Saham per 7 Oktober 2015 480
Harga Tertinggi 52 minggu terakhir 770
Harga Terendah 52 minggu terakhir 470
Kapitalisasi Pasar Tertinggi 52 minggu
(miliar)
1,925
Kapitalisasi Pasar Terendah 52 minggu (miliar)
1,175
Market Value Added & Market Risk
0
100
200
300
400
500
600
700
800
-5,000,000
0
5,000,000
10,000,000
15,000,000
20,000,000
25,000,000
30,000,000
Volume Harga
Sumber : Bloomberg, PEFINDO Riset dan Konsultasi - Divisi
Valuasi Saham & Indexing
Pemegang Saham* (%)
PT Anugrah Pratama Internasional 58,98
Manajemen 1,01
Publik (masing-masing dibawah 5%) 40,01
Menikmati pertumbuhan manis
PT Dwi Aneka Kemasindo Jaya Tbk ("DAJK") adalah sebuah perusahaan yang berbasis di Indonesia terutama bergerak dalam pembuatan kemasan berbasis kertas. Bisnisnya dibagi menjadi dua divisi: percetakan offset dan karton bergelombang. Perusahaan juga menawarkan jasa desain. Produk-produknya digunakan dalam berbagai industri termasuk makanan, elektronik, farmasi, dan telekomunikasi. Fasilitas produksi Perusahaan berlokasi di Tangerang, Indonesia. Bisnis
karton bergelombang dimulai pada tahun 2011 ketika Perusahaan mengakuisisi PT Super Kemas Pratama dengan kapasitas 24k ton. Perusahaan saat ini memiliki tiga pabrik yang terletak di Tangerang dengan kapasitas percetakan offset sebesar 50k ton/tahun dan karton bergelombang sebesar 48k ton/tahun. Mengingat tingkat utilisasi yang tinggi pada saat ini, Perusahaan akan segera membangun pabrik ke-4 di Subang, yang diharapkan akan beroperasi pada tahun 2017.
“Pernyataan disclaimer pada halaman
akhir merupakan bagian yang tidak
terpisahkan dari dokumen ini”
www.pefindo-consulting.co.id
Dwi Aneka Jaya Kemasindo, Tbk
8 Oktober 2015 Halaman 2 dari 12
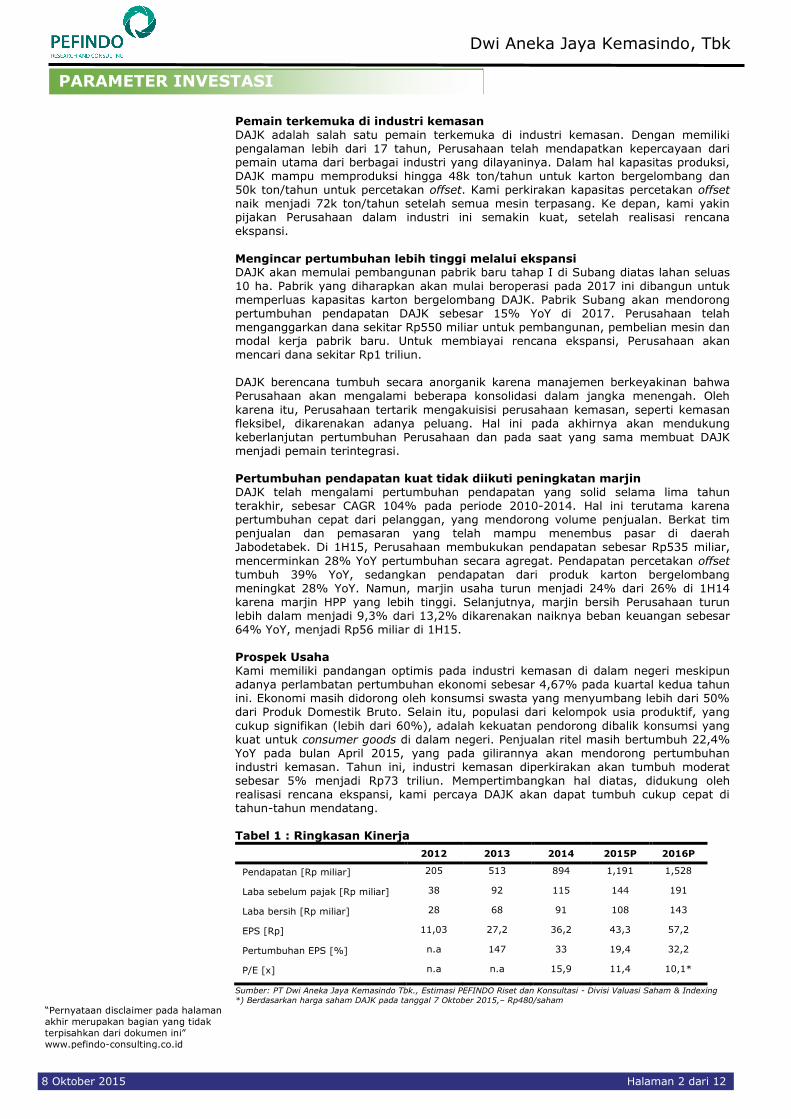
Pemain terkemuka di industri kemasan DAJK adalah salah satu pemain terkemuka di industri kemasan. Dengan memiliki pengalaman lebih dari 17 tahun, Perusahaan telah mendapatkan kepercayaan dari pemain utama dari berbagai industri yang dilayaninya. Dalam hal kapasitas produksi, DAJK mampu memproduksi hingga 48k ton/tahun untuk karton bergelombang dan 50k ton/tahun untuk percetakan offset. Kami perkirakan kapasitas percetakan offset naik menjadi 72k ton/tahun setelah semua mesin terpasang. Ke depan, kami yakin pijakan Perusahaan dalam industri ini semakin kuat, setelah realisasi rencana ekspansi.
Mengincar pertumbuhan lebih tinggi melalui ekspansi DAJK akan memulai pembangunan pabrik baru tahap I di Subang diatas lahan seluas 10 ha. Pabrik yang diharapkan akan mulai beroperasi pada 2017 ini dibangun untuk memperluas kapasitas karton bergelombang DAJK. Pabrik Subang akan mendorong pertumbuhan pendapatan DAJK sebesar 15% YoY di 2017. Perusahaan telah menganggarkan dana sekitar Rp550 miliar untuk pembangunan, pembelian mesin dan modal kerja pabrik baru. Untuk membiayai rencana ekspansi, Perusahaan akan mencari dana sekitar Rp1 triliun. DAJK berencana tumbuh secara anorganik karena manajemen berkeyakinan bahwa Perusahaan akan mengalami beberapa konsolidasi dalam jangka menengah. Oleh
karena itu, Perusahaan tertarik mengakuisisi perusahaan kemasan, seperti kemasan fleksibel, dikarenakan adanya peluang. Hal ini pada akhirnya akan mendukung keberlanjutan pertumbuhan Perusahaan dan pada saat yang sama membuat DAJK menjadi pemain terintegrasi. Pertumbuhan pendapatan kuat tidak diikuti peningkatan marjin DAJK telah mengalami pertumbuhan pendapatan yang solid selama lima tahun terakhir, sebesar CAGR 104% pada periode 2010-2014. Hal ini terutama karena pertumbuhan cepat dari pelanggan, yang mendorong volume penjualan. Berkat tim penjualan dan pemasaran yang telah mampu menembus pasar di daerah Jabodetabek. Di 1H15, Perusahaan membukukan pendapatan sebesar Rp535 miliar,
mencerminkan 28% YoY pertumbuhan secara agregat. Pendapatan percetakan offset tumbuh 39% YoY, sedangkan pendapatan dari produk karton bergelombang meningkat 28% YoY. Namun, marjin usaha turun menjadi 24% dari 26% di 1H14 karena marjin HPP yang lebih tinggi. Selanjutnya, marjin bersih Perusahaan turun lebih dalam menjadi 9,3% dari 13,2% dikarenakan naiknya beban keuangan sebesar 64% YoY, menjadi Rp56 miliar di 1H15. Prospek Usaha Kami memiliki pandangan optimis pada industri kemasan di dalam negeri meskipun adanya perlambatan pertumbuhan ekonomi sebesar 4,67% pada kuartal kedua tahun ini. Ekonomi masih didorong oleh konsumsi swasta yang menyumbang lebih dari 50% dari Produk Domestik Bruto. Selain itu, populasi dari kelompok usia produktif, yang
cukup signifikan (lebih dari 60%), adalah kekuatan pendorong dibalik konsumsi yang kuat untuk consumer goods di dalam negeri. Penjualan ritel masih bertumbuh 22,4% YoY pada bulan April 2015, yang pada gilirannya akan mendorong pertumbuhan industri kemasan. Tahun ini, industri kemasan diperkirakan akan tumbuh moderat sebesar 5% menjadi Rp73 triliun. Mempertimbangkan hal diatas, didukung oleh realisasi rencana ekspansi, kami percaya DAJK akan dapat tumbuh cukup cepat di tahun-tahun mendatang. Tabel 1 : Ringkasan Kinerja
2012 2013 2014 2015P 2016P
Pendapatan [Rp miliar] 205 513 894 1,191 1,528
Laba sebelum pajak [Rp miliar] 38 92 115 144 191
Laba bersih [Rp miliar] 28 68 91 108 143
EPS [Rp] 11,03 27,2 36,2 43,3 57,2
Pertumbuhan EPS [%] n.a 147 33 19,4 32,2
P/E [x] n.a n.a 15,9 11,4 10,1*
Sumber: PT Dwi Aneka Jaya Kemasindo Tbk., Estimasi PEFINDO Riset dan Konsultasi - Divisi Valuasi Saham & Indexing
*) Berdasarkan harga saham DAJK pada tanggal 7 Oktober 2015,– Rp480/saham
PARAMETER INVESTASI
Dwi Aneka Jaya Kemasindo, Tbk
8 Oktober 2015 Halaman 3 dari 12
Pertumbuhan ekonomi tetap lambat Ketidakpastian masih menimpa ekonomi global setelah krisis keuangan melanda pada tahun 2008. Banyak prediksi yang meleset tentang pemulihan ekonomi. Optimisme dengan bail outs di Eropa berakhir dengan krisis baru. Memasuki tahun 2015, Bank Dunia memperkirakan dengan optimisme yang lebih besar bahwa ekonomi global berada di jalur yang tepat untuk pemulihan. Penurunan harga minyak akan mengurangi tekanan pada negara berkembang non-penghasil minyak. Pemulihan AS ekonomi diharapkan dapat memberikan kontribusi untuk meningkatkan ekspor dunia termasuk ekspor Indonesia.
Untuk Indonesia sendiri, kami melihat tantangan yang dihadapi pembangunan ekonom baik faktor dari eksternal maupun internal. Tantangan yang berasal dari faktor eksternal termasuk penurunan dalam perdagangan global dan perlambatan pemulihan ekonomi global, kenaikan suku bunga di beberapa ekonomi negara maju di waktu yang berbeda, penurunan harga minyak akan mengguncang stabilitas keuangan dari negara-negara penghasil minyak. Sementara faktor internal berasal dari defisit perdagangan disebabkan oleh anjloknya ekspor akibat jatuhnya harga dari komoditas primer, lambatnya kemajuan dalam pengembangan infrastruktur dan menyusutnya nilai Rupiah terhadap dolar AS. Sebagai hasilnya, ekonomi Indonesia hanya tumbuh 4,67% di 2Q15, lebih lambat dari kuartal sebelumnya yaitu 4,71%.
Tabel 2: Pertumbuhan GDP kuartalan 2009-2015 (perubahan % tahunan)
Year Q1 Q2 Q3 Q4
2015
4,71
4,67
2014
5,14
5,03
4,92
5,01
2013
6,03
5,81
5,62
5,72
2012
6,29
6,36
6,17
6,11
2011
6,45
6,52
6,49
6,50
2010
5,99
6,29
5,81
6,81
2009
4,60
4,37
4,31
4,58
Sumber: Biro Pusat Statistik, PEFINDO Riset dan Konsultasi - Divisi Valuasi Saham & Indexing
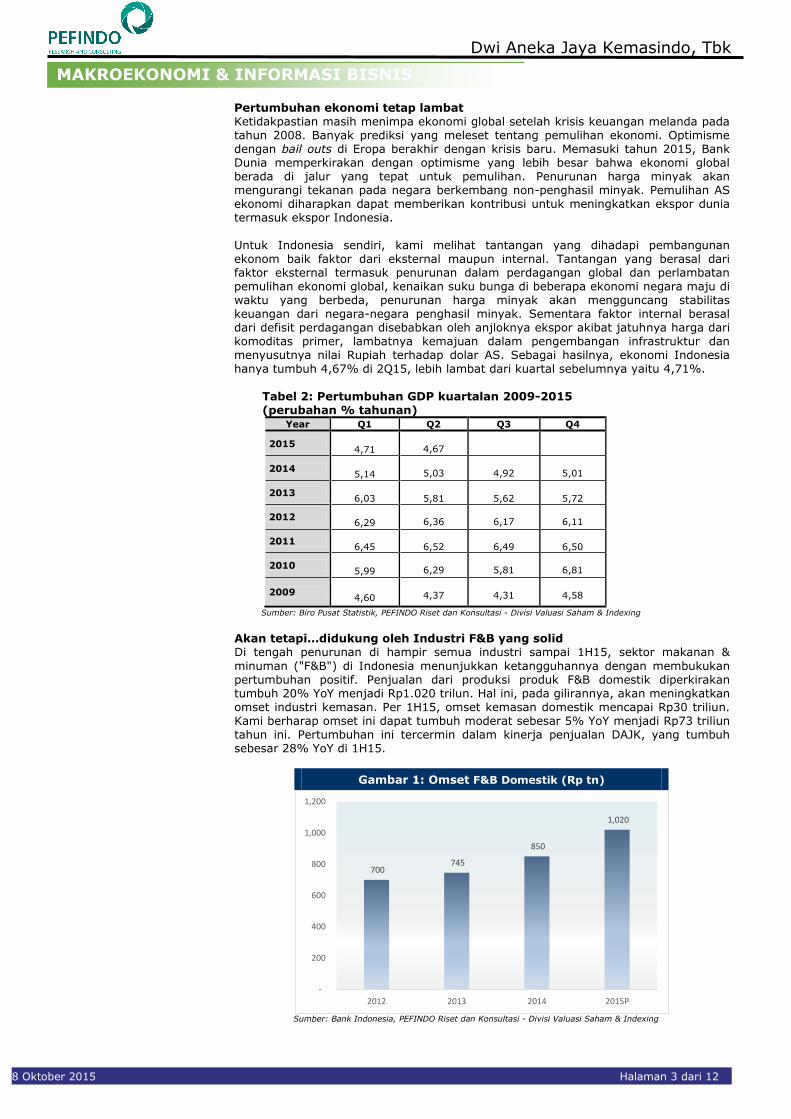
Akan tetapi…didukung oleh Industri F&B yang solid Di tengah penurunan di hampir semua industri sampai 1H15, sektor makanan &
minuman ("F&B") di Indonesia menunjukkan ketangguhannya dengan membukukan pertumbuhan positif. Penjualan dari produksi produk F&B domestik diperkirakan tumbuh 20% YoY menjadi Rp1.020 trilun. Hal ini, pada gilirannya, akan meningkatkan omset industri kemasan. Per 1H15, omset kemasan domestik mencapai Rp30 triliun. Kami berharap omset ini dapat tumbuh moderat sebesar 5% YoY menjadi Rp73 triliun tahun ini. Pertumbuhan ini tercermin dalam kinerja penjualan DAJK, yang tumbuh sebesar 28% YoY di 1H15.
Gambar 1: Omset F&B Domestik (Rp tn)
700 745
850
1,020
-
200
400
600
800
1,000
1,200
2012 2013 2014 2015P
Sumber: Bank Indonesia, PEFINDO Riset dan Konsultasi - Divisi Valuasi Saham & Indexing
MAKROEKONOMI & INFORMASI BISNIS
“Pernyataan disclaimer pada halaman
akhir merupakan bagian yang tidak
terpisahkan dari dokumen ini”
www.pefindo-consulting.co.id
Dwi Aneka Jaya Kemasindo, Tbk
8 Oktober 2015 Halaman 4 dari 12
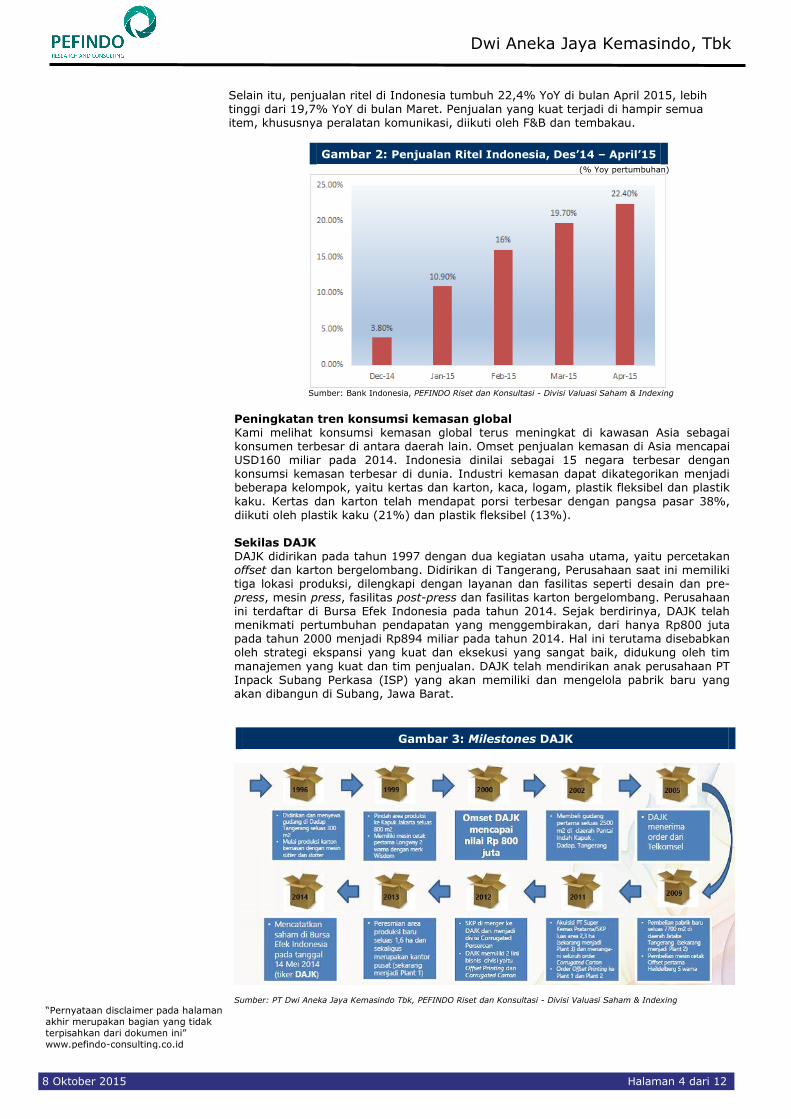
Selain itu, penjualan ritel di Indonesia tumbuh 22,4% YoY di bulan April 2015, lebih tinggi dari 19,7% YoY di bulan Maret. Penjualan yang kuat terjadi di hampir semua item, khususnya peralatan komunikasi, diikuti oleh F&B dan tembakau.
Gambar 2: Penjualan Ritel Indonesia, Des’14 – April’15
(% Yoy pertumbuhan)
Sumber: Bank Indonesia, PEFINDO Riset dan Konsultasi - Divisi Valuasi Saham & Indexing
Peningkatan tren konsumsi kemasan global Kami melihat konsumsi kemasan global terus meningkat di kawasan Asia sebagai konsumen terbesar di antara daerah lain. Omset penjualan kemasan di Asia mencapai USD160 miliar pada 2014. Indonesia dinilai sebagai 15 negara terbesar dengan konsumsi kemasan terbesar di dunia. Industri kemasan dapat dikategorikan menjadi beberapa kelompok, yaitu kertas dan karton, kaca, logam, plastik fleksibel dan plastik
kaku. Kertas dan karton telah mendapat porsi terbesar dengan pangsa pasar 38%, diikuti oleh plastik kaku (21%) dan plastik fleksibel (13%).
Sekilas DAJK DAJK didirikan pada tahun 1997 dengan dua kegiatan usaha utama, yaitu percetakan offset dan karton bergelombang. Didirikan di Tangerang, Perusahaan saat ini memiliki tiga lokasi produksi, dilengkapi dengan layanan dan fasilitas seperti desain dan pre-press, mesin press, fasilitas post-press dan fasilitas karton bergelombang. Perusahaan ini terdaftar di Bursa Efek Indonesia pada tahun 2014. Sejak berdirinya, DAJK telah menikmati pertumbuhan pendapatan yang menggembirakan, dari hanya Rp800 juta pada tahun 2000 menjadi Rp894 miliar pada tahun 2014. Hal ini terutama disebabkan oleh strategi ekspansi yang kuat dan eksekusi yang sangat baik, didukung oleh tim
manajemen yang kuat dan tim penjualan. DAJK telah mendirikan anak perusahaan PT Inpack Subang Perkasa (ISP) yang akan memiliki dan mengelola pabrik baru yang akan dibangun di Subang, Jawa Barat.
Gambar 3: Milestones DAJK
Sumber: PT Dwi Aneka Jaya Kemasindo Tbk, PEFINDO Riset dan Konsultasi - Divisi Valuasi Saham & Indexing
“Pernyataan disclaimer pada halaman
akhir merupakan bagian yang tidak
terpisahkan dari dokumen ini”
www.pefindo-consulting.co.id
Dwi Aneka Jaya Kemasindo, Tbk
8 Oktober 2015 Halaman 5 dari 12
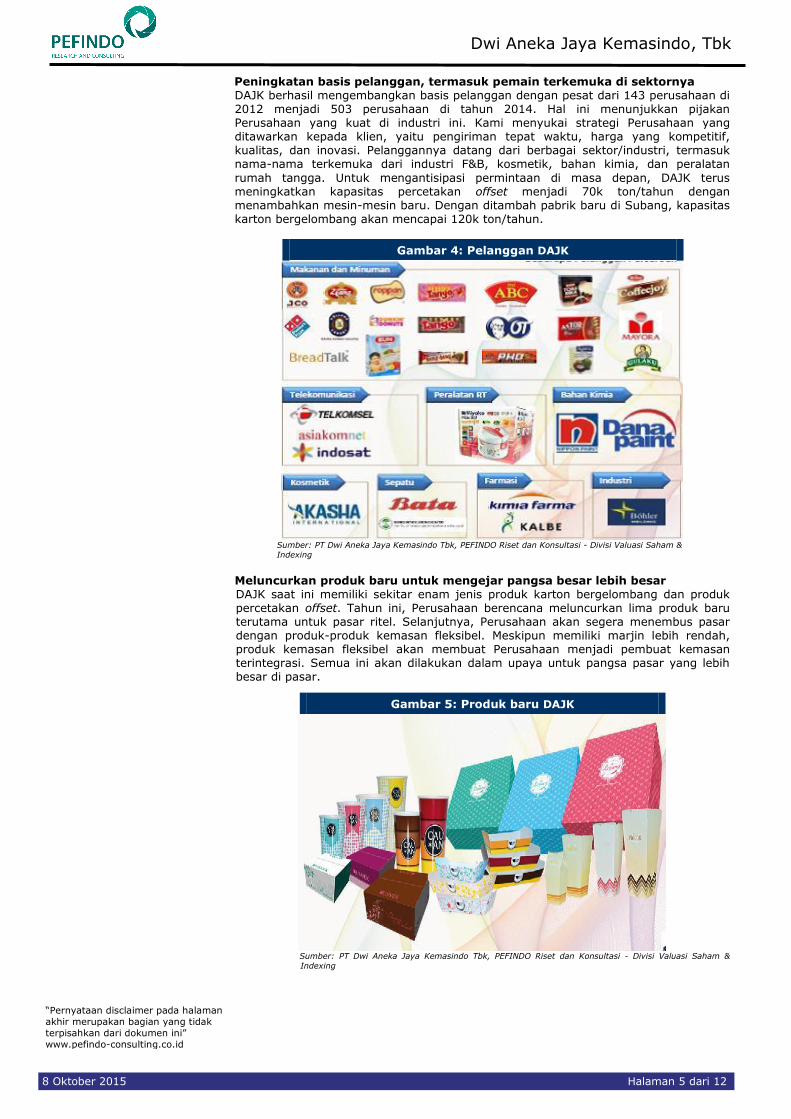
Peningkatan basis pelanggan, termasuk pemain terkemuka di sektornya DAJK berhasil mengembangkan basis pelanggan dengan pesat dari 143 perusahaan di 2012 menjadi 503 perusahaan di tahun 2014. Hal ini menunjukkan pijakan Perusahaan yang kuat di industri ini. Kami menyukai strategi Perusahaan yang ditawarkan kepada klien, yaitu pengiriman tepat waktu, harga yang kompetitif, kualitas, dan inovasi. Pelanggannya datang dari berbagai sektor/industri, termasuk nama-nama terkemuka dari industri F&B, kosmetik, bahan kimia, dan peralatan
rumah tangga. Untuk mengantisipasi permintaan di masa depan, DAJK terus meningkatkan kapasitas percetakan offset menjadi 70k ton/tahun dengan menambahkan mesin-mesin baru. Dengan ditambah pabrik baru di Subang, kapasitas karton bergelombang akan mencapai 120k ton/tahun.
Gambar 4: Pelanggan DAJK
Sumber: PT Dwi Aneka Jaya Kemasindo Tbk, PEFINDO Riset dan Konsultasi - Divisi Valuasi Saham &
Indexing
Meluncurkan produk baru untuk mengejar pangsa besar lebih besar
DAJK saat ini memiliki sekitar enam jenis produk karton bergelombang dan produk percetakan offset. Tahun ini, Perusahaan berencana meluncurkan lima produk baru terutama untuk pasar ritel. Selanjutnya, Perusahaan akan segera menembus pasar dengan produk-produk kemasan fleksibel. Meskipun memiliki marjin lebih rendah, produk kemasan fleksibel akan membuat Perusahaan menjadi pembuat kemasan terintegrasi. Semua ini akan dilakukan dalam upaya untuk pangsa pasar yang lebih besar di pasar.
Gambar 5: Produk baru DAJK
Sumber: PT Dwi Aneka Jaya Kemasindo Tbk, PEFINDO Riset dan Konsultasi - Divisi Valuasi Saham &
Indexing

“Pernyataan disclaimer pada halaman
akhir merupakan bagian yang tidak
terpisahkan dari dokumen ini”
www.pefindo-consulting.co.id
Dwi Aneka Jaya Kemasindo, Tbk
8 Oktober 2015 Halaman 6 dari 12
Pendapatan meningkat tetapi marjin tergerus DAJK membukukan pertumbuhan pendapatan yang kuat dengan 104% CAGR selama periode 2010-2014. Selanjutnya, pendapatan ini juga naik menjadi Rp535 miliar di 1H15, naik 28% YoY dari periode yang sama tahun sebelumnya. Hal itu terutama didorong oleh meningkatnya jumlah pelanggan, yang mendorong volume penjualan.
Pendapatan dari percetakan offset, sebagai kontributor pendapatan utama, tumbuh sebesar 39%, sedangkan pendapatan dari karton bergelombang naik 11% selama 1H15. Namun, marjin usaha turun menjadi 24% dari 26% di 1H14 karena marjin HPP lebih tinggi. Marjin laba bersih turun lebih dalam menjadi 9,3% dari 13,2% di 1H14 disebabkan beban keuangan lebih tinggi, dimana naik 64% YoY menjadi Rp56 miliar di 1H15.
Gambar 6: Pendapatan dan Laba DAJK Gambar 7: Marjin Profitabilitas DAJK
205
513
894
1,191
60141
189251
2868 91 108
0
200
400
600
800
1,000
1,200
1,400
2012 2013 2014 2015P
Pendapatan Laba Usaha Laba Bersih
0.00%
5.00%
10.00%
15.00%
20.00%
25.00%
30.00%
35.00%
40.00%
45.00%
2012 2013 2014 2015P
gross margin operating margin net margin
Sumber: PT Dwi Aneka Jaya Kemasindo Tbk, Estimasi
PEFINDO Riset dan Konsultasi - Divisi Valuasi Saham & Indexing
Sumber: PT Dwi Aneka Jaya Kemasindo Tbk, Estimasi
PEFINDO Riset dan Konsultasi - Divisi Valuasi Saham & Indexing
Leverage tetap menjadi perhatian Dalam pandangan kami, DAJK memiliki leverage yang relatif tinggi, ditunjukkan oleh naiknya rasio utang/EBITDA sebesar 6,8x di 1H15 vs 3,2x di 1H14. Selama satu tahun terakhir, porsi utang meningkat sekitar Rp196 miliar dari Rp759 miliar di FY2014,
membuat rasio interest coverage turun ke 2.2x dari 2.6x di tahun 2014. Menurunnya rasio tersebut sebagai akibat dari peningkatan biaya keuangan dari Rp34 miliar di 1H14 menjadi Rp56 miliar di 1H15 (naik signifikan sebesar 64%). Untuk membiayai strategi ekspansinya, kami memiliki kekhawatiran atas berapa banyak ruang yang tersedia untuk membawa tambahan utang. Oleh karena itu kami mengharapkan DAJK untuk membiayai utang yang ada (existing) untuk memberikan ruang lebih dan meningkatkan equity-linked debt untuk mendukung strategi ekspansi.
Gambar 8: Profil utang dan EBITDA DAJK (Rp miliar)
453
596
759
397
945
71
164222
124 139
0
100
200
300
400
500
600
700
800
900
1000
2012 2013 2014 1H14 1H15
Debt EBITDA
Sumber: PT Dwi Aneka Jaya Kemasindo Tbk, PEFINDO Riset dan Konsultasi - Divisi Valuasi Saham & Indexing
KEUANGAN
“Pernyataan disclaimer pada halaman
akhir merupakan bagian yang tidak
terpisahkan dari dokumen ini”
www.pefindo-consulting.co.id
Dwi Aneka Jaya Kemasindo, Tbk
8 Oktober 2015 Halaman 7 dari 12
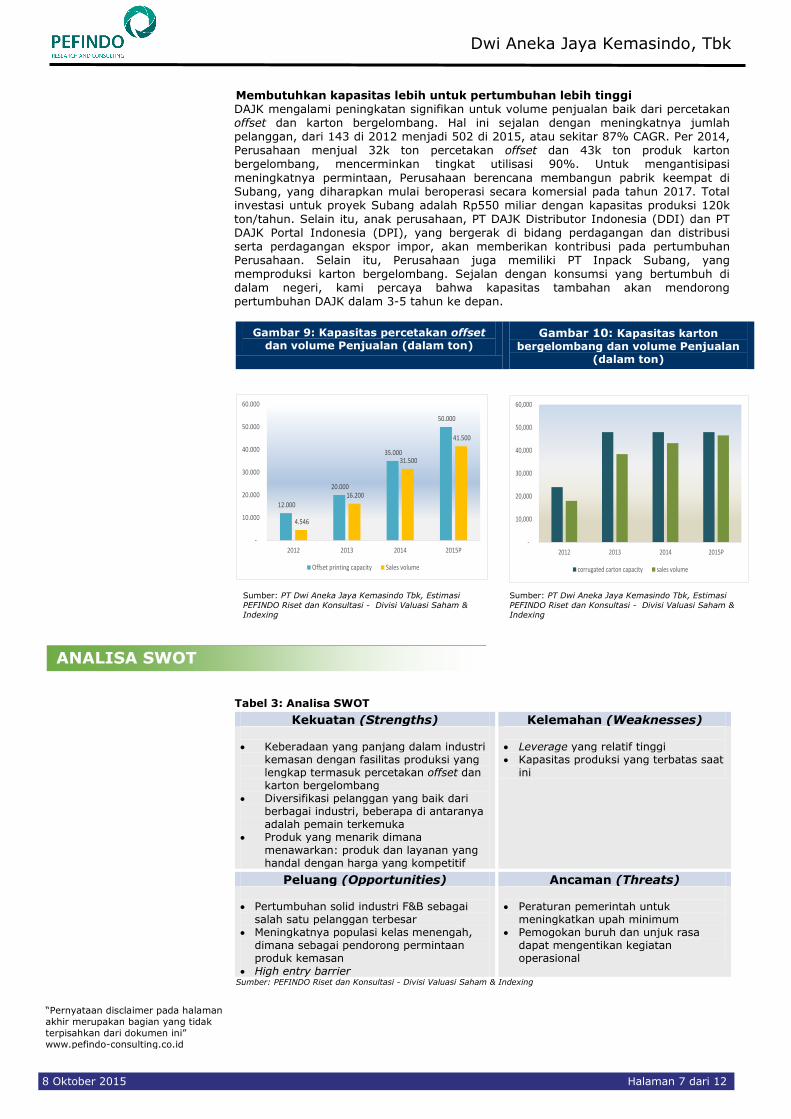
Membutuhkan kapasitas lebih untuk pertumbuhan lebih tinggi DAJK mengalami peningkatan signifikan untuk volume penjualan baik dari percetakan offset dan karton bergelombang. Hal ini sejalan dengan meningkatnya jumlah pelanggan, dari 143 di 2012 menjadi 502 di 2015, atau sekitar 87% CAGR. Per 2014, Perusahaan menjual 32k ton percetakan offset dan 43k ton produk karton bergelombang, mencerminkan tingkat utilisasi 90%. Untuk mengantisipasi
meningkatnya permintaan, Perusahaan berencana membangun pabrik keempat di Subang, yang diharapkan mulai beroperasi secara komersial pada tahun 2017. Total investasi untuk proyek Subang adalah Rp550 miliar dengan kapasitas produksi 120k ton/tahun. Selain itu, anak perusahaan, PT DAJK Distributor Indonesia (DDI) dan PT DAJK Portal Indonesia (DPI), yang bergerak di bidang perdagangan dan distribusi serta perdagangan ekspor impor, akan memberikan kontribusi pada pertumbuhan Perusahaan. Selain itu, Perusahaan juga memiliki PT Inpack Subang, yang memproduksi karton bergelombang. Sejalan dengan konsumsi yang bertumbuh di dalam negeri, kami percaya bahwa kapasitas tambahan akan mendorong pertumbuhan DAJK dalam 3-5 tahun ke depan.
Gambar 9: Kapasitas percetakan offset dan volume Penjualan (dalam ton)
Gambar 10: Kapasitas karton
bergelombang dan volume Penjualan (dalam ton)
12.000
20.000
35.000
50.000
4.546
16.200
31.500
41.500
-
10.000
20.000
30.000
40.000
50.000
60.000
2012 2013 2014 2015P
Offset printing capacity Sales volume
-
10,000
20,000
30,000
40,000
50,000
60,000
2012 2013 2014 2015P
corrugated carton capacity sales volume
Sumber: PT Dwi Aneka Jaya Kemasindo Tbk, Estimasi
PEFINDO Riset dan Konsultasi - Divisi Valuasi Saham & Indexing
Sumber: PT Dwi Aneka Jaya Kemasindo Tbk, Estimasi
PEFINDO Riset dan Konsultasi - Divisi Valuasi Saham & Indexing
Tabel 3: Analisa SWOT
Kekuatan (Strengths) Kelemahan (Weaknesses)
Keberadaan yang panjang dalam industri
kemasan dengan fasilitas produksi yang lengkap termasuk percetakan offset dan karton bergelombang
Diversifikasi pelanggan yang baik dari berbagai industri, beberapa di antaranya adalah pemain terkemuka
Produk yang menarik dimana menawarkan: produk dan layanan yang handal dengan harga yang kompetitif
Leverage yang relatif tinggi Kapasitas produksi yang terbatas saat
ini
Peluang (Opportunities) Ancaman (Threats)
Pertumbuhan solid industri F&B sebagai
salah satu pelanggan terbesar Meningkatnya populasi kelas menengah,
dimana sebagai pendorong permintaan produk kemasan
High entry barrier
Peraturan pemerintah untuk
meningkatkan upah minimum Pemogokan buruh dan unjuk rasa
dapat mengentikan kegiatan operasional
Sumber: PEFINDO Riset dan Konsultasi - Divisi Valuasi Saham & Indexing
ANALISA SWOT

“Pernyataan disclaimer pada halaman
akhir merupakan bagian yang tidak
terpisahkan dari dokumen ini”
www.pefindo-consulting.co.id
Dwi Aneka Jaya Kemasindo, Tbk
8 Oktober 2015 Halaman 8 dari 12
Tabel 4: Kinerja DAJK vs Perusahaan Sejenis per 1H15 DAJK KDSI
Pendapatan [Rp miliar] 894 878
Laba kotor [Rp miliar] 277 97
Laba usaha [Rp miliar] 189 13
Laba bersih [Rp miliar] 91 1
Total asset [Rp miliar] 2,159 1,062
Total liabilitas [Rp miliar] 945 694
Total ekuitas [Rp miliar] 1,115 368
Pertumbuhan YoY
Pendapatan [%] 27,98 10,58
Laba kotor [%] 12,06 (9,35)
Laba bersih [%] (9,81) (91,67)
Profitabilitas
Marjin laba kotor [%] 30,99 11,05
Marjin laba sebelum pajak [%] 21,14 1,48
Marjin laba bersih [%] 10,13 0,11
Leverage
Debt to equity [x] 0,85 1,89
Sumber: Bloomberg, PEFINDO Riset dan Konsultasi - Divisi Valuasi Saham & Indexing
PERBANDINGAN INDUSTRI
“Pernyataan disclaimer pada halaman
akhir merupakan bagian yang tidak
terpisahkan dari dokumen ini”
www.pefindo-consulting.co.id
Dwi Aneka Jaya Kemasindo, Tbk
8 Oktober 2015 Halaman 9 dari 12
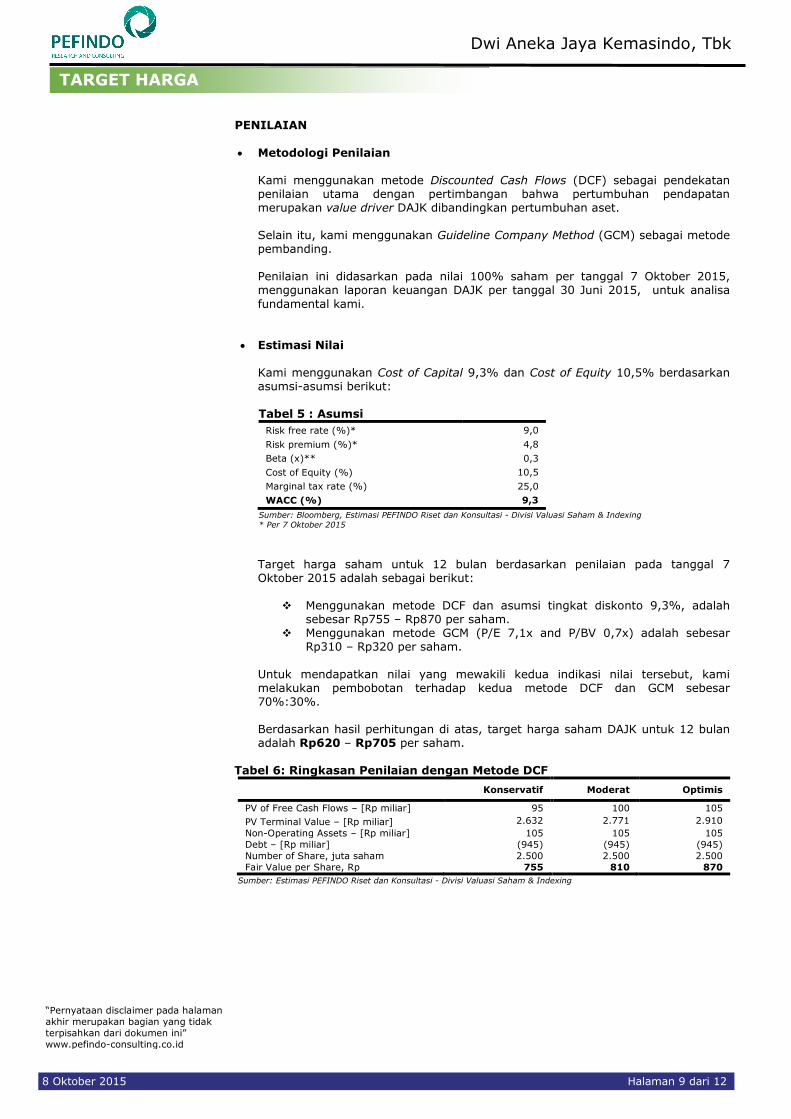
PENILAIAN
Metodologi Penilaian
Kami menggunakan metode Discounted Cash Flows (DCF) sebagai pendekatan penilaian utama dengan pertimbangan bahwa pertumbuhan pendapatan merupakan value driver DAJK dibandingkan pertumbuhan aset. Selain itu, kami menggunakan Guideline Company Method (GCM) sebagai metode pembanding. Penilaian ini didasarkan pada nilai 100% saham per tanggal 7 Oktober 2015, menggunakan laporan keuangan DAJK per tanggal 30 Juni 2015, untuk analisa
fundamental kami.
Estimasi Nilai
Kami menggunakan Cost of Capital 9,3% dan Cost of Equity 10,5% berdasarkan asumsi-asumsi berikut: Tabel 5 : Asumsi
Risk free rate (%)* 9,0
Risk premium (%)* 4,8
Beta (x)** 0,3
Cost of Equity (%) 10,5
Marginal tax rate (%) 25,0
WACC (%) 9,3
Sumber: Bloomberg, Estimasi PEFINDO Riset dan Konsultasi - Divisi Valuasi Saham & Indexing
* Per 7 Oktober 2015
Target harga saham untuk 12 bulan berdasarkan penilaian pada tanggal 7 Oktober 2015 adalah sebagai berikut:
Menggunakan metode DCF dan asumsi tingkat diskonto 9,3%, adalah sebesar Rp755 – Rp870 per saham.
Menggunakan metode GCM (P/E 7,1x and P/BV 0,7x) adalah sebesar Rp310 – Rp320 per saham.
Untuk mendapatkan nilai yang mewakili kedua indikasi nilai tersebut, kami melakukan pembobotan terhadap kedua metode DCF dan GCM sebesar 70%:30%. Berdasarkan hasil perhitungan di atas, target harga saham DAJK untuk 12 bulan adalah Rp620 – Rp705 per saham.
Tabel 6: Ringkasan Penilaian dengan Metode DCF
Konservatif Moderat Optimis
PV of Free Cash Flows – [Rp miliar] 95 100 105
PV Terminal Value – [Rp miliar] 2.632 2.771 2.910
Non-Operating Assets – [Rp miliar] 105 105 105
Debt – [Rp miliar] (945) (945) (945)
Number of Share, juta saham 2.500 2.500 2.500
Fair Value per Share, Rp 755 810 870
Sumber: Estimasi PEFINDO Riset dan Konsultasi - Divisi Valuasi Saham & Indexing
TARGET HARGA

“Pernyataan disclaimer pada halaman
akhir merupakan bagian yang tidak
terpisahkan dari dokumen ini”
www.pefindo-consulting.co.id
Dwi Aneka Jaya Kemasindo, Tbk
8 Oktober 2015 Halaman 10 dari 12
Tabel 7 : Pembanding GCM
DAJK TGKA Rata-rata
P/E [x] 11,4 2,8 7,1
P/BV [x] 1,2 0,2 0,7
Sumber: Bloomberg, PEFINDO Riset dan Konsultasi - Divisi Valuasi Saham & Indexing
Tabel 8 : Ringkasan Penilaian dengan Metode GCM Multiple [x] Est. EPS [RP] Est. BV/share [RP] Value [RP]
P/E 7,1 43 - 310
P/BV 0,7 - 470 320
Sumber: Bloomberg, Estimasi PEFINDO Riset dan Konsultasi - Divisi Valuasi Saham & Indexing
Tabel 9: Rekonsiliasi Nilai Wajar Nilai Wajar per Saham [Rp]
DCF GCM Rata-rata
Batas atas 870 320 705
Batas bawah 755 310 620
Bobot 70% 30%
Sumber: Estimasi PEFINDO Riset dan Konsultasi - Divisi Valuasi Saham & Indexing
“Pernyataan disclaimer pada halaman
akhir merupakan bagian yang tidak
terpisahkan dari dokumen ini”
www.pefindo-consulting.co.id
Dwi Aneka Jaya Kemasindo, Tbk
8 Oktober 2015 Halaman 11 dari 12
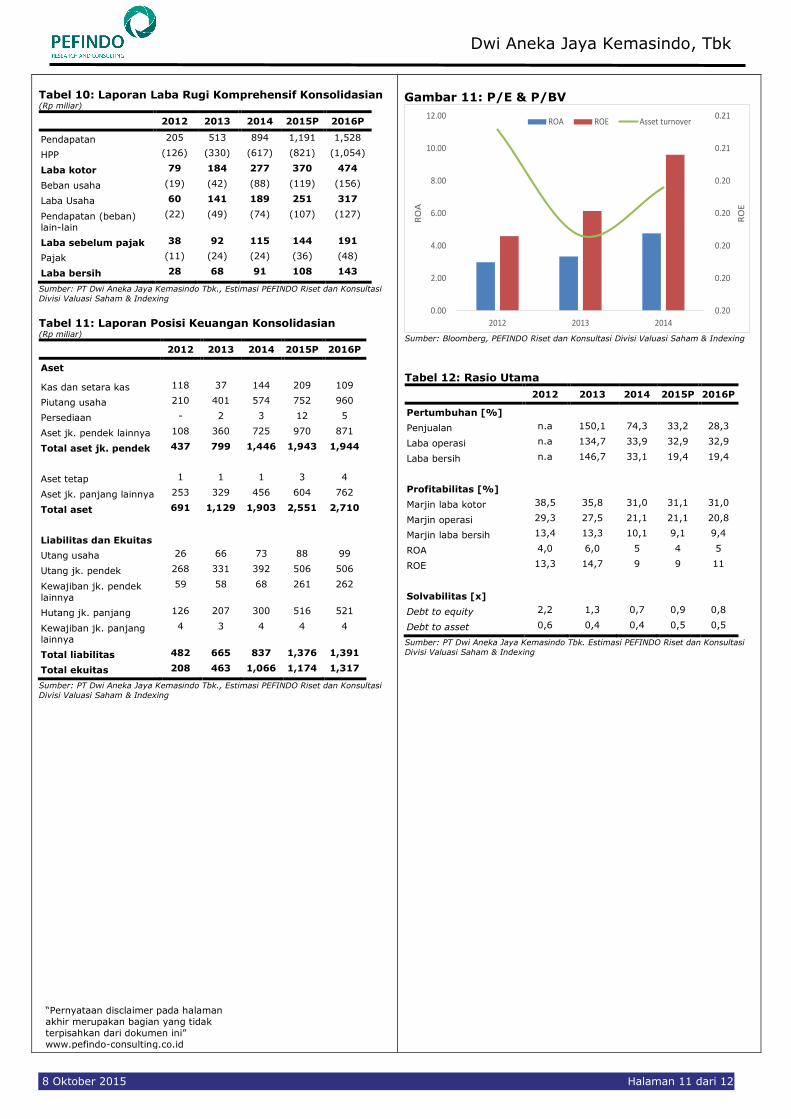
Tabel 10: Laporan Laba Rugi Komprehensif Konsolidasian (Rp miliar)
2012 2013 2014 2015P 2016P
Pendapatan 205 513 894 1,191 1,528
HPP (126) (330) (617) (821) (1,054)
Laba kotor 79 184 277 370 474
Beban usaha (19) (42) (88) (119) (156)
Laba Usaha 60 141 189 251 317
Pendapatan (beban) lain-lain
(22) (49) (74) (107) (127)
Laba sebelum pajak 38 92 115 144 191
Pajak (11) (24) (24) (36) (48)
Laba bersih 28 68 91 108 143
Sumber: PT Dwi Aneka Jaya Kemasindo Tbk., Estimasi PEFINDO Riset dan Konsultasi
Divisi Valuasi Saham & Indexing
Tabel 11: Laporan Posisi Keuangan Konsolidasian (Rp miliar)
2012 2013 2014 2015P 2016P
Aset
Kas dan setara kas 118 37 144 209 109
Piutang usaha 210 401 574 752 960
Persediaan - 2 3 12 5
Aset jk. pendek lainnya 108 360 725 970 871
Total aset jk. pendek 437 799 1,446 1,943 1,944
Aset tetap 1 1 1 3 4
Aset jk. panjang lainnya 253 329 456 604 762
Total aset 691 1,129 1,903 2,551 2,710
Liabilitas dan Ekuitas
Utang usaha 26 66 73 88 99
Utang jk. pendek 268 331 392 506 506
Kewajiban jk. pendek
lainnya
59 58 68 261 262
Hutang jk. panjang 126 207 300 516 521
Kewajiban jk. panjang lainnya
4 3 4 4 4
Total liabilitas 482 665 837 1,376 1,391
Total ekuitas 208 463 1,066 1,174 1,317
Sumber: PT Dwi Aneka Jaya Kemasindo Tbk., Estimasi PEFINDO Riset dan Konsultasi
Divisi Valuasi Saham & Indexing
Gambar 11: P/E & P/BV
0.20
0.20
0.20
0.20
0.20
0.21
0.21
0.00
2.00
4.00
6.00
8.00
10.00
12.00
2012 2013 2014
RO
E
RO
A
ROA ROE Asset turnover
Sumber: Bloomberg, PEFINDO Riset dan Konsultasi Divisi Valuasi Saham & Indexing
Tabel 12: Rasio Utama
2012 2013 2014 2015P 2016P
Pertumbuhan [%]
Penjualan n.a 150,1 74,3 33,2 28,3
Laba operasi n.a 134,7 33,9 32,9 32,9
Laba bersih n.a 146,7 33,1 19,4 19,4
Profitabilitas [%]
Marjin laba kotor 38,5 35,8 31,0 31,1 31,0
Marjin operasi 29,3 27,5 21,1 21,1 20,8
Marjin laba bersih 13,4 13,3 10,1 9,1 9,4
ROA 4,0 6,0 5 4 5
ROE 13,3 14,7 9 9 11
Solvabilitas [x]
Debt to equity 2,2 1,3 0,7 0,9 0,8
Debt to asset 0,6 0,4 0,4 0,5 0,5
Sumber: PT Dwi Aneka Jaya Kemasindo Tbk. Estimasi PEFINDO Riset dan Konsultasi
Divisi Valuasi Saham & Indexing

“Pernyataan disclaimer pada halaman
akhir merupakan bagian yang tidak
terpisahkan dari dokumen ini”
www.pefindo-consulting.co.id
Dwi Aneka Jaya Kemasindo, Tbk
8 Oktober 2015 Halaman 12 dari 12
DISCLAIMER
Laporan ini dibuat berdasarkan sumber-sumber yang kami anggap terpercaya dan dapat diandalkan. Namun kami tidak menjamin kelengkapan, keakuratan atau kecukupannya. Dengan demikian kami tidak bertanggung jawab atas segala keputusan investasi yang diambil berdasarkan laporan ini. Adapun asumsi, opini, dan perkiraan merupakan hasil dari pertimbangan internal kami per tanggal penilaian (cut off date), dan kami dapat mengubah pertimbangan diatas sewaktu-waktu tanpa pemberitahuan terlebih dahulu. Kami tidak bertanggung jawab atas kekeliruan atau kelalaian yang terjadi akibat penggunaan laporan ini. Kinerja dimasa lalu tidak selalu dapat dijadikan acuan hasil masa depan. Laporan ini bukan merupakan
rekomendasi penawaran, pembelian atau menahan suatu saham tertentu. Laporan ini mungkin tidak sesuai untuk beberapa investor. Seluruh opini dalam laporan ini telah disampaikan dengan itikad baik, namun sewaktu-waktu dapat berubah tanpa pemberitahuan terlebih dahulu, dan disajikan dengan benar per tanggal diterbitkan laporan ini. Harga, nilai, atau pendapatan dari setiap saham Perseroan yang disajikan dalam laporan ini kemungkinan dapat lebih rendah dari harapan pemodal, dan pemodal juga mungkin mendapatkan pengembalian yang lebih rendah dari nilai investasi yang ditanamkan. Investasi didefinisikan sebagai pendapatan yang kemungkinan besar diterima dimasa depan, namun nilai dari pendapatan yang akan diterima tersebut kemungkinan besar juga akan berfluktuasi. Untuk saham Perseroan yang penyajian laporan keuangannya didenominasi dalam mata uang selain Rupiah, perubahan nilai tukar mata uang tersebut kemungkinan dapat menurunkan nilai, harga, atau pendapatan investasi pemodal. Informasi dalam laporan ini bukan merupakan pertimbangan pajak dalam mengambil suatu keputusan investasi. Target harga saham dalam Laporan ini merupakan nilai fundamental, bukan merupakan Nilai Pasar Wajar, dan bukan merupakan harga acuan transaksi yang diwajibkan oleh peraturan perundang-undangan yang berlaku. Laporan target harga saham yang diterbitkan oleh PT Pefindo Riset Konsultasi (PRK) atau PEFINDO Riset dan Konsultasi bukan merupakan rekomendasi untuk membeli, menjual, atau menahan suatu saham tertentu, dan tidak dapat dianggap sebagai nasehat investasi oleh PRK yang berhubungan dengan cakupan Jasa kepada, atau kaitannya kepada, beberapa pihak, termasuk emiten, penasehat keuangan, pialang saham, investment banks, institusi keuangan dan perantara keuangan, dalam kaitannya menerima imbalan atau keuntungan lainnya dari pihak tersebut. Laporan ini tidak ditujukan untuk pemodal tertentu dan tidak dapat dijadikan bagian dari tujuan investasi terhadap suatu saham dan juga bukan merupakan rekomendasi investasi terhadap suatu saham tertentu atau suatu strategi investasi. Sebelum melakukan tindakan dari hasil laporan ini, pemodal disarankan untuk mempertimbangkan terlebih dahulu kesesuaian situasi dan kondisi dan, jika dibutuhkan, mintalah bantuan penasehat keuangan. PEFINDO memisahkan kegiatan Valuasi Saham dengan kegiatan Pemeringkatan untuk menjaga independensi dan objektivitas dari proses dan produk kegiatan analitis. PEFINDO telah menetapkan kebijakan dan prosedur untuk menjaga kerahasiaan informasi non-publik tertentu yang diterima sehubungan dengan proses analitis. Keseluruhan proses, metodologi dan database yang digunakan dalam penyusunan Laporan Target Harga Referensi Saham ini secara keseluruhan adalah berbeda dengan proses, metodologi dan database yang digunakan PEFINDO dalam melakukan pemeringkatan. Laporan ini dibuat dan disiapkan PRK dengan tujuan untuk meningkatkan transparansi harga saham yang tercatat di Bursa Efek Indonesia (BEI). Laporan ini juga bebas dari pengaruh tekanan atau paksaan dari Bursa maupun Perseroan yang dinilai. PRK akan menerima imbalan dari BEI dan Perseroan yang dinilai untuk 2 (dua) kali pelaporan per tahun. Untuk keterangan lebih lanjut, dapat mengunjungi website kami di http://www.pefindo-consulting.co.id Laporan ini dibuat dan disiapkan oleh PEFINDO Riset dan Konsultasi - Divisi Valuasi Saham dan Indexing. Di Indonesia Laporan ini dipublikasikan pada website kami dan juga pada website Bursa Efek Indonesia.

Page 1 of 12
Contact: Equity & Index Valuation Division Phone: (6221) 7884 0200 [email protected]
“Disclaimer statement in the last page is an
integral part of this report”
www.pefindo-consulting.co.id
Dwi Aneka Jaya Kemasindo, Tbk Primary Report
Equity Valuation
October 8, 2015
Target Price
Low High 620 705
Offset Printing
Stock Performance
0
100
200
300
400
500
600
700
800
900
3,000
3,300
3,600
3,900
4,200
4,500
4,800
5,100
5,400
5,700
Aug-14 Oct-14 Dec-14 Feb-15 Apr-15 Jun-15 Aug-15
DAJKJCI
JCI DAJK
Source: Bloomberg, PEFINDO Research and Consulting Equity
& Index Valuation Division
Stock Information IDR
Ticker code DAJK
Market price as of October 7, 2015 480
Market price – 52 week high 770
Market price – 52 week low 470
Market cap – 52 week high (bn) 1,925
Market cap – 52 week low (bn) 1,175
Last 4 Weeks of Price and Volume
0
100
200
300
400
500
600
700
800
-5,000,000
0
5,000,000
10,000,000
15,000,000
20,000,000
25,000,000
30,000,000
Volume Price
Source: Bloomberg, PEFINDO Research and Consulting Equity
& Index Valuation Division
Shareholders (%)
PT Anugrah Pratama Internasional 58.98
Management 1.01
Public (each below 5%) 40.01
Enjoying sweet growth
PT Dwi Aneka Jaya Kemasindo Tbk (“DAJK”) is an Indonesia-based company primarily engaged in the manufacturing of paper-based packaging. The businesses are split into two divisions: offset printing and corrugated carton. The Company also offers design services. Its products
are used in various industries including food, electronics, pharmaceutical, and telecommunications. Its manufacturing facilities are located in Tangerang, Indonesia. The corrugated carton business started in 2011 when the Company acquired PT Super Kemas Pratama with the capacity of 24k tons. The Company today has three existing plants located in Tangerang with an offset printing capacity of 50k tons/year and corrugated carton of 48k tons/year. Considering its high utilization rate at present time, the Company will soon build the 4th plant in Subang, expected to commence in 2017.

“Disclaimer statement in the last page
is an integral part of this report”
www.pefindo-consulting.co.id
Dwi Aneka Jaya Kemasindo, Tbk
October 8, 2015 Page 2 of 12
Leading player in packaging industry
DAJK is considered as one of leading player in packaging industry. Having more than 17 years of experience, the Company has gained trust from the major players in various industries it serves. In terms of production capacity, DAJK can produce up to 48k tons/year of corrugated cartons and 50k tons/year of offset prints. We expect the capacity of offset printing to increase to 72k tons/year after all machines are installed. Going forward, we believe the Company’s foothold in this industry is getting stronger, following the realization of its expansion plan. Aiming higher growth through expansion DAJK is about to start the construction of new factory stage I in Subang on it’s a 10 ha-land. The plant, which is expected to come on stream in 2017, is built to expand DAJK’s corrugated carton capacity. The Subang factory will support DAJK’s revenues
growth at 15% YoY in 2017. The Company has budgeted around IDR550 bn for the construction, machineries and working capital of the new factory. To finance the expansion plan, the Company will raise fund of around IDR1 tn. DAJK plans to grow inorganically as the management believes that Company will be undergoing some consolidation in the medium term. Therefore, the Company will be keen on acquiring packaging companies, such as flexible packaging, as opportunity arises. This will eventually support the growth sustainability of the Company and at the same time make DAJK an integrated player. Robust revenue growth not followed by expanding margins
DAJK has seen a stellar growth of its revenues for the past five years, at CAGR 104% in the period 2010-2014. This was mainly due to a fast growing number of customers, which boost the sales volume. Thanks to the sales and marketing team that have been able to penetrate the market in Jabodetabek area. In 1H15, the Company posted revenue of IDR535 bn, reflecting 28% YoY of growth aggregately. The revenues from offset printing grew 39% YoY, while the revenues from corrugated carton products increased by 28% YoY. However, the operating margin was down to 24% from 26% in 1H14 due to higher COGS margin. Further, the Company’s net margin fell even deeper to 9.3% from 13.2%% on the back of increasing finance charges, by 64% YoY, to IDR56 bn in 1H15. Business Prospects
We have an upbeat outlook on the packaging industry in the country albeit the slowing economic growth to 4.67% in the second quarter this year. The economy is still driven by private sector consumption which accounted for more than 50% of the Gross Domestic Product in. Moreover, a productive age group of the population, which is quite significant (more than 60%), was the driving force behind the strong consumption of consumer goods in the country. The retail sales still booked a growth of 22.4% YoY in April 2015, which will in turn drive the growth of packaging industry. This year, the packaging industry is expected to grow moderately by 5% to IDR73 tn. Taking the above into consideration, underpinned by the realization of its expansion plan, we believe DAJK will be able to grow fairly fast in the years to come.
Table 1: Performance Summary 2012 2013 2014 2015P 2016P
Revenue [IDR bn] 205 513 894 1,191 1,528
Pre-tax profit [IDR bn] 38 92 115 144 191
Net profit [IDR bn] 28 68 91 108 143
EPS [IDR] 11.03 27.2 36.2 43.3 57.2
EPS growth [%] n.a 147 33 19.4* 32.2*
P/E [x] n.a n.a 15.9 11.4* 10.1*
Source: PT Dwi Aneka Jaya Kemasindo Tbk, PEFINDO Research and Consulting Equity & Index Valuation Division
Estimates * based on share price as of October 7, 2015 – IDR480/share
INVESTMENT PARAMETER

“Disclaimer statement in the last page
is an integral part of this report”
www.pefindo-consulting.co.id
Dwi Aneka Jaya Kemasindo, Tbk
October 8, 2015 Page 3 of 12
Economic growth remains slow
Uncertainties are still besetting the global economy after the financial crisis struck in 2008. Many predictions turned out to be false about the economic recovery. Optimisms with bailouts in Europe ended with new crisis. Entering 2015, World Bank predicted with greater optimism that the global economy was on the track to recovery. Falling prices of oil would reduce pressure on non-oil producing developing economies. The US economic recovery is expected to contribute to boosting the world exports including Indonesia’s exports. For Indonesia itself, we view the challenges confronting its economic development are both external and internal factors. Those from external factors including slump in global trade and slowdown in global economic recovery, an increase in interest rates in some advanced economic in different time, oil price fall, would jolt financial stability
of oil producing countries. While internal factors stemming from current account deficit caused by slump in export due to the falling price of primary commodities, slow progress in the development of infrastructure and shrinking value of Rupiah against US dollar. As a result, the country only saw the growth of 4.67% in 2Q15, slower than previous quarter of 4.71%.
Table 2: Indonesia’s Quarterly GDP Growth 2009-2015 (annual % change)
Year Q1 Q2 Q3 Q4
2015
4.71
4.67
2014
5.14
5.03
4.92
5.01
2013
6.03
5.81
5.62
5.72
2012
6.29
6.36
6.17
6.11
2011
6.45
6.52
6.49
6.50
2010
5.99
6.29
5.81
6.81
2009
4.60
4.37
4.31
4.58
Source: Central Bureau of Statistics, PEFINDO Research and Consulting Equity & Index Valuation Division
However…supported by solid F&B Industry Amid the downturn of almost all industries in 1H15, the food & beverage (“F&B”) sector in Indonesia showed its resilient by booking positive growth. The country’s sales of manufactured F&B products is estimated to book 20% YoY growth to IDR1,020 tn. This, will in turn, increase the packaging industry turnover. As of 1H15, the domestic packaging turnover reached IDR30 tn. We expect the turnover to grow moderately by 5% YoY to IDR73 tn this year. The growth is reflected in DAJK’s sales
performance, which grew by 28% YoY in 1H15.
Figure 1: Domestic F&B Turnover (IDR tn)
700 745
850
1,020
-
200
400
600
800
1,000
1,200
2012 2013 2014 2015P
Source: Bank of Indonesia, PEFINDO Research & Consulting - Equity & Index Valuation Division
MACROECONOMY & BUSINESS INFORMATION

“Disclaimer statement in the last page
is an integral part of this report”
www.pefindo-consulting.co.id
Dwi Aneka Jaya Kemasindo, Tbk
October 8, 2015 Page 4 of 12
Besides, the retail sales in Indonesia grew by 22.4% YoY in April 2015, higher than 19.7% YoY in March. Stronger sales were reported to occur across nearly all items,
particularly information and communication equipment, followed by F&B and tobacco.
Figure 2: Indonesia Retail Sales, Dec’14 – April’15
(% Yoy growth)
Source: Bank Indonesia, PEFINDO Research & Consulting – Equity & Index Valuation
Division
Uptrend of global packaging consumption We view the global packaging consumption continues to increase in Asia region as the biggest consumer among other regions. The packaging turnover in Asia reached USD160 bn in 2014. Indonesia is considered as top 15 countries with the biggest packaging consumption in the world. The packaging industry can be broadly categorized into several groups, namely paper and board, glass, metal, flexible plastics and rigid plastics. Paper and board has got the biggest slice of the cake with 38% market share, followed by those of rigid plastics (21%) and flexible plastics (13%).
DAJK at a Glance DAJK was founded in 1997 with two main business activities, namely offset printing and corrugated carton. Established in Tangerang, the Company currently has three production sites located in the city, equipped with services and facilities such as design and pre-press, press machine, post-press facilities and corrugated carton facilities. The Company was listed in Indonesia Stock Exchange in 2014. Since its establishment, DAJK has seen an astonishing revenues growth, from only IDR800 mn in 2000 to IDR894 bn in 2014. It was mainly due to its vigorous expansion strategy and excellent execution, supported by strong management team and sales force. DAJK has incorporated a subsidiary PT Inpack Subang Perkasa (ISP) that will own and
manage the new factory to be built in Subang, West Java.
Figure 3: DAJK’s Milestones
Source: PT Dwi Aneka Jaya Kemasindo Tbk, PEFINDO Research and Consulting Equity & Index Valuation Division
“Disclaimer statement in the last page
is an integral part of this report”
www.pefindo-consulting.co.id
Dwi Aneka Jaya Kemasindo, Tbk
October 8, 2015 Page 5 of 12
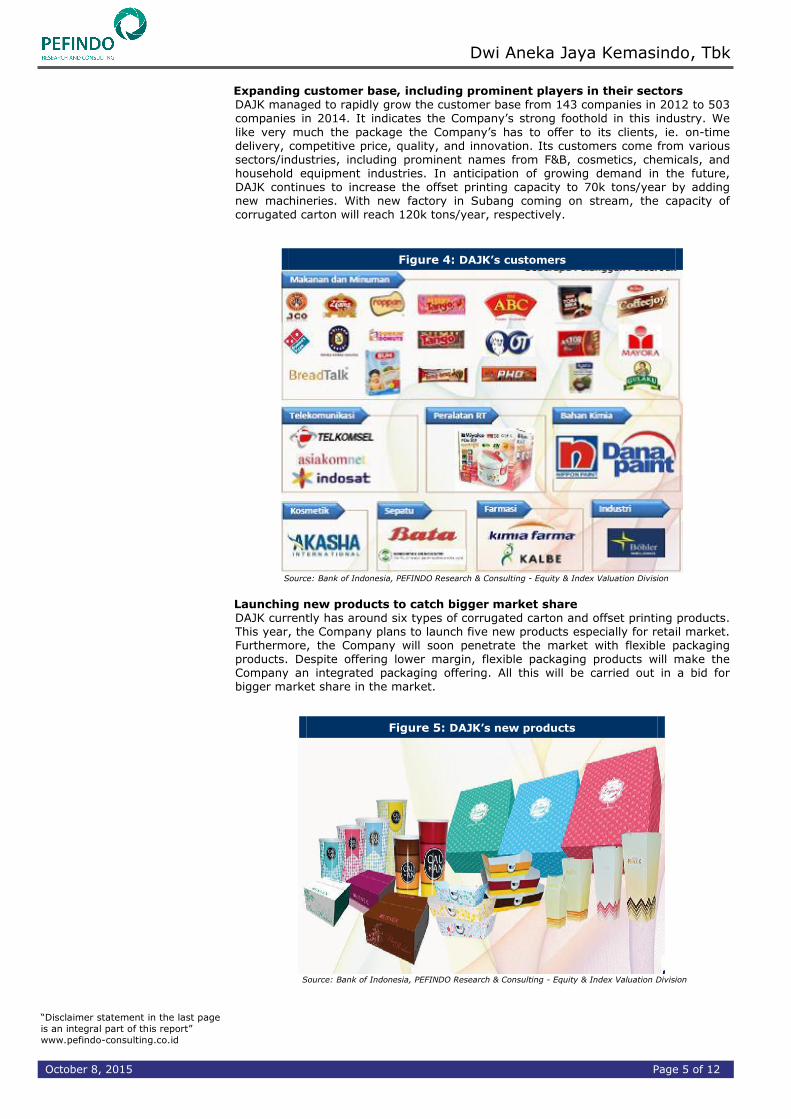
Expanding customer base, including prominent players in their sectors DAJK managed to rapidly grow the customer base from 143 companies in 2012 to 503 companies in 2014. It indicates the Company’s strong foothold in this industry. We
like very much the package the Company’s has to offer to its clients, ie. on-time delivery, competitive price, quality, and innovation. Its customers come from various sectors/industries, including prominent names from F&B, cosmetics, chemicals, and household equipment industries. In anticipation of growing demand in the future, DAJK continues to increase the offset printing capacity to 70k tons/year by adding new machineries. With new factory in Subang coming on stream, the capacity of corrugated carton will reach 120k tons/year, respectively.
Figure 4: DAJK’s customers
Source: Bank of Indonesia, PEFINDO Research & Consulting - Equity & Index Valuation Division
Launching new products to catch bigger market share DAJK currently has around six types of corrugated carton and offset printing products. This year, the Company plans to launch five new products especially for retail market. Furthermore, the Company will soon penetrate the market with flexible packaging products. Despite offering lower margin, flexible packaging products will make the Company an integrated packaging offering. All this will be carried out in a bid for bigger market share in the market.
Figure 5: DAJK’s new products
Source: Bank of Indonesia, PEFINDO Research & Consulting - Equity & Index Valuation Division

“Disclaimer statement in the last page
is an integral part of this report”
www.pefindo-consulting.co.id
Dwi Aneka Jaya Kemasindo, Tbk
October 8, 2015 Page 6 of 12
Revenue jumped but margin squeezed
DAJK posted strong revenue growth with CAGR 104% during 2010-2014 period. Further, its revenue also soared to IDR535 bn in 1H15, up by 28% YoY from the same period a year earlier. It was particularly driven by the growing number of customers, which boosted the sales volume. The revenues from offset printing, as the major revenue contributor, grew by 39%, while the revenues from corrugated carton rose by 11% during 1H15. However, the operating margin was down to 24% from 26% in 1H14 due to higher COGS margin. The net income margin fell even deeper to 9.3% from 13.2% in 1H14 on the back of higher finance charges, hiking by 64% YoY to IDR56 bn in 1H15.
Figure 6: DAJK’s Revenue and Profit Figure 7: DAJK’s Profitability Margin
205
513
894
1,191
60141
189251
2868 91 108
0
200
400
600
800
1,000
1,200
1,400
2012 2013 2014 2015P
Revenue Operating profit Net profit
0.0%
5.0%
10.0%
15.0%
20.0%
25.0%
30.0%
35.0%
40.0%
45.0%
2012 2013 2014 2015P
Gross margin Operating margin Net margin
Source: PT Dwi Aneka Jaya Kemasindo Tbk, PEFINDO
Research and Consulting - Equity & Index Valuation Division Estimates
Source: PT Dwi Aneka Jaya Kemasindo Tbk, PEFINDO
Research and Consulting - Equity & Index Valuation Division
Leverage remains a concern In our view, DAJK has relatively a high leverage, indicated by the rapidly rising debt/EBITDA ratio of 6.8x in 1H15 vs. 3.2x in 1H14. During the past year, its debt stock increased by around IDR196 bn from IDR759 bn in FY2014, bringing its interest
coverage ratio down to 2.2x from 2.6x in 2014. The declining ratio was as a result of increasing finance cost from IDR34bn in 1H14 to IDR56 bn in 1H15 (up by a significant 64%). To finance the expansion strategy, we have concerns over how much space will be available for the balance sheet to comfortably carry additional debt. We therefore expect to see DAJK to refinance some of the existing debt to provide breathing space and raise equity-linked debt to support the expansion strategy.
Figure 8: DAJK’s debt and EBITDA profile (IDR bn)
453
596
759
397
945
71
164222
124 139
0
100
200
300
400
500
600
700
800
900
1000
2012 2013 2014 1H14 1H15
Debt EBITDA
Source: Bank of Indonesia, PEFINDO Research & Consulting - Equity & Index Valuation Division
FINANCE

“Disclaimer statement in the last page
is an integral part of this report”
www.pefindo-consulting.co.id
Dwi Aneka Jaya Kemasindo, Tbk
October 8, 2015 Page 7 of 12
Need more capacity for higher growth DAJK saw significant increase in sales volume from both offset printing and corrugated carton. It was in line with the increasing number of customers, from 143 in 2012 to
502 in 2015, or around CAGR 87%. As of 2014, the Company sold 32k tons of offset printing and 43k tons of corrugated carton products, reflecting 90% of utilization rate. To anticipate the growing demand, the Company plans to build its fourth plant in Subang, expected to commence its commercial operations in 2017. The total investment for Subang project is IDR550 bn with production capacity of 120k tons/year. In addition, the subsidiaries of the Company, PT DAJK Distributor Indonesia (DDI) and PT DAJK Portal Indonesia (DPI), which are engaged in trading and distribution as well as export import trading, will contribute to the growth of the Company. Besides, the Company also own PT. Inpack Subang, which manufactures corrugated carton. In line with the growing consumption in the country, we believe the additional capacity will fuel DAJK’s growth in the next 3-5 years.
Figure 9: Offset printing capacity and volume (in ton)
Figure 10: Corrugated carton capacity
and volume (in ton)
12,000
20,000
35,000
50,000
4,546
16,200
31,500
41,500
-
10,000
20,000
30,000
40,000
50,000
60,000
2012 2013 2014 2015P
Offset printing capacity Sales volume
-
10,000
20,000
30,000
40,000
50,000
60,000
2012 2013 2014 2015P
corrugated carton capacity sales volume
Source: PT Dwi Aneka Jaya Kemasindo Tbk, PEFINDO
Research and Consulting - Equity & Index Valuation Division
Estimates
Source: PT Dwi Aneka Jaya Kemasindo Tbk, PEFINDO
Research and Consulting - Equity & Index Valuation
Division
Table 3: SWOT Analysis
Strength Weakness Long presence in the packaging
industry with complete production facilities including offset printing and corrugated carton
Well diversified customers from various industries, several of which are leading players
Attratctive product offering: reliable products and services at competitive price
Relatively high leverage Limited production capacity at the
moment
Opportunity Threat
Solid growth of F&B industry as one of the major customers
Rising middle class population, the demand driver of packaging products
High barrier to entry
Government regulation to increase minimum wages
Labor strikes and rallies could halt operation activities
Source: PEFINDO Research and Consulting Equity & Index Valuation Division
SWOT ANALYSIS

“Disclaimer statement in the last page
is an integral part of this report”
www.pefindo-consulting.co.id
Dwi Aneka Jaya Kemasindo, Tbk
October 8, 2015 Page 8 of 12
Table 4: Performance Summary of DAJK vs Peers as of 1H15 DAJK KDSI
Revenue [IDR bn] 894 878
Gross profit [IDR bn] 277 97
Operating profit [IDR bn] 189 13
Net profit [IDR bn] 91 1
Total assets [IDR bn] 2,159 1,062
Total liabilities [IDR bn] 945 694
Total equity [IDR bn] 1,115 368
Growth YoY
Revenue [%] 27.98 10.58
Gross profit [%] 12.06 (9.35)
Net profit [%] (9.81) (91.67)
Profitability
Gross profit margin [%] 30.99 11.05
Operating margin [%] 21.14 1.48
Net Margin [%]* 10.13 0.11
Leverage
DER [x] 0.85 1.89
Source: IDX, PEFINDO Research and Consulting Equity & Index Valuation Division * annualized
INDUSTRY COMPARISON

“Disclaimer statement in the last page
is an integral part of this report”
www.pefindo-consulting.co.id
Dwi Aneka Jaya Kemasindo, Tbk
October 8, 2015 Page 9 of 12
VALUATION
Methodology We applied the Discounted Cash Flow (DCF) method as the main valuation approach considering that income growth is the value driver in DAJK instead of asset growth. Furthermore, we applied the Guideline Company Method (GCM) as a comparison method.
This valuation is based on 100% share price as of October 7, 2015, using DAJK’s financial report as of June 30, 2015, for our fundamental analysis.
Value Estimation
We used a Cost of Capital of 9.3% and Cost of Equity of 10.5% based on the following assumptions: Table 5: Assumption
Risk free rate [%]* 9.0
Risk premium [%]* 4.8
Beta [x]** 0.3
Cost of Equity [%] 10.5
Marginal Tax Rate [%] 25.0
WACC [%] 9.3
Source: Bloomberg, PEFINDO Research and Consulting - Equity &
Index Valuation Division Estimates * as of October 7, 2015
Target price for 12 months based on the valuation as of October 7, 2015, is as follows:
Using the DCF method with a discount rate assumption of 9.3% is IDR755
– IDR870 per share. Using the GCM method (P/E 7.1x and P/BV 0.7x) is IDR310 – IDR320 per
share.
In order to obtain a value that represents both value indications, we have weighted both DCF and GCM methods by 70%:30%. Based on the above calculation, the target price of DAJK for 12 months is IDR620 – IDR705 per share.
Table 6: Summary of DCF Method Valuation
Conservative Moderate Optimistic
PV of Free Cash Flows – [IDR, bn] 95 100 105
PV Terminal Value – [IDR, bn] 2,632 2,771 2,910
Non-Operating Assets – [IDR, bn] 105 105 105
Debt – [IDR, bn] (945) (945) (945)
Number of Share, [mn shares] 2,500 2,500 2,500
Fair Value per Share, [IDR] 755 810 870
Source: PEFINDO Research and Consulting - Equity & Index Valuation Division Estimates
TARGET PRICE
“Disclaimer statement in the last page
is an integral part of this report”
www.pefindo-consulting.co.id
Dwi Aneka Jaya Kemasindo, Tbk
October 8, 2015 Page 10 of 12
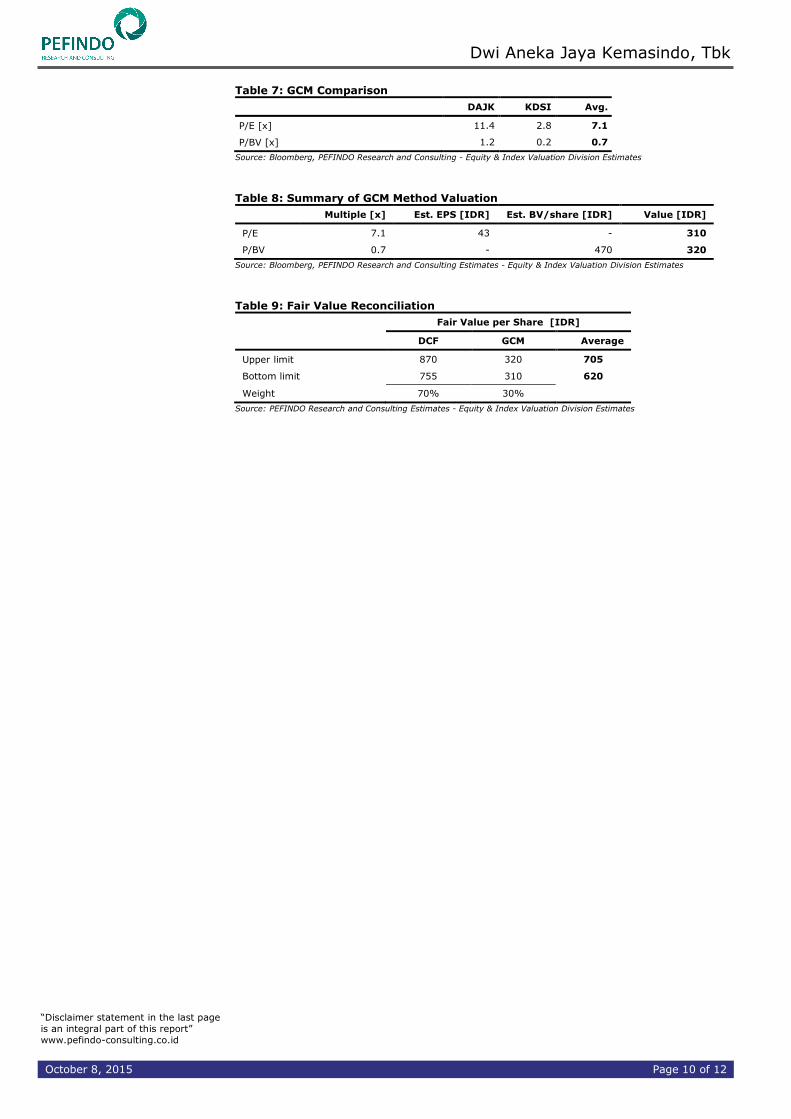
Table 7: GCM Comparison
DAJK KDSI Avg.
P/E [x] 11.4 2.8 7.1
P/BV [x] 1.2 0.2 0.7
Source: Bloomberg, PEFINDO Research and Consulting - Equity & Index Valuation Division Estimates
Table 8: Summary of GCM Method Valuation
Multiple [x] Est. EPS [IDR] Est. BV/share [IDR] Value [IDR]
P/E 7.1 43 - 310
P/BV 0.7 - 470 320
Source: Bloomberg, PEFINDO Research and Consulting Estimates - Equity & Index Valuation Division Estimates
Table 9: Fair Value Reconciliation
Fair Value per Share [IDR]
DCF GCM Average
Upper limit 870 320 705
Bottom limit 755 310 620
Weight 70% 30%
Source: PEFINDO Research and Consulting Estimates - Equity & Index Valuation Division Estimates

“Disclaimer statement in the last page
is an integral part of this report”
www.pefindo-consulting.co.id
Dwi Aneka Jaya Kemasindo, Tbk
October 8, 2015 Page 11 of 12
Table 10: Consolidated Statement of Comprehensive Income
(IDR bn)
2012 2013 2014 2015P 2016P
Revenue 205 513 894 1,191 1,528
COGS (126) (330) (617) (821) (1,054)
Gross profit 79 184 277 370 474
Operating expense (19) (42) (88) (119) (156)
Operating profit 60 141 189 251 317
Other income
(charges)
(22) (49) (74) (107) (127)
Pre-tax profit 38 92 115 144 191
Tax (11) (24) (24) (36) (48)
Net profit 28 68 91 108 143
Source: PT Dwi Aneka Jaya Kemasindo Tbk, PEFINDO Research and Consulting -
Equity & Index Valuation Division Estimates
Table 11: Consolidated Statement of Financial Position
(IDR bn)
2012 2013 2014 2015P 2016P
Assets
Cash and cash equivalents 118 37 144 209 109
Receivables 210 401 574 752 960
Inventories - 2 3 12 5
Other assets 108 360 725 970 871
Total Current Assets 437 799 1,446 1,943 1,944
Fixed assets 1 1 1 3 4
Other assets 253 329 456 604 762
Total assets 691 1,129 1,903 2,551 2,710
Liabilities
Trade payables 26 66 73 88 99
Short-term debts 268 331 392 506 506
Other liabilities 59 58 68 261 262
Long-term debts 126 207 300 516 521
Other liabilities 4 3 4 4 4
Total liabilities 482 665 837 1,376 1,391
Total equity 208 463 1,066 1,174 1,317
Source: PT Dwi Aneka Jaya Kemasindo Tbk, PEFINDO Research and Consulting -
Equity & Index Valuation Division Estimates
Figure 11: ROA, ROE and Assets Turnover
0.20
0.20
0.20
0.20
0.20
0.21
0.21
0.00
2.00
4.00
6.00
8.00
10.00
12.00
2012 2013 2014
RO
E
RO
A
ROA ROE Asset turnover
Source: PT Dwi Aneka Jaya Kemasindo Tbk, PEFINDO Equity & Index Valuation Division
Table 12: Key Ratios
2012 2013 2014 2015P 2016P
Growth [%]
Net sales n.a 150.1 74.3 33.2 28.3
Operating profit n.a 134.7 33.9 32.9 32.9
Net profit n.a 146.7 33.1 19.4 19.4
Profitability [%]
Gross margin 38.5 35.8 31.0 31.1 31.0
Operating margin 29.3 27.5 21.1 21.1 20.8
Net margin 13.4 13.3 10.1 9.1 9.4
ROA 4.0 6.0 5 4 5
ROE 13.3 14.7 9 9 11
Solvability [x]
Liabilities to equity 2.2 1.3 0.7 0.9 0.8
Liabilities to assets 0.6 0.4 0.4 0.5 0.5
Source: PT Dwi Aneka Jaya Kemasindo Tbk, PEFINDO Research and Consulting - Equity &
Index Valuation Division Estimates

“Disclaimer statement in the last page
is an integral part of this report”
www.pefindo-consulting.co.id
Dwi Aneka Jaya Kemasindo, Tbk
October 8, 2015 Page 12 of 12
DISCLAIMER
This report was prepared based on trusted and reliable sources. Nevertheless, we do not guarantee its completeness, accuracy and adequacy. Therefore, we are not responsible for any investment decisions made based on this report. All assumptions, opinions and predictions were solely our internal judgments as of the reporting date, and those judgments are subject to change without further notice. We are not responsible for any mistakes or negligence that occurs by using this report. Recent performance cannot always be used as a reference for future outcome. This report does not offer a recommendation to purchase or hold particular shares. This report might not be suitable for some investors. All opinions in this report have been presented fairly as of the issuing date with good intentions; however, they could change at any time without further notice. The price, value or income of each share of the Company stated in this report might be lower than investor expectations, and investors may obtain returns lower than the invested amount. Investment is defined as the probable income that will be received in the future; nonetheless such returns may fluctuate. As for companies whose shares are denominated in a currency other than Rupiah, foreign exchange fluctuation may reduce their share value, price or the returns for investors. This report does not contain any information for tax considerations in investment decision-making. The share price target in this report is a fundamental value, not a fair market value or a transaction price reference required by regulations. The share price target report issued by the PT PEFINDO R iset Konsultasi (“PRK”) or “PEFINDO Research and Consulting” is not a recommendation to buy, sell or hold particular shares. It should not be considered as investment advice from the PRK and its scope of service to some parties, including listed companies, financial advisors, brokers, investment banks, financial institutions and intermediaries, does not correlate with receiving rewards or any other benefits from such parties. This report is not intended for any particular investor and cannot be used as par t of an objective investment analysis of particular shares, an investment recommendation, or an investment strategy. We strongly recommend investors to consider the suitability of the situation and conditions before making a decision in relation with the figures in this report. If necessary, consult with your financial advisor. PEFINDO keeps the activities of the Equity Valuation Division separate from its Ratings Division to preserve the independence and objectivity of its analytical processes and products. PEFINDO has established policies and procedures to maintain the confidentiality of non-public information received in connection with each analytical process. The entire process, methodology and the database used in the preparation of the Reference Share Price Target Report as a whole are different from the processes, methodologies and databases used by PEFINDO in issuing ratings. This report was prepared and composed by PRK with the objective of enhancing the transparency of share prices of listed companies in the Indonesia Stock Exchange (IDX). This report is also free of influence from
any other party, including pressure or force either from IDX or the listed company reviewed. PRK earns a reward from IDX and the reviewed company for issuing this report twice a year. For further information, please visit our website at http://www.pefindo-consulting.co.id This report was prepared and composed by the PEFINDO Research & Consulting - Equity & Index Valuation Division. In Indonesia, this report is published in our website and in the IDX website.