bab 6 kesimpulan dan saran 6.1. kesimpulan · usulan terhadap pemilik usaha bakpia pathok wijaya...
TRANSCRIPT
32
BAB 6
KESIMPULAN DAN SARAN
6.1. Kesimpulan
Berdasarkan hasil penelitian, maka dapat disimpulkan beberapa hal sebagai
berikut :
1. Kondisi toko Bakpia Wijaya sekarang ini memiliki kelemahan dalam hal
cangkupan pasar yang terbatas, dan jumlah fariasi rasa produk yang
lebih sedikit dibandingkan 3 kompetitornya.
2. Dengan adanya penelitian ini diharapkan pemilik toko Bakpia Wijaya
dapat menentukan toko kompetitor melalui identifikasi kesamaan atribut
produk.
3. Toko Bakpia Wijaya masih memiliki kelemahan dalam hal menggaet
pelanggan demi menunjang penjualan produknya.
4. Usulan terhadap pemilik usaha bakpia pathok wijaya
Dalam Pemasaran :
a) Memanfaatkan kemajuan teknologi, dengan cara
mempromosikan usahanya melalui facebook atau instagram.
Menambah Varian Rasa :
a) Rasa Daging Ayam
b) Rasa Keju Coklat
c) Rasa Strawberry
6.2. Saran
Langkah yang perlu dilakukan oleh pemilik toko Bakpia Wijaya adalah
melihat dari hasil survei yang sudah dilakukan, maka perlu memanfaatkan
kemajuan teknologi, dengan cara mempromosikan usahanya melalui
facebook atau instagram demi meningkatkan penjualan.
DAFTAR PUSTAKA
Alex S. Nitisemito, (2006) Marketing, Penerbit Ghalia, Indonesia.
Ana Anggraeni Puspitasari (2009) pengertian Analisis Multidimensional Scaling.
http://eprints.uny.ac.id/2389/1/Analisis_MDS2.pdf
Assauri Sofyan, (2008), Manajemen Produksi, Edisi Ketiga, Penerbit Fakultas
Ekonomi Universitas Indonesia.
Bimo Walgitho, (2010) pengertian Kuesioner beserta contoh angket.
http://www.maribelajarbk.web.id/2014/12/pengertian-dan-contoh-angket-
atau-kuesioner.html
Dewi Kurniawati dan Henry Yuliando, “Productivitas Improvment of Small Scale
Medium Enterprises (SMEs) on Food Product: Case at Yogyakarta
Province, Indonesia”
Dillon, W. R. Matthew, G. (1984), Multivariate Analysis: Methods and Aplication.
John Willey and Sons Inc, New York.
Dinas Pariwisata Daerah Istimewa Yogyakarta, www.visitingjogja.com
https://id.wikipedia.org/wiki/Daerah_Istimewa_Yogyakarta
http://leo4kusuma.blogspot.co.id/2008/12/latar-belakang-propinsi-daerah-
istimewa.html http://www.businessdictionary.com/definition/positioning.html
Fandy Tjiptono, (2008), Strategi Pemasaran, Edisi Kedua, Cetakan Keenam,
Penerbit Andi, Yogyakarta.
Fayshal, dkk (2013), Analisis Strategi Pemasaran Produk Asuransi Jiwa pada
Bumi Putera Syariah Cabang Depok. Universitas Gunadarma.
Gamalieli Fernandez Suranta dan Ade Titi Nifita, (2015), Analisis Strategi
Pemasaran Jasa Menghadapi Pesaing, Skripsi, Universitas Jambi.
M. Mursid, (2010), Manajemen Pemasaran, Bumi Aksara, Jakarta.
Nofrizal, (2015), Analisis Strategi Bersaing Gudang Digital Yogyakarta Dalam
Memperluas Pasar. Universitas Lancang Kuning.

Philip Kotler, (2007), Manajemen Pemasaran, Edisi Milenium, Penerbit
Prehallindo, Jakarta.
Prof. Gudono, Ph.D. Buku “analisis Multivariat”, “Analisis Multidimensional
Scaling”.
Puspitasari, dkk (2014), Analisis Strategi Bersaing pada PT. ASIA INOVASI
DIMENSI CIPTA. Universitas Kristen Petra, Surabaya.
Radiosunu, (2006), Manajemen Pemasaran Suatu Pendekatan Analisis, Penerbit
Fakultas Ekonomi Universitas Gajah Mada, Yogyakarta.
Taman Sari, (2009). Strategi Pemasaran Kopi Bubuk Sari Artha di Kecamatan
Petang Kabupaten Bandung, Universitas Udayana Denpasar.
Tjiptono, F. (2004). Manajemen Jasa. Andi. Yogyakarta.
Tjiptono, F. (2008). Strategi Bisnis Pemasaran. Andi. Yogyakarta.
Unik Budiasa I Ketut, (2009), Strategi Bauran Pemasaran Untuk Meningkatkan
Nilai Penjualan pada Percetakan Swadesi di Denpasar, Skripsi, Fakultas
Ekonomi Universitas Warmadewa Denpasar.
Yohana M.L.Gultom (2014) jurnal international “Explaining the Informal Sector in
Indonesia from the Transaction Costs Perspective”
LAMPIRAN
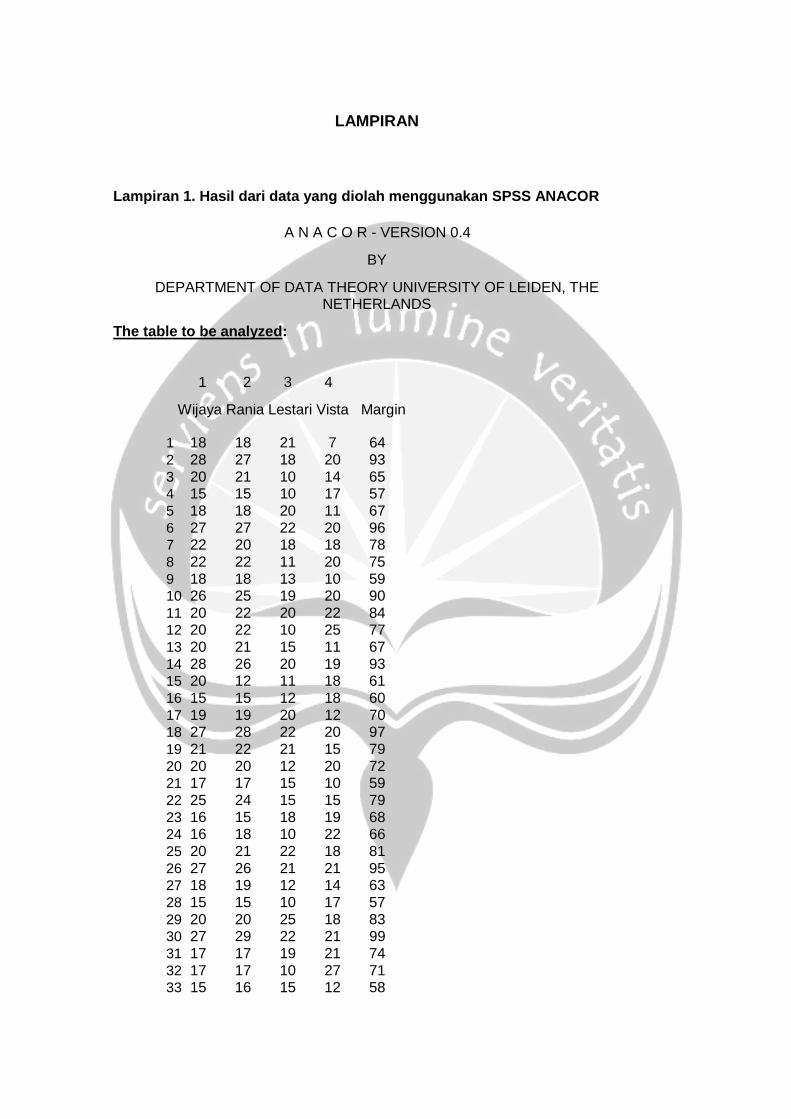
Lampiran 1. Hasil dari data yang diolah menggunakan SPSS ANACOR
A N A C O R - VERSION 0.4
BY
DEPARTMENT OF DATA THEORY UNIVERSITY OF LEIDEN, THE NETHERLANDS
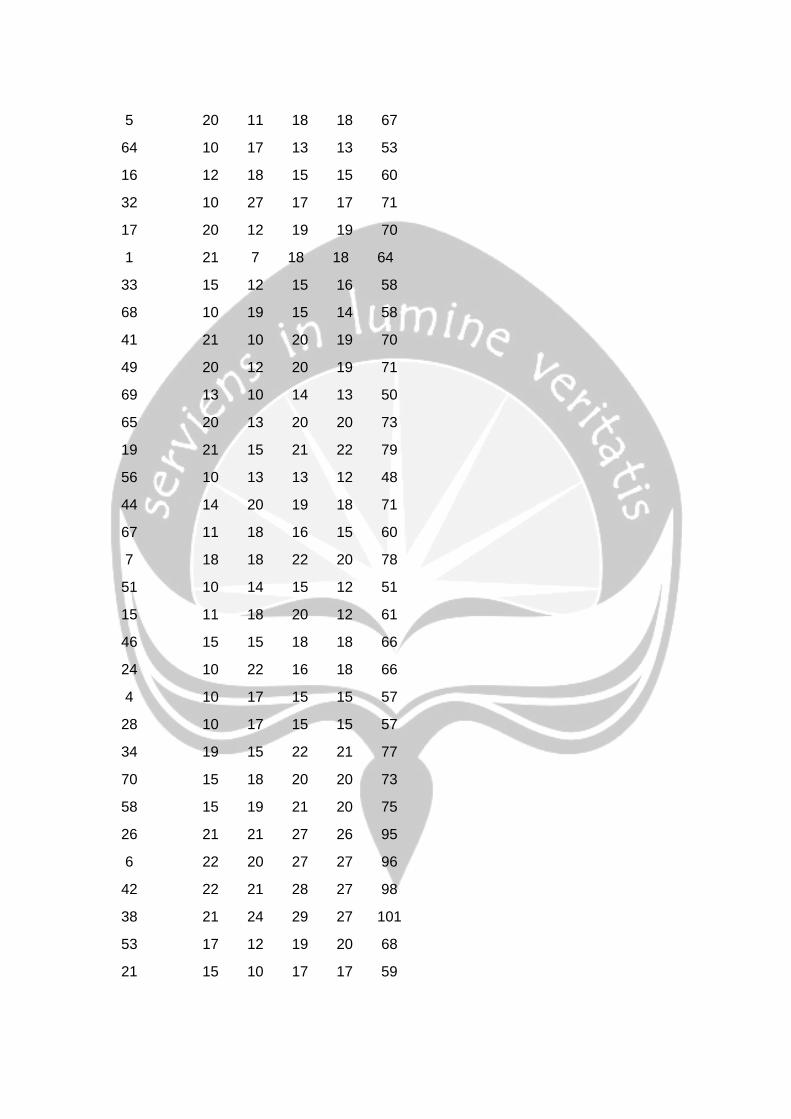
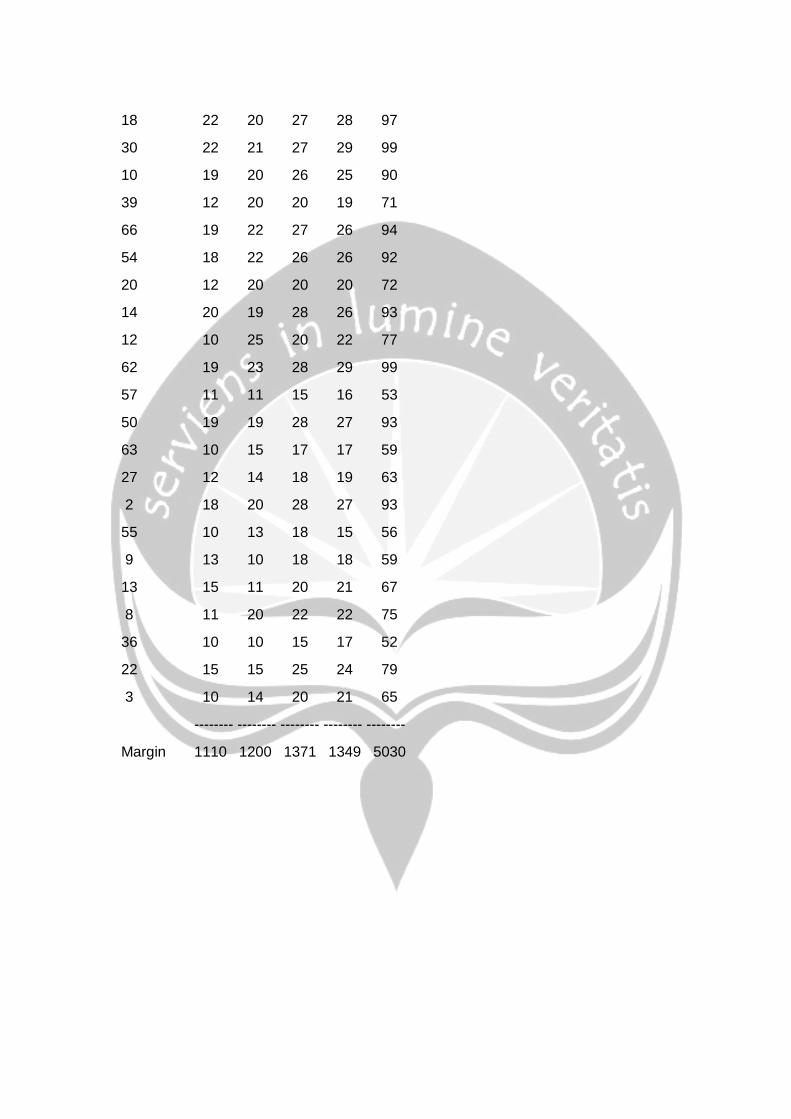
The table to be analyzed:
1 2 3 4
Wijaya Rania Lestari Vista Margin
1 18 18 21 7 64 2 28 27 18 20 93 3 20 21 10 14 65 4 15 15 10 17 57 5 18 18 20 11 67 6 27 27 22 20 96 7 22 20 18 18 78 8 22 22 11 20 75 9 18 18 13 10 59 10 26 25 19 20 90 11 20 22 20 22 84 12 20 22 10 25 77 13 20 21 15 11 67 14 28 26 20 19 93 15 20 12 11 18 61 16 15 15 12 18 60 17 19 19 20 12 70 18 27 28 22 20 97 19 21 22 21 15 79 20 20 20 12 20 72 21 17 17 15 10 59 22 25 24 15 15 79 23 16 15 18 19 68 24 16 18 10 22 66 25 20 21 22 18 81 26 27 26 21 21 95 27 18 19 12 14 63 28 15 15 10 17 57 29 20 20 25 18 83 30 27 29 22 21 99 31 17 17 19 21 74 32 17 17 10 27 71 33 15 16 15 12 58
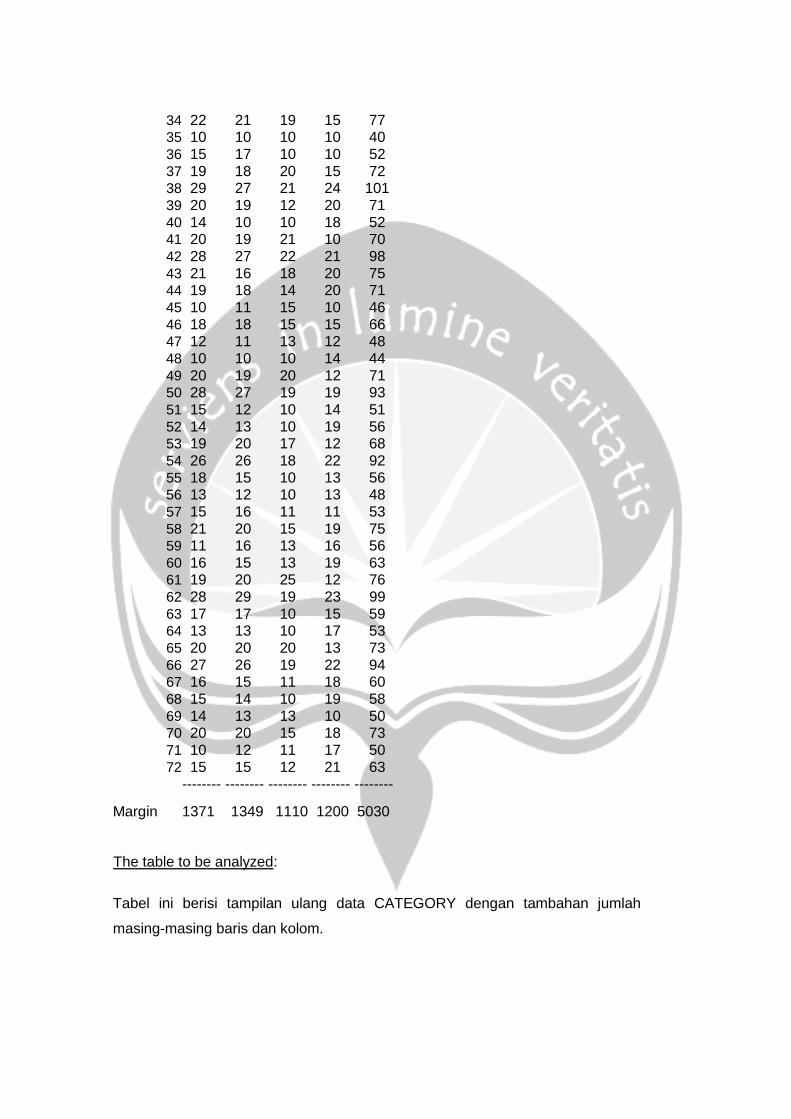
34 22 21 19 15 77 35 10 10 10 10 40 36 15 17 10 10 52 37 19 18 20 15 72 38 29 27 21 24 101 39 20 19 12 20 71 40 14 10 10 18 52 41 20 19 21 10 70 42 28 27 22 21 98 43 21 16 18 20 75 44 19 18 14 20 71 45 10 11 15 10 46 46 18 18 15 15 66 47 12 11 13 12 48 48 10 10 10 14 44 49 20 19 20 12 71 50 28 27 19 19 93 51 15 12 10 14 51 52 14 13 10 19 56 53 19 20 17 12 68 54 26 26 18 22 92 55 18 15 10 13 56 56 13 12 10 13 48 57 15 16 11 11 53 58 21 20 15 19 75 59 11 16 13 16 56 60 16 15 13 19 63 61 19 20 25 12 76 62 28 29 19 23 99 63 17 17 10 15 59 64 13 13 10 17 53 65 20 20 20 13 73 66 27 26 19 22 94 67 16 15 11 18 60 68 15 14 10 19 58 69 14 13 13 10 50 70 20 20 15 18 73 71 10 12 11 17 50 72 15 15 12 21 63
-------- -------- -------- -------- --------
Margin 1371 1349 1110 1200 5030
The table to be analyzed:
Tabel ini berisi tampilan ulang data CATEGORY dengan tambahan jumlah
masing-masing baris dan kolom.
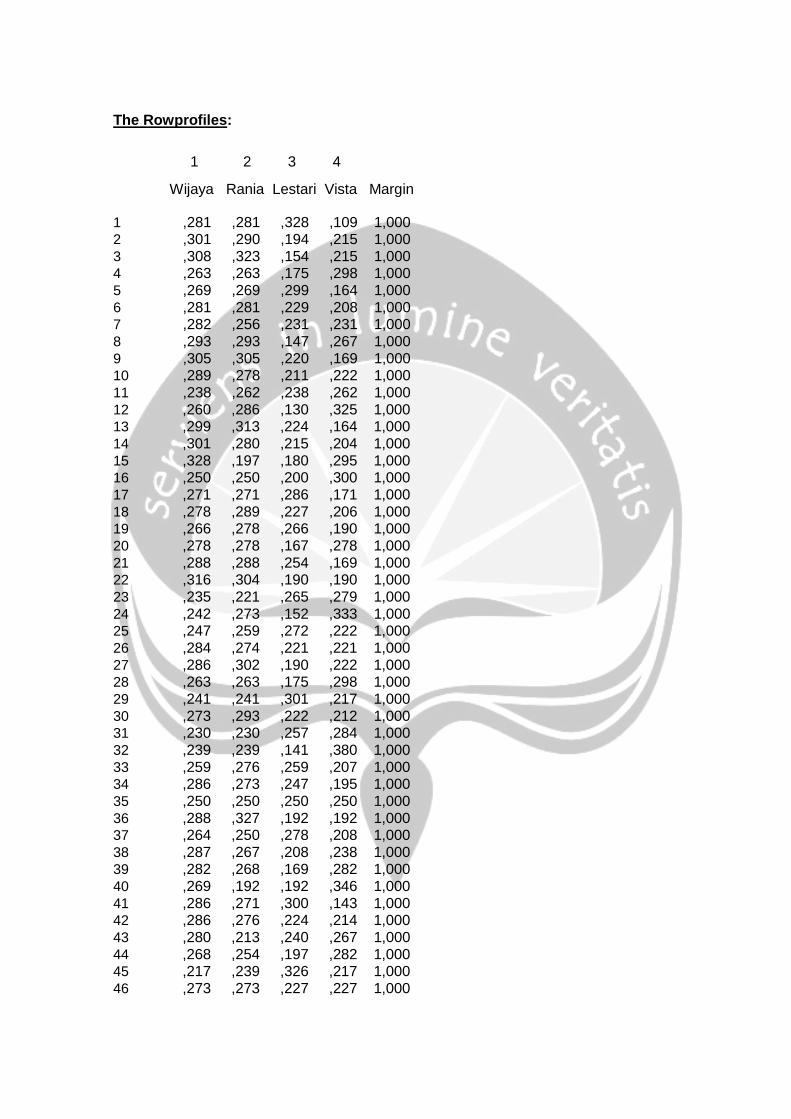
The Rowprofiles:
1 2 3 4
Wijaya Rania Lestari Vista Margin
1 ,281 ,281 ,328 ,109 1,000 2 ,301 ,290 ,194 ,215 1,000 3 ,308 ,323 ,154 ,215 1,000 4 ,263 ,263 ,175 ,298 1,000 5 ,269 ,269 ,299 ,164 1,000 6 ,281 ,281 ,229 ,208 1,000 7 ,282 ,256 ,231 ,231 1,000 8 ,293 ,293 ,147 ,267 1,000 9 ,305 ,305 ,220 ,169 1,000 10 ,289 ,278 ,211 ,222 1,000 11 ,238 ,262 ,238 ,262 1,000 12 ,260 ,286 ,130 ,325 1,000 13 ,299 ,313 ,224 ,164 1,000 14 ,301 ,280 ,215 ,204 1,000 15 ,328 ,197 ,180 ,295 1,000 16 ,250 ,250 ,200 ,300 1,000 17 ,271 ,271 ,286 ,171 1,000 18 ,278 ,289 ,227 ,206 1,000 19 ,266 ,278 ,266 ,190 1,000 20 ,278 ,278 ,167 ,278 1,000 21 ,288 ,288 ,254 ,169 1,000 22 ,316 ,304 ,190 ,190 1,000 23 ,235 ,221 ,265 ,279 1,000 24 ,242 ,273 ,152 ,333 1,000 25 ,247 ,259 ,272 ,222 1,000 26 ,284 ,274 ,221 ,221 1,000 27 ,286 ,302 ,190 ,222 1,000 28 ,263 ,263 ,175 ,298 1,000 29 ,241 ,241 ,301 ,217 1,000 30 ,273 ,293 ,222 ,212 1,000 31 ,230 ,230 ,257 ,284 1,000 32 ,239 ,239 ,141 ,380 1,000 33 ,259 ,276 ,259 ,207 1,000 34 ,286 ,273 ,247 ,195 1,000 35 ,250 ,250 ,250 ,250 1,000 36 ,288 ,327 ,192 ,192 1,000 37 ,264 ,250 ,278 ,208 1,000 38 ,287 ,267 ,208 ,238 1,000 39 ,282 ,268 ,169 ,282 1,000 40 ,269 ,192 ,192 ,346 1,000 41 ,286 ,271 ,300 ,143 1,000 42 ,286 ,276 ,224 ,214 1,000 43 ,280 ,213 ,240 ,267 1,000 44 ,268 ,254 ,197 ,282 1,000 45 ,217 ,239 ,326 ,217 1,000 46 ,273 ,273 ,227 ,227 1,000
47 ,250 ,229 ,271 ,250 1,000 48 ,227 ,227 ,227 ,318 1,000 49 ,282 ,268 ,282 ,169 1,000 50 ,301 ,290 ,204 ,204 1,000 51 ,294 ,235 ,196 ,275 1,000 52 ,250 ,232 ,179 ,339 1,000 53 ,279 ,294 ,250 ,176 1,000 54 ,283 ,283 ,196 ,239 1,000 55 ,321 ,268 ,179 ,232 1,000 56 ,271 ,250 ,208 ,271 1,000 57 ,283 ,302 ,208 ,208 1,000 58 ,280 ,267 ,200 ,253 1,000 59 ,196 ,286 ,232 ,286 1,000 60 ,254 ,238 ,206 ,302 1,000 61 ,250 ,263 ,329 ,158 1,000 62 ,283 ,293 ,192 ,232 1,000 63 ,288 ,288 ,169 ,254 1,000 64 ,245 ,245 ,189 ,321 1,000 65 ,274 ,274 ,274 ,178 1,000 66 ,287 ,277 ,202 ,234 1,000 67 ,267 ,250 ,183 ,300 1,000 68 ,259 ,241 ,172 ,328 1,000 69 ,280 ,260 ,260 ,200 1,000 70 ,274 ,274 ,205 ,247 1,000 71 ,200 ,240 ,220 ,340 1,000 72 ,238 ,238 ,190 ,333 1,000 -------- -------- -------- --------
Margin ,273 ,268 ,221 ,239
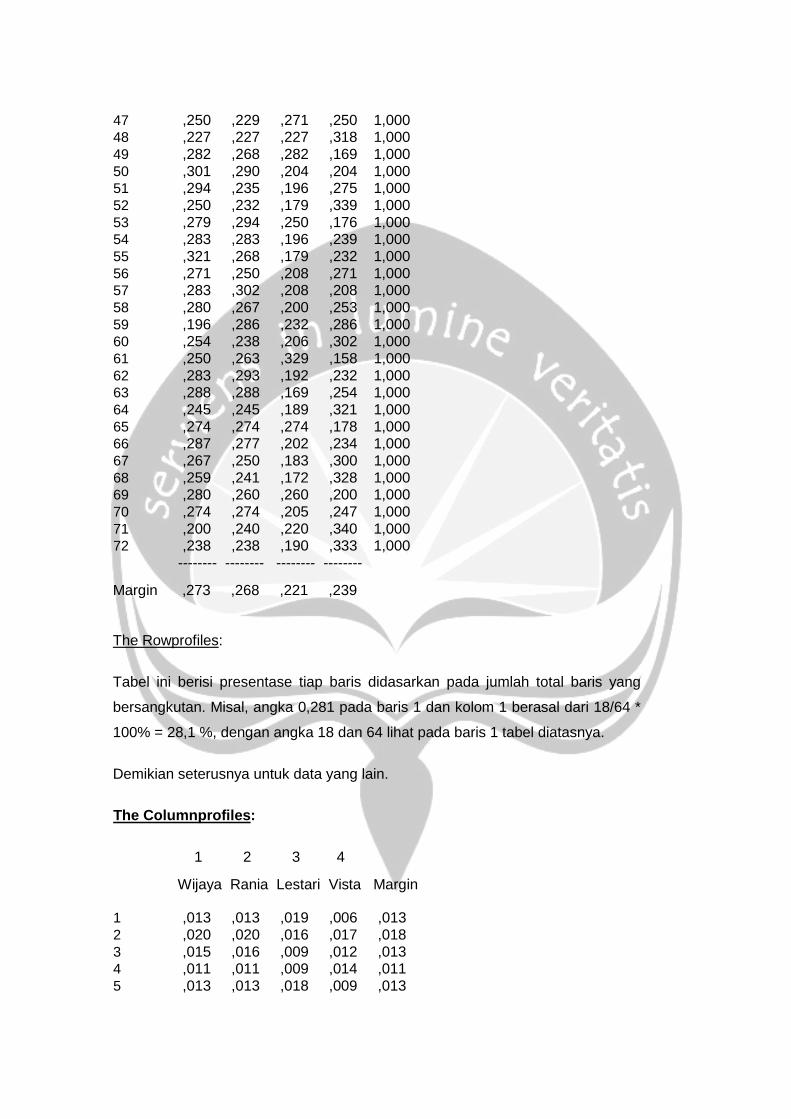
The Rowprofiles:
Tabel ini berisi presentase tiap baris didasarkan pada jumlah total baris yang
bersangkutan. Misal, angka 0,281 pada baris 1 dan kolom 1 berasal dari 18/64 *
100% = 28,1 %, dengan angka 18 dan 64 lihat pada baris 1 tabel diatasnya.
Demikian seterusnya untuk data yang lain.
The Columnprofiles:
1 2 3 4
Wijaya Rania Lestari Vista Margin
1 ,013 ,013 ,019 ,006 ,013 2 ,020 ,020 ,016 ,017 ,018 3 ,015 ,016 ,009 ,012 ,013 4 ,011 ,011 ,009 ,014 ,011 5 ,013 ,013 ,018 ,009 ,013

6 ,020 ,020 ,020 ,017 ,019 7 ,016 ,015 ,016 ,015 ,016 8 ,016 ,016 ,010 ,017 ,015 9 ,013 ,013 ,012 ,008 ,012 10 ,019 ,019 ,017 ,017 ,018 11 ,015 ,016 ,018 ,018 ,017 12 ,015 ,016 ,009 ,021 ,015 13 ,015 ,016 ,014 ,009 ,013 14 ,020 ,019 ,018 ,016 ,018 15 ,015 ,009 ,010 ,015 ,012 16 ,011 ,011 ,011 ,015 ,012 17 ,014 ,014 ,018 ,010 ,014 18 ,020 ,021 ,020 ,017 ,019 19 ,015 ,016 ,019 ,013 ,016 20 ,015 ,015 ,011 ,017 ,014 21 ,012 ,013 ,014 ,008 ,012 22 ,018 ,018 ,014 ,013 ,016 23 ,012 ,011 ,016 ,016 ,014 24 ,012 ,013 ,009 ,018 ,013 25 ,015 ,016 ,020 ,015 ,016 26 ,020 ,019 ,019 ,018 ,019 27 ,013 ,014 ,011 ,012 ,013 28 ,011 ,011 ,009 ,014 ,011 29 ,015 ,015 ,023 ,015 ,017 30 ,020 ,021 ,020 ,018 ,020 31 ,012 ,013 ,017 ,018 ,015 32 ,012 ,013 ,009 ,023 ,014 33 ,011 ,012 ,014 ,010 ,012 34 ,016 ,016 ,017 ,013 ,015 35 ,007 ,007 ,009 ,008 ,008 36 ,011 ,013 ,009 ,008 ,010 37 ,014 ,013 ,018 ,013 ,014 38 ,021 ,020 ,019 ,020 ,020 39 ,015 ,014 ,011 ,017 ,014 40 ,010 ,007 ,009 ,015 ,010 41 ,015 ,014 ,019 ,008 ,014 42 ,020 ,020 ,020 ,018 ,019 43 ,015 ,012 ,016 ,017 ,015 44 ,014 ,013 ,013 ,017 ,014 45 ,007 ,008 ,014 ,008 ,009 46 ,013 ,013 ,014 ,013 ,013 47 ,009 ,008 ,012 ,010 ,010 48 ,007 ,007 ,009 ,012 ,009 49 ,015 ,014 ,018 ,010 ,014 50 ,020 ,020 ,017 ,016 ,018 51 ,011 ,009 ,009 ,012 ,010 52 ,010 ,010 ,009 ,016 ,011 53 ,014 ,015 ,015 ,010 ,014 54 ,019 ,019 ,016 ,018 ,018 55 ,013 ,011 ,009 ,011 ,011 56 ,009 ,009 ,009 ,011 ,010 57 ,011 ,012 ,010 ,009 ,011
58 ,015 ,015 ,014 ,016 ,015 59 ,008 ,012 ,012 ,013 ,011 60 ,012 ,011 ,012 ,016 ,013 61 ,014 ,015 ,023 ,010 ,015 62 ,020 ,021 ,017 ,019 ,020 63 ,012 ,013 ,009 ,013 ,012 64 ,009 ,010 ,009 ,014 ,011 65 ,015 ,015 ,018 ,011 ,015 66 ,020 ,019 ,017 ,018 ,019 67 ,012 ,011 ,010 ,015 ,012 68 ,011 ,010 ,009 ,016 ,012 69 ,010 ,010 ,012 ,008 ,010 70 ,015 ,015 ,014 ,015 ,015 71 ,007 ,009 ,010 ,014 ,010 72 ,011 ,011 ,011 ,018 ,013 -------- -------- -------- --------
Margin 1,000 1,000 1,000 1,000
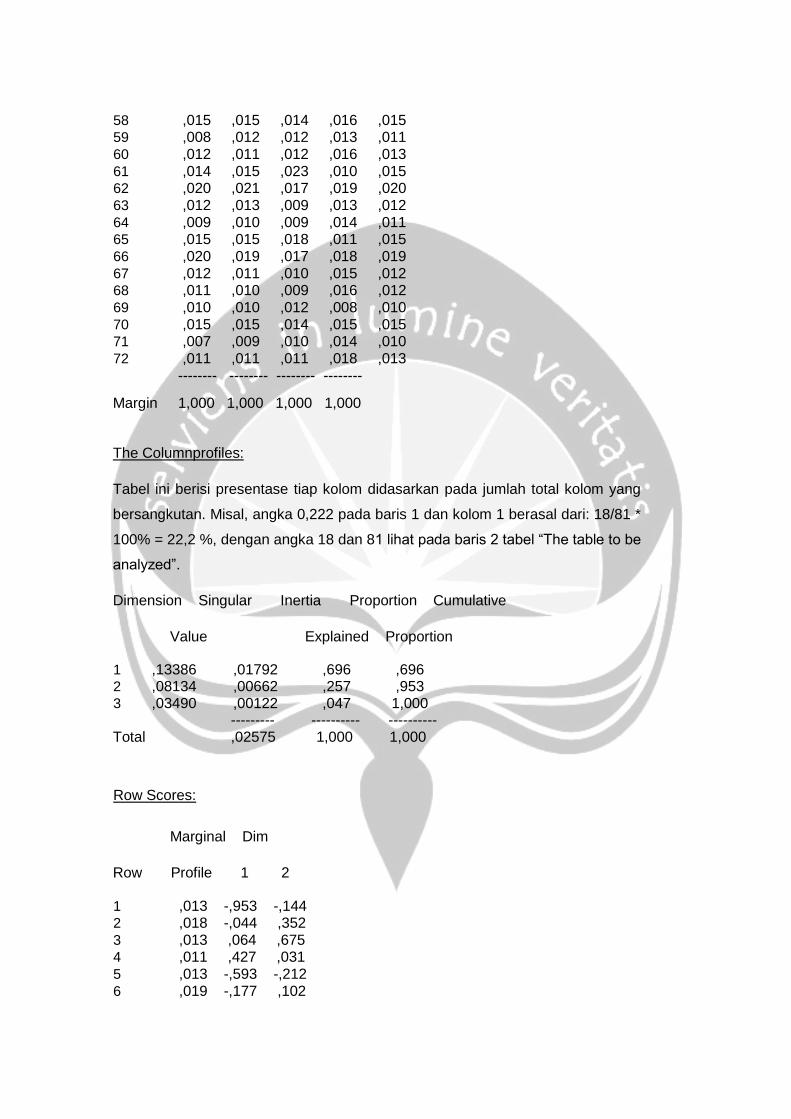
The Columnprofiles:
Tabel ini berisi presentase tiap kolom didasarkan pada jumlah total kolom yang
bersangkutan. Misal, angka 0,222 pada baris 1 dan kolom 1 berasal dari: 18/81 *
100% = 22,2 %, dengan angka 18 dan 81 lihat pada baris 2 tabel “The table to be
analyzed”.
Dimension Singular Inertia Proportion Cumulative
Value Explained Proportion
1 ,13386 ,01792 ,696 ,696 2 ,08134 ,00662 ,257 ,953 3 ,03490 ,00122 ,047 1,000 --------- ---------- ---------- Total ,02575 1,000 1,000
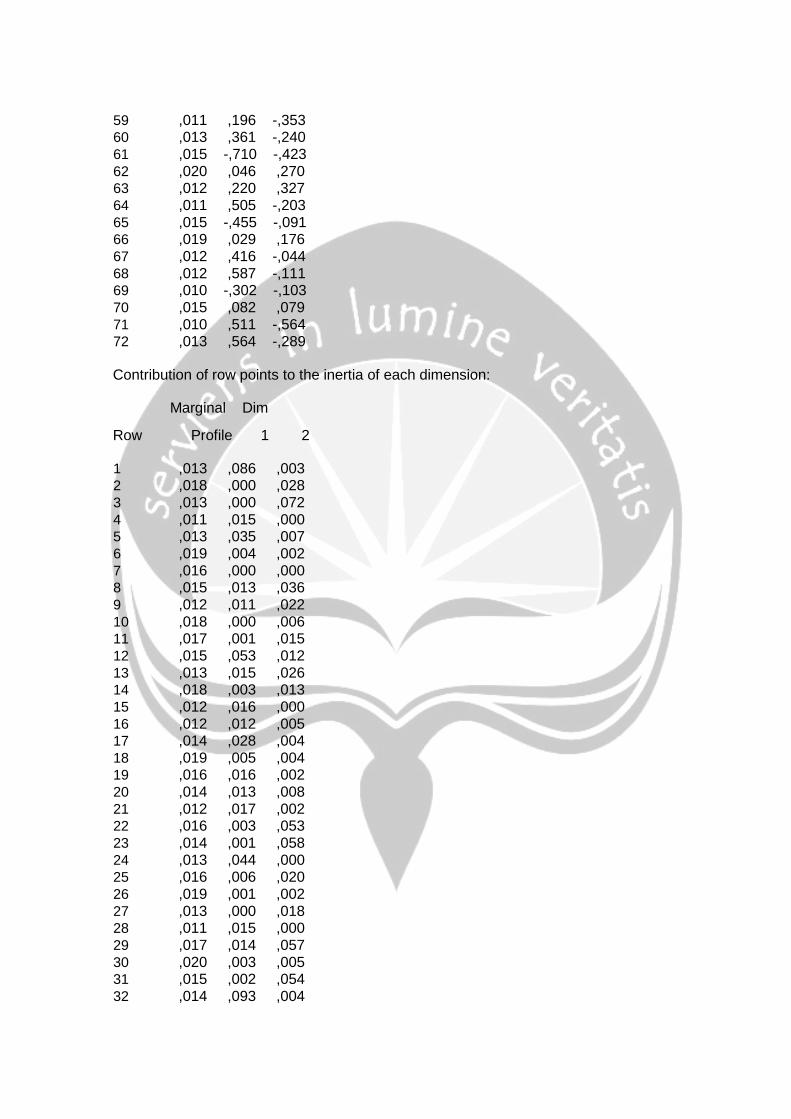
Row Scores:
Marginal Dim
Row Profile 1 2
1 ,013 -,953 -,144 2 ,018 -,044 ,352 3 ,013 ,064 ,675 4 ,011 ,427 ,031 5 ,013 -,593 -,212 6 ,019 -,177 ,102

7 ,016 -,065 -,039 8 ,015 ,346 ,443 9 ,012 -,350 ,393 10 ,018 -,056 ,169 11 ,017 ,067 -,271 12 ,015 ,684 ,254 13 ,013 -,389 ,395 14 ,018 -,156 ,238 15 ,012 ,414 ,001 16 ,012 ,368 -,178 17 ,014 -,521 -,149 18 ,019 -,183 ,134 19 ,016 -,374 -,091 20 ,014 ,347 ,218 21 ,012 -,444 ,117 22 ,016 -,161 ,524 23 ,014 ,087 -,588 24 ,013 ,667 ,029 25 ,016 -,226 -,320 26 ,019 -,089 ,095 27 ,013 -,002 ,339 28 ,011 ,427 ,031 29 ,017 -,333 -,531 30 ,020 -,142 ,138 31 ,015 ,129 -,548 32 ,014 ,939 -,151 33 ,012 -,268 -,128 34 ,015 -,293 ,035 35 ,008 -,023 -,302 36 ,010 -,162 ,494 37 ,014 -,310 -,294 38 ,020 ,032 ,108 39 ,014 ,363 ,176 40 ,010 ,634 -,381 41 ,014 -,703 -,105 42 ,019 -,133 ,106 43 ,015 ,097 -,319 44 ,014 ,285 -,053 45 ,009 -,402 -,735 46 ,013 -,076 ,010 47 ,010 -,078 -,473 48 ,009 ,385 -,502 49 ,014 -,520 -,104 50 ,018 -,128 ,326 51 ,010 ,257 -,006 52 ,011 ,629 -,227 53 ,014 -,399 ,113 54 ,018 ,071 ,200 55 ,011 ,090 ,375 56 ,010 ,200 -,083 57 ,011 -,124 ,283 58 ,015 ,133 ,084
59 ,011 ,196 -,353 60 ,013 ,361 -,240 61 ,015 -,710 -,423 62 ,020 ,046 ,270 63 ,012 ,220 ,327 64 ,011 ,505 -,203 65 ,015 -,455 -,091 66 ,019 ,029 ,176 67 ,012 ,416 -,044 68 ,012 ,587 -,111 69 ,010 -,302 -,103 70 ,015 ,082 ,079 71 ,010 ,511 -,564 72 ,013 ,564 -,289
Contribution of row points to the inertia of each dimension:
Marginal Dim
Row Profile 1 2
1 ,013 ,086 ,003 2 ,018 ,000 ,028 3 ,013 ,000 ,072 4 ,011 ,015 ,000 5 ,013 ,035 ,007 6 ,019 ,004 ,002 7 ,016 ,000 ,000 8 ,015 ,013 ,036 9 ,012 ,011 ,022 10 ,018 ,000 ,006 11 ,017 ,001 ,015 12 ,015 ,053 ,012 13 ,013 ,015 ,026 14 ,018 ,003 ,013 15 ,012 ,016 ,000 16 ,012 ,012 ,005 17 ,014 ,028 ,004 18 ,019 ,005 ,004 19 ,016 ,016 ,002 20 ,014 ,013 ,008 21 ,012 ,017 ,002 22 ,016 ,003 ,053 23 ,014 ,001 ,058 24 ,013 ,044 ,000 25 ,016 ,006 ,020 26 ,019 ,001 ,002 27 ,013 ,000 ,018 28 ,011 ,015 ,000 29 ,017 ,014 ,057 30 ,020 ,003 ,005 31 ,015 ,002 ,054 32 ,014 ,093 ,004

33 ,012 ,006 ,002 34 ,015 ,010 ,000 35 ,008 ,000 ,009 36 ,010 ,002 ,031 37 ,014 ,010 ,015 38 ,020 ,000 ,003 39 ,014 ,014 ,005 40 ,010 ,031 ,018 41 ,014 ,051 ,002 42 ,019 ,003 ,003 43 ,015 ,001 ,019 44 ,014 ,009 ,000 45 ,009 ,011 ,061 46 ,013 ,001 ,000 47 ,010 ,000 ,026 48 ,009 ,010 ,027 49 ,014 ,029 ,002 50 ,018 ,002 ,024 51 ,010 ,005 ,000 52 ,011 ,033 ,007 53 ,014 ,016 ,002 54 ,018 ,001 ,009 55 ,011 ,001 ,019 56 ,010 ,003 ,001 57 ,011 ,001 ,010 58 ,015 ,002 ,001 59 ,011 ,003 ,017 60 ,013 ,012 ,009 61 ,015 ,057 ,033 62 ,020 ,000 ,018 63 ,012 ,004 ,015 64 ,011 ,020 ,005 65 ,015 ,022 ,001 66 ,019 ,000 ,007 67 ,012 ,015 ,000 68 ,012 ,030 ,002 69 ,010 ,007 ,001 70 ,015 ,001 ,001 71 ,010 ,019 ,039 72 ,013 ,030 ,013 -------- --------
1,000 1,000
Contribution of dimensions to the inertia of each row point:
Marginal Dim Total
Row Profile 1 2
1 ,013 ,986 ,014 1,000 2 ,018 ,024 ,966 ,990
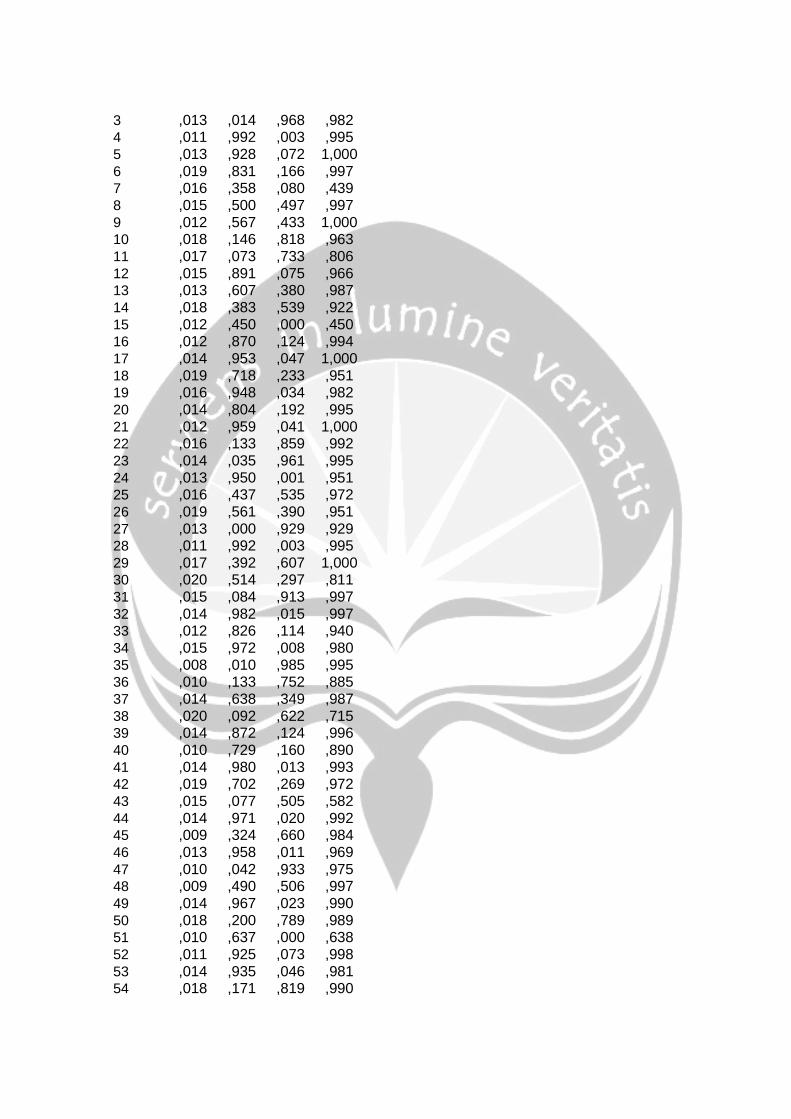
3 ,013 ,014 ,968 ,982 4 ,011 ,992 ,003 ,995 5 ,013 ,928 ,072 1,000 6 ,019 ,831 ,166 ,997 7 ,016 ,358 ,080 ,439 8 ,015 ,500 ,497 ,997 9 ,012 ,567 ,433 1,000 10 ,018 ,146 ,818 ,963 11 ,017 ,073 ,733 ,806 12 ,015 ,891 ,075 ,966 13 ,013 ,607 ,380 ,987 14 ,018 ,383 ,539 ,922 15 ,012 ,450 ,000 ,450 16 ,012 ,870 ,124 ,994 17 ,014 ,953 ,047 1,000 18 ,019 ,718 ,233 ,951 19 ,016 ,948 ,034 ,982 20 ,014 ,804 ,192 ,995 21 ,012 ,959 ,041 1,000 22 ,016 ,133 ,859 ,992 23 ,014 ,035 ,961 ,995 24 ,013 ,950 ,001 ,951 25 ,016 ,437 ,535 ,972 26 ,019 ,561 ,390 ,951 27 ,013 ,000 ,929 ,929 28 ,011 ,992 ,003 ,995 29 ,017 ,392 ,607 1,000 30 ,020 ,514 ,297 ,811 31 ,015 ,084 ,913 ,997 32 ,014 ,982 ,015 ,997 33 ,012 ,826 ,114 ,940 34 ,015 ,972 ,008 ,980 35 ,008 ,010 ,985 ,995 36 ,010 ,133 ,752 ,885 37 ,014 ,638 ,349 ,987 38 ,020 ,092 ,622 ,715 39 ,014 ,872 ,124 ,996 40 ,010 ,729 ,160 ,890 41 ,014 ,980 ,013 ,993 42 ,019 ,702 ,269 ,972 43 ,015 ,077 ,505 ,582 44 ,014 ,971 ,020 ,992 45 ,009 ,324 ,660 ,984 46 ,013 ,958 ,011 ,969 47 ,010 ,042 ,933 ,975 48 ,009 ,490 ,506 ,997 49 ,014 ,967 ,023 ,990 50 ,018 ,200 ,789 ,989 51 ,010 ,637 ,000 ,638 52 ,011 ,925 ,073 ,998 53 ,014 ,935 ,046 ,981 54 ,018 ,171 ,819 ,990
55 ,011 ,064 ,674 ,738 56 ,010 ,849 ,089 ,938 57 ,011 ,219 ,690 ,908 58 ,015 ,775 ,188 ,962 59 ,011 ,159 ,314 ,472 60 ,013 ,784 ,211 ,995 61 ,015 ,820 ,177 ,997 62 ,020 ,043 ,899 ,941 63 ,012 ,425 ,571 ,996 64 ,011 ,906 ,089 ,996 65 ,015 ,976 ,024 1,000 66 ,019 ,042 ,931 ,973 67 ,012 ,988 ,007 ,994 68 ,012 ,977 ,021 ,998 69 ,010 ,893 ,063 ,955 70 ,015 ,622 ,346 ,968 71 ,010 ,534 ,395 ,930 72 ,013 ,859 ,137 ,996
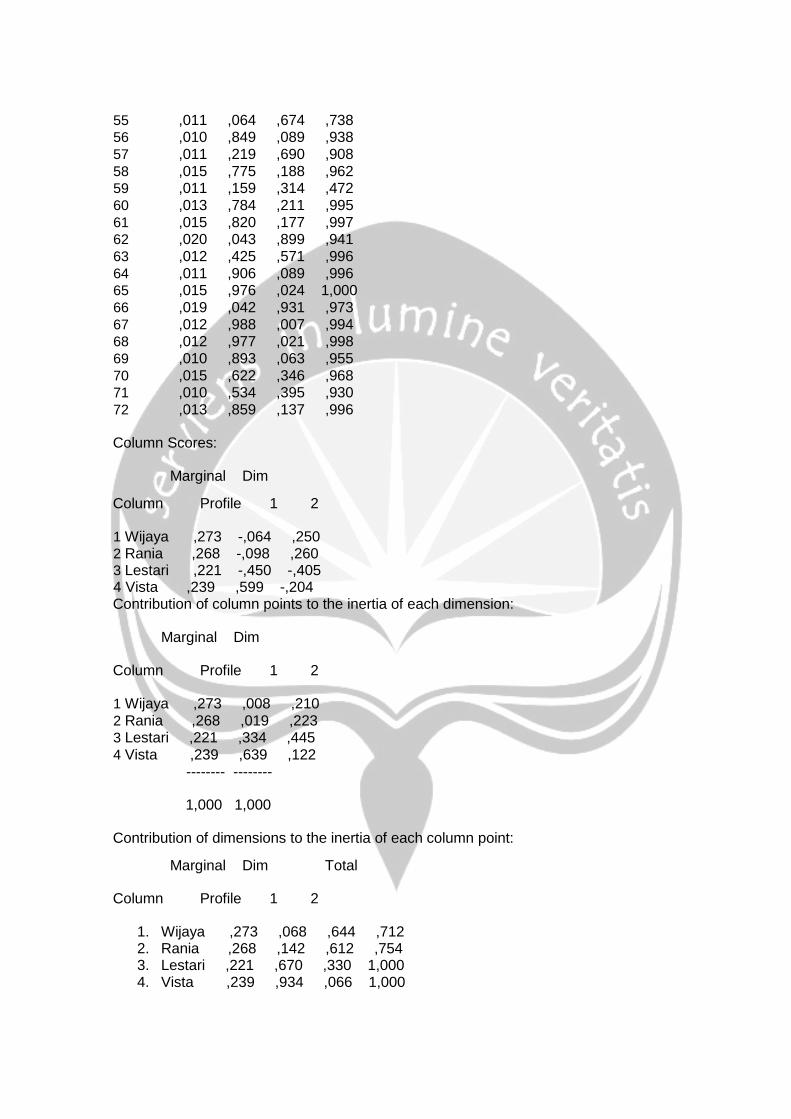
Column Scores:
Marginal Dim
Column Profile 1 2
1 Wijaya ,273 -,064 ,250 2 Rania ,268 -,098 ,260 3 Lestari ,221 -,450 -,405 4 Vista ,239 ,599 -,204 Contribution of column points to the inertia of each dimension:
Marginal Dim
Column Profile 1 2
1 Wijaya ,273 ,008 ,210 2 Rania ,268 ,019 ,223 3 Lestari ,221 ,334 ,445 4 Vista ,239 ,639 ,122 -------- --------
1,000 1,000
Contribution of dimensions to the inertia of each column point:
Marginal Dim Total
Column Profile 1 2
1. Wijaya ,273 ,068 ,644 ,712 2. Rania ,268 ,142 ,612 ,754 3. Lestari ,221 ,670 ,330 1,000 4. Vista ,239 ,934 ,066 1,000

Variances and Correlation Matrix of the singular values:
Dim Variances Correlations between dimensions
1 1,94E-004 1,000
2 1,97E-004 ,038 1,000
Variances and Correlation Matrix of scores of Row 1
Dim Variances Correlations between dimensions
1 ,004 1,000
2 ,022 -,567 1,000
Variances and Correlation Matrix of scores of Row 2
Dim Variances Correlations between dimensions
1 ,008 1,000
2 ,001 ,197 1,000
Variances and Correlation Matrix of scores of Row 3
Dim Variances Correlations between dimensions
1 ,030 1,000
2 ,006 -,129 1,000
Variances and Correlation Matrix of scores of Row 4
Dim Variances Correlations between dimensions
1 7,70E-004 1,000
2 ,005 -,256 1,000
Variances and Correlation Matrix of scores of Row 5
Dim Variances Correlations between dimensions
1 ,004 1,000
2 ,009 -,840 1,000
Variances and Correlation Matrix of scores of Row 6
Dim Variances Correlations between dimensions
1 8,18E-004 1,000
2 8,84E-004 ,834 1,000
Variances and Correlation Matrix of scores of Row 7
Dim Variances Correlations between dimensions
1 ,002 1,000
2 ,003 -,095 1,000
Variances and Correlation Matrix of scores of Row 8
Dim Variances Correlations between dimensions

1 ,013 1,000
2 ,005 -,766 1,000
Variances and Correlation Matrix of scores of Row 9
Dim Variances Correlations between dimensions
1 ,010 1,000
2 ,004 ,827 1,000
Variances and Correlation Matrix of scores of Row 10
Dim Variances Correlations between dimensions
1 ,002 1,000
2 6,73E-004 ,319 1,000
Variances and Correlation Matrix of scores of Row 11
Dim Variances Correlations between dimensions
1 ,007 1,000
2 ,006 ,090 1,000
Variances and Correlation Matrix of scores of Row 12
Dim Variances Correlations between dimensions
1 ,009 1,000
2 ,020 -,517 1,000
Variances and Correlation Matrix of scores of Row 13
Dim Variances Correlations between dimensions
1 ,011 1,000
2 ,006 ,710 1,000
Variances and Correlation Matrix of scores of Row 14
Dim Variances Correlations between dimensions
1 ,005 1,000
2 ,003 ,355 1,000
Variances and Correlation Matrix of scores of Row 15
Dim Variances Correlations between dimensions
1 ,045 1,000
2 ,100 -,054 1,000
Variances and Correlation Matrix of scores of Row 16
Dim Variances Correlations between dimensions
1 ,003 1,000
2 ,004 ,799 1,000
Variances and Correlation Matrix of scores of Row 17
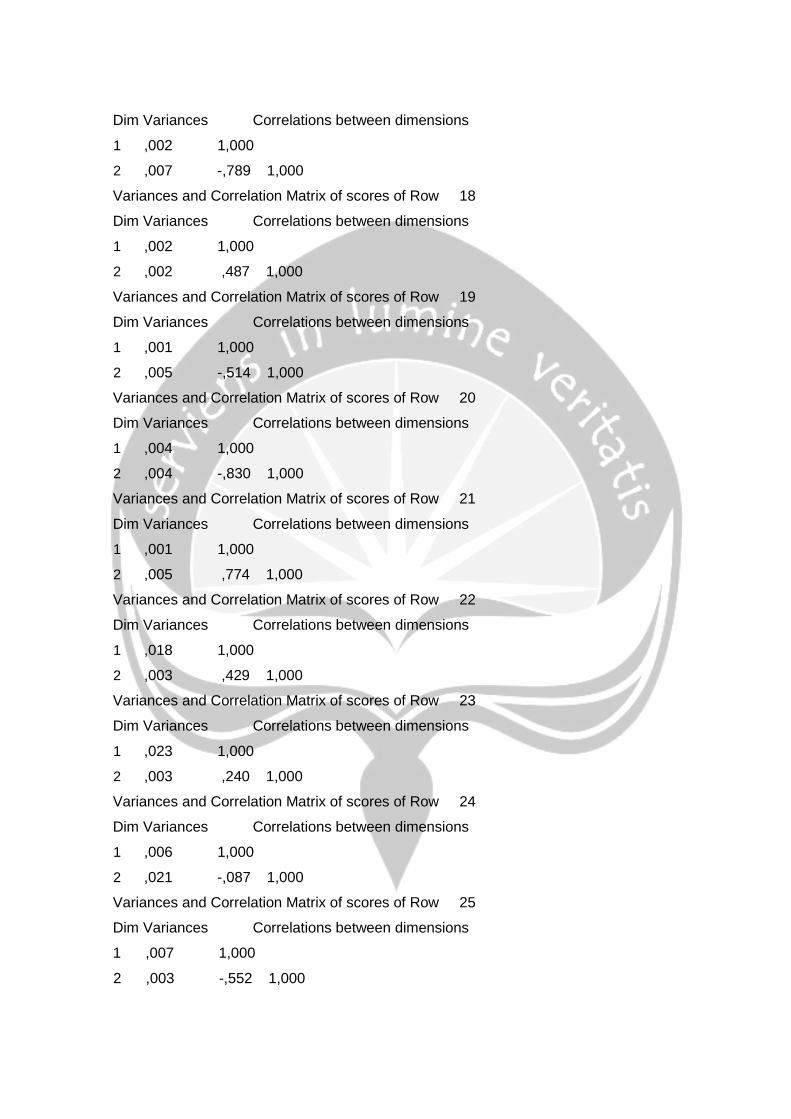
Dim Variances Correlations between dimensions
1 ,002 1,000
2 ,007 -,789 1,000
Variances and Correlation Matrix of scores of Row 18
Dim Variances Correlations between dimensions
1 ,002 1,000
2 ,002 ,487 1,000
Variances and Correlation Matrix of scores of Row 19
Dim Variances Correlations between dimensions
1 ,001 1,000
2 ,005 -,514 1,000
Variances and Correlation Matrix of scores of Row 20
Dim Variances Correlations between dimensions
1 ,004 1,000
2 ,004 -,830 1,000
Variances and Correlation Matrix of scores of Row 21
Dim Variances Correlations between dimensions
1 ,001 1,000
2 ,005 ,774 1,000
Variances and Correlation Matrix of scores of Row 22
Dim Variances Correlations between dimensions
1 ,018 1,000
2 ,003 ,429 1,000
Variances and Correlation Matrix of scores of Row 23
Dim Variances Correlations between dimensions
1 ,023 1,000
2 ,003 ,240 1,000
Variances and Correlation Matrix of scores of Row 24
Dim Variances Correlations between dimensions
1 ,006 1,000
2 ,021 -,087 1,000
Variances and Correlation Matrix of scores of Row 25
Dim Variances Correlations between dimensions
1 ,007 1,000
2 ,003 -,552 1,000
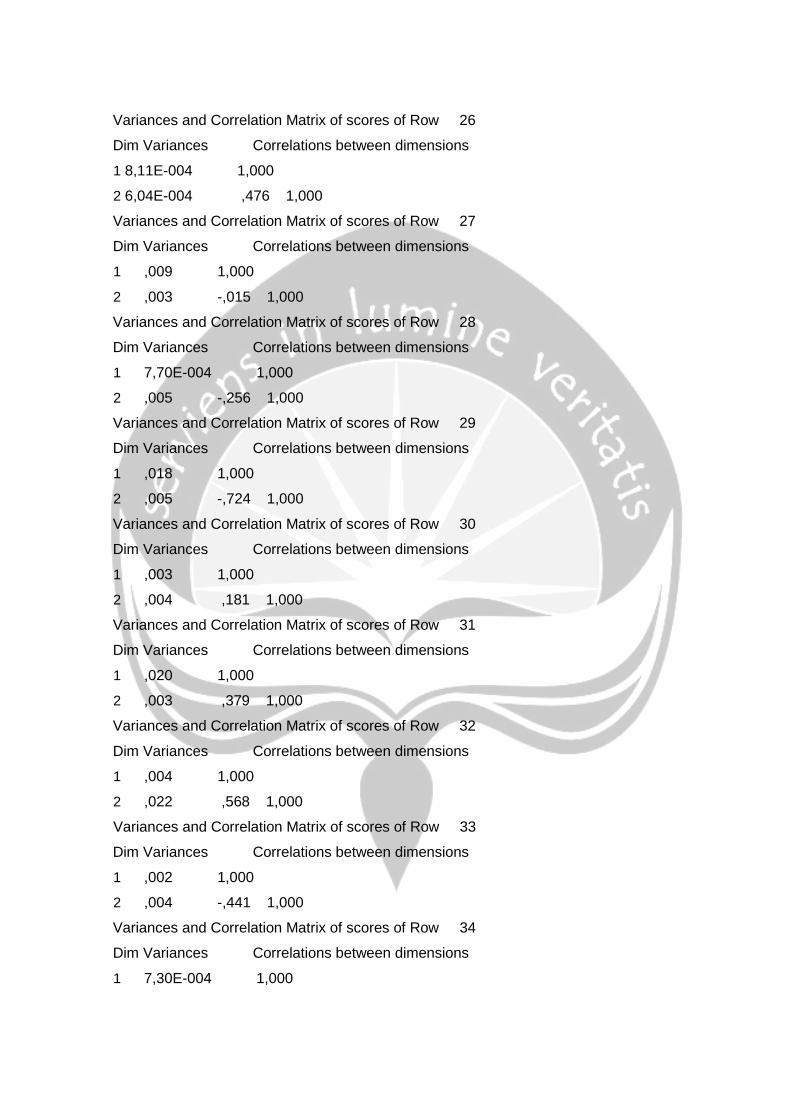
Variances and Correlation Matrix of scores of Row 26
Dim Variances Correlations between dimensions
1 8,11E-004 1,000
2 6,04E-004 ,476 1,000
Variances and Correlation Matrix of scores of Row 27
Dim Variances Correlations between dimensions
1 ,009 1,000
2 ,003 -,015 1,000
Variances and Correlation Matrix of scores of Row 28
Dim Variances Correlations between dimensions
1 7,70E-004 1,000
2 ,005 -,256 1,000
Variances and Correlation Matrix of scores of Row 29
Dim Variances Correlations between dimensions
1 ,018 1,000
2 ,005 -,724 1,000
Variances and Correlation Matrix of scores of Row 30
Dim Variances Correlations between dimensions
1 ,003 1,000
2 ,004 ,181 1,000
Variances and Correlation Matrix of scores of Row 31
Dim Variances Correlations between dimensions
1 ,020 1,000
2 ,003 ,379 1,000
Variances and Correlation Matrix of scores of Row 32
Dim Variances Correlations between dimensions
1 ,004 1,000
2 ,022 ,568 1,000
Variances and Correlation Matrix of scores of Row 33
Dim Variances Correlations between dimensions
1 ,002 1,000
2 ,004 -,441 1,000
Variances and Correlation Matrix of scores of Row 34
Dim Variances Correlations between dimensions
1 7,30E-004 1,000
2 ,003 ,275 1,000
Variances and Correlation Matrix of scores of Row 35
Dim Variances Correlations between dimensions
1 ,006 1,000
2 8,47E-004 -,104 1,000
Variances and Correlation Matrix of scores of Row 36
Dim Variances Correlations between dimensions
1 ,021 1,000
2 ,013 ,162 1,000
Variances and Correlation Matrix of scores of Row 37
Dim Variances Correlations between dimensions
1 ,006 1,000
2 ,004 -,732 1,000
Variances and Correlation Matrix of scores of Row 38
Dim Variances Correlations between dimensions
1 ,002 1,000
2 ,002 -,110 1,000
Variances and Correlation Matrix of scores of Row 39
Dim Variances Correlations between dimensions
1 ,003 1,000
2 ,004 -,815 1,000
Variances and Correlation Matrix of scores of Row 40
Dim Variances Correlations between dimensions
1 ,023 1,000
2 ,038 ,273 1,000
Variances and Correlation Matrix of scores of Row 41
Dim Variances Correlations between dimensions
1 ,003 1,000
2 ,014 -,459 1,000
Variances and Correlation Matrix of scores of Row 42
Dim Variances Correlations between dimensions
1 9,81E-004 1,000
2 8,64E-004 ,602 1,000
Variances and Correlation Matrix of scores of Row 43
Dim Variances Correlations between dimensions
1 ,017 1,000
2 ,024 ,010 1,000
Variances and Correlation Matrix of scores of Row 44
Dim Variances Correlations between dimensions
1 5,80E-004 1,000
2 ,002 ,506 1,000
Variances and Correlation Matrix of scores of Row 45
Dim Variances Correlations between dimensions
1 ,037 1,000
2 ,011 -,551 1,000
Variances and Correlation Matrix of scores of Row 46
Dim Variances Correlations between dimensions
1 8,91E-005 1,000
2 2,36E-004 ,195 1,000
Variances and Correlation Matrix of scores of Row 47
Dim Variances Correlations between dimensions
1 ,015 1,000
2 ,004 -,203 1,000
Variances and Correlation Matrix of scores of Row 48
Dim Variances Correlations between dimensions
1 ,017 1,000
2 ,006 ,756 1,000
Variances and Correlation Matrix of scores of Row 49
Dim Variances Correlations between dimensions
1 ,002 1,000
2 ,008 -,526 1,000
Variances and Correlation Matrix of scores of Row 50
Dim Variances Correlations between dimensions
1 ,007 1,000
2 ,002 ,487 1,000
Variances and Correlation Matrix of scores of Row 51
Dim Variances Correlations between dimensions
1 ,008 1,000
2 ,019 -,048 1,000
Variances and Correlation Matrix of scores of Row 52
Dim Variances Correlations between dimensions
1 ,005 1,000
2 ,010 ,815 1,000
Variances and Correlation Matrix of scores of Row 53
Dim Variances Correlations between dimensions
1 ,002 1,000
2 ,005 ,524 1,000
Variances and Correlation Matrix of scores of Row 54
Dim Variances Correlations between dimensions
1 ,003 1,000
2 5,66E-004 -,448 1,000
Variances and Correlation Matrix of scores of Row 55
Dim Variances Correlations between dimensions
1 ,017 1,000
2 ,016 -,101 1,000
Variances and Correlation Matrix of scores of Row 56
Dim Variances Correlations between dimensions
1 ,001 1,000
2 ,002 ,349 1,000
Variances and Correlation Matrix of scores of Row 57
Dim Variances Correlations between dimensions
1 ,007 1,000
2 ,004 ,242 1,000
Variances and Correlation Matrix of scores of Row 58
Dim Variances Correlations between dimensions
1 7,31E-004 1,000
2 8,74E-004 -,553 1,000
Variances and Correlation Matrix of scores of Row 59
Dim Variances Correlations between dimensions
1 ,036 1,000
2 ,060 ,020 1,000
Variances and Correlation Matrix of scores of Row 60
Dim Variances Correlations between dimensions
1 ,004 1,000
2 ,004 ,819 1,000
Variances and Correlation Matrix of scores of Row 61
Dim Variances Correlations between dimensions
1 ,013 1,000
2 ,014 -,847 1,000
Variances and Correlation Matrix of scores of Row 62
Dim Variances Correlations between dimensions
1 ,005 1,000
2 ,002 -,168 1,000
Variances and Correlation Matrix of scores of Row 63
Dim Variances Correlations between dimensions
1 ,007 1,000
2 ,002 -,709 1,000
Variances and Correlation Matrix of scores of Row 64
Dim Variances Correlations between dimensions
1 ,004 1,000
2 ,007 ,796 1,000
Variances and Correlation Matrix of scores of Row 65
Dim Variances Correlations between dimensions
1 ,001 1,000
2 ,005 -,674 1,000
Variances and Correlation Matrix of scores of Row 66
Dim Variances Correlations between dimensions
1 ,002 1,000
2 5,16E-004 -,176 1,000
Variances and Correlation Matrix of scores of Row 67
Dim Variances Correlations between dimensions
1 8,43E-004 1,000
2 ,005 ,362 1,000
Variances and Correlation Matrix of scores of Row 68
Dim Variances Correlations between dimensions
1 ,002 1,000
2 ,009 ,626 1,000
Variances and Correlation Matrix of scores of Row 69
Dim Variances Correlations between dimensions
1 ,002 1,000
2 ,004 -,438 1,000
Variances and Correlation Matrix of scores of Row 70
Dim Variances Correlations between dimensions
1 5,13E-004 1,000
2 3,76E-004 -,583 1,000
Variances and Correlation Matrix of scores of Row 71
Dim Variances Correlations between dimensions
1 ,029 1,000
2 ,025 ,413 1,000
Variances and Correlation Matrix of scores of Row 72
Dim Variances Correlations between dimensions
1 ,007 1,000
2 ,009 ,833 1,000
Variances and Correlation Matrix of scores of Column 1 Wijaya
Dim Variances Correlations between dimensions
1 ,007 1,000
2 ,008 ,089 1,000
Variances and Correlation Matrix of scores of Column 2 Rania
Dim Variances Correlations between dimensions
1 ,008 1,000
2 ,008 ,133 1,000
Variances and Correlation Matrix of scores of Column 3 Lestari
Dim Variances Correlations between dimensions
1 ,011 1,000
2 ,006 -,863 1,000
Variances and Correlation Matrix of scores of Column 4 Vista
Dim Variances Correlations between dimensions
1 ,004 1,000
2 ,009 ,831 1,000
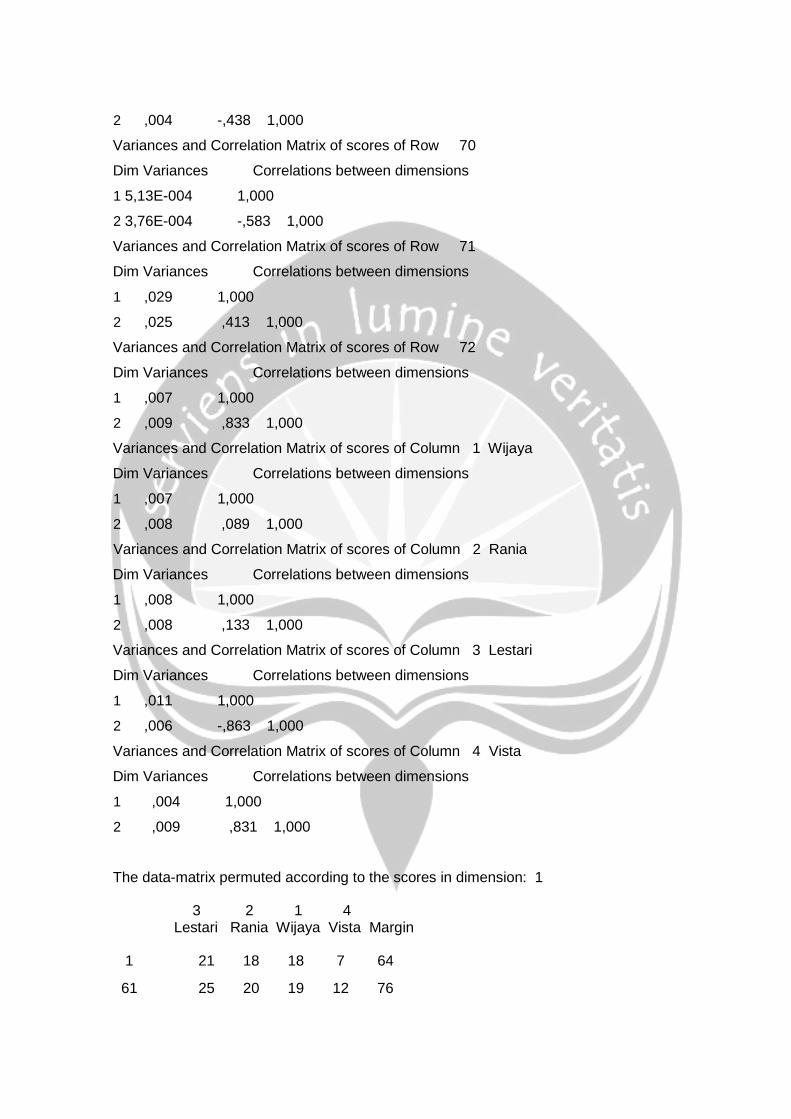
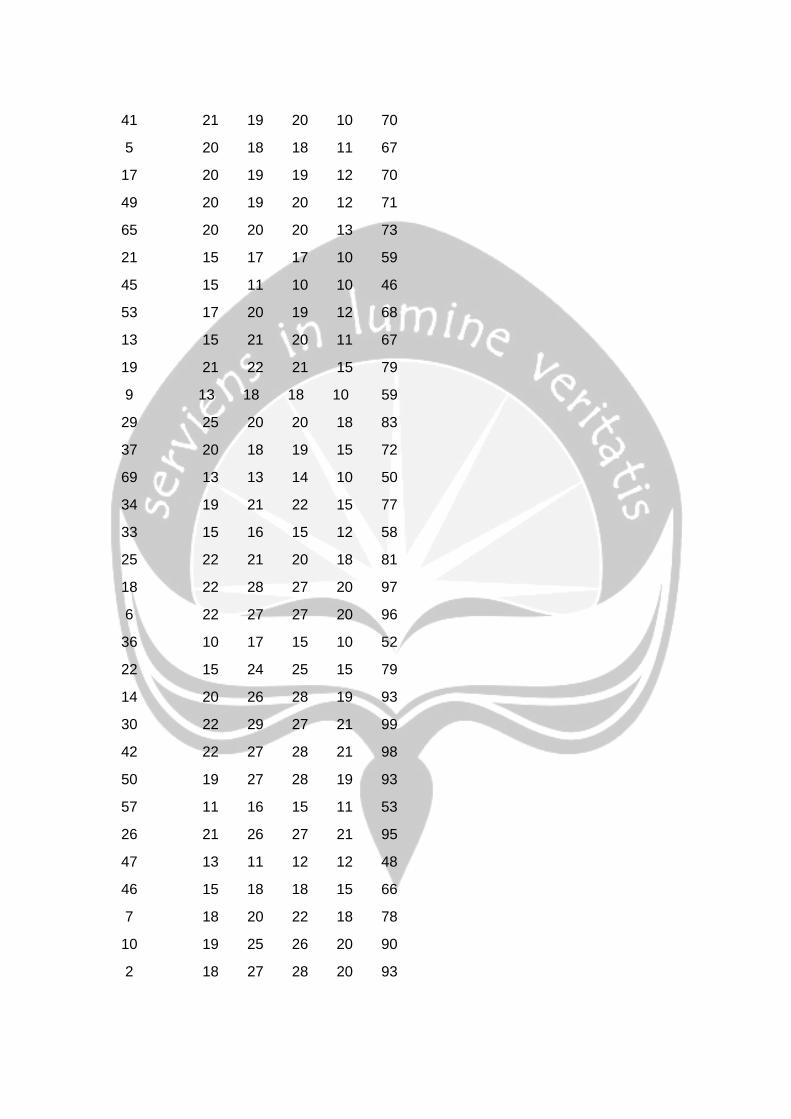
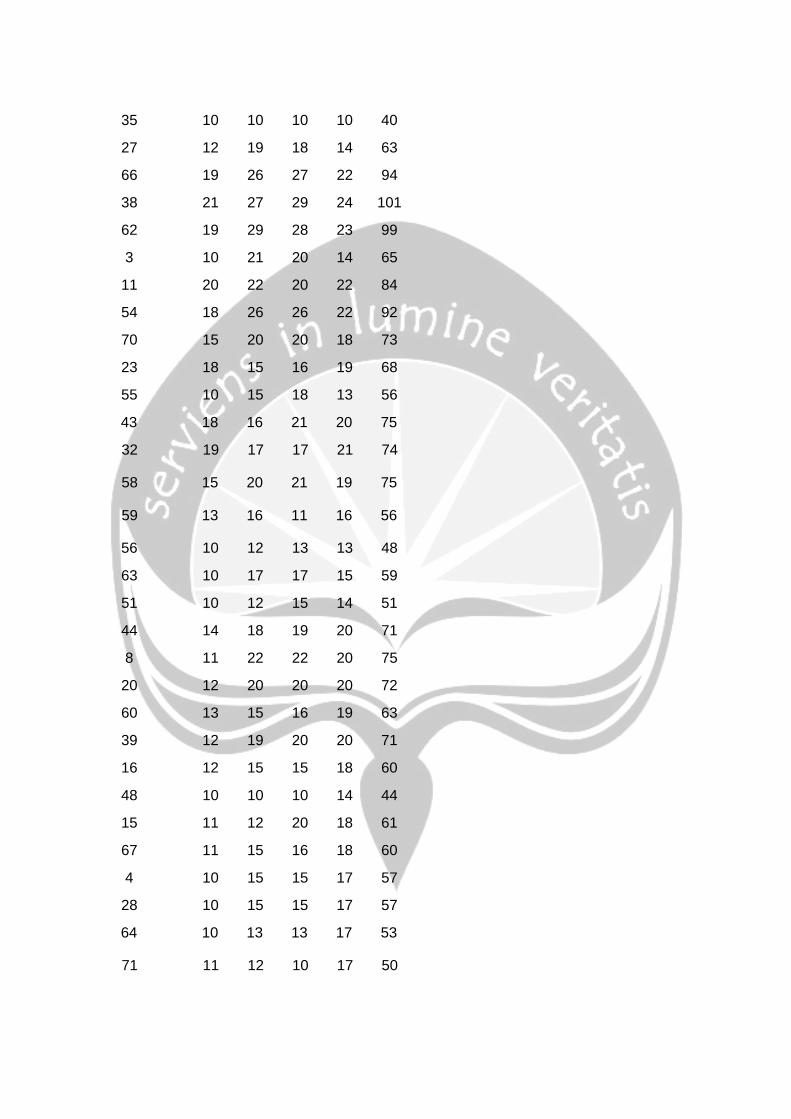
The data-matrix permuted according to the scores in dimension: 1
3 2 1 4 Lestari Rania Wijaya Vista Margin
1 21 18 18 7 64
61 25 20 19 12 76
41 21 19 20 10 70
5 20 18 18 11 67
17 20 19 19 12 70
49 20 19 20 12 71
65 20 20 20 13 73
21 15 17 17 10 59
45 15 11 10 10 46
53 17 20 19 12 68
13 15 21 20 11 67
19 21 22 21 15 79
9 13 18 18 10 59
29 25 20 20 18 83
37 20 18 19 15 72
69 13 13 14 10 50
34 19 21 22 15 77
33 15 16 15 12 58
25 22 21 20 18 81
18 22 28 27 20 97
6 22 27 27 20 96
36 10 17 15 10 52
22 15 24 25 15 79
14 20 26 28 19 93
30 22 29 27 21 99
42 22 27 28 21 98
50 19 27 28 19 93
57 11 16 15 11 53
26 21 26 27 21 95
47 13 11 12 12 48
46 15 18 18 15 66
7 18 20 22 18 78
10 19 25 26 20 90
2 18 27 28 20 93
35 10 10 10 10 40
27 12 19 18 14 63
66 19 26 27 22 94
38 21 27 29 24 101
62 19 29 28 23 99
3 10 21 20 14 65
11 20 22 20 22 84
54 18 26 26 22 92
70 15 20 20 18 73
23 18 15 16 19 68
55 10 15 18 13 56
43 18 16 21 20 75
32 19 17 17 21 74
58 15 20 21 19 75
59 13 16 11 16 56
56 10 12 13 13 48
63 10 17 17 15 59
51 10 12 15 14 51
44 14 18 19 20 71
8 11 22 22 20 75
20 12 20 20 20 72
60 13 15 16 19 63
39 12 19 20 20 71
16 12 15 15 18 60
48 10 10 10 14 44
15 11 12 20 18 61
67 11 15 16 18 60
4 10 15 15 17 57
28 10 15 15 17 57
64 10 13 13 17 53
71 11 12 10 17 50
72 12 15 15 21 63
68 10 14 15 19 58
52 10 13 14 19 56
40 10 10 14 18 52
24 10 18 16 22 66
12 10 22 20 25 77
32 10 17 17 27 71
-------- -------- -------- -------- --------
Margin 1110 1349 1371 1200 5030
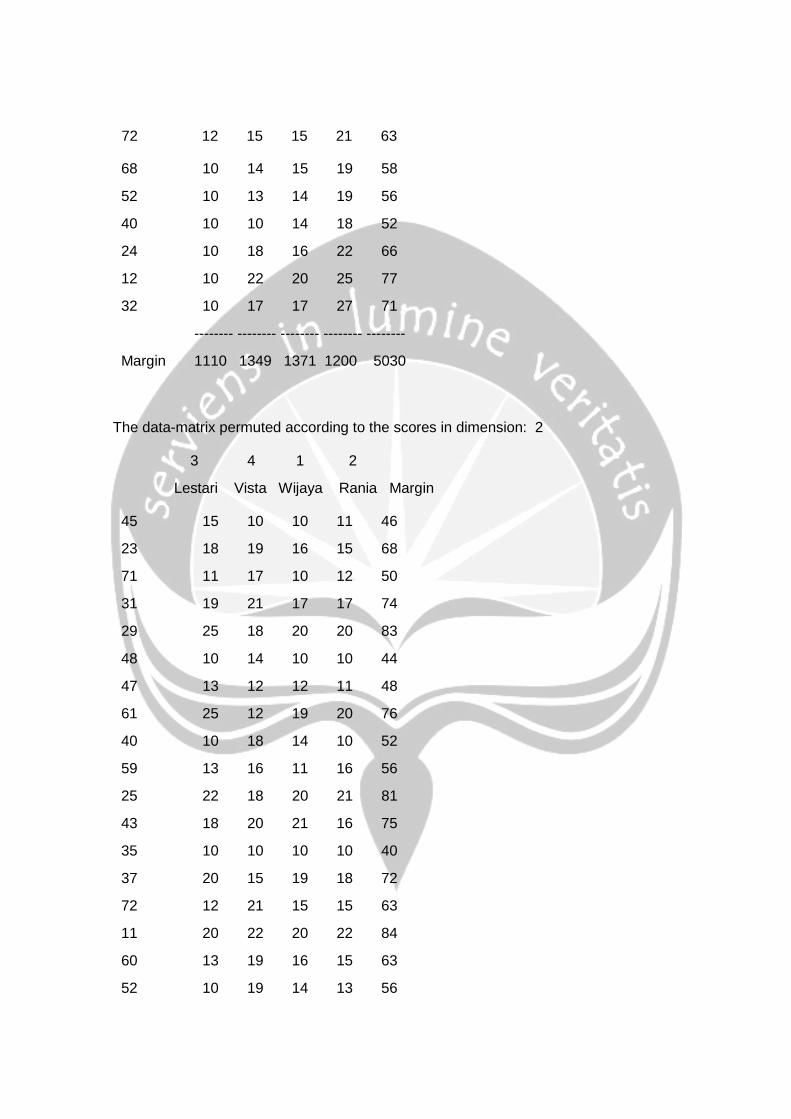
The data-matrix permuted according to the scores in dimension: 2
3 4 1 2
Lestari Vista Wijaya Rania Margin
45 15 10 10 11 46
23 18 19 16 15 68
71 11 17 10 12 50
31 19 21 17 17 74
29 25 18 20 20 83
48 10 14 10 10 44
47 13 12 12 11 48
61 25 12 19 20 76
40 10 18 14 10 52
59 13 16 11 16 56
25 22 18 20 21 81
43 18 20 21 16 75
35 10 10 10 10 40
37 20 15 19 18 72
72 12 21 15 15 63
11 20 22 20 22 84
60 13 19 16 15 63
52 10 19 14 13 56
5 20 11 18 18 67
64 10 17 13 13 53
16 12 18 15 15 60
32 10 27 17 17 71
17 20 12 19 19 70
1 21 7 18 18 64
33 15 12 15 16 58
68 10 19 15 14 58
41 21 10 20 19 70
49 20 12 20 19 71
69 13 10 14 13 50
65 20 13 20 20 73
19 21 15 21 22 79
56 10 13 13 12 48
44 14 20 19 18 71
67 11 18 16 15 60
7 18 18 22 20 78
51 10 14 15 12 51
15 11 18 20 12 61
46 15 15 18 18 66
24 10 22 16 18 66
4 10 17 15 15 57
28 10 17 15 15 57
34 19 15 22 21 77
70 15 18 20 20 73
58 15 19 21 20 75
26 21 21 27 26 95
6 22 20 27 27 96
42 22 21 28 27 98
38 21 24 29 27 101
53 17 12 19 20 68
21 15 10 17 17 59
18 22 20 27 28 97
30 22 21 27 29 99
10 19 20 26 25 90
39 12 20 20 19 71
66 19 22 27 26 94
54 18 22 26 26 92
20 12 20 20 20 72
14 20 19 28 26 93
12 10 25 20 22 77
62 19 23 28 29 99
57 11 11 15 16 53
50 19 19 28 27 93
63 10 15 17 17 59
27 12 14 18 19 63
2 18 20 28 27 93
55 10 13 18 15 56
9 13 10 18 18 59
13 15 11 20 21 67
8 11 20 22 22 75
36 10 10 15 17 52
22 15 15 25 24 79
3 10 14 20 21 65
-------- -------- -------- -------- --------
Margin 1110 1200 1371 1349 5030

Lampiran 2. Hasil dari menganalisis kompetitor dengan cara observasi dan wawancara dengan pemilik secara langsung.
No Bakpia Wijaya Bakpia Rania Bakpia Lestari Bakpia Vista
1
Farian Rasa isi Harga Farian Rasa isi Harga Farian Rasa isi Harga Farian Rasa isi Harga
Kacang Hijau isi 20
Rp16.000 Kacang Hijau isi 20
Rp16.000 Kacang Hijau isi 20
Rp17.000 Kacang Hijau isi 20
Rp30.000
Kumbu Hitam isi 20
Rp16.000 Kumbu Hitam isi 20
Rp16.000 Kumbu Hitam isi 20
Rp20.000 Kumbu Hitam isi 20
Rp30.000
Nangka isi 20
Rp16.000 Nanas isi 20
Rp16.000 Coklat isi 20
Rp20.000 Keju Coklat isi 20
Rp30.000
Coklat isi 20
Rp20.000 Coklat isi 20
Rp16.000 Keju isi 20
Rp25.000 Keju Original isi 20
Rp30.000
Keju isi 20
Rp20.000 Keju isi 20
Rp16.000
Durian isi 20
Rp30.000
Strawberry isi 20
Rp30.000
2
Rasa yang Paling laku Terjual Rasa yang Paling laku Terjual Rasa yang Paling laku Terjual Rasa yang Paling laku Terjual
Kacang Hijau Kacang Hijau Kacang Hijau Kacang Hijau
Kumbu Hitam Keju Kumbu Hitam Keju Coklat
3
Jumlah Karyawan Jumlah Karyawan Jumlah Karyawan Jumlah Karyawan
10 Karyawan 6 Karyawan tetap (perempuan) 6 Karyawan 15 Karyawan
( 9 perempuan & 1 laki-laki ) 4 karyawan tambahan untuk hari libur atau jika ada pesanan
( 3 perempuan & 3 laki-laki ) ( 2 perempuan & 13 laki-laki )
4
Jam Kerja Jam Kerja Jam Kerja Jam Kerja
Jam Kerja Pokok 07.30-15.30 Jam Kerja Pokok 08.00-16.00 Jam Kerja Pokok 07.00-17.00 Jam Kerja Pokok 07.00-16.00
Jika ada pesanan Jika ada pesanan Jika ada pesanan Jika ada pesanan
(Jam kerja 07.00-selesai) (Jam kerja 07.00-selesai) (Jam kerja 07.00-selesai) (Jam kerja 06.00-selesai)
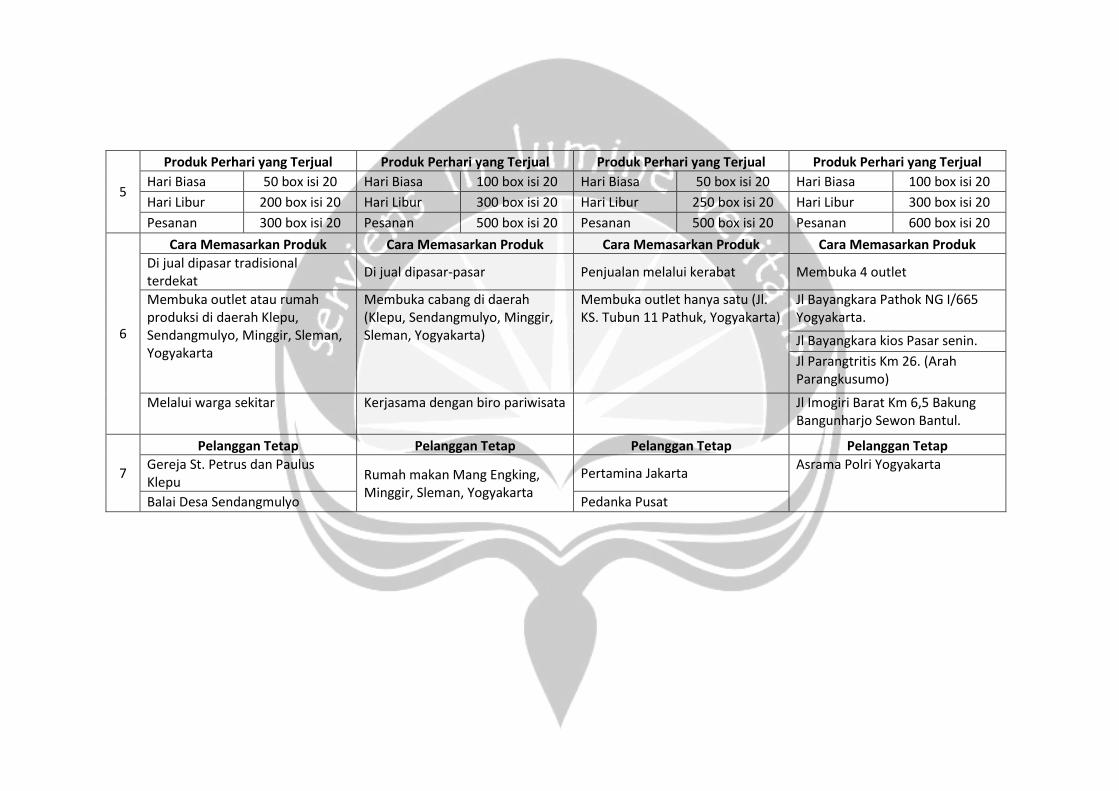
5
Produk Perhari yang Terjual Produk Perhari yang Terjual Produk Perhari yang Terjual Produk Perhari yang Terjual
Hari Biasa 50 box isi 20 Hari Biasa 100 box isi 20 Hari Biasa 50 box isi 20 Hari Biasa 100 box isi 20
Hari Libur 200 box isi 20 Hari Libur 300 box isi 20 Hari Libur 250 box isi 20 Hari Libur 300 box isi 20
Pesanan 300 box isi 20 Pesanan 500 box isi 20 Pesanan 500 box isi 20 Pesanan 600 box isi 20
6
Cara Memasarkan Produk Cara Memasarkan Produk Cara Memasarkan Produk Cara Memasarkan Produk
Di jual dipasar tradisional terdekat
Di jual dipasar-pasar Penjualan melalui kerabat Membuka 4 outlet
Membuka outlet atau rumah produksi di daerah Klepu, Sendangmulyo, Minggir, Sleman, Yogyakarta
Membuka cabang di daerah (Klepu, Sendangmulyo, Minggir, Sleman, Yogyakarta)
Membuka outlet hanya satu (Jl. KS. Tubun 11 Pathuk, Yogyakarta)
Jl Bayangkara Pathok NG I/665 Yogyakarta.
Jl Bayangkara kios Pasar senin.
Jl Parangtritis Km 26. (Arah Parangkusumo)
Melalui warga sekitar Kerjasama dengan biro pariwisata Jl Imogiri Barat Km 6,5 Bakung Bangunharjo Sewon Bantul.
7
Pelanggan Tetap Pelanggan Tetap Pelanggan Tetap Pelanggan Tetap
Gereja St. Petrus dan Paulus Klepu
Rumah makan Mang Engking, Minggir, Sleman, Yogyakarta
Pertamina Jakarta Asrama Polri Yogyakarta
Balai Desa Sendangmulyo Pedanka Pusat