analisa dan pembahasan mananajemen management and ...€¦ · setara dengan 5,4 bulan impor dan...
TRANSCRIPT
420 OCBC NISP Laporan Tahunan 2014
Analisa dan Pembahasan MananajemenManagement and Discussion Analysis
Kinerja Unit Bisnis Tahun Berjalan 457Current Year Business Performance
Informasi Penting Lainnya 464Other Important Information
Prospek Usaha dan Prioritas Strategis 486 Tahun 2015 Business Prospect and StrategicPriorities 2015
Gambaran Umum Makro Ekonomi 422 Indonesia Tahun 2014 The Indonesian Macro Economic Overview In 2014
Kondisi Industri Perbankan Indonesia 425The Indonesian Banking Industry
Tinjauan Kinerja Operasional 430Bank OCBC NISP Review of BANK OCBC NISP’s Operational Performance
- Kinerja Keuangan Bank OCBC NISP 430 Bank OCBC NISP’s Financial Performance
- Posisi Keuangan Bank OCBC NISP 440 Financial Position of Bank OCBC NISP
421OCBC NISP 2014 Annual ReportO
CBC NISP in Brief
From M
anagement
Good Corporate G
overnanceBusiness Review
Financial ReviewCorporate D
ataO
CBC NISP in Brief
From M
anagement
Good Corporate G
overnanceBusiness Review
Financial ReviewCorporate D
ata
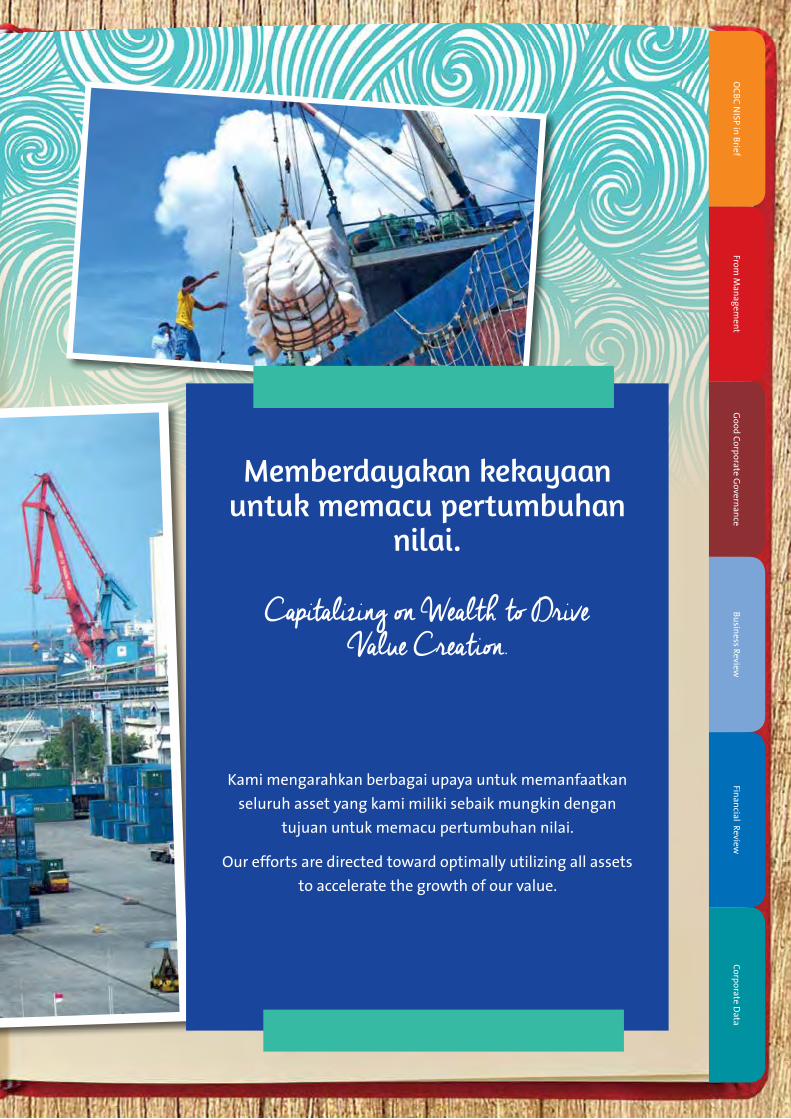
Kami mengarahkan berbagai upaya untuk memanfaatkan seluruh asset yang kami miliki sebaik mungkin dengan
tujuan untuk memacu pertumbuhan nilai.
Our efforts are directed toward optimally utilizing all assets to accelerate the growth of our value.
Memberdayakan kekayaan untuk memacu pertumbuhan
nilai.
Capitalizing on Wealth to Drive Value Creation.

422 OCBC NISP Laporan Tahunan 2014
GAMBARAN UMUM MAKRO EKONOMI INDONESIA TAHUN 2014
Keadaan perekonomian global yang dibayangi ketidakpastian turut mempengaruhi kinerja perekonomian negara-negara berkembang, termasuk Indonesia. Perekonomian Indonesia tahun 2014 tumbuh sebesar 5,0% y-o-y, atau lebih lambat dibandingkan dengan pertumbuhan tahun 2013 sebesar 5,8% y-o-y. Penurunan pertumbuhan ekonomi diakibatkan oleh melambatnya seluruh komponen sumber pertumbuhan yaitu konsumsi rumah tangga, konsumsi pemerintah seiring dengan program penghematan anggaran serta menurunnya kinerja ekspor nasional akibat turunnya permintaan dan harga komoditas global.
Permintaan domestik yang berasal dari konsumsi rumah tangga yang masih menjadi penggerak utama pertumbuhan mengalami pertumbuhan terbatas sekitar 5,1% y-o-y seiring menurunnya daya beli masyarakat akibat tekanan inflasi paska kenaikan harga BBM (Bahan Bakar Minyak) bersubsidi. Disamping itu pelemahan ekonomi nasional juga berdampak pada merosotnya laju investasi dalam negeri yang tercermin dari pertumbuhan investasi fisik (Pembentukan Modal Tetap Bruto) yang hanya mencapai 4,1% yoy pada tahun 2014 dibandingkan tahun 2013 sebesar 4,7% yoy.
Sumber Pertumbuhan PDB MenurutLapangan Usaha 2014 2013 Source of Growth of GDP by Business Categories
Industri Pengolahan 1.0% 1.4% ManufacturingPerdagangan, Hotel, dan Restoran 0.8% 1.1% Trading, Hotel, and RestaurantPengangkutan dan Komunikasi 0.7% 1.0% Transportation and CommunicationKeuangan, Real Estat dan Jasa Perusahaan 0.5% 0.7% Finance, Real Estate, and Business ServicesLainnya 2.0% 1.6% OthersTotal 5.0% 5.8% TotalSumber: Badan Pusat Statistik Source: Statistic Indonesia
Dari sisi eksternal, tekanan kepada Neraca Pembayaran Indonesia (NPI) tahun 2014 menurun, seiring penurunan defisit transaksi berjalan yang mencapai 3,0% dibandingkan defisit pada tahun 2013 sebesar 3,2% dari PDB. Perbaikan kinerja transaksi berjalan tersebut terutama dipengaruhi oleh menurunnya impor akibat melemahnya permintaan domestik sebagai dampak dari moderasi pertumbuhan ekonomi. Kinerja tersebut juga didorong perbaikan ekspor manufaktur sejalan dengan berlanjutnya pemulihan AS.
Dari sisi neraca perdagangan, secara kumulatif nilai ekspor Indonesia pada tahun 2014 mencapai USD176,3 miliar atau turun sebesar 3,4% yoy dibanding tahun 2013.
THE INDONESIAN MACRO ECONOMIC OVERVIEW IN 2014
The global economic conditions, which overshadowed with uncertainties, affected the economic performance of developing countries, including Indonesia. In 2014, the Indonesian economy grew 5.0% y-o-y, or declining from 5.8% growth y-o-y recorded in 2013. The lower economic growth in 2014 was primarily triggered by the slowdown of all components, such as household consumption, government consumption inline with budget efficiency programs and decreased in national export due to decline in demand and price of global commodities.
Domestic demand arising mostly from household consumption remained as one of the key growth drivers, though growth was limited at approximately 5.1% y-o-y in line with declining purchasing power due to inflationary pressures following the price increase of subsidized fuel. Moreover, weakened domestic economy also affected the decline in investment nationwide as reflected by the growth of physical investment (Gross Fixed Capital Formation), recorded at 4.1% yoy in 2014 compared to 4.7% yoy in 2013.
From the external side, pressures on Indonesia’s balance of payments decreased in 2014, in line with declining current account deficit of 3.0% as against a deficit of 3.2% of the GDP in 2013. The improvement in the current account deficit was mainly attributed to the decline in import due to weaker domestic demand as a result of moderation of the economic growth. The performance was also driven by the improvement of export in manufacturing sector along with the continuous recovery in the United States.
In terms of the trade balance, the cumulative value of Indonesian exports in 2014 reached USD 176.3 billion, down by 3.4% yoy over 2013. The cumulative value of

423OCBC NISP 2014 Annual ReportO
CBC NISP in Brief
From M
anagement
Good Corporate G
overnanceBusiness Review
Financial ReviewCorporate D
ata
Nilai impor kumulatif 2014 juga mengalami penurunan sebesar 4,5% (yoy) mencapai USD 178,2 miliar. Sementara itu, jumlah cadangan devisa pada akhir tahun 2014 naik sebesar USD12,5 miliar menjadi sebesar USD 111,9 miliar atau setara dengan 6,5 bulan impor dan pembayaran utang luar negeri pemerintah dibandingkan dengan akhir Desember 2013 mencapai US$ 99,4 miliar atau setara dengan 5,4 bulan impor dan pembayaran utang luar negeri pemerintah, yang mana berada di atas standar kecukupan internasional sekitar 3 bulan impor.
Membaiknya kinerja NPI dan cadangan devisa dibandingkan tahun sebelumnya, tidak serta merta memberikan dukungan kepada nilai tukar Rupiah pada 2014. Nilai tukar Rupiah di 2014 mengalami depresiasi terhadap dolar AS namun mencatat apresiasi terhadap mata uang mitra dagang utama lainnya. Depresiasi Rupiah terhadap dolar AS terjadi pada triwulan IV-2014 dikarenakan kuatnya apresiasi dolar AS terhadap hampir seluruh mata uang utama sejalan dengan rilis data perbaikan ekonomi AS dan rencana kenaikan suku bunga Fed Fund Rate. Terhadap dolar AS, Rupiah secara point-to-point melemah 1,74% (yoy) selama tahun 2014 ke level Rp 12.385 per dolar AS.
Selama tahun 2014, inflasi mencapai 8,36%, atau sedikit lebih rendah dari tingkat inflasi tahun 2013 sebesar 8,38%. Namun demikian tingkat inflasi berada jauh dari sasaran inflasi 2014 yang ditetapkan Bank Indonesia yaitu sebesar 4,5% ±1%. Tekanan inflasi tersebut terutama dikarenakan pengaruh kenaikan harga BBM bersubsidi dan dampak gejolak harga pangan domestik pada akhir tahun 2014. Kenaikan harga BBM bersubsidi telah mendorong kenaikan harga-harga, baik oleh dampak langsung maupun dampak lanjutan (second round effect). Selain BBM, penyesuaian harga barang administered lainnya juga terjadi pada sepanjang 2014, seperti Tarif Tenaga Listrik (TTL) dan Liquid Petroleum Gas (LPG).
Atas dasar pertimbangan kenaikan tingkat inflasi, Bank Indonesia memutuskan untuk menaikkan BI Rate sebesar 25 basis point dari posisi akhir tahun 2013 sebesar 7,50% menjadi 7,75% pada bulan Desember 2014. Kebijakan ini ditempuh untuk mengendalikan tekanan inflasi, memelihara kestabilan makro ekonomi dan sistem keuangan, sekaligus memastikan berlangsungnya penyesuaian defisit transaksi berjalan secara berkesinambungan. Di sisi lain, kenaikan BI Rate mengakibatkan kenaikan suku bunga perbankan yang mendorong kenaikan secara bertahap atas suku bunga simpanan dan kredit.
imports in 2014 also decreased by 4.5% (yoy) to USD 178.2 billion. Meanwhile, the amount of foreign exchange reserves at the end of 2014 increased by USD 12.5 billion to USD 111.9 billion, or equivalent to 6.5 months of imports and government foreign debt repayment in comparison to USD 99.4 billion recorded at end of December 2013, which was equivalent to 5.4 months of imports and government foreign debt payments, which was above the international adequacy standard of 3 months of import.
The improving Indonesia’s balance of payment and foreign exchange reserves as compared to the previous year, not necessarily provide support to the Rupiah’s exchange value in 2014. In 2014, Rupiah’s exchange value was depreciated against US dollar but record the appreciation of other major trading partners’ currencies. The depreciation of Rupiah against US dollar took place in the fourth quarter of 2014 caused by the strong appreciation of US dollar against almost all main currencies along with the released data of US economy recovery and the plan of increase in Fed Fund Rate interest rate. Rupiah was depreciated 1.74% (yoy) point-to-point against US dollar in 2014 to level of Rp 12,835 per US dollar.
In 2014 inflation reached 8.36%, slightly lower than the inflation rate of 8.38% that was recoded in 2013. However, the inflation rate was far from the inflation target set by Bank Indonesia of 4.5% ±1%. The inflationary pressure was caused mainly by the price increase of subsidized fuels and as an impact of the increase in domestic food price in the end of 2014. The increase in subsidized oil has caused the increase of price, both directly and indirectly (second round effect). Besides the fuel price, the price adjustment of other administered goods also take place in 2014, such as tariff of electricity and Liquid Petroleum Gas.
In response to inflation, Bank Indonesia decided to raise its benchmark rate by 25 basis points from the year-end 2013 position of 7.50% to 7.75% in December 2014. This policy was intended to control inflationary pressure, maintain stability of macro economy and the financial system, as well as ensuring positive adjustment of the current account deficit to a sustainable level. On the other hand, the BI rate increase caused banking interest rates to rise, gradually resulting in higher deposit and lending rates.
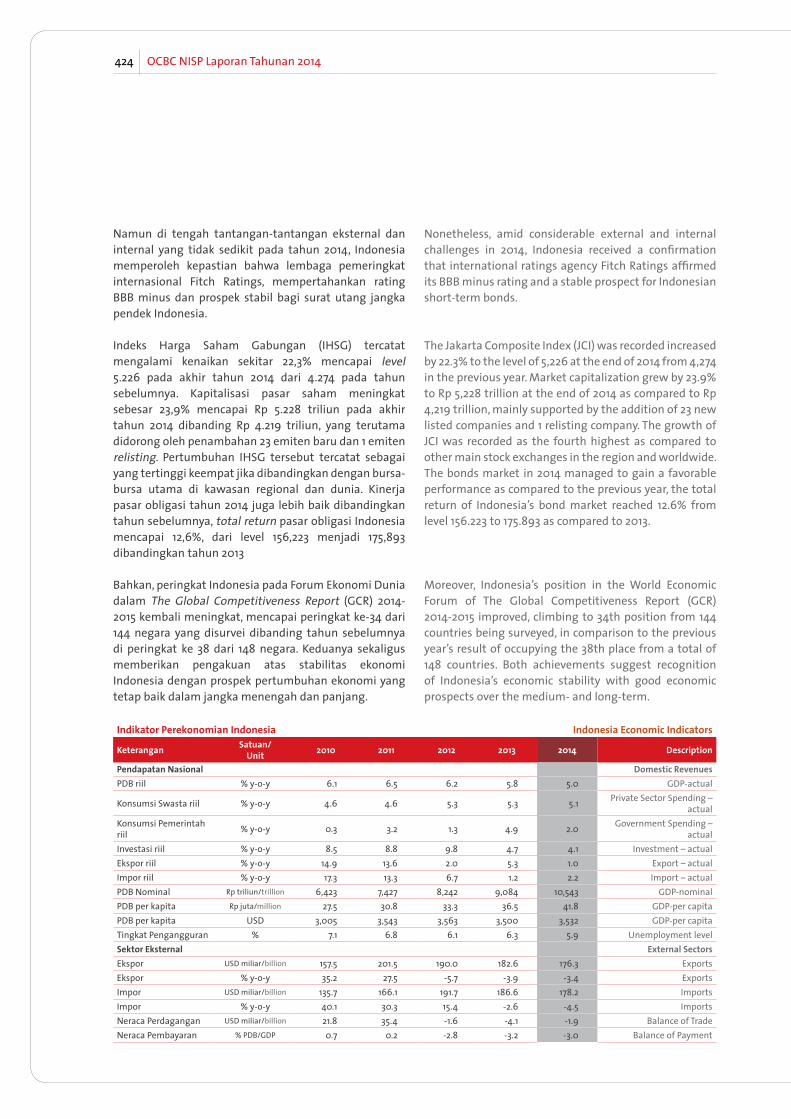
424 OCBC NISP Laporan Tahunan 2014
Nonetheless, amid considerable external and internal challenges in 2014, Indonesia received a confirmation that international ratings agency Fitch Ratings affirmed its BBB minus rating and a stable prospect for Indonesian short-term bonds.
The Jakarta Composite Index (JCI) was recorded increased by 22.3% to the level of 5,226 at the end of 2014 from 4,274 in the previous year. Market capitalization grew by 23.9% to Rp 5,228 trillion at the end of 2014 as compared to Rp 4,219 trillion, mainly supported by the addition of 23 new listed companies and 1 relisting company. The growth of JCI was recorded as the fourth highest as compared to other main stock exchanges in the region and worldwide. The bonds market in 2014 managed to gain a favorable performance as compared to the previous year, the total return of Indonesia’s bond market reached 12.6% from level 156.223 to 175.893 as compared to 2013.
Moreover, Indonesia’s position in the World Economic Forum of The Global Competitiveness Report (GCR) 2014-2015 improved, climbing to 34th position from 144 countries being surveyed, in comparison to the previous year’s result of occupying the 38th place from a total of 148 countries. Both achievements suggest recognition of Indonesia’s economic stability with good economic prospects over the medium- and long-term.
Namun di tengah tantangan-tantangan eksternal dan internal yang tidak sedikit pada tahun 2014, Indonesia memperoleh kepastian bahwa lembaga pemeringkat internasional Fitch Ratings, mempertahankan rating BBB minus dan prospek stabil bagi surat utang jangka pendek Indonesia.
Indeks Harga Saham Gabungan (IHSG) tercatat mengalami kenaikan sekitar 22,3% mencapai level 5.226 pada akhir tahun 2014 dari 4.274 pada tahun sebelumnya. Kapitalisasi pasar saham meningkat sebesar 23,9% mencapai Rp 5.228 triliun pada akhir tahun 2014 dibanding Rp 4.219 triliun, yang terutama didorong oleh penambahan 23 emiten baru dan 1 emiten relisting. Pertumbuhan IHSG tersebut tercatat sebagai yang tertinggi keempat jika dibandingkan dengan bursa-bursa utama di kawasan regional dan dunia. Kinerja pasar obligasi tahun 2014 juga lebih baik dibandingkan tahun sebelumnya, total return pasar obligasi Indonesia mencapai 12,6%, dari level 156,223 menjadi 175,893 dibandingkan tahun 2013
Bahkan, peringkat Indonesia pada Forum Ekonomi Dunia dalam The Global Competitiveness Report (GCR) 2014-2015 kembali meningkat, mencapai peringkat ke-34 dari 144 negara yang disurvei dibanding tahun sebelumnya di peringkat ke 38 dari 148 negara. Keduanya sekaligus memberikan pengakuan atas stabilitas ekonomi Indonesia dengan prospek pertumbuhan ekonomi yang tetap baik dalam jangka menengah dan panjang.
Indikator Perekonomian Indonesia Indonesia Economic Indicators
Keterangan Satuan/Unit 2010 2011 2012 2013 2014 Description
Pendapatan Nasional Domestic RevenuesPDB riil % y-o-y 6.1 6.5 6.2 5.8 5.0 GDP-actual
Konsumsi Swasta riil % y-o-y 4.6 4.6 5.3 5.3 5.1 Private Sector Spending –actual
Konsumsi Pemerintah riil % y-o-y 0.3 3.2 1.3 4.9 2.0 Government Spending –
actualInvestasi riil % y-o-y 8.5 8.8 9.8 4.7 4.1 Investment – actualEkspor riil % y-o-y 14.9 13.6 2.0 5.3 1.0 Export – actualImpor riil % y-o-y 17.3 13.3 6.7 1.2 2.2 Import – actualPDB Nominal Rp triliun/trillion 6,423 7,427 8,242 9,084 10,543 GDP-nominalPDB per kapita Rp juta/million 27.5 30.8 33.3 36.5 41.8 GDP-per capitaPDB per kapita USD 3,005 3,543 3,563 3,500 3,532 GDP-per capitaTingkat Pengangguran % 7.1 6.8 6.1 6.3 5.9 Unemployment levelSektor Eksternal External SectorsEkspor USD miliar/billion 157.5 201.5 190.0 182.6 176.3 ExportsEkspor % y-o-y 35.2 27.5 -5.7 -3.9 -3.4 ExportsImpor USD miliar/billion 135.7 166.1 191.7 186.6 178.2 ImportsImpor % y-o-y 40.1 30.3 15.4 -2.6 -4.5 ImportsNeraca Perdagangan USD miliar/billion 21.8 35.4 -1.6 -4.1 -1.9 Balance of TradeNeraca Pembayaran % PDB/GDP 0.7 0.2 -2.8 -3.2 -3.0 Balance of Payment
425OCBC NISP 2014 Annual ReportO
CBC NISP in Brief
From M
anagement
Good Corporate G
overnanceBusiness Review
Financial ReviewCorporate D
ata
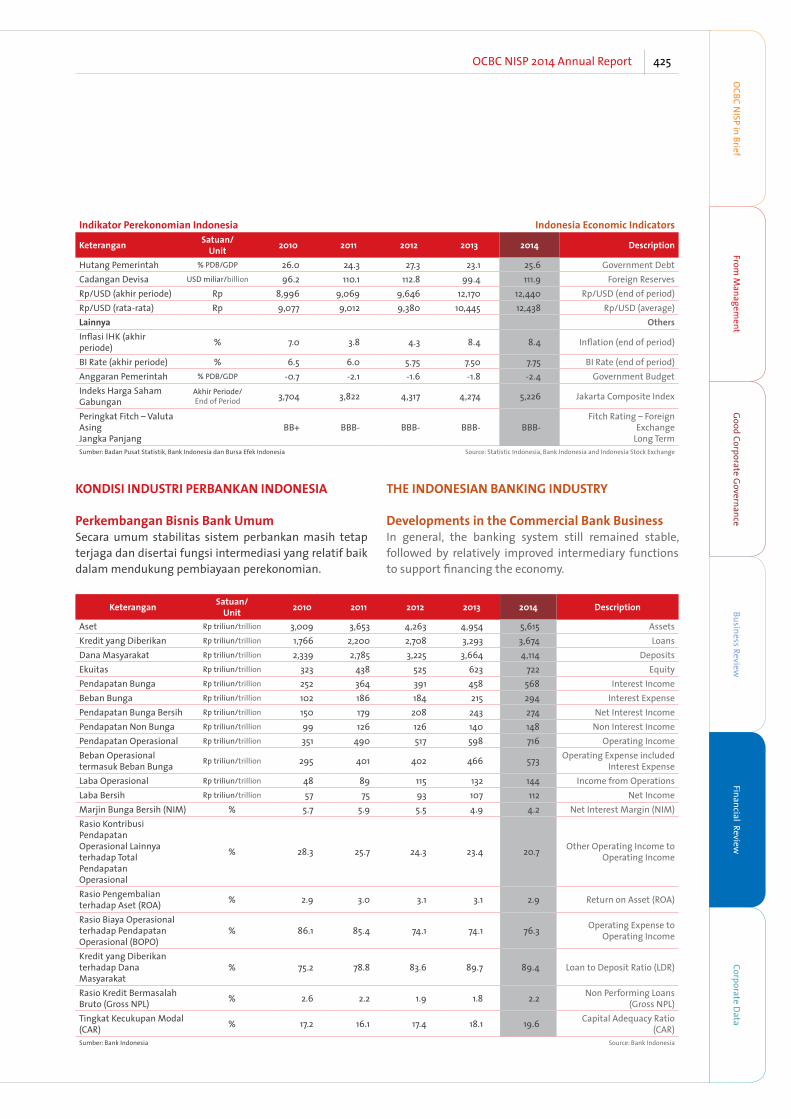
THE INDONESIAN BANKING INDUSTRY
Developments in the Commercial Bank BusinessIn general, the banking system still remained stable, followed by relatively improved intermediary functions to support financing the economy.
Indikator Perekonomian Indonesia Indonesia Economic Indicators
Keterangan Satuan/Unit 2010 2011 2012 2013 2014 Description
Hutang Pemerintah % PDB/GDP 26.0 24.3 27.3 23.1 25.6 Government DebtCadangan Devisa USD miliar/billion 96.2 110.1 112.8 99.4 111.9 Foreign ReservesRp/USD (akhir periode) Rp 8,996 9,069 9,646 12,170 12,440 Rp/USD (end of period)Rp/USD (rata-rata) Rp 9,077 9,012 9,380 10,445 12,438 Rp/USD (average)Lainnya OthersInflasi IHK (akhir periode) % 7.0 3.8 4.3 8.4 8.4 Inflation (end of period)
BI Rate (akhir periode) % 6.5 6.0 5.75 7.50 7.75 BI Rate (end of period)Anggaran Pemerintah % PDB/GDP -0.7 -2.1 -1.6 -1.8 -2.4 Government BudgetIndeks Harga Saham Gabungan
Akhir Periode/End of Period 3,704 3,822 4,317 4,274 5,226 Jakarta Composite Index
Peringkat Fitch – Valuta AsingJangka Panjang
BB+ BBB- BBB- BBB- BBB-Fitch Rating – Foreign
ExchangeLong Term
Sumber: Badan Pusat Statistik, Bank Indonesia dan Bursa Efek Indonesia Source: Statistic Indonesia, Bank Indonesia and Indonesia Stock Exchange
KONDISI INDUSTRI PERBANKAN INDONESIA
Perkembangan Bisnis Bank UmumSecara umum stabilitas sistem perbankan masih tetap terjaga dan disertai fungsi intermediasi yang relatif baik dalam mendukung pembiayaan perekonomian.
Keterangan Satuan/Unit 2010 2011 2012 2013 2014 Description
Aset Rp triliun/trillion 3,009 3,653 4,263 4,954 5,615 AssetsKredit yang Diberikan Rp triliun/trillion 1,766 2,200 2,708 3,293 3,674 LoansDana Masyarakat Rp triliun/trillion 2,339 2,785 3,225 3,664 4,114 DepositsEkuitas Rp triliun/trillion 323 438 525 623 722 EquityPendapatan Bunga Rp triliun/trillion 252 364 391 458 568 Interest IncomeBeban Bunga Rp triliun/trillion 102 186 184 215 294 Interest ExpensePendapatan Bunga Bersih Rp triliun/trillion 150 179 208 243 274 Net Interest IncomePendapatan Non Bunga Rp triliun/trillion 99 126 126 140 148 Non Interest IncomePendapatan Operasional Rp triliun/trillion 351 490 517 598 716 Operating IncomeBeban Operasionaltermasuk Beban Bunga Rp triliun/trillion 295 401 402 466 573 Operating Expense included
Interest ExpenseLaba Operasional Rp triliun/trillion 48 89 115 132 144 Income from OperationsLaba Bersih Rp triliun/trillion 57 75 93 107 112 Net IncomeMarjin Bunga Bersih (NIM) % 5.7 5.9 5.5 4.9 4.2 Net Interest Margin (NIM)Rasio Kontribusi PendapatanOperasional Lainnyaterhadap Total PendapatanOperasional
% 28.3 25.7 24.3 23.4 20.7 Other Operating Income toOperating Income
Rasio Pengembalianterhadap Aset (ROA) % 2.9 3.0 3.1 3.1 2.9 Return on Asset (ROA)
Rasio Biaya Operasionalterhadap PendapatanOperasional (BOPO)
% 86.1 85.4 74.1 74.1 76.3 Operating Expense toOperating Income
Kredit yang Diberikanterhadap Dana Masyarakat
% 75.2 78.8 83.6 89.7 89.4 Loan to Deposit Ratio (LDR)
Rasio Kredit BermasalahBruto (Gross NPL) % 2.6 2.2 1.9 1.8 2.2 Non Performing Loans
(Gross NPL)Tingkat Kecukupan Modal (CAR) % 17.2 16.1 17.4 18.1 19.6 Capital Adequacy Ratio
(CAR)Sumber: Bank Indonesia Source: Bank Indonesia

426 OCBC NISP Laporan Tahunan 2014
The loan to deposit ratio of commercial banks slightly decreased to 89.4% at the end of 2014 in comparison to 89.7% at the end of 2013, in line with loan disbursement which accompanied by the prudent principle.
Loan disbursement increased by 11.6% y-o-y to Rp 3,674 trillion at the end of 2014 from Rp 3,293 trillion at the end of 2013. The banking industry recorded loan composition by usage mostly for purposes of working capital loan with 47.8%, followed by consumer loans with 27.6% and investment loans with 24.6%.
Although the Gross Non Performing Loan increased to 2.2% in the end of 2014, it was still far below the maximum limit of 5%.
Credit growth in 2014 was partly driven by strong growth in Rupiah currency loans. As of December 2014, growth of Rupiah currency loans reached 12.4% y-o-y, exceeding the growth in foreign currencies loans of 7.8% y-o-y, mainly due to the depreciation in Rupiah currency against the US Dollar.
Rasio kredit terhadap dana pihak ketiga (Loan to Deposit Ratio/LDR) bank umum sampai dengan akhir tahun 2014 sedikit menurun menjadi 89,4% dibandingkan 89,7% pada akhir tahun 2013, seiring pemberian kredit yang diiringi prinsip kehati-hatian (prudent).
Penyaluran kredit naik sebesar 11,6% y-o-y menjadi Rp 3.674 triliun pada akhir tahun 2014 dari Rp 3.293 triliun pada akhir tahun 2013. Adapun komposisi kredit perbankan berdasarkan penggunaannya didominasi oleh kredit modal kerja 47,8%, kemudian diikuti oleh kredit konsumsi 27,6% dan kredit investasi 24,6%.
Rasio kredit bermasalah bruto (Gross Non Performing Loan/NPL) walaupun meningkat menjadi sekitar 2,2% pada akhir tahun 2014, masih jauh berada di bawah batas maksimum 5%.
Rp Triliun, kecuali % Rp Trillion, except %
Keterangan/ Description 2014 2013
YoYJumlah / Amount
%
Konsumsi Consumption
1,014 909 105 11.5
Investasi Investment
903 798 105 13.2
Modal Kerja Working Capital
1,757 1,586 171 10.8
Total 3,674 3,293 381 11.6
Komposisi Kredit Bruto berdasarkan Jasa PenggunaanLoan Gross Composition by UsageRp Triliun, kecuali %Rp Trillion, except %
Modal KerjaWorking Capital
InvestasiInvestment
KonsumsiConsumption
2014
3,674
2010
1,766
2012
2,708
2013
3,293
2011
2,200
48.2%
27.6%
24.2%
47.8%
27.6%
24.6%
30.3%
21.1%
48.6%
30.4%
20.8%
48.8%
29.6%
21.8%
48.6%
Pertumbuhan kredit pada tahun 2014 didorong oleh tingginya pertumbuhan kredit Rupiah. Sampai dengan Desember 2014, pertumbuhan kredit Rupiah sebesar 12,4% y-o-y melampaui pertumbuhan kredit Valas sebesar 7,8% y-o-y, terutama dipengaruhi oleh meningkatnya nilai tukar US dolar terhadap Rupiah.

427OCBC NISP 2014 Annual ReportO
CBC NISP in Brief
From M
anagement
Good Corporate G
overnanceBusiness Review
Financial ReviewCorporate D
ata
Meanwhile, according to the sector, productive sector has a relatively equitable growth in 2014.
Meanwhile, Third Party Deposits (DPK) at the end of 2014 reached Rp 4.114 trillion or increasing by 12,3% y-o-y from Rp 3,664 trillion at the end of 2013. The composition of low cost funds such as savings and current accounts grew 5.9% and 5.1% respectively in 2014. The increase in low cost funds serves as an indication of public confidence towards the economic outlook and the resilience of the Indonesian banking sector.
Rp Triliun, kecuali %Rp Trillion, except %
Rp Triliun, kecuali % Rp Trillion, except %
Keterangan/ Description 2014 2013
YoYJumlah / Amount
%
Rupiah Rupiah
3,058 2,721 337 12.4
Valas Foreign Currency
616 572 44 7.8
Total 3,674 3,293 381 11.6
Komposisi Kredit Bruto berdasarkan Jenis Mata UangLoan Gross Composition by Currency
Mata Uang RupiahRupiah Currency
Valuta AsingForeign Currency
15.5%
84.5%
1,766
2010
3,293
2013
2,708
2012
2,200
2011
3,674
2014
83.6%
16.4%
16.8%
83.2%
17.4%
82.6%
15.8%
84.2%
Sementara itu, dilihat berdasarkan sektornya, sektor produktif memiliki pertumbuhan yang relatif merata pada tahun 2014.
Rp Triliun, kecuali % Rp Trillion, except %
Keterangan/ Description 2014 2013
YoYJumlah / Amount
%
PerdaganganTrade
790 703 87 12.4
Manufaktur Manufacture
661 578 83 14.4
Jasa Service
332 344 (12) (3.5)
Pertanian Agriculture
220 184 36 19.6
Lain-lain Others
1,671 1,484 187 12.6
Total 3,674 3,293 381 11.6
Komposisi Kredit Bruto berdasarkan Sektor EkonomiLoan Gross Composition by Economic SectorRp Triliun, kecuali %Rp Trillion, except %
Lain-lainOthers
PertanianAgriculture
JasaService
ManufakturManufacture
PerdaganganTrade
3,674
2014
1,766
2010
2,708
2012
3,293
2013
2,200
2011
21.5%
18.0%
9.0%6.0%
45.5%
20.1%
16.5%
10.2%5.5%
47.7%
18.4%
15.7%10.2%5.2%
50.5%
17.6%
10.4%5.6%
45.1%
21.3%
49.9%
5.2%
19.2%
15.6%10.1%
Di sisi lain, penghimpunan Dana Pihak Ketiga (DPK) sampai dengan akhir tahun 2014 mencapai Rp 4.114 triliun atau mengalami peningkatan sebesar 12,3% y-o-y dari Rp 3.664 triliun pada akhir tahun 2013. Adapun komposisi dana dengan biaya murah seperti tabungan dan giro tumbuh masing-masing sebesar 5,9% dan 5,1% pada tahun 2014. Peningkatan dana dengan biaya murah tersebut sekaligus menunjukkan bahwa masyarakat masih memiliki kepercayaan terhadap prospek perekonomian dan kekuatan sektor perbankan di Indonesia.

428 OCBC NISP Laporan Tahunan 2014
Meanwhile, by type of currency, Rupiah-denominated deposits provided a majority contribution to total third party deposits. As of 2014, Rupiah-denominated deposits increased by Rp 409 trillion, or up 13.5% y-o-y, while deposits denominated in foreign currency grew by Rp 41 trillion, or up by 6.4% y-o-y.
As of the end of 2014, the profitability of the Indonesian banking industry continued to show positive performance. The overall Indonesian Banking sector recorded net profit of Rp 112 trillion, increased 5.1% compared to Rp 107 trillion in 2013. The increase in net profit was primarily driven by growth in net interest income throughout 2014, which reached Rp 274 trillion, an increase of 12.8% y-o-y, exceeding net interest income of Rp 243 trillion in 2013. The high net interest income
Rp Triliun, kecuali % Rp Trillion, except %
Keterangan/ Description 2014 2013
YoYJumlah /Amount
%
DepositTime Deposits
1,940 1,604 336 21.0
Tabungan Saving Accounts
1,284 1,213 71 5.9
Giro Current Accounts
890 847 43 5.1
Total 4,114 3,664 450 12.3
Komposisi Dana Pihak KetigaThird Party Deposits CompositionRp Triliun, kecuali %Rp Trillion, except %
GiroCurrent Accounts
TabunganSaving Accounts
DepositTime Deposits
4,114
2014
2,339
2010
3,225
2012
3,664
2013
2,785
2011
21.6%
31.2%
47.2%
23.1%
33.1%
43.8%
23.8%
33.4%
42.8%
23.5%
32.2%
44.3%
22.9%
31.3%
45.8%
Sementara itu, berdasarkan jenis mata uang, DPK dikontribusikan terutama oleh DPK denominasi Rupiah. Pada tahun 2014, DPK denominasi Rupiah telah bertambah sebesar Rp 409 triliun atau naik 13,5% y-o-y, sedangkan DPK denominasi valas mengalami kenaikan sebesar Rp 41 triliun atau tumbuh sebesar 6,4% y-o-y.
Rp Triliun, kecuali % Rp Trillion, except %
Keterangan/ Description 2014 2013
YoYJumlah / Amount
%
Mata Uang RupiahRupiah Currency
3,434 3,025 409 13.5
Valuta Asing Foreign Currency
680 639 41 6.4
Total 4,114 3,664 450 12.3
Komposisi Dana Pihak KetigaThird Party Deposits CompositionRp Triliun, kecuali %Rp Trillion, except %
Mata Uang RupiahRupiah Currency
Valuta AsingForeign Currency
4,114
2014
2,339
2010
3,225
2012
3,664
2013
2,785
2011
16.5%
83.5%
17.4%
82.6%
14.5%
85.6%
13.9%
86.1%
14.9%
85.1%
Sampai dengan akhir tahun 2014 kinerja profitabilitas industri perbankan masih menunjukkan tren pertumbuhan positif. Perbankan Indonesia mencatat laba bersih sebesar Rp 112 triliun, meningkat sebesar 5,1% dibandingkan Rp 107 triliun pada tahun 2013. Kenaikan laba bersih terutama didorong oleh pertumbuhan pendapatan bunga bersih sepanjang tahun 2014 yang mencapai Rp 274 triliun, atau naik sebesar 12,8% y-o-y, yang melampaui pendapatan bunga bersih pada akhir tahun 2013 sebesar Rp 243 triliun. Tingginya pendapatan

429OCBC NISP 2014 Annual ReportO
CBC NISP in Brief
From M
anagement
Good Corporate G
overnanceBusiness Review
Financial ReviewCorporate D
ata
was primarily due to loan growth of 11.6% y-o-y and LDR that reached 89.4% in 2014.
Despite recording an increase in net interest income, after the BI rate increase, the banking industry actually suffered a reduction in the net interest margin (NIM) to 4.2% in 2014 from 4.9% in 2013, especially due to tighter competition in acquiring third party deposits.
In 2014, industry-wide non-interest income increased by 6.3% y-o-y. However, with slower growth of non-interest income relative to the growth achieved for net interest income, the overall contribution provided by non-interest income to total operating income declined to 20.7% from 23.4% in 2013.
The increase in profit before tax of 4.7% was lower than the average increase of total assets in the banking industry of 14.6%, thereby pushing industry ROA down to 2.9% at the end of 2014 from 3.1% at the end of 2013.
The banking industry stability continue to be well maintained as reflected by high capital adequacy ratio (CAR) of 19.6% at the end of 2014, or higher than 18.1% in 2013, and both are far above the minimum requirement of 8%.
bunga bersih ini terutama didorong oleh pertumbuhan kredit yang mencapai 11,6% y-o-y dan LDR yang mencapai 89,4% pada tahun 2014.
Walaupun membukukan kenaikan pendapatan bunga bersih, pasca kenaikan BI Rate, industri perbankan sebenarnya mengalami tren penurunan marjin bunga bersih (Net Interest Margin/NIM) perbankan menjadi 4,2% pada tahun 2014 dari 4,9% pada tahun 2013, terutama diakibatkan makin ketatnya persaingan dalam penghimpunan DPK.
Pada tahun 2014, pendapatan non bunga dari perbankan meningkat sebesar 6,3% y-o-y. Namun demikian, akibat laju kenaikan pendapatan non bunga lebih lambat dibandingkan pertumbuhan pendapatan bunga bersih mengakibatkan kontribusi pendapatan non bunga terhadap total pendapatan operasional turun menjadi 20,7% dibandingkan 23,4% pada tahun 2013.
Kenaikan laba sebelum pajak sebesar 4,7% lebih rendah dibandingkan kenaikan rata-rata total aset industri perbankan sebesar 14,6%, mendorong tingkat ROA turun menjadi 2,9% pada akhir tahun 2014 dibandingkan dengan akhir tahun 2013 sebesar 3,1%.
Stabilitas industri perbankan masih tetap terjaga dengan baik juga tercermin pada tingginya rasio kecukupan modal (CAR/Capital Adequacy Ratio) yang mencapai 19,6% pada akhir tahun 2014, lebih tinggi dibandingkan tahun 2013 sebesar 18,1% atau berada jauh di atas ketentuan minimum 8%.
Rp Triliun, kecuali % Rp Trillion, except %
Keterangan/ Description 2014 2013
YoYJumlah/ Amount
%
ModalCapital
754 627 127 20.3
ATMR RWA
3,854 3,458 396 11.5
CAR 19.6% 18.1%
PermodalanCapitalRp Triliun, kecuali %Rp Trillion, except %
ATMRRWA
ModalCapital
CARCAR
3,854
754
2,8502,521
1,882
2010 201320122011 2014
627497405323
19.6%
18.1%17.4%
16.1%17.2%
3,458

430 OCBC NISP Laporan Tahunan 2014
TINJAUAN KINERJA OPERASIONAL BANK OCBC NISP
Bank OCBC NISP berhasil meningkatkan kinerjanya selama tahun 2014 dengan membukukan laba bersih sebesar Rp 1,3 triliun atau naik 16,6% dari Rp 1,1 triliun pada tahun 2013. Imbal hasil aset (ROA) dan imbal hasil ekuitas (ROE) Bank OCBC NISP masing-masing sebesar 1,8% dan 9,7% pada tahun 2014 dibandingkan 1,8% dan 11,9% pada tahun 2013.
Kenaikan total aset terutama didorong oleh pertumbuhan kredit bruto yang mencapai Rp 68,4 triliun atau tumbuh sebesar 6,9% dibanding tahun 2013. Pertumbuhan kredit diiringi dengan terjaganya kualitas kredit, yang ditunjukkan dengan kredit bermasalah bruto (Gross NPL) sebesar 1,3% dari total Kredit bruto. Tingkat NPL bruto ini relatif lebih rendah dibanding dengan rata-rata industri di kisaran 2,2% pada akhir tahun 2014. Pertumbuhan total aset juga didukung oleh pertumbuhan total dana pihak ketiga (DPK) yang mencapai Rp 72,8 triliun pada akhir tahun 2014 atau tumbuh sebesar 5,6% dibandingkan tahun sebelumnya. Di sisi permodalan, total ekuitas mencapai Rp 14,9 triliun dan rasio kecukupan modal (Capital Adequacy Ratio/ CAR) yang memperhitungkan risiko kredit, pasar dan operasional tercatat sebesar 18,7% di akhir tahun 2014.
Di samping itu, Bank OCBC NISP sebagai salah satu bank swasta nasional yang sehat dan prudent berhasil mempertahankan peringkat lokal ‘AAA’ dari Fitch Ratings dan Pefindo, menjadi salah satu bank dengan peringkat kredit tertinggi di Indonesia pada tahun 2014.
Pencapaian kinerja keuangan juga senantiasa diiringi dengan upaya-upaya untuk meningkatkan posisi dan kapabilitas lini produk dan layanan transaksi perbankan yang lengkap termasuk meningkatkan efektivitas jaringan 337 kantor, 759 ATM, 712 EDC, e-Banking termasuk internet dan mobile banking, branding, tata kelola perusahaan, sistem, teknologi dan perbaikan proses kerja secara berkesinambungan, guna mampu menghasilkan nilai ekonomi yang maksimal dan berkelanjutan bagi seluruh stakeholder.
KINERJA KEUANGAN BANK OCBC NISPBank OCBC NISP mencatatkan laba bersih sebesar Rp 1,3 triliun atau meningkat sebesar 16,6% dibandingkan dengan tahun 2013 sebesar Rp 1,1 triliun dengan imbal hasil aset (ROA) Bank OCBC NISP di tahun 2014 sebesar 1,8% atau sama dengan tahun 2013. Sedangkan untuk imbal hasil ekuitas (ROE) Bank OCBC NISP sebesar 9,7%
REVIEW OF BANK OCBC NISP’S OPERATIONAL PERFORMANCEBank OCBC NISP managed to increase financial performance in 2014 by recording a net profit growth to Rp 1.3 trillion or an increase of 16.6% from Rp 1.1 trillion in 2013. Bank OCBC NISP achieved return on assets (ROA) and return on equity (ROE) of 1.8% and 9.7% respectively in 2014 as compared to 1.8% and 11.9% in 2013.
Increase in total assets were predominantly made up of gross loans, in the amount of Rp 68.4 trillion or growing 6.9% compared to 2013. Loans growth was accompanied by maintained consistency of credit quality, as reflected by the Bank’s gross non-performing loans (NPL) of 1.3% from total gross Loans. This level of gross NPL is relatively lower than the industry’s average of 2.2% as at end of 2014. Growth in total assets was also supported by growth of third-party deposits (DPK), which reached Rp 72.8 trillion as at the end of 2014 or increasing 5.6% compared to the previous year. In terms of capital, total equity reached Rp 14.9 trillion and the capital adequacy ratio taking into account the credit, market and operational risks (CAR) was recorded at 18.7% at the end of the year.
Moreover, Bank OCBC NISP managed to strengthen its position as a sound and prudent national private bank by maintaining its ‘AAA’ local ratings from Fitch Ratings and Pefindo, becoming one of the banks with the highest credit ratings in Indonesia for 2014.
The financial performance is continuously followed by the Bank’s efforts to consistently increase the position and capabilities of banking products and transaction services, including investment in a network of 337 offices, 759 ATMs, 712 EDCs, e-Banking including internet and mobile banking services, branding, good corporate governance, system, technology and improvement of working processes, in order to build maximum and sustainable economic values for all stakeholders.
BANK OCBC NISP’S FINANCIAL PERFORMANCE Bank OCBC NISP recorded net profit of Rp 1.3 trillion, an increase of 16.6% compared to the amount of Rp 1.1 trillion in 2013, while Bank OCBC NISP’s Return on Assets (ROA) for 2014 was 1.8%, stable from 2013.However, Return on Equity (ROE) in 2014 was 9.7% compared to 11.9% in 2013. The ROE drop was mainly due to increased

431OCBC NISP 2014 Annual ReportO
CBC NISP in Brief
From M
anagement
Good Corporate G
overnanceBusiness Review
Financial ReviewCorporate D
ata
di tahun 2014, lebih rendah dibandingkan 11,9% pada tahun 2013. Penurunan ROE ini terutama disebabkan oleh kenaikan total ekuitas (sehubungan dengan Penawaran Umum Terbatas VII) di akhir tahun 2013 yang menyebabkan rata-rata ekuitas pada tahun 2014 meningkat 42,9% dibandingkan rata-rata ekuitas di tahun 2013, atau lebih tinggi dari kenaikan laba bersih sebesar 16,6% pada tahun yang sama. Hal ini antara lain diakibatkan oleh perlambatan pertumbuhan ekonomi makro dan dinamika kondisi politik dalam negeri.
Pendapatan BungaPendapatan bunga Bank OCBC NISP merupakan pendapatan bunga dari pinjaman yang diberikan, efek-efek dan obligasi Pemerintah, giro dan penempatan pada bank lain dan Bank Indonesia dan lain-lain, yang dijabarkan sebagai berikut:
(Dalam Miliar Rupiah, kecuali %) (In Billion Rupiah, except %)
Aset /Assets
2014 2013Δ%
PendapatanBunga/InterestIncome
PendapatanBunga/InterestIncome
Suku Bunga Rata-Rata/Average Interest Rate Pendapatan
Bunga/InterestIncome
Suku Bunga Rata-Rata/Average Interest Rate
Rupiah(%)
Mata UangAsing (%)/
ForeignCurrency (%)
Rupiah(%)
Mata UangAsing (%)/
ForeignCurrency (%)
Pinjaman yang diberikanLoans
6,443 11.66 5.09 5,261 10.42 5.17 22.5
Efek-efek dan obligasiPemerintahMarketable securities andGovernment bonds
1,132 7.22 3.02 697 5.93 2.52 62.3
DerivatifDerivatives
231 - - 55 - - 319.0
Giro dan penempatan padabank lain dan Bank IndonesiaPlacement with other banksand Bank Indonesa
97 6.78 0.15 120 5.39 0.16 (19.3)
Lain-lainOthers
5 - - 16 - - (66.3)
Total 7,908 6,149 28.6
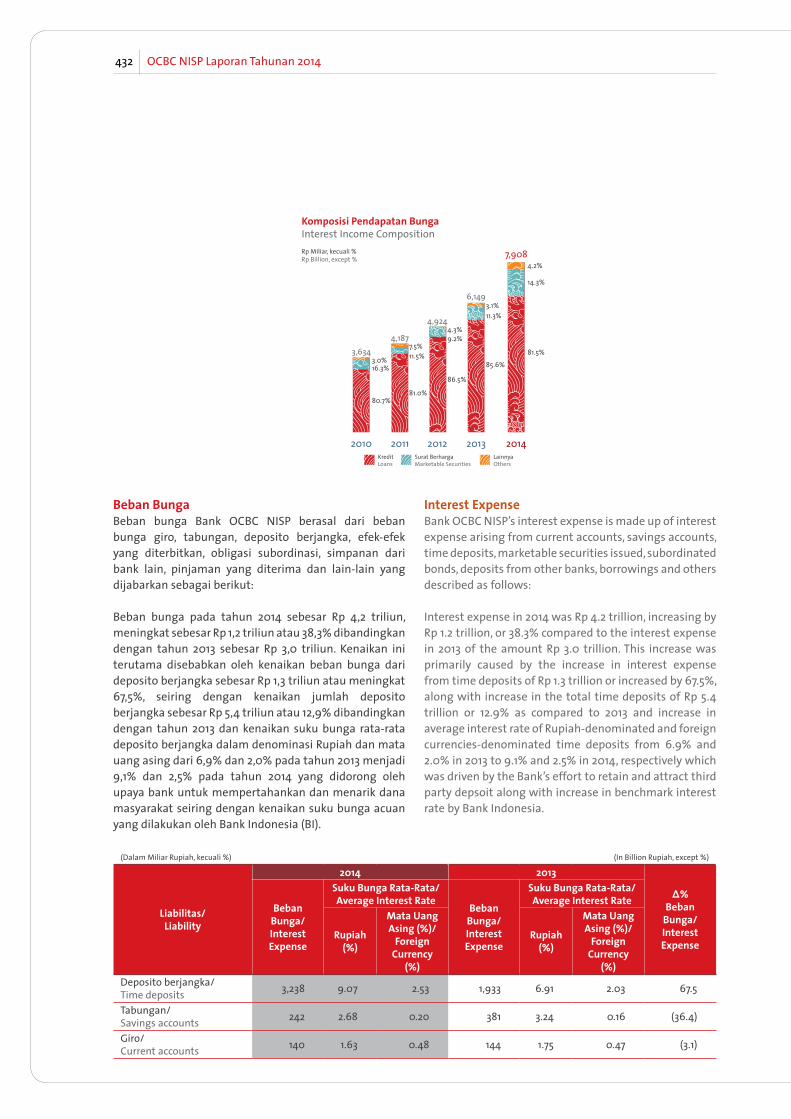
Pendapatan bunga pada tahun 2014 sebesar Rp 7,9 triliun, meningkat sebesar Rp 1,8 triliun atau naik sebesar 28,6% dibandingkan dengan tahun 2013 sebesar Rp 6,1 triliun. Kenaikan ini terutama disebabkan oleh kenaikan Kredit bruto sebesar Rp 4,4 triliun atau 6,9% dibandingkan dengan tahun 2013.
Seiring kenaikan suku bunga acuan yang dilakukan oleh Bank Indonesia (BI), suku bunga rata-rata Kredit bruto dalam denominasi Rupiah meningkat menjadi sebesar 11,7% pada tahun 2014 dibandingkan dengan 10,4% pada tahun 2013 sedangkan suku bunga rata-rata Kredit Bruto dalam denominasi mata uang asing sedikit menurun menjadi sebesar 5,1% pada tahun 2014 dari 5,2% pada tahun 2013.
total equity (associated with the Limited Public Offering VII) in 2013, thereby raising the average equity in 2014 by 42.9% from the 2013 average equity or higher than the increase in Bank’s net profit growth of 16.6% in the same year. This was caused by among others slower growth in macroeconomy and the dynamic of domestic political condition.
Interest IncomeBank OCBC NISP’s interest income is derived from loans, marketable securities and government bonds, current accounts and placements with other banks and Bank Indonesia and others described as follows:
In 2014, interest income was Rp 7.9 trillion, rising by Rp 1.8 trillion or 28.6% compared to Rp 6.1 trillion interest earned in 2013. The increase was primarily due to higher gross loans by Rp 4.4 trillion or 6.9% as compared to 2013.
In line with the increase in Bank Indonesia’s benchmark interest rates, the average interest rate of Rupiah-denominated gross loans was 11.7% in 2014 compared to 10.4% in 2013, whereas the average interest rate for gross loans in foreign currency denomination remained relatively stable at 5.1% in 2014 and 5.2% in 2013.
432 OCBC NISP Laporan Tahunan 2014
KreditLoans
Komposisi Pendapatan BungaInterest Income CompositionRp Miliar, kecuali %Rp Billion, except %
Surat BerhargaMarketable Securities
LainnyaOthers
4.2%
14.3%
81.5%
3.1%11.3%
85.6%
2014
7,908
2010
3,634
2013
6,149
2011
4,187
2012
4,924
7.5%11.5%
81.0%
3.0%16.3%
80.7%
9.2%
86.5%
4.3%
Beban BungaBeban bunga Bank OCBC NISP berasal dari beban bunga giro, tabungan, deposito berjangka, efek-efek yang diterbitkan, obligasi subordinasi, simpanan dari bank lain, pinjaman yang diterima dan lain-lain yang dijabarkan sebagai berikut:
Beban bunga pada tahun 2014 sebesar Rp 4,2 triliun, meningkat sebesar Rp 1,2 triliun atau 38,3% dibandingkan dengan tahun 2013 sebesar Rp 3,0 triliun. Kenaikan ini terutama disebabkan oleh kenaikan beban bunga dari deposito berjangka sebesar Rp 1,3 triliun atau meningkat 67,5%, seiring dengan kenaikan jumlah deposito berjangka sebesar Rp 5,4 triliun atau 12,9% dibandingkan dengan tahun 2013 dan kenaikan suku bunga rata-rata deposito berjangka dalam denominasi Rupiah dan mata uang asing dari 6,9% dan 2,0% pada tahun 2013 menjadi 9,1% dan 2,5% pada tahun 2014 yang didorong oleh upaya bank untuk mempertahankan dan menarik dana masyarakat seiring dengan kenaikan suku bunga acuan yang dilakukan oleh Bank Indonesia (BI).
(Dalam Miliar Rupiah, kecuali %) (In Billion Rupiah, except %)
Liabilitas/Liability
2014 2013
Δ%Beban
Bunga/InterestExpense
Beban Bunga/InterestExpense
Suku Bunga Rata-Rata/Average Interest Rate
Beban Bunga/InterestExpense
Suku Bunga Rata-Rata/Average Interest Rate
Rupiah(%)
Mata UangAsing (%)/
ForeignCurrency
(%)
Rupiah(%)
Mata UangAsing (%)/
Foreign Currency
(%)Deposito berjangka/Time deposits 3,238 9.07 2.53 1,933 6.91 2.03 67.5
Tabungan/Savings accounts 242 2.68 0.20 381 3.24 0.16 (36.4)
Giro/Current accounts 140 1.63 0.48 144 1.75 0.47 (3.1)
Interest ExpenseBank OCBC NISP’s interest expense is made up of interest expense arising from current accounts, savings accounts, time deposits, marketable securities issued, subordinated bonds, deposits from other banks, borrowings and others described as follows:
Interest expense in 2014 was Rp 4.2 trillion, increasing by Rp 1.2 trillion, or 38.3% compared to the interest expense in 2013 of the amount Rp 3.0 trillion. This increase was primarily caused by the increase in interest expense from time deposits of Rp 1.3 trillion or increased by 67.5%, along with increase in the total time deposits of Rp 5.4 trillion or 12.9% as compared to 2013 and increase in average interest rate of Rupiah-denominated and foreign currencies-denominated time deposits from 6.9% and 2.0% in 2013 to 9.1% and 2.5% in 2014, respectively which was driven by the Bank’s effort to retain and attract third party depsoit along with increase in benchmark interest rate by Bank Indonesia.

433OCBC NISP 2014 Annual ReportO
CBC NISP in Brief
From M
anagement
Good Corporate G
overnanceBusiness Review
Financial ReviewCorporate D
ata
The average interest rate of current accounts and saving accounts in Rupiah denomination dropped to 1.6% and 2.7% respectively in 2014 as against 1.8% and 3.2% respectively in 2013, whereas the average interest rate of current accounts and saving accounts denominated in foreign currencies remained relatively stable at 0.5% and 0.2% respectively in 2014 and 2013.
Net Interest IncomeNet interest income increased by Rp 606 billion or 19.3% to reach Rp 3.7 trillion in 2014 from Rp 3.1 trillion obtained in 2013, with the increase being driven by the increase in interest income along with the growth in the gross loans. The contribution of net interest income to total income in 2014 became 83.4% from 78.1% in 2013.
(Dalam Miliar Rupiah, kecuali %) (In Billion Rupiah, except %)
Liabilitas/Liability
2014 2013
Δ%Beban
Bunga/InterestExpense
Beban Bunga/InterestExpense
Suku Bunga Rata-Rata/Average Interest Rate
Beban Bunga/InterestExpense
Suku Bunga Rata-Rata/Average Interest Rate
Rupiah(%)
Mata UangAsing (%)/
ForeignCurrency
(%)
Rupiah(%)
Mata UangAsing (%)/
Foreign Currency
(%)Efek-efek yang diterbitkan/Marketable securities issued
228 7.42 - 233 7.24 - (2.2)
Obligasi subordinasi/Subordinated bonds 101 11.50 - 114 11.64 - (11.6)
Pinjaman yang diterima/Borrowings 41 - 1.13 22 - 1.10 84.3
Simpanan dari bank lain/Deposits from other banks 28 5.96 0.19 58 4.85 0.26 (51.9)
Lain-lain/Others 145 - - 125 - - 16.5
Total 4,163 3,010 38.3
Suku bunga rata-rata giro dan tabungan dalam denominasi Rupiah turun masing-masing menjadi 1,6% dan 2,7% pada tahun 2014 dibandingkan dengan tahun 2013 masing-masing sebesar 1,8% dan 3,2%, sedangkan suku bunga rata-rata giro dan tabungan dalam denominasi mata uang asing relatif stabil yaitu masing-masing sebesar 0,5% dan 0,2% pada tahun 2014 dan 2013.
Komposisi Beban BungaInterest Expense CompositionRp Miliar, kecuali %Rp Billion, except %
Dana Pihak KetigaThird Party Funds
Efek-efek yang DiterbitkanMarketable Securities Issued
LainnyaOthers
4,163
2014
1,641
2010
2,358
2012
3,010
2013
1,932
2011
5.1%7.9%
87.0%
6.8%11.5%
81.7%
6.6%7.1%
86.3%
5.8%8.7%
85.5%
6.1%7.4%
86.5%
Pendapatan Bunga BersihPendapatan bunga bersih mengalami kenaikan sebesar Rp 606 miliar atau 19,3% menjadi sebesar Rp 3,7 triliun pada tahun 2014 dibandingkan dengan tahun 2013 sebesar Rp 3,1 triliun terutama didorong oleh naiknya pendapatan bunga seiring pertumbuhan Kredit bruto. Kontribusi pendapatan bunga bersih terhadap total pendapatan di tahun 2014 menjadi 83,4% dari sebesar 78,1% di tahun 2013.

434 OCBC NISP Laporan Tahunan 2014
Sedangkan rasio marjin bunga bersih tetap sebesar 4,1% pada tahun 2014 akibat kenaikan aset yang menghasilkan (earning assets) sebesar 6,7% yang diimbangi oleh kenaikan pendapatan bunga bersih sebesar 19,3%.
Pendapatan Bunga Bersih dan Marjin Bunga Bersih (NIM)Net Interest Income and Net Ineterest Margin (NIM)Rp Miliar, kecuali %Rp Billion, except %
Pendapatan Bunga BersihNet Interest Income
Marjin Bunga Bersih (NIM)Net Ineterest Margin (NIM)
3,139
3,745
2,566
1,993
2010 201320122011 2014
2,255
5.0%4.8%
4.2%4.1% 4.1%
Pendapatan Operasional LainnyaPendapatan operasional lainnya pada tahun 2014 mencapai Rp 743 miliar, turun sebesar Rp 136 miliar atau 15,4% dibandingkan dengan tahun 2013 sebesar Rp 879 miliar.
(Dalam Miliar Rupiah, kecuali %) (In Billion Rupiah, except %)
Pendapatan OperasionalLainnya 2014 2013 Δ % Other Operating Income
Provisi dan komisi 678 602 12.8 Fees and Commissions
Keuntungan dari perubahannilai wajar instrumenkeuangan dan penjualaninstrumen keuangan
152 68 122.6Gain from changes in fair value
of Financial instruments andsale of financial instruments
Laba/(Rugi) Selisih kurs - bersih (87) 209 (141.7) Foreign exchange gain/(loss) (nett)Total 743 879 (15.4) Total
Penurunan ini terutama didorong oleh kerugian dari selisih kurs – bersih sebesar Rp 87 miliar selama tahun 2014 sedangkan di tahun 2013 tercatat laba selisih kurs sebesar Rp 209 miliar. Namun kerugian tersebut diimbangi dengan kenaikan dari keuntungan dari perubahan nilai wajar instrumen keuangan dan penjualan instrumen keuangan sebesar Rp 84 miliar selama tahun 2014. Di samping itu, pendapatan dari provisi dan komisi juga mengalami kenaikan sebesar Rp 76 miliar pada tahun yang sama. Kenaikan pendapatan provisi dan komisi ini terdiri dari kenaikan pendapatan dari jasa adminstrasi, trade finance, pelayanan perbankan, remittance &
Meanwhile the net interest margin was stable at 4.1% in 2014 due to the increase in earning assets of 6.7% which followed by the increase in net interest income of 19.3%.
Other Operating IncomeIn 2014, other operating income amounted to Rp 743 billion, lower by Rp 136 billion or 15.4% when compared to Rp 879 billion earned during 2013.
This decrease was primarily driven by foreign exchange loss – net of Rp 87 billion, while in 2013 recorded Rp 209 billion of foreign exchange gain. However, the loss was compensated by improved earning provided by gain from changes in fair value of financial instruments and sale of financial instruments in the amount Rp 84 billion in 2014. Furthermore, income from provisions and commissions also experienced an increase of Rp 76 billion in the same year. Higher income from provisions and commissions consisted of increasing income from administration fee service, trade finance, banking services, remittance & collection, wealth management & Insurance and credit

435OCBC NISP 2014 Annual ReportO
CBC NISP in Brief
From M
anagement
Good Corporate G
overnanceBusiness Review
Financial ReviewCorporate D
ata
collection, wealth management & asuransi, dan kartu kredit masing-masing sebesar Rp 36 miliar, Rp 19 miliar, Rp 10 miliar, Rp 9 miliar, Rp 4 miliar dan Rp 2 miliar, yang diimbangi oleh turunnya pendapatan dari e-channel sebesar Rp 3 miliar.
Sejalan dengan hal tersebut, mengakibatkan rasio pendapatan operasional lainnya terhadap total pendapatan mengalami penurunan dari sebesar 21,9% pada tahun 2013 menjadi sebesar 16,6% pada tahun 2014.
Pendapatan Operasional LainnyaOther Operating IncomeRp Miliar, kecuali %Rp Billion, except %
Keuntungan dari Perubahan Nilai Wajar Instrumen Keuangan dan Penjualan Instrumen KeuanganGain from Changes in Fair Value of Financial Instruments and Sale of Financial Instruments
Laba (Rugi) Selisih Kurs - BersihForeign Exchange Gain/(Loss) - Net
Provisi dan KomisiFees and Commissions
Pendapatan Operasional Lainnya/Total PendapatanOther Operating Income to Total Income
16.6%
743
2014
22.0%
563
2010
24.6%
836
2012
21.9%
879
2013
22.4%
2011
651 20.4%
-11.7%
91.3%
7.8%
23.8%
68.4%
13.0%
25.5%
61.5%
6.6%
25.7%
67.7%
14.3%
16.8%
68.9%
Beban Cadangan Kerugian Penurunan Nilai atas Aset Keuangan dan LainnyaBeban cadangan kerugian penurunan nilai atas aset keuangan dan lainnya Bank OCBC NISP berasal dari pinjaman yang diberikan, efek-efek, tagihan akseptasi, aset lain-lain - tagihan transaksi letter of credit dan pembentukan penyisihan lainnya yang dijabarkan sebagai berikut:
(Dalam Miliar Rupiah, kecuali %) (In Billion Rupiah, except %)
Pembentukan/(Pembalikan)Cadangan Kerugian Penurunan NilaiAset Keuangan dan Lainnya
2014 2013 Δ % Allowance/(Reversal) for ImpairmentLosses on Financial Assets and Others
Efek-efek 5 (2) 395.2 Marketable securitiesPinjaman yang diberikan 222 273 (18.6) LoansTagihan akseptasi (10) 22 (143.8) Acceptance receivableAset lain-lain - tagihan transaksiLetter of Credit 6 4 63.1 Other assets - Letter of Credit
transaction receivablesPenyisihan lainnya (2) (38) 96.0 Allowance of possible losses - OthersTotal 221 259 (14,6) Total
cards in respective amounts of Rp 36 billion, Rp 19 billion, Rp 10 billion, Rp 9 billion, Rp 4 billion and Rp 2 billion, and compensated by lower income from e-channel of Rp 3 billion.
Accordingly, the ratio of other operating income to total income decreased from 21.9% in 2013 to 16.6% in 2014.
Allowance for Impairment Losses on Financial and Other AssetsThe Bank’s allowance for impairment losses on financial and other assets is derived from loans, marketable securities, acceptance receivables, other assets, such as letter of credit transactions and other allowances, described as follows:

436 OCBC NISP Laporan Tahunan 2014
Walaupun jumlah kredit bermasalah (NPL) secara absolut naik sebesar Rp 446 miliar di tahun 2014, beban cadangan kerugian atas aset keuangan dan lainnya pada tahun 2014 secara keseluruhan turun sebesar Rp 38 miliar atau 14,6% menjadi sebesar Rp 221 miliar, dibandingkan dengan tahun 2013 sebesar Rp 259 miliar. Penurunan tersebut terutama didorong oleh pertumbuhan kredit yang melambat seiring dengan perlambatan pertumbuhan industri.
(Dalam Miliar Rupiah, kecuali %) (In Billion Rupiah, except %)
Beban Cadangan Kerugian Penurunan NilaiAset Keuangan (Di luar beban cadangankerugian penurunan nilai aset yang tidakproduktif lainnya)
2014 2013 Δ %Allowance for Impairment Losses on Financial
Assets (Excluded Allowance for ImpairmentLosses-Others)
Kredit 222 273 (18.6) LoanNon Kredit 1 24 (95.8) Non LoanTotal 223 297 (25.0) Total
Beban Operasional LainnyaBeban operasional lainnya Bank OCBC NISP berasal dari beban gaji dan tunjangan, umum dan administrasi dan lain-lain yang dijabarkan sebagai berikut:
(Dalam Miliar Rupiah, kecuali %) (In Billion Rupiah, except %)
Beban Operasional Lainnya 2014 2013 Δ % Other Operating ExpensesGaji dan tunjangan 1,469 1,358 8.2 Salaries and benefitsUmum dan administrasi 923 798 15.7 General and administrativeLain-lain 98 59 64.6 OthersTotal 2,490 2,215 12.4 Total
Beban operasional lainnya tahun 2014 sebesar Rp 2,5 triliun, meningkat sebesar Rp 275 miliar atau 12,4% dibandingkan dengan tahun 2013 sebesar Rp 2,2 triliun, terutama disebabkan oleh meningkatnya beban gaji dan tunjangan sebesar Rp 111 miliar dan beban umum dan administrasi sebesar Rp 125 miliar.
(Dalam Miliar Rupiah, kecuali %) (In Billion Rupiah, except %)
Beban Gaji dan Tunjangan 2014 2013 Δ % Salaries and Benefit ExpensesGaji dan tunjangan 1,340 1,206 11.1 Salaries and allowancesPendidikan dan latihan 63 65 (2.2) Education and trainingImbalan pasca kerja 61 40 51.4 Post employment benefitsLain – lain 5 47 89.5 OthersTotal 1,469 1,358 8.2 Total
Kenaikan beban gaji dan tunjangan terutama dikontribusikan oleh penyesuaian gaji dan tunjangan karyawan pada tahun 2014 sebesar Rp 134 miliar dan beban imbalan pasca kerja sebesar Rp 21 miliar.
While the non-performing loans (NPL) in absolute amount increased by Rp 446 billion in 2014, allowance for impairment losses on financial assets and others in 2014 overall dropped by Rp 38 billion or 14.6% to Rp 221 billion, compared to Rp 259 billion in 2013. The decrease was primarily caused by lower credit growth in line with the slowdown of industry growth.
Other Operating ExpensesBank OCBC NISP’s other operating expenses are derived from salaries and benefits, general and administrative expenses, and other expenses described as follows:
In 2014, other operating expenses amounted to Rp 2.5 trillion, increasing by Rp 275 billion or 12.4% compared to Rp 2.2 trillion in 2013, mainly due to increasing salaries and benefits of Rp 111 billion, as well as general and administrative expenses and other expenses of Rp 125 billion.
During 2014, the increase in salaries and allowance was mainly contributed by the adjustment of salaries and allowance in the amount of Rp 134 billion and a post employment benefits increase of Rp 21 billion.

437OCBC NISP 2014 Annual ReportO
CBC NISP in Brief
From M
anagement
Good Corporate G
overnanceBusiness Review
Financial ReviewCorporate D
ata
(Dalam Miliar Rupiah, kecuali %) (In Billion Rupiah, except %)
Beban Umum dan Administrasi 2014 2013 Δ % General and Administrative ExpensesPemeliharaan, perbaikan dantransportasi 203 165 23.2 Repairs, maintenance and
transportationPenyusutan aset tetap 163 150 8.6 Depreciation of fixed assetsSewa 102 89 15.7 RentalKomunikasi 80 69 15.9 CommunicationsAsuransi 78 62 27.7 InsurancePromosi 72 63 13.8 PromotionsListrik, air, telepon dan fax 68 61 12.0 UtilitiesKeamanan dan Outsourcing 44 35 24.1 Security and outsourcingAlat-alat kantor 18 16 13.3 Office suppliesEkspedisi 8 8 (3.0) Courier chargesPenelitian dan pengembangan 6 7 (16.2) Research and developmentLain-lain 81 73 9.8 OthersTotal 923 798 15.7 Total
Sedangkan untuk kenaikan beban umum dan administrasi terutama dikontribusikan oleh meningkatnya beban pemeliharaan, perbaikan dan transportasi sebesar Rp 38 miliar, beban asuransi sebesar Rp 16 miliar, beban sewa sebesar Rp 13 miliar, beban komunikasi sebesar Rp 11 miliar serta beban penyusutan aset tetap sebesar Rp 13 miliar, yang antara lain berupa depresiasi gedung kantor dan sarana penunjang.
Rasio biaya operasional terhadap total pendapatan operasional (Cost to Income Ratio) tercatat sebesar 55,5% pada tahun 2014 dibandingkan dengan tahun 2013 sebesar 55,1%. Peningkatan ini terutama disebabkan pada tahun 2014, pertumbuhan beban operasional lainnya yaitu sebesar 12,4%, lebih tinggi dibandingkan pertumbuhan total pendapatan operasional sebesar 11,7% akibat penurunan pendapatan operasional lainnya.
Beban Operasional Lainnya & Rasio Beban terhadap PendapatanOther Operating Expenses & Cost to Income RatioRp Miliar, kecuali %Rp Billion, except %
Gaji dan TunjanganGaji dan Tunjangan
Umum dan AdministrasiGeneral and Administration
LainnyaOthers
Rasio Beban terhadap PendapatanCost to Income Ratio
55.5%
2,490
2014
62.4%
1,594
2010
57.1%
1,942
2012
55.1%
2,215
2013
58.6%
2011
1,703
3.9%
37.1%
59.0%
2.7%
36.0%
61.3%
2.9%
36.7%
60.4%
2.7%
41.2%
56.1% 55.7%
3.2%
41.1%
Meanwhile, the increase in general and administrative expenses was mainly contributed by higher expenses for repairs, maintenance and transportation in the amount of Rp 38 billion, insurance expenses of Rp 16 billion, rental expenses of Rp 13 billion, communication expenses of Rp 11 billion, and depreciation of fixed assets with Rp 13 billion, among others made up of depreciation of bank offices and supporting facilities.
Cost to income ratio, recording 55.5% in 2014 as compared to the level of 55.1% in 2013. This increase was primarily because in 2014, the growth of other operating expenses at 12.4% was still higher than the growth of total operating income of 11.7% as a result of the decline in other operating income.

438 OCBC NISP Laporan Tahunan 2014
Non Operating Income/(Expense) - NetIn 2014, non-operating income - net reached Rp 4 million, compared to non-operating expenses - net of Rp 14 billion recorded in 2013, mainly attributed to a gain from sale of fixed assets of Rp 2 billion in 2014 which offset by loss from sale of foreclosed collateral and other expenses respectively of Rp 1 billion in 2014.
Income Before TaxIn 2014, income before tax reached Rp 1.8 trillion, increasing by Rp 247 billion or 16.1% compared to 2013 income before tax of Rp 1.5 trillion. This was primarily due to a 19.3% increase in net interest income, although other operating income declined by 15.4% while other operating expenses increased by 12.4%. Another factor contributing to the increase in income was the allowance for impairment losses on financial assets and others, which was lower by 14.6%. For 2014, the 16.1% growth in income before tax and 5.7% growth in assets resulted in ROA remained at 1.8% in both 2014 and 2013.
Pendapatan/(Beban) Bukan Operasional - BersihPendapatan bukan operasional - bersih tercatat sebesar Rp 4 juta pada tahun 2014, dibandingkan dengan beban bukan operasional - bersih sebesar Rp 14 miliar pada tahun 2013, terutama didorong oleh keuntungan penjualan aset tetap sebesar Rp 2 miliar yang diimbangi oleh kerugian penjualan agunan yang diambil alih (AYDA) dan beban lainnya masing-masing sebesar Rp 1 miliar pada tahun 2014.
(Dalam Miliar Rupiah, kecuali %) (In Billion Rupiah, except %)
Pendapatan/(Beban)Bukan Operasional - Bersih 2014 2013 Δ % Non Operating
Income/(Expenses) – NetKeuntungan dari penjualan aset tetap 2 - 656.5 Gain from sale of fixed assetsKeuntungan/(kerugian) penjualanagunan yang diambil alih (1) (15) (96.8) Gain/(loss) from sale foreclosed
CollateralPendapatan lainnya – bersih (1) 1 (311.9) Others income – netTotal - (14) (100.0) Total
Laba Sebelum PajakLaba sebelum pajak mencapai Rp 1,8 triliun pada tahun 2014, naik sebesar Rp 247 miliar atau 16,1% dibandingkan dengan tahun 2013 sebesar Rp 1,5 triliun. Hal tersebut terutama akibat meningkatnya pendapatan bunga bersih sebesar 19,3%, walaupun pendapatan operasional lainnya mengalami penurunan sebesar 15,4% dan kenaikan beban operasional lainnya sebesar 12,4%. Peningkatan laba sebelum pajak juga dikontribusikan dari beban cadangan kerugian nilai atas aset keuangan dan lainnya yang menurun sebesar 14,6%. Kenaikan laba sebelum pajak sebesar 16,1% yang diikuti dengan kenaikan aset sebesar 5,7% di tahun 2014 mengakibatkan ROA berada pada 1,8% pada tahun 2014 dan 2013.
Laba sebelum Pajak PenghasilanIncome Before TaxRp Miliar, kecuali %Rp Billion, except %
Laba sebelum Pajak PenghasilanIncome Before Tax
Imbal hasil atas Aset (ROA)Return on Assets (ROA)
1,530
1,777
1,222
567
2010 201320122011 2014
1.9%
1.3%
1.8%1.8% 1.8%
1,006