15 ciima 7-2-07 yang-tsai 115-126
TRANSCRIPT
8/12/2019 15 CIIMA 7-2-07 Yang-Tsai 115-126
http://slidepdf.com/reader/full/15-ciima-7-2-07-yang-tsai-115-126 1/12
General E-S-QUAL Scales Applied to Websites Satisfaction and Loyalty Model Yang & Tsai
Communications of the IIMA 115 2007 Volume 7 Issue 2
General E-S-QUAL Scales Applied To Websites Satisfaction and
Loyalty Model
Hao-erl Yang
Department of Business Management,Tatung University, Taipei, Taiwan
Feng-Shii TsaiProduct Development Division
Giantec Inc., Taipei, Taiwan
ABSTRACT
This study considers E-S-QUAL and E-RecS-QUAL, the newly developed multiple-item scales for
assessing electronic service quality (e-SQ) in E-commerce, as the antecedents to Website satisfaction and
assesses their effects on online consumer satisfaction and loyalty. Using online survey data from those
who had nonroutine encounters with Websites, this study examines and validates the effectiveness of the
e-SQ in explaining the variance in the e-shoppers’ satisfaction and loyalty. The study results show that
both E-S-QUAL and E-RecS-QUAL have strong and equal effects on satisfaction and loyalty, and all
dimensions of these two constructs are important and influential factors to online satisfaction and loyalty.
In addition, the mediating role of online satisfaction was assessed by using a structural equation modeling
program when latent variables were included in the model. The findings constitute a contribution to, and
extension of, the literature in the application of the e-SQ to Website service loyalty model and e-store
management.
INTRODUCTION
The role of service quality has been emphasized and comprehensively studied in services literature during the last 20
years (Fisk et al., 1993; Pitt et al., 1995; Parasuraman and Zeithaml, 2002). Traditionally, the SERVQUAL, a
multiple item instrument, and its adaptations have been used to assess customer-perceived service quality, which has
been validated as an important determinant in E-commerce channel satisfaction (Devaraj et al., 2002). With theincreasing use of online shopping, the SERVQUAL instrument, recently, has been refined and validated to measure
electronic service quality (e-SQ) delivered by Websites. However, few scholarly articles address directly with how
customers assess e-SQ and its consequence (Parasuraman et al., 2005). Using conventional guidelines for scale
development, Parasuraman et al. (2005) developed and validated a multiple-item scale for measuring e-SQ in onlineshopping contexts. Two different scales were derived for capturing e-SQ. The basic E-S-QUAL scale consists of 22
items on four dimensions: efficiency, fulfillment, system availability, and privacy, are used to assess the ease andspeed of using Website, the implementation of the site’s promises, the correct technical functioning of the site, and
the safety of the site and the protection of customer information, respectively. The second scale, E-RecS-QUAL,
containing 11 items in three dimensions: responsiveness, compensation, and contact, are employed when customer
had nonroutine encounters to measure the effectiveness of handling problems and return, compensation for
problems, and availability of assistance, respectively. Without any question the Internet is becoming an importantand powerful way to distribute goods and services over the last decade. There are increasing number of firms using
the Internet as the new distribution channel, and many with great success. In addition to system quality and
information quality, service quality has been considered and evidenced as an important factor in measuring
information systems (IS) success and a pivotal antecedent to customer satisfaction in online shopping environment(Pitt et al., 1995; Rodgers et al., 2005).
8/12/2019 15 CIIMA 7-2-07 Yang-Tsai 115-126
http://slidepdf.com/reader/full/15-ciima-7-2-07-yang-tsai-115-126 2/12
General E-S-QUAL Scales Applied to Websites Satisfaction and Loyalty Model Yang & Tsai
Communications of the IIMA 116 2007 Volume 7 Issue 2
The importance of loyalty has been emphasized recently because loyal customers may be worth up to ten times as
much as its average customer and bring many benefits to a seller and be considered one of the critical indicators
used to measure the success of marketing strategy (Anderson & Srinivasan, 2003; Yoon & Uysal, 2005). Most
companies try their best to continually satisfy their customers and develop long-run relationships with them.
Without customer loyalty, even the best-designed e-business model will soon fall apart. Meanwhile, customersatisfaction seems to be an important barometer of customer’s behavioral intentions and has been regarded as an
important antecedent of loyalty (Anderson & Srinivasan, 2003; Yang &Yeh, 2006) . In recent marketing research,
the measures of perceived quality, satisfaction, and loyalty on behalf of customers have been used to assess firm’s productivity and its marketing performance (Cortinas et al., 2004). Although the relationship between satisfaction
and loyalty seems almost intuitive, the relationship has been found vary significantly under different conditions
(Anderson & Srinivasan, 2003). Online service quality may impact e-tail success through online customersatisfaction and loyalty (Weathers and Makienko, 2006). Consumer satisfaction has been the subject of much
attention in the literature because of its potential influence on consumer behavioral intention and customer retention
(Cronin, Jr. et al., 2000). Similarly, in a B2C channel satisfaction model, satisfaction is considered as an important
construct because it affects participants’ motivation to stay with the channel (Devaraj et al., 2002).An understanding
the role, specifically, the mediating role of the satisfaction in the model including perceived quality, satisfaction, andloyalty must be a basic parameter used to evaluate the performance of products and services (Yoon and Uysal, 2005).
Few studies have investigated these issues in an online shopping service context, so this study employs the extended
model as a conceptual framework to examine the effects of e-SQ on Website consumer satisfaction and loyalty andexplain consumers’ behavioral intentions (Anderson & Srinivasan, 2003). The purposes of this paper are:
1. Based on the general online satisfaction and loyalty model to hypothesize a model by using Parasuraman et al.’s
E-S-QUAL and E-RecS-QUAL scales as the constructs of e-SQ and test the model with empirical data.
2. To investigate the relative importance of the dimensions contained in E-S-QUAL and E-RecS-QUAL scales
affecting e-shopping satisfaction and loyalty.
3. To assess the mediating effects of customer satisfaction in the online loyalty model including latent constructs.
The study considers E-S-QUAL and E-RecS-QUAL, the newly developed multiple-item scales, as the antecedents
to Website satisfaction and assesses their effects on online consumer satisfaction and loyalty. Using online surveydata from online shoppers who had nonroutine encounters with the Websites, the study examined and validated the
effectiveness of the e-SQ in explaining the variance in the e-shoppers’ satisfaction and loyalty. The findings
constitute a contribution to, and extension of, the literature in the application of the e-SQ to Website servicesatisfaction model and e-store management.
METHOD AND RESULTS
Conceptual Framework And Research Hypotheses
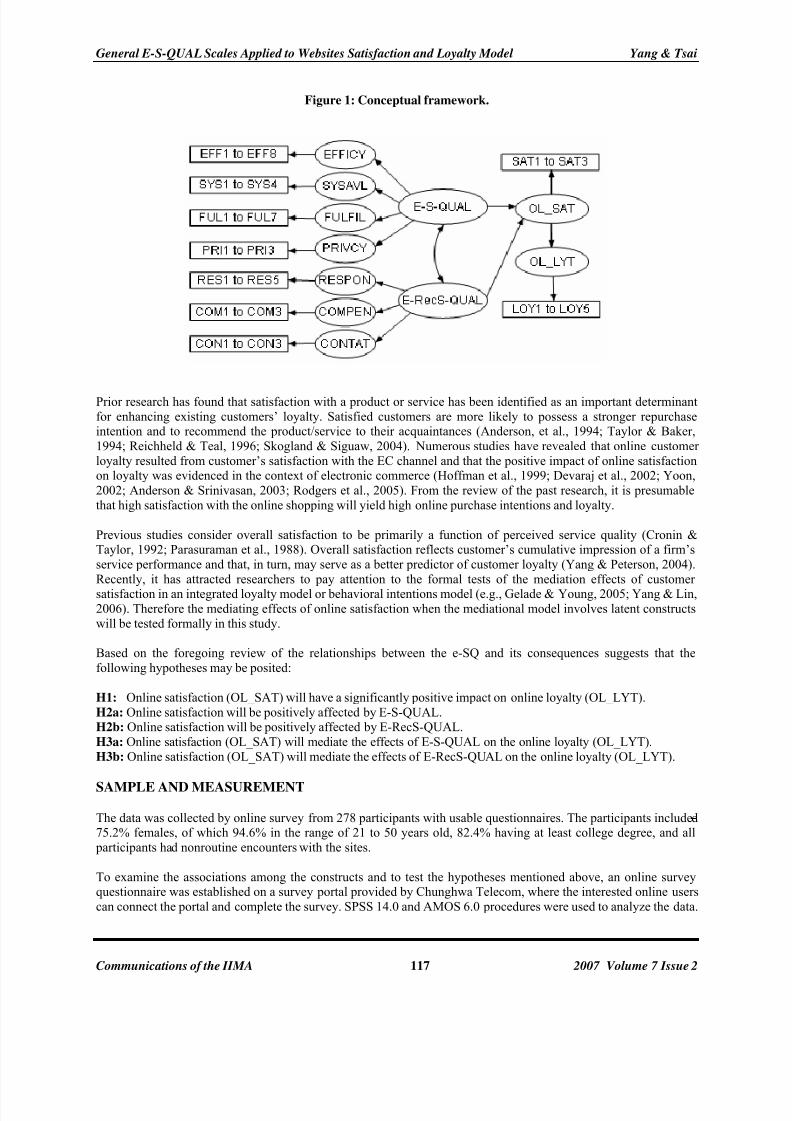
The conceptual framework linking e-SQ, customer satisfaction, and loyalty is presented in Figure 1, where we treat
E-S-QUAL construct of the e-SQ as a second-order latent construct as suggested by Parasuraman et at.(2005) and
add E-RecS-QUAL construct in the model. It is intended to explain the two antecedents that affect Websitessatisfaction and the consequences of customer satisfaction. The dimensions from E-S-QUAL and E-RecS-QUAL are
used as the lens to examine online consumer satisfaction and loyalty. Recent research revealed that the measures of
perceived quality, satisfaction, and loyalty on behalf of customers have been used to assess firm’s productivity andits marketing performance (Cortinas et al., 2004). An understanding of customer satisfaction must be a basic
parameter used to evaluate the performance of products and services (Yoon & Uysal, 2005). Consumer satisfaction
has been the subject of much attention in the literature because of its potential influence on consumer behavioral
intention and customer retention (Cronin, Jr. et al., 2000). Similarly, in a B2C channel satisfaction model,
satisfaction is considered as an important construct because it affects participants’ motivation to stay with thechannel (Devaraj et al., 2002).The extant literature suggests that service quality is strongly related to online
satisfaction (Carr, 2002; Devaraj et al., 2002).
8/12/2019 15 CIIMA 7-2-07 Yang-Tsai 115-126
http://slidepdf.com/reader/full/15-ciima-7-2-07-yang-tsai-115-126 3/12
General E-S-QUAL Scales Applied to Websites Satisfaction and Loyalty Model Yang & Tsai
Communications of the IIMA 117 2007 Volume 7 Issue 2
Figure 1: Conceptual framework.
Prior research has found that satisfaction with a product or service has been identified as an important determinant
for enhancing existing customers’ loyalty. Satisfied customers are more likely to possess a stronger repurchaseintention and to recommend the product/service to their acquaintances (Anderson, et al., 1994; Taylor & Baker,
1994; Reichheld & Teal, 1996; Skogland & Siguaw, 2004). Numerous studies have revealed that online customer
loyalty resulted from customer’s satisfaction with the EC channel and that the positive impact of online satisfactionon loyalty was evidenced in the context of electronic commerce (Hoffman et al., 1999; Devaraj et al., 2002; Yoon,
2002; Anderson & Srinivasan, 2003; Rodgers et al., 2005). From the review of the past research, it is presumable
that high satisfaction with the online shopping will yield high online purchase intentions and loyalty.
Previous studies consider overall satisfaction to be primarily a function of perceived service quality (Cronin &Taylor, 1992; Parasuraman et al., 1988). Overall satisfaction reflects customer’s cumulative impression of a firm’s
service performance and that, in turn, may serve as a better predictor of customer loyalty (Yang & Peterson, 2004).
Recently, it has attracted researchers to pay attention to the formal tests of the mediation effects of customer
satisfaction in an integrated loyalty model or behavioral intentions model (e.g., Gelade & Young, 2005; Yang & Lin,2006). Therefore the mediating effects of online satisfaction when the mediational model involves latent constructs
will be tested formally in this study.
Based on the foregoing review of the relationships between the e-SQ and its consequences suggests that the
following hypotheses may be posited:
H1: Online satisfaction (OL_SAT) will have a significantly positive impact on online loyalty (OL_LYT).
H2a: Online satisfaction will be positively affected by E-S-QUAL.H2b: Online satisfaction will be positively affected by E-RecS-QUAL.
H3a: Online satisfaction (OL_SAT) will mediate the effects of E-S-QUAL on the online loyalty (OL_LYT).
H3b: Online satisfaction (OL_SAT) will mediate the effects of E-RecS-QUAL on the online loyalty (OL_LYT).
SAMPLE AND MEASUREMENT
The data was collected by online survey from 278 participants with usable questionnaires. The participants included75.2% females, of which 94.6% in the range of 21 to 50 years old, 82.4% having at least college degree, and all
participants had nonroutine encounters with the sites.
To examine the associations among the constructs and to test the hypotheses mentioned above, an online surveyquestionnaire was established on a survey portal provided by Chunghwa Telecom, where the interested online users
can connect the portal and complete the survey. SPSS 14.0 and AMOS 6.0 procedures were used to analyze the data.
8/12/2019 15 CIIMA 7-2-07 Yang-Tsai 115-126
http://slidepdf.com/reader/full/15-ciima-7-2-07-yang-tsai-115-126 4/12
General E-S-QUAL Scales Applied to Websites Satisfaction and Loyalty Model Yang & Tsai
Communications of the IIMA 118 2007 Volume 7 Issue 2
Since outliers often have dramatic effects on the fitted model, the researchers identified outlying observations first.
In order to test the hypotheses, this study relied on three sets of constructs and their indicators. All indicators came
from the items in a survey questionnaire designed with a 7-point scale from strongly disagree (1) to strongly agree
(7). The items, given in Appendix, that were validated in prior studies were used with minor wording modification
to apply to an online shopping context (e.g., Devaraj et al., 2002; Park & Kim, 2003; Parasuraman et al., 2005).
E-S-QUAL was conceptualized as a second-order model of four constructs, which were assessed by four
dimensions: efficiency (measured by eight items, EFF1 ~ EFF8, Cronbach’s alpha α=0.925), fulfillment (sevenitems, FUL1 ~ FUL7, α=0.941), system availability (four items, SYS1 ~ SYS4, α=0.868), and privacy (three items,
PRI1 ~ PRI3, α=0.916). Similarly E-RecS-QUAL was assessed by 11 items in three dimensions: responsiveness
(five items, RES1 ~ RES5, α=0.921), compensation (three items, COM1 ~ COM3, α=0.805), and contact (threeitems, CON1 ~ CON3, α=0.900). Online satisfaction (OL_SAT) was measured by three items (SAT1 ~ SAT3,
α=0.926) and online loyalty (OL_LYT) by five items (LOY1 ~ LOY5, α=0.947). The reliability of measures
(Cronbach’s alpha) for the constructs ranged from 0.805 (compensation) to 0.947 (B2CLTY), exceeding the
generally accepted level of 0.7 (Nunnally & Bernstein, 1994) and demonstrating high internal consistency and hence
reliability of each dimension.
After examining the data, no severe cases were identified as outliers from multivariate perspective with the
Mahalanobis D2 measure (all ratios of D2/df 4.0) (Hair et al., 2006). The maximum likelihood method used in thisstudy can be deployed for the data with minor deviations from normality (Wisner, 2003), even when the data deviate
moderately from a normal distribution (Chou & Bentler, 1995). Consequently, a simple check of normality, i.e., a P-P plot for each variable used in the model, was conducted and the data appeared to be approximately normally
distributed. Besides, the univariate skewness and kurtosis for all items in the sample were checked and they wereranging from –0.180 (COM2) to –1.492 (COM2) for skewness and –0.759 (COM2) to 3.180 (SAT1) for kurtosis,
within the maximum limits of an absolute value of two for skewness and seven for kurtosis recommended by West
et al. (1995). We also checked the multicollinearity when a total of 41 indicators for nine constructs in the
questionnaire were analyzed together in the model. The results indicated that the variance of inflation factors (VIFs)
ranging from 1.99(COM3) to 8.16 (FUL2), which did not exceed the recommended threshold of 10 (Kline, 2005;Kutner et al., 2005) and all variables were kept in the proposed model for further analysis.
Although the items used as the indicators to measure the constructs in this study were based on related literaturereview, tests of convergent validity, discriminant validity, and reliability were important for establishing construct
validity (Ahire et al., 1996; Tu et al., 2001). Anderson and Gerbing’s (1988) recommendations were followed first in
evaluating and refining the measurement model prior to the simultaneous estimation of the measurement andstructural models. Then, confirmatory factor analysis (CFA) was used to check construct validity of themeasurement model, combining the nine constructs with more precise test (Byrne, 1998).
A confirmatory factor analysis (CFA) was conducted to assess the measurement model, including nine constructs
with multiple indicators and refined according to the modification indices allowing some pairs of error terms to havenon-zero covariance. Since the generally used goodness-of-fit indices such as χ 2 , Goodness-of-Fit Index(GFI) and
Adjusted Goodness-of-Fit Index (AGFI) are considerably influenced by variations in sample size and nonnormality
of the variables, current researchers recommend that a model reporting the relative chi-square χ 2/df and the morerobust measures such as Comparative Fit Index (CFI), Tucker-Lewis Index (TLI), and the Root Mean Square Error
of Approximation (RMSEA) will often provide sufficient unique information to evaluate a model ( Varki and
Colgate, 2001; Hair et al, 2006). The measurement model fit showed that the ratio χ 2/df=2.341 (<5), CFI=0.91,
TFI=0.90, IFI=0.91 (>0.9), and RMSEA=0.07 (<0.07), met the generally recommended threshold levels. The results
revealed that all standardized factor loadings were statistically significant at p<0.000 and each individual item’scoefficient was greater than twice its standard error, reflecting that the items represent their corresponding
underlying construct (see appendix). The composite reliability values, weighted by factor loadings, ranging from
0.83 (COMPEN) to 0.95 (OL_LYT), exceeded the often used practical level of 0.70, indicating an acceptable
internal consistency for each construct (Nunnally & Bernstein, 1994; Hair et al., 2006). The average variance-extracted estimates (AVE), ranging from 0.61(EFFICY) to 0.81(OL_SAT), exceeded the 0.50 lower limit (Fornell &
Larcker, 1981; Hair et al., 2006). All the three evidences supported the convergent validity of the items as measuresof their respective underlying constructs.
8/12/2019 15 CIIMA 7-2-07 Yang-Tsai 115-126
http://slidepdf.com/reader/full/15-ciima-7-2-07-yang-tsai-115-126 5/12
General E-S-QUAL Scales Applied to Websites Satisfaction and Loyalty Model Yang & Tsai
Communications of the IIMA 119 2007 Volume 7 Issue 2
To test discriminant validity, each possible pair of constructs by constraining the estimated correlation parameter
between them to 1.0 was assessed. All the differences in χ 2 values for the fixed and free solutions were significant at
p<0.000 indicating the existence of discriminant validity of any two constructs. However, this is a necessary
condition; a complementary method was also used to assess the discriminant validity. In the measurement model,
the confidence interval (± two standard errors) around the correlation estimate between any two constructs did notinclude 1.0; the discriminant validity is evidenced (Anderson & Gerbing, 1988). The results of the CFA model
suggest a high statistical measurement quality associated with the nine constructs.
One-factor confirmatory factor analysis was used to test the potential common method variance in survey research
(Devaraj et al., 2002; Boyer & Hult., 2005). The results of one-factor model yielded a χ 2 =5423.63 and df=780
compared with the χ 2 =1706.93 and df=729 for the measurement model. The significant difference Δχ 2=3716.7 withdf=51 (p<0.000) indicates that the fit is considerably worse for one-factor model than for the measurement model
suggesting that common method variance is not a threat to the analysis and interpretation of the data.
RESULTS
Hypotheses Testing
A structural equation modeling (SEM) using AMOS 6.0 tested the model presented in Figure 1. The estimated
model includes two second-order exogenous measurement models and two endogenous measurement models and
paths among latent constructs. The proposed model fit showed that all goodness-of-fit indices such as, the ratioχ
2/df=2.394, CFI=0.91, TFI=0.90, and RMSEA=0.07, met the generally recommended threshold levels suggested
that the proposal model fitted the data well and the hypothesized relationships were tested. The results revealed that
all standardized factor loadings were statistically significant at p<0.000.
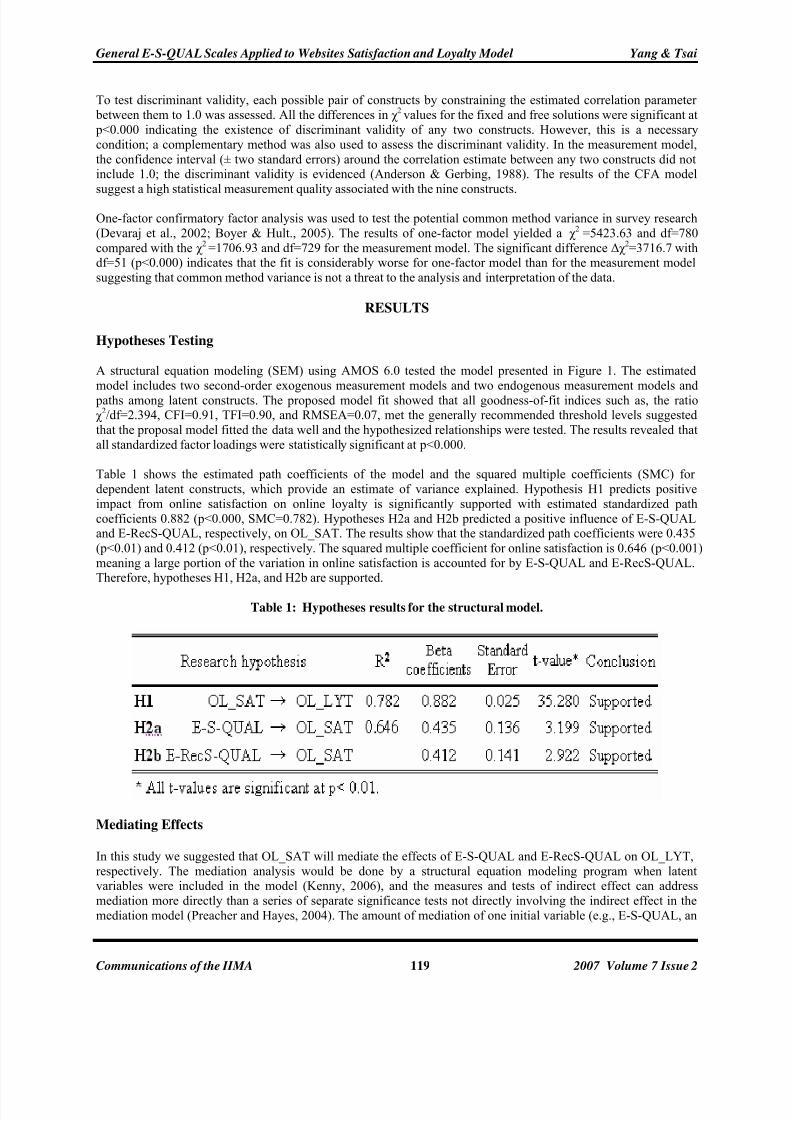
Table 1 shows the estimated path coefficients of the model and the squared multiple coefficients (SMC) for
dependent latent constructs, which provide an estimate of variance explained. Hypothesis H1 predicts positive
impact from online satisfaction on online loyalty is significantly supported with estimated standardized path
coefficients 0.882 (p<0.000, SMC=0.782). Hypotheses H2a and H2b predicted a positive influence of E-S-QUALand E-RecS-QUAL, respectively, on OL_SAT. The results show that the standardized path coefficients were 0.435
(p<0.01) and 0.412 (p<0.01), respectively. The squared multiple coefficient for online satisfaction is 0.646 (p<0.001)
meaning a large portion of the variation in online satisfaction is accounted for by E-S-QUAL and E-RecS-QUAL.Therefore, hypotheses H1, H2a, and H2b are supported.
Table 1: Hypotheses results for the structural model.
Mediating Effects
In this study we suggested that OL_SAT will mediate the effects of E-S-QUAL and E-RecS-QUAL on OL_LYT,
respectively. The mediation analysis would be done by a structural equation modeling program when latentvariables were included in the model (Kenny, 2006), and the measures and tests of indirect effect can address
mediation more directly than a series of separate significance tests not directly involving the indirect effect in the
mediation model (Preacher and Hayes, 2004). The amount of mediation of one initial variable (e.g., E-S-QUAL, an
8/12/2019 15 CIIMA 7-2-07 Yang-Tsai 115-126
http://slidepdf.com/reader/full/15-ciima-7-2-07-yang-tsai-115-126 6/12
General E-S-QUAL Scales Applied to Websites Satisfaction and Loyalty Model Yang & Tsai
Communications of the IIMA 120 2007 Volume 7 Issue 2
antecedent of the mediator OL_SAT) can be estimated by the indirect effect of the initial variable when adding the
path from the initial variable to the so-called outcome variable (i.e., OL_LYT), while controlling the mediator and
the other initial variable (i.e., E-RecS-QUAL) as covariate in the mediation model (Kenny, 2006). In the mediation
model the total effect can be used to estimate the direct effect of the initial variable on the outcome variable when
the model does not include the mediator. If the total effect of the initial variable is significant meaning that there isan effect that can be mediated. In addition, if the direct effect is not significant, the mediator has a complete
mediating effect on the relationship between the initial variable and the outcome variable. If the direct effect is
significant, the mediator has a partial mediating effect on the relationship between the initial variable and theoutcome variable.
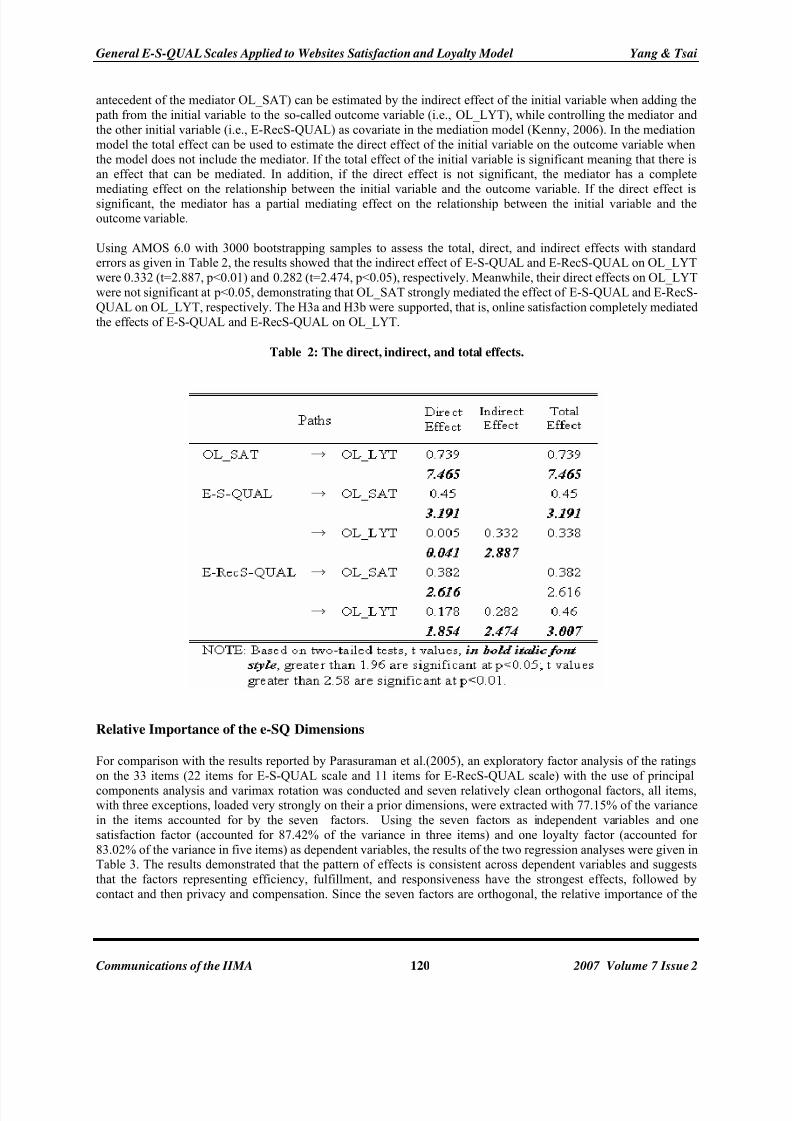
Using AMOS 6.0 with 3000 bootstrapping samples to assess the total, direct, and indirect effects with standarderrors as given in Table 2, the results showed that the indirect effect of E-S-QUAL and E-RecS-QUAL on OL_LYT
were 0.332 (t=2.887, p<0.01) and 0.282 (t=2.474, p<0.05), respectively. Meanwhile, their direct effects on OL_LYT
were not significant at p<0.05, demonstrating that OL_SAT strongly mediated the effect of E-S-QUAL and E-RecS-
QUAL on OL_LYT, respectively. The H3a and H3b were supported, that is, online satisfaction completely mediated
the effects of E-S-QUAL and E-RecS-QUAL on OL_LYT.
Table 2: The direct, indirect, and total effects.
Relative Importance of the e-SQ Dimensions
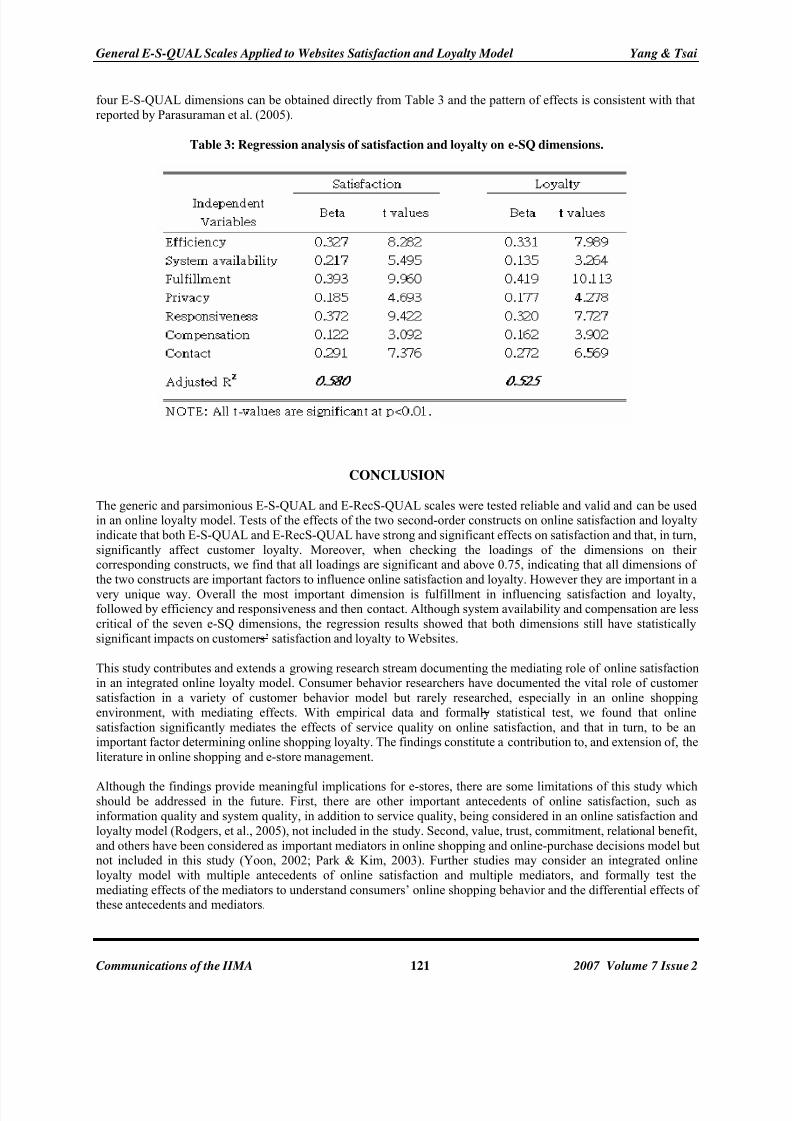
For comparison with the results reported by Parasuraman et al.(2005), an exploratory factor analysis of the ratings
on the 33 items (22 items for E-S-QUAL scale and 11 items for E-RecS-QUAL scale) with the use of principal
components analysis and varimax rotation was conducted and seven relatively clean orthogonal factors, all items,with three exceptions, loaded very strongly on their a prior dimensions, were extracted with 77.15% of the variance
in the items accounted for by the seven factors. Using the seven factors as independent variables and one
satisfaction factor (accounted for 87.42% of the variance in three items) and one loyalty factor (accounted for
83.02% of the variance in five items) as dependent variables, the results of the two regression analyses were given inTable 3. The results demonstrated that the pattern of effects is consistent across dependent variables and suggests
that the factors representing efficiency, fulfillment, and responsiveness have the strongest effects, followed by
contact and then privacy and compensation. Since the seven factors are orthogonal, the relative importance of the
8/12/2019 15 CIIMA 7-2-07 Yang-Tsai 115-126
http://slidepdf.com/reader/full/15-ciima-7-2-07-yang-tsai-115-126 7/12
General E-S-QUAL Scales Applied to Websites Satisfaction and Loyalty Model Yang & Tsai
Communications of the IIMA 121 2007 Volume 7 Issue 2
four E-S-QUAL dimensions can be obtained directly from Table 3 and the pattern of effects is consistent with that
reported by Parasuraman et al. (2005).
Table 3: Regression analysis of satisfaction and loyalty on e-SQ dimensions.
CONCLUSION
The generic and parsimonious E-S-QUAL and E-RecS-QUAL scales were tested reliable and valid and can be usedin an online loyalty model. Tests of the effects of the two second-order constructs on online satisfaction and loyalty
indicate that both E-S-QUAL and E-RecS-QUAL have strong and significant effects on satisfaction and that, in turn,
significantly affect customer loyalty. Moreover, when checking the loadings of the dimensions on theircorresponding constructs, we find that all loadings are significant and above 0.75, indicating that all dimensions of
the two constructs are important factors to influence online satisfaction and loyalty. However they are important in a
very unique way. Overall the most important dimension is fulfillment in influencing satisfaction and loyalty,followed by efficiency and responsiveness and then contact. Although system availability and compensation are less
critical of the seven e-SQ dimensions, the regression results showed that both dimensions still have statistically
significant impacts on customers’ satisfaction and loyalty to Websites.
This study contributes and extends a growing research stream documenting the mediating role of online satisfactionin an integrated online loyalty model. Consumer behavior researchers have documented the vital role of customer
satisfaction in a variety of customer behavior model but rarely researched, especially in an online shopping
environment, with mediating effects. With empirical data and formally statistical test, we found that online
satisfaction significantly mediates the effects of service quality on online satisfaction, and that in turn, to be animportant factor determining online shopping loyalty. The findings constitute a contribution to, and extension of, the
literature in online shopping and e-store management.
Although the findings provide meaningful implications for e-stores, there are some limitations of this study whichshould be addressed in the future. First, there are other important antecedents of online satisfaction, such as
information quality and system quality, in addition to service quality, being considered in an online satisfaction and
loyalty model (Rodgers, et al., 2005), not included in the study. Second, value, trust, commitment, relational benefit,
and others have been considered as important mediators in online shopping and online-purchase decisions model butnot included in this study (Yoon, 2002; Park & Kim, 2003). Further studies may consider an integrated online
loyalty model with multiple antecedents of online satisfaction and multiple mediators, and formally test the
mediating effects of the mediators to understand consumers’ online shopping behavior and the differential effects ofthese antecedents and mediators.
8/12/2019 15 CIIMA 7-2-07 Yang-Tsai 115-126
http://slidepdf.com/reader/full/15-ciima-7-2-07-yang-tsai-115-126 8/12
General E-S-QUAL Scales Applied to Websites Satisfaction and Loyalty Model Yang & Tsai
Communications of the IIMA 122 2007 Volume 7 Issue 2
REFERENCES
Ahire, S. L., Golhar, D. Y. & Walter, M. A. (1996). Development and Validation of TQM, Implementation
Constructs. Decision Science, 27 (1), 21-56.
Anderson, E. W., Fornell, C. & Lehman, D. (1994). Customer Satisfaction, Market Share, and Profitability:
Findings from Sweden, Journal of Marketing, 58 , 53-66.
Anderson, J. C. & Gerbing, D. W. (1988). Structural Equation Modeling in Practice: A Review and Recommended
Two-step Approach, Psychological Bulletin, 103(3), 411-423.
Anderson, R. E. & Srinivasan, S. S. (2003). E-satisfaction and E-loyalty: A Contingent Framework, Psychology &
Marketing, 20(2), 123–138.
Boyer, K. K. & Hult, G. T. M. (2005). Extending the Supply Chain: Integrating Operations and Marketing in the
Online Grocery Industry, Journal of Operations Management, 23, 642- 661.
Byrne, B. M. (1998). Structural Equation Modeling with LISREL, PRELIS, and SIMPLIS: Basic Concepts,
Applications, and Programming. NJ: Lawrence Erlbaum Associates, Inc.
Carr, C. L. (2002). A Psychometric Evaluation of the Expectation, Perception, and Difference-scores Generated bythe IS-adapted SERVQUAL Instrument, Decision Science, 33, 281-296.
Chou, C. P. & Bentler, P. M.(1995). Estimates and Tests in Structural Equation Modeling, In: Hoyle, R. H.
(Editors): Structural Equation Modeling. Thousand Oaks, CA: Sage Publications, 37-55.
Cortinas, M., Elorz, M. & Villanueva, M. L.(2004). Retail Store Loyalty Management Via an Analysis of
Heterogeneity of the Service Elements. Int. Rev. of Retail, Detail, Distribution, and consumer Research,
14(4), 407-436.
Cronin, Jr., J. J. & Taylor, S. A. (1992). Measuring Service Quality: A Reexamination and Extension, Journal of
Marketing, 56 , 55–68.
Cronin, Jr., J. J., Brady, M. K., & Hult, G. T. (2000). Assessing the Effects of Quality, Value, and Customer
Satisfaction on Consumer Behavioral Intentions in Service Environments. Journal of Retailing, 76 (2) 193-218.
Devaraj, F., Fan, M. & Kohli, R. (2002). Antecedents of B2C Channel Satisfaction and Preference: Validating E-
commerce Metrics, Information System Research, 13(3), 316-333.
Fisk, R. P., Brown, S. W., & Bitner, M. J. (1993). Tracking the Evolution of the Services Marketing Literature. Journal of Retail, 69(1), 61-103.
Fornell, C. & Larcker, D. F. (1981). Evaluating Structural Equations Models with Unobservable Variables and
Measurement Error, Journal of Marketing Research, 18 , 39-50.
Gelade, G. A. &Young, S. (2005). Test of a Service Profit Chain Model in the Retail Banking Sector, Journal of
occupational and organizational Psychology, 16 , 1-22.
Hair Jr., J. F., Black, W. C., Babin, B. J., Anderson, R. E. & Tatham, R. L. (2006). Multivariate Data Analysis 6th
ed. Upper Saddle River, NJ: Prentice-Hall.
Hoffman, D. L., Novak, T. P. & M. A. (1999). Peralta, Information privacy in the Market Space: Implications for
the Commercial Uses of Anonymity on the Web, Inform. Soc. 15(2), 129-139.
8/12/2019 15 CIIMA 7-2-07 Yang-Tsai 115-126
http://slidepdf.com/reader/full/15-ciima-7-2-07-yang-tsai-115-126 9/12
General E-S-QUAL Scales Applied to Websites Satisfaction and Loyalty Model Yang & Tsai
Communications of the IIMA 123 2007 Volume 7 Issue 2
Kenny, D. A. (2006, February 7). Mediation. Available at: http://davidakenny.net/cm/mediate.htm.
Kline, R. B. (2005). Principles and Practice of Structural Equation Modeling, 2nd ed. New York: The Guilford Press.
Kutner, M. H., Nachtsheim, C. J., Neter, J., & Li, W. (2005). Applied Statistical Models 5th ed. New York: McGraw-
Hill.
Nunnally, J. C. & Bernstein, I. H. (1994). Psychometric Theory 3rd
ed . New York: McGraw-Hill.
Parasuraman, A. & Zeithaml, V. A. (2002). Measuring and Improving Service Quality: a Literature Review and
Research Agenda, In Handbook of marketing, Bart Weitz, ed., Thousand Oaks, CA: Sage.
Parasuraman, A., Zeithaml, V. A. & Malhotra, A. (2005). E-S-QUAL: A Multiple-item Scale for AssessingElectronic Service Quality, Journal of Service Research, 7 (3), 213-233.
Parasuraman, A., Zeithaml, V. L. &. Berry, L. L (1988). SERVQUAL: A Multiple-item Scale for Measuring
Consumer Perceptions of Service Quality, Journal of Retailing, 64(1), 12-40.
Park, Chung-Hoon & Kim, Young-Gul (2003). Identifying key Factors Affecting Consumer Purchase Behavior inan Online Shopping Context, International Journal of Retail & Distribution Management, 31(1), 16-29.
Preacher, K. J.; Hayes, A. F. (2004). SPSS and SAS Procedures for Estimating Indirect Effects in Simple Mediation
Models, Behavior Research Methods, Instruments, & Computers. 36, 4, 717-731
Pitt, L. F., Watson, R. T. & Kavan, C. B. (1995). Service Euality: A Measure of Information Systems Effectiveness, MIS Quarterly, 19, 173-187.
Reichheld, F. F. & Teal, T. (1996). TheLoyalty Effect . Boston, MA: Harvard Business School press.
Rodgers, W., Negash, S. & Suk, K. (2005). The Moderating Effect of On-line Experience on the Antecedents andConsequences of On-line Satisfaction, Psychology & Marketing, 22(4), 313-331.
Skogland, I. & Siguaw, J. A. (2004). Are Your Satisfied Customers Loyal? Cornell Hotel and Restaurant
Administration Quarterly, 46 (3), 221-234.
Taylor, S. A. & Baker, T. I. (1994). An Assessment of the Relationship between Service Quality and Customer
Satisfaction in the Formation of Customers Purchase Intentions, Journal of Retailing, 70(2), 163-178.
Varki, S. and Colgate M. (2001). The Role of Price Perceptions in an Integrated Model of behavioral Intentions, Journal of Service Research, 3 (3), 232-240.
Tu, Q., Vonderembse, M. A. & Ragu-Nathan, T. S. (2001). The Impact of Time-based Manufacturing Practices on
Mass Customization and Value to Customer, Journal of Operations Management, 19, 201-217.
Weathers, Danny and Makienko, Igor (2006). Assessing the Relationships between E-tail Success and Product and
Web Site Factors, Journal of interactivity marketing, 20(2), 41-54.
West, S. G., Finch, J. F. & Curran, P. J. (1995). Structural Equation Models with Nonnormal Variables: Problems
and Remedies, In: Hoyle, R. H. (Editors). Structural Equation Modeling. Thousand Oaks, CA: SagePublications, 56-75.
Wisner, J. D.(2003). A Structural Equation Model of Supply Chain Management Strategies and Firm Performance,
Journal of Business Logistics , 24(1), 1-25.
8/12/2019 15 CIIMA 7-2-07 Yang-Tsai 115-126
http://slidepdf.com/reader/full/15-ciima-7-2-07-yang-tsai-115-126 10/12
General E-S-QUAL Scales Applied to Websites Satisfaction and Loyalty Model Yang & Tsai
Communications of the IIMA 124 2007 Volume 7 Issue 2
Yang, Hao-erl and Yeh, Kun-huang (2006). The Roles of Service Quality and Mediating Factors in a Customer
Behavioral Intentions Model, Int. J. Services Operations and Informatics, 1(1/2), pp. 38-53, 2006.
Yang, Hao-erl & Lin, Shih-hsuan (2006). The Role of Customer Satisfaction in an Online Shopping Environment.
Available at: http://www.iamot.org/conference/papers.php? first_ letter =all&cf=10.
Yang, Z. & Peterson, R. T. (2004). Customer Perceived Value, Satisfaction and Loyalty: The Role of SwitchingCosts. Psychology & Marketing, 21(10), 799-822.
Yoon, Sung-Joon (2002). The Antecedents and Consequents of Trust in Online-purchase Decisions, Journal of
Interactive Marketing, 16 (2), 47-63.
Yoon, Y. & Uysal, M. (2005). An Examination of the Effects of Motivation and Satisfaction on Destination Loyalty:
a Structural Model. Tourism Management , 26 , 45-56.
8/12/2019 15 CIIMA 7-2-07 Yang-Tsai 115-126
http://slidepdf.com/reader/full/15-ciima-7-2-07-yang-tsai-115-126 11/12
General E-S-QUAL Scales Applied to Websites Satisfaction and Loyalty Model Yang & Tsai
Communications of the IIMA 125 2007 Volume 7 Issue 2
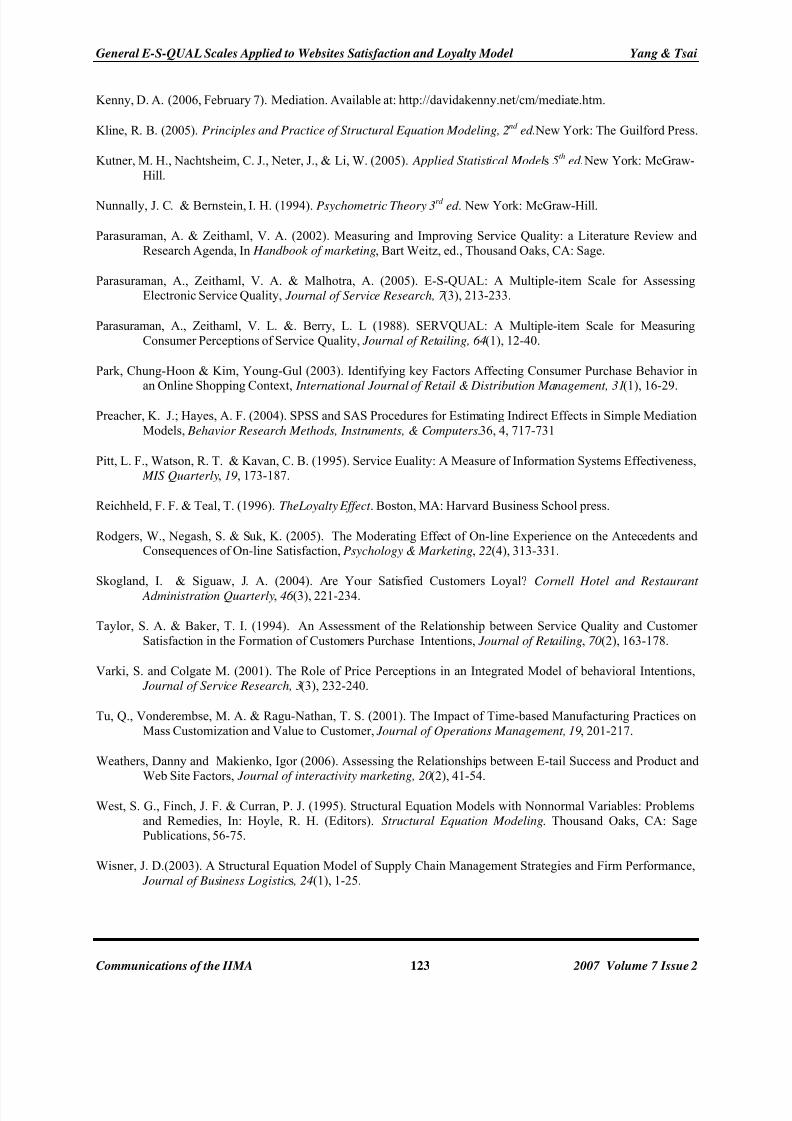
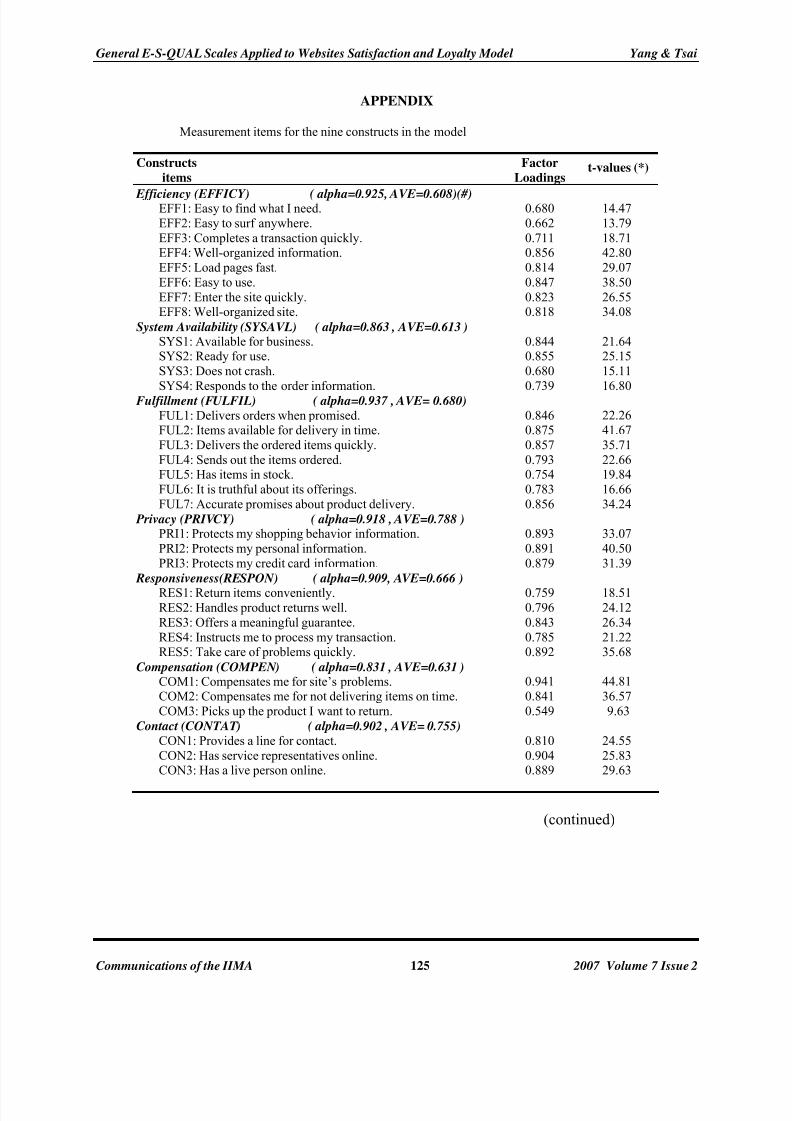
APPENDIX
Measurement items for the nine constructs in the model
(continued)
Constructs
items
Factor
Loadingst-values (*)
Efficiency (EFFICY) ( alpha=0.925, AVE=0.608)(#)EFF1: Easy to find what I need.
EFF2: Easy to surf anywhere.
EFF3: Completes a transaction quickly.EFF4: Well-organized information.
EFF5: Load pages fast.
EFF6: Easy to use.
EFF7: Enter the site quickly.EFF8: Well-organized site.
System Availability (SYSAVL) ( alpha=0.863 , AVE=0.613 )SYS1: Available for business.SYS2: Ready for use.
SYS3: Does not crash.
SYS4: Responds to the order information.
Fulfillment (FULFIL) ( alpha=0.937 , AVE= 0.680)
FUL1: Delivers orders when promised.FUL2: Items available for delivery in time.
FUL3: Delivers the ordered items quickly.
FUL4: Sends out the items ordered.FUL5: Has items in stock.
FUL6: It is truthful about its offerings.
FUL7: Accurate promises about product delivery.
Privacy (PRIVCY) ( alpha=0.918 , AVE=0.788 )PRI1: Protects my shopping behavior information.
PRI2: Protects my personal information.
PRI3: Protects my credit card information.
Responsiveness(RESPON) ( alpha=0.909, AVE=0.666 )
RES1: Return items conveniently.RES2: Handles product returns well.
RES3: Offers a meaningful guarantee.
RES4: Instructs me to process my transaction.RES5: Take care of problems quickly.
Compensation (COMPEN) ( alpha=0.831 , AVE=0.631 )COM1: Compensates me for site’s problems.COM2: Compensates me for not delivering items on time.
COM3: Picks up the product I want to return.
Contact (CONTAT) ( alpha=0.902 , AVE= 0.755)
CON1: Provides a line for contact.
CON2: Has service representatives online.CON3: Has a live person online.
0.680
0.662
0.7110.856
0.814
0.847
0.8230.818
0.8440.855
0.680
0.739
0.8460.875
0.857
0.7930.754
0.783
0.856
0.893
0.891
0.879
0.7590.796
0.843
0.7850.892
0.941
0.841
0.549
0.810
0.9040.889
14.47
13.79
18.7142.80
29.07
38.50
26.5534.08
21.6425.15
15.11
16.80
22.26
41.67
35.71
22.6619.84
16.66
34.24
33.07
40.50
31.39
18.5124.12
26.34
21.2235.68
44.81
36.57
9.63
24.55
25.8329.63
8/12/2019 15 CIIMA 7-2-07 Yang-Tsai 115-126
http://slidepdf.com/reader/full/15-ciima-7-2-07-yang-tsai-115-126 12/12
General E-S-QUAL Scales Applied to Websites Satisfaction and Loyalty Model Yang & Tsai
Communications of the IIMA 126 2007 Volume 7 Issue 2
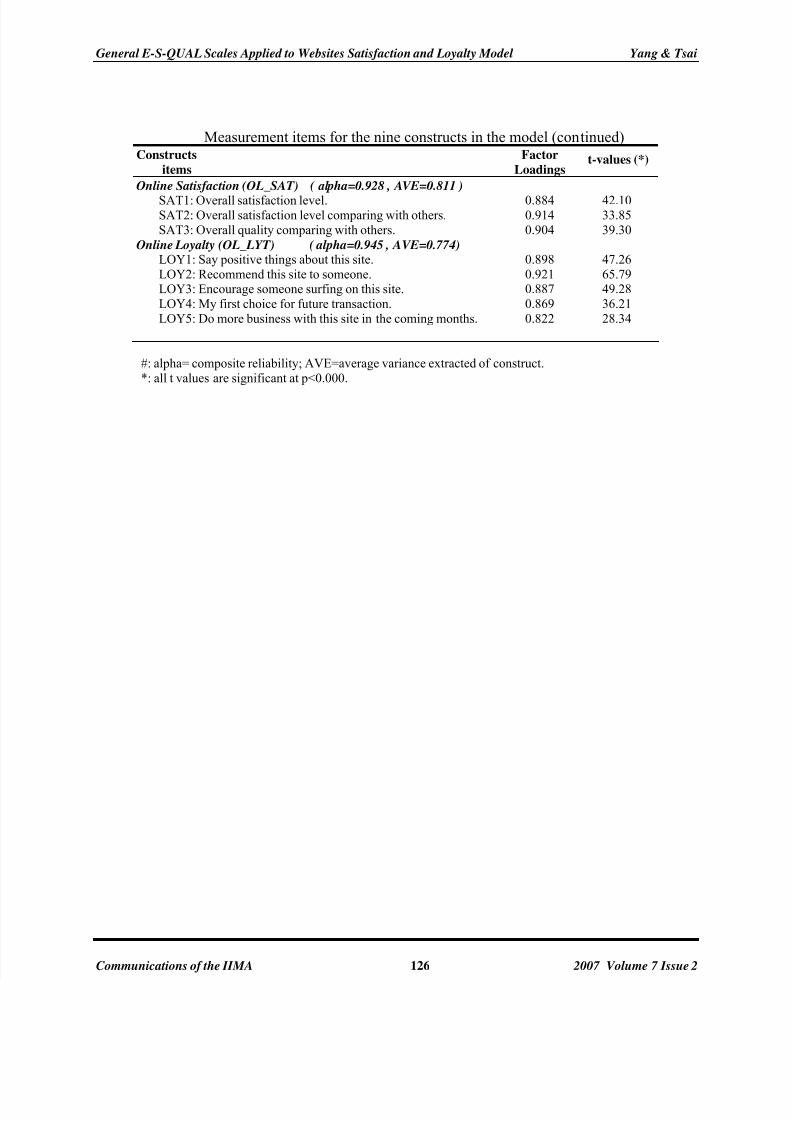
Measurement items for the nine constructs in the model (continued)
#: alpha= composite reliability; AVE=average variance extracted of construct.
*: all t values are significant at p<0.000.
Constructs
items
Factor
Loadingst-values (*)
Online Satisfaction (OL_SAT) ( alpha=0.928 , AVE=0.811 )
SAT1: Overall satisfaction level. SAT2: Overall satisfaction level comparing with others.
SAT3: Overall quality comparing with others.
Online Loyalty (OL_LYT) ( alpha=0.945 , AVE=0.774)LOY1: Say positive things about this site.
LOY2: Recommend this site to someone.LOY3: Encourage someone surfing on this site.
LOY4: My first choice for future transaction.
LOY5: Do more business with this site in the coming months.
0.8840.914
0.904
0.898
0.9210.887
0.869
0.822
42.1033.85
39.30
47.26
65.7949.28
36.21
28.34