scan on tank de-!! - digilib-batandigilib.batan.go.id/e-prosiding/file...
TRANSCRIPT
Risalah Seminar Ifmiah Penelitian dan Pengembangan Aplikasi lsotop dan Radiasi, 2005
SCAN ON TANK DE-!!
Sugiharto * I Wibisono*, Kushartono * I Syurhubel* I Arif Sudarmadji * *
*Puslitbang Teknologi Isotop clan Radiasi -Batan° °Jurusan Instrumentasi, FMIPA-UI
ABSTRAK
SKEN PADA TANGKI DE-!!. Tangki DE-!! adalah bejana proses yang dilengkapi pengaduk padakilang polimer dengan proses kontinyu. Problem pada tangki DE-!! diketahui daTi indikator yangmenunjukkan penurunan arus motor listrik yang mengontrol pengaduk di dalam tangki. Diduga penurunanarus motor disebabkan oleh terlepasnya batang pengaduk daTi pengait motor. Untuk membuktikan apakahbatang pengaduk masih tetap pada posisinya atau jatuh, penyelidikan dengan menggunakan teknik skendengan sinar gamma telah dilakukan. Hasil sken dengan menggunakan sumber Co-60, aktivitas 70 mCimembuktikan bahwa batang pengaduk masih tetap berada pada posisinya-tidak jatuh seperti yang diduga.Tambahan lagi daTi hasil sl-;en dapat diketahui bahwa level fluida polimer didalam tangki adalah 270 cm daTilantai atau 342,85 daTi dasar tangki.
ABSTRACT
SCAN ON TANK DE-II. Tank DE-II is a processing vessel that is equipped with a mixer atcontinuously polymer processing plant. Problem on the tank has been identified from an indicator that showsdropped in the electric motor current that control the mixer in the tank. It is suspected that the droppedmotor's current has been caused by missing the axle of the mixer from the motor's suction. To prove whetherthe mixer is still in its position or it felt out, an investigation of using gamma scan technique has beenconducted. The scan result of using radiation source, Co-60-activity 70 mCi, shows that the axle of the mixeris still in its position -not felt out as suspected. In addition, from scan results it has been found that thepolymeric fluid level in the tank was 270 cm above the floor or 342.85 cm above the bottom of the tank.
I = 10 exp (-l.1x)
Where 1 is the intensity of ray after strikematerial (cps)
10 is the intensity of ray before strike thematerial (cps).
~ is the linear attenuation coefficient ofthe material (cm-I).
x is the thickness of the material (cm).The equation, is clearly, describe the dependencyof the transmitted rays on energy of the radiationand the absorber.
INTRODUCTION
Tank DE-11 is processing unit incontinuously polymer processing plant at one ofpetrochemical industry in Tangerang-BantenProvince. The tank is basically a processingvessel equipped with a mixer for processing rawpolymeric material of textile, Problem in tankDE-11 has been identified when current gauge,which monitoring the motor's current, indicatedlow current. It was suspected that the droppedcurrent might be caused by missing the axle ofthe mixer from motor's suction [1],
The purpose of the report is to informwhether the axle of the axle of the mixer is stillin its position or it missed, Searching for the axleof the mixer was carried out by applying gammascan technique.
THEORY OF GAMMA SCAN
The basic principle of gamma scantechnique has been published elsewhere [2-4].The scan graph is produced based on interactionof transmitting gamma rays from gamma source(usually Co-60 or Cs -1371 with a material.When gamma rays strike the material, the raysare partially absorbed by the material and therest are transmitted. The relationship betweenintensity of rays before strike the material (101and after passing the material can be described
exponential equation:
MATERIAL AND METHOD
Material: radiation source Co-60, activity60 mCi, wincher with steel slink cable forhanging radiation source and scintillationdetector, rope for setting up the scan, laptopcomputer and stationery I and personnel'sradiation protection
Method: The procedure of measurementhas been carried out as follows: Thecircumference of the tank is measured. At theouter wall of the tank is signed by letters: C,C + 25CM and C-25CM as scan positions. Bothradiation source and scintillation detector are putin opposite position at the side of the tank DE-!!at the same level. Starting point was assigned 245cm above the floor or 342.85 cm from bottom of
Risalah Seminar Ilmiah Peneli/ian don Pengembangan Aplikasi ls%p don Radiasi, 2005
the tank. By utilizing wincher, the detector andthe source were lifted up for every 5 cmincrement step. The movement is stopped whenthe detector and source reached end point ofmeasurement -just below the' bordes'. Duringthe scan, data captured by detector are monitoredon laptop computer and then saved after then.
RESULTS AND DISCUSSION
Tank DE-II is a processing vessel withdiameter (including insulation) 442 cm and height642 cm. It is equipped with 9.95 cm thick ofmixer axle -which rotates at speed 88 rotation/minutes. Scan on tank DE-II has been carriedout on the 22nd February 2005 for three scanpositions: at the center (signed as Cj to scan theaxle, 25 cm left center (signed as C-25CM) and25 cm right the center (signed as C + 25 CM).
:E()
z0
~>W-lW
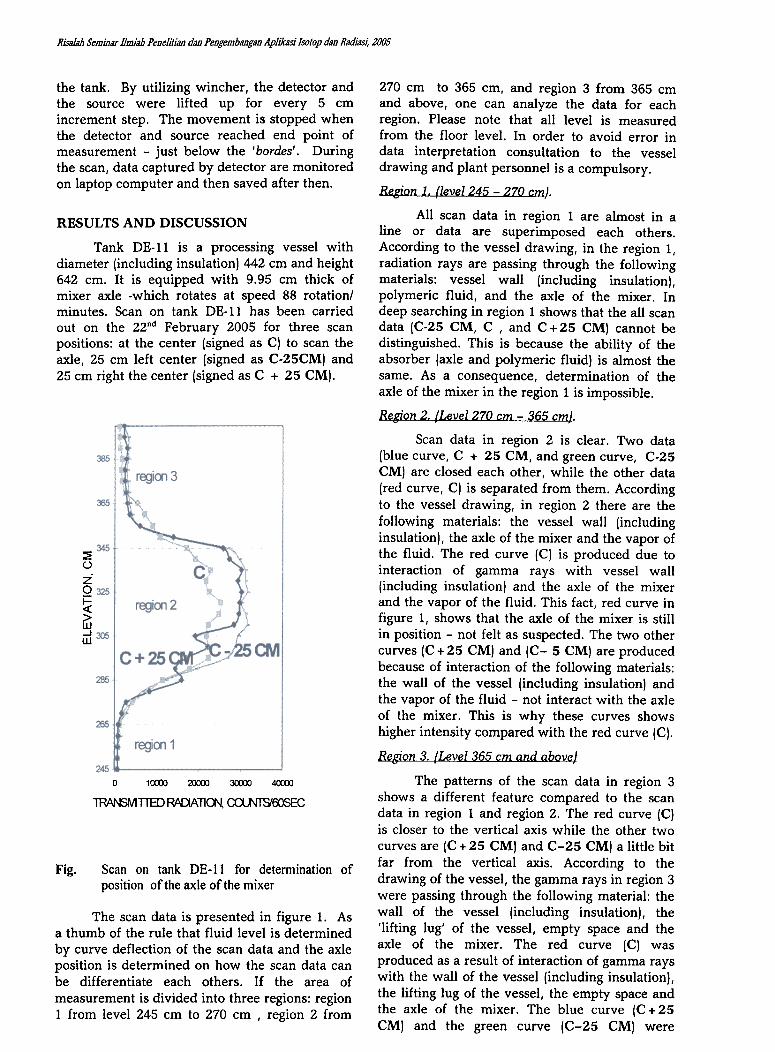
270 cm to 365 cm, and region 3 from 365 cmand above, one can analyze the data for eachregion. Please note that all level is measuredfrom the floor level. In order to avoid error indata interpretation consultation to the vesseldrawing and plant personnel is a compulsory.
Region 1. tlevel245 -270 cmJ.
All scan data in region 1 are almost in aline or data are superimposed each others.According to the vessel drawing, in the region 1,radiation rays are passing through the followingmaterials: vessel wall (including insulation),polymeric fluid, and the axle of the mixer. Indeep searching in region 1 shows that the all scandata (C-25 CM, C , and C + 25 CM) cannot bedistinguished. This is because the ability of theabsorber (axle and polymeric fluid) is almost thesame. As a consequence, determination of theaxle of the mixer in the region 1 is impossible.
Region 2. {Level 270 cm -365 cml.
Scan data in region 2 is clear. Two data(blue curve, C + 25 CM, and green curve, C-25CM) are closed each other, while the other data(red curve, C) is separated from them. Accordingto the vessel drawing, in region 2 there are thefollowing materials: the vessel wall (includinginsulation), the axle of the mixer and the vapor ofthe fluid. The red curve (Cj is produced due tointeraction of gamma rays with vessel wall(including insulation) and the axle of the mixerand the vapor of the fluid. This fact, red curve infigure 1, shows that the axle of the mixer is stillin position -not felt as suspected. The two othercurves (C + 25 CM) and (C- 5 CMj are producedbecause of interaction of the following materials:the wall of the vessel (including insulation! andthe vapor of the fluid -not interact with the axleof the mixer. This is why these curves showshigher intensity compared with the red curve (C).
Region 3. {Level 365 cm and above}
The patterns of the scan data in region 3shows a different feature compared to the scandata in region 1 and region 2. The red curve (C)is closer to the vertical axis while the other twocurves are (C + 25 CM) and C-25 CM! a little bitfar from the vertical axis. According to thedrawing of the vessel, the gamma rays in region 3were passing through the following material: thewall of the vessel (including insulation), the'lifting lug' of the vessel, empty space and theaxle of the mixer. The red curve (C) wasproduced as a result of interaction of gamma rayswith the wall of the vessel (including insulation),the lifting lug of the vessel, the empty space andthe axle of the mixer. The blue curve (C + 25CM) and the green curve (C-25 CM) were
a 1CXXXJ 2(XXXJ 3(XXX) 4(XXXJ
1RA1'6MTTED RADAllO"J, a:u-JTS'6OSEC
Fig. Scan on tank DE-II for determination ofposition of the axle of the mixer
The scan data is presented in figure 1. Asa thumb of the rule that fluid level is determinedby curve deflection of the scan data and the axleposition is determined on how the scan data canbe differentiate each others. If the area ofmeasurement is divided into three regions: region1 from level 245 cm to 270 cm I region 2 from
RJ'S8lah Seminar Ilmiah PeDelitian din PeDgembangan Aplikasi lsotop din Radiasi, 2005
ACKNOWLEDGEMENT
All authors wish their appreciation to Mr.Nakagawa and to those of PT. TIFICOpersonnel's, mairuy to Mr. Sapari, Mr. Agus, Mr.Wuryanto and their colleagues for valuablediscussion during running the work.
produced from interaction of gamma rays withthe wall of the vessel (including insulationl, thelifting lug of the vessel and the empty space. Dueto interaction of gamma rays with the axle of themixer, therefore the curve of the scan data (redcurve, CI shows closer to the vertical axis.
An Intensive discussion has been madeamong the scan team, polymer supervisor andfactory personnel at the polymer division inorder to determine the fluid level and the axleposition. From scan data presented in figure 1, itwas proved that the axle (presented by red curve,C curvel is still in its position (not feltl and thefluid was at level :t 270 cm above floor. Abovefluid level was empty space contained fluid
vapor.
REFERENCES
1. Information from Mr. Sapari.
2. CHARLTON, J.S, lEd), 1986, RadioisotopeTechniques for Problem-Solving inIndustrial Process Plant, Leonard-Hill,London
3. HILL, A.E, 1999, Practical Guidebook forRadioisotope-Based Technology inIndustry, RCA RAS/8/078, pp.265-271.
4. IAEA, 2002, Radioisotope Applications forTroubleshooting and OptimizingIndustrial Processes, India, pp.40-46.
CONCLUSION.
The gamma scan has been successfullyapplied to prove the position of the axle and ithas been able to determine the fluid level. Scandata in figure 1 shows that the axle of the mixeris still in its position and the level of the fluidwas :t 270 cm from the floor.