ringkasan penemuan summary findings - dosm.gov.my · namun begitu, kadar pertumbuhan penduduk...
TRANSCRIPT
1
RINGKASAN PENEMUAN
SUMMARY FINDINGS
1. SAIZ PENDUDUK 1. POPULATION SIZE
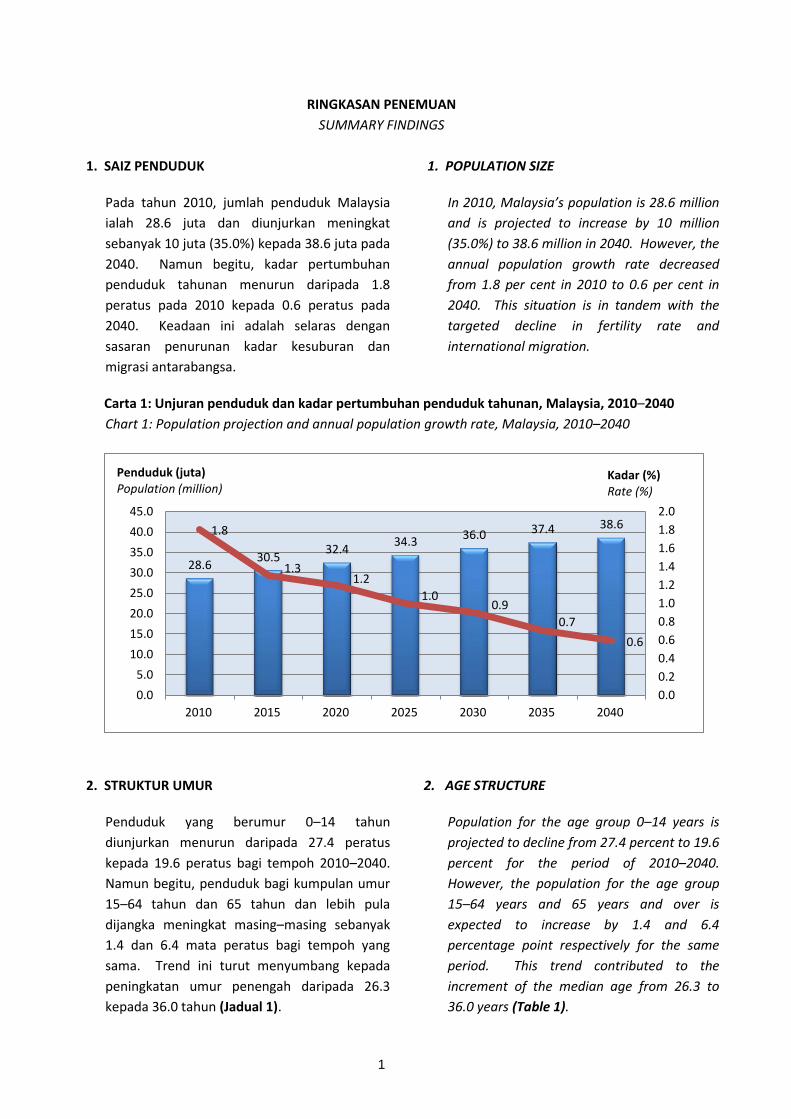
Pada tahun 2010, jumlah penduduk Malaysia
ialah 28.6 juta dan diunjurkan meningkat
sebanyak 10 juta (35.0%) kepada 38.6 juta pada
2040. Namun begitu, kadar pertumbuhan
penduduk tahunan menurun daripada 1.8
peratus pada 2010 kepada 0.6 peratus pada
2040. Keadaan ini adalah selaras dengan
sasaran penurunan kadar kesuburan dan
migrasi antarabangsa.
In 2010, Malaysia’s population is 28.6 million
and is projected to increase by 10 million
(35.0%) to 38.6 million in 2040. However, the
annual population growth rate decreased
from 1.8 per cent in 2010 to 0.6 per cent in
2040. This situation is in tandem with the
targeted decline in fertility rate and
international migration.
Carta 1: Unjuran penduduk dan kadar pertumbuhan penduduk tahunan, Malaysia, 2010–2040
Chart 1: Population projection and annual population growth rate, Malaysia, 2010–2040
2. STRUKTUR UMUR 2. AGE STRUCTURE
Penduduk yang berumur 0–14 tahun
diunjurkan menurun daripada 27.4 peratus
kepada 19.6 peratus bagi tempoh 2010–2040.
Namun begitu, penduduk bagi kumpulan umur
15–64 tahun dan 65 tahun dan lebih pula
dijangka meningkat masing–masing sebanyak
1.4 dan 6.4 mata peratus bagi tempoh yang
sama. Trend ini turut menyumbang kepada
peningkatan umur penengah daripada 26.3
kepada 36.0 tahun (Jadual 1).
Population for the age group 0–14 years is
projected to decline from 27.4 percent to 19.6
percent for the period of 2010–2040.
However, the population for the age group
15–64 years and 65 years and over is
expected to increase by 1.4 and 6.4
percentage point respectively for the same
period. This trend contributed to the
increment of the median age from 26.3 to
36.0 years (Table 1).
28.6 30.5
32.4 34.3
36.0 37.4 38.6 1.8
1.3 1.2
1.0 0.9
0.7
0.6
0.0
0.2
0.4
0.6
0.8
1.0
1.2
1.4
1.6
1.8
2.0
0.0
5.0
10.0
15.0
20.0
25.0
30.0
35.0
40.0
45.0
2010 2015 2020 2025 2030 2035 2040
Kadar (%) Rate (%)
Penduduk (juta) Population (million)
2
Jadual 1: Unjuran penduduk mengikut kumpulan umur, Malaysia, 2010–2040
Table 1: Population projection by age group, Malaysia, 2010–2040
Tahun Year
0–14 (‘000)
% 15–64 (‘000)
% 65+
(‘000) %
Umur penengah
Median age
2010 7,822.1 27.4 19,341.4 67.6 1,425.1 5.0 26.3
2015 7,733.4 25.4 20,971.9 68.8 1,779.9 5.8 28.2
2020 7,780.7 24.0 22,445.9 69.2 2,214.6 6.8 29.9
2025 8,009.5 23.4 23,533.4 68.6 2,751.3 8.0 31.5
2030 8,087.9 22.5 24,542.0 68.2 3,335.7 9.3 33.0
2035 7,893.4 21.1 25,606.1 68.5 3,889.9 10.4 34.5
2040 7,537.2 19.6 26,615.6 69.0 4,405.1 11.4 36.0
Sepanjang tempoh tersebut juga, penduduk
yang berumur 65 tahun dan lebih diunjurkan
meningkat lebih tiga kali ganda daripada
penduduk 2010. Peningkatan ini akan
menyebabkan Malaysia dijangka mengalami
penuaan penduduk1 pada tahun 2021 apabila
penduduk berumur 65 tahun dan lebih
mencapai 7.1 peratus.
During this period, the population aged 65
years and over is projected to increase more
than three folds of the 2010 population. The
increase will lead Malaysia to become an
aging population1 in 2021 when the
population aged 65 years and over reach 7.1
per cent.
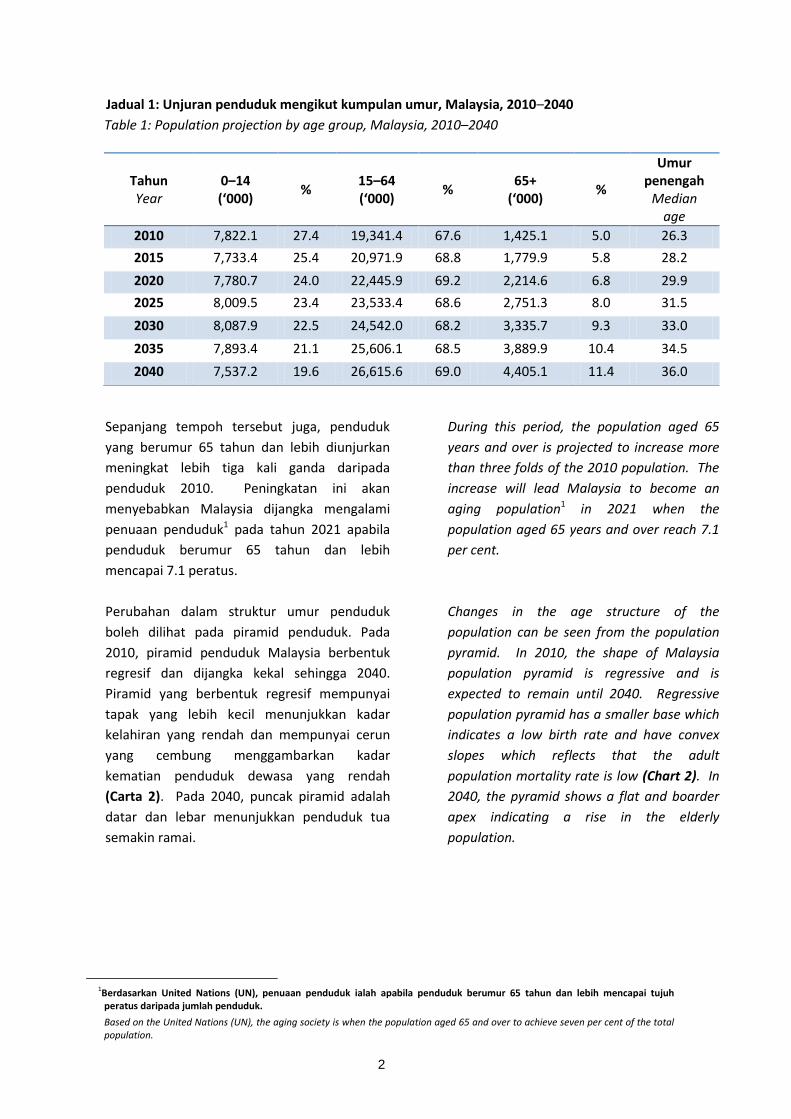
Perubahan dalam struktur umur penduduk
boleh dilihat pada piramid penduduk. Pada
2010, piramid penduduk Malaysia berbentuk
regresif dan dijangka kekal sehingga 2040.
Piramid yang berbentuk regresif mempunyai
tapak yang lebih kecil menunjukkan kadar
kelahiran yang rendah dan mempunyai cerun
yang cembung menggambarkan kadar
kematian penduduk dewasa yang rendah
(Carta 2). Pada 2040, puncak piramid adalah
datar dan lebar menunjukkan penduduk tua
semakin ramai.
Changes in the age structure of the
population can be seen from the population
pyramid. In 2010, the shape of Malaysia
population pyramid is regressive and is
expected to remain until 2040. Regressive
population pyramid has a smaller base which
indicates a low birth rate and have convex
slopes which reflects that the adult
population mortality rate is low (Chart 2). In
2040, the pyramid shows a flat and boarder
apex indicating a rise in the elderly
population.
1Berdasarkan United Nations (UN), penuaan penduduk ialah apabila penduduk berumur 65 tahun dan lebih mencapai tujuh
peratus daripada jumlah penduduk.
Based on the United Nations (UN), the aging society is when the population aged 65 and over to achieve seven per cent of the total population.
3
Carta 2: Piramid penduduk Malaysia, 2010 dan 2040
Chart 2: Malaysia population pyramid, 2010 and 2040
2010 2040
3. NISBAH TANGGUNGAN
3. DEPENDENCY RATIO
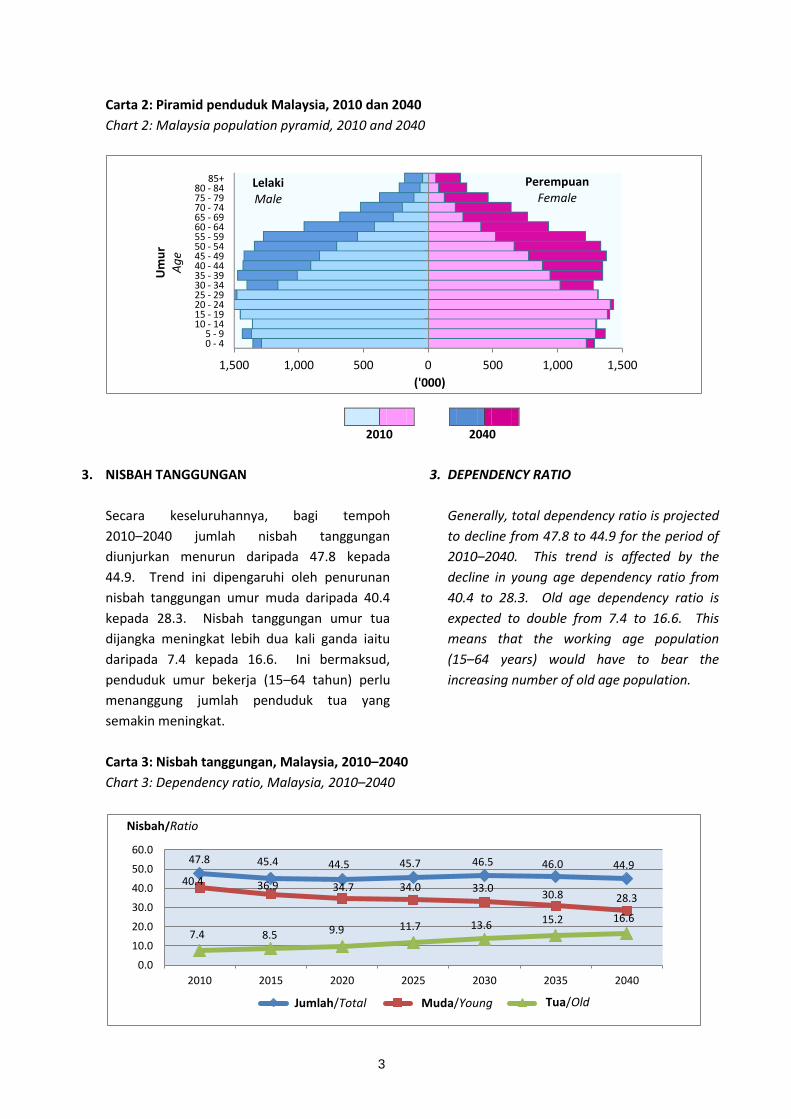
Secara keseluruhannya, bagi tempoh
2010–2040 jumlah nisbah tanggungan
diunjurkan menurun daripada 47.8 kepada
44.9. Trend ini dipengaruhi oleh penurunan
nisbah tanggungan umur muda daripada 40.4
kepada 28.3. Nisbah tanggungan umur tua
dijangka meningkat lebih dua kali ganda iaitu
daripada 7.4 kepada 16.6. Ini bermaksud,
penduduk umur bekerja (15–64 tahun) perlu
menanggung jumlah penduduk tua yang
semakin meningkat.
Generally, total dependency ratio is projected
to decline from 47.8 to 44.9 for the period of
2010–2040. This trend is affected by the
decline in young age dependency ratio from
40.4 to 28.3. Old age dependency ratio is
expected to double from 7.4 to 16.6. This
means that the working age population
(15–64 years) would have to bear the
increasing number of old age population.
Carta 3: Nisbah tanggungan, Malaysia, 2010–2040
Chart 3: Dependency ratio, Malaysia, 2010–2040
1,500 1,000 500 0 500 1,000 1,500
0 - 4 5 - 9
10 - 14 15 - 19 20 - 24 25 - 29 30 - 34 35 - 39 40 - 44 45 - 49 50 - 54 55 - 59 60 - 64 65 - 69 70 - 74 75 - 79 80 - 84
85+
('000)
Um
ur
Ag
e Lelaki Male
Perempuan Female
47.8 45.4 44.5 45.7 46.5 46.0 44.9
40.4 36.9 34.7 34.0 33.0 30.8 28.3
7.4 8.5 9.9 11.7 13.6 15.2 16.6
0.0
10.0
20.0
30.0
40.0
50.0
60.0
2010 2015 2020 2025 2030 2035 2040
Jumlah/Total Muda/Young Tua/Old
Nisbah/Ratio (bil
4
4. NISBAH JANTINA
4. SEX RATIO
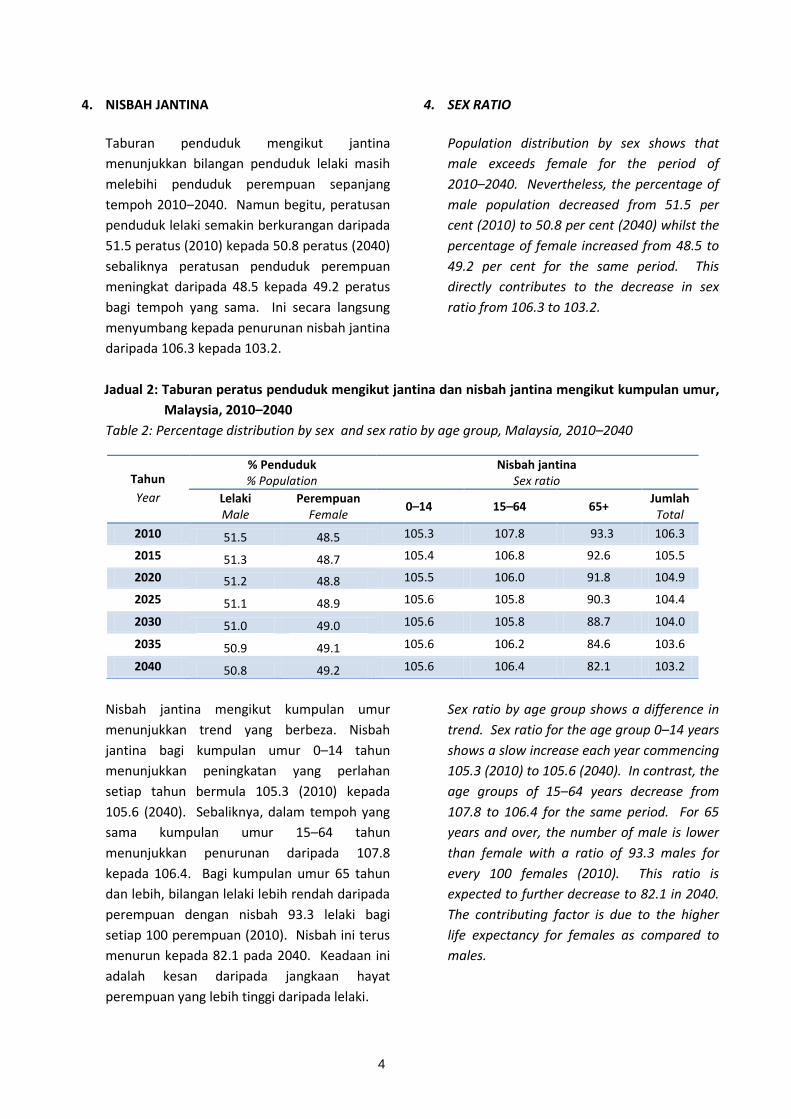
Taburan penduduk mengikut jantina
menunjukkan bilangan penduduk lelaki masih
melebihi penduduk perempuan sepanjang
tempoh 2010–2040. Namun begitu, peratusan
penduduk lelaki semakin berkurangan daripada
51.5 peratus (2010) kepada 50.8 peratus (2040)
sebaliknya peratusan penduduk perempuan
meningkat daripada 48.5 kepada 49.2 peratus
bagi tempoh yang sama. Ini secara langsung
menyumbang kepada penurunan nisbah jantina
daripada 106.3 kepada 103.2.
Population distribution by sex shows that
male exceeds female for the period of
2010–2040. Nevertheless, the percentage of
male population decreased from 51.5 per
cent (2010) to 50.8 per cent (2040) whilst the
percentage of female increased from 48.5 to
49.2 per cent for the same period. This
directly contributes to the decrease in sex
ratio from 106.3 to 103.2.
Jadual 2: Taburan peratus penduduk mengikut jantina dan nisbah jantina mengikut kumpulan umur,
Malaysia, 2010–2040
Table 2: Percentage distribution by sex and sex ratio by age group, Malaysia, 2010–2040
Tahun
Year
% Penduduk % Population
Nisbah jantina Sex ratio
Lelaki Male
Perempuan Female
0–14 15–64 65+ Jumlah Total
2010 51.5 48.5 105.3 107.8 93.3 106.3
2015 51.3 48.7 105.4 106.8 92.6 105.5
2020 51.2 48.8 105.5 106.0 91.8 104.9
2025 51.1 48.9 105.6 105.8 90.3 104.4
2030 51.0 49.0 105.6 105.8 88.7 104.0
2035 50.9 49.1 105.6 106.2 84.6 103.6
2040 50.8 49.2 105.6 106.4 82.1 103.2
Nisbah jantina mengikut kumpulan umur
menunjukkan trend yang berbeza. Nisbah
jantina bagi kumpulan umur 0–14 tahun
menunjukkan peningkatan yang perlahan
setiap tahun bermula 105.3 (2010) kepada
105.6 (2040). Sebaliknya, dalam tempoh yang
sama kumpulan umur 15–64 tahun
menunjukkan penurunan daripada 107.8
kepada 106.4. Bagi kumpulan umur 65 tahun
dan lebih, bilangan lelaki lebih rendah daripada
perempuan dengan nisbah 93.3 lelaki bagi
setiap 100 perempuan (2010). Nisbah ini terus
menurun kepada 82.1 pada 2040. Keadaan ini
adalah kesan daripada jangkaan hayat
perempuan yang lebih tinggi daripada lelaki.
Sex ratio by age group shows a difference in
trend. Sex ratio for the age group 0–14 years
shows a slow increase each year commencing
105.3 (2010) to 105.6 (2040). In contrast, the
age groups of 15–64 years decrease from
107.8 to 106.4 for the same period. For 65
years and over, the number of male is lower
than female with a ratio of 93.3 males for
every 100 females (2010). This ratio is
expected to further decrease to 82.1 in 2040.
The contributing factor is due to the higher
life expectancy for females as compared to
males.

5
5. KOMPOSISI ETNIK
5. ETHNIC COMPOSITION
Secara keseluruhannya, semua etnik dijangka
mencatatkan peningkatan dalam jumlah
penduduk. Melayu mencatatkan peningkatan
tertinggi iaitu lebih enam juta penduduk
daripada 14.3 juta (2010) kepada 20.9 juta
(2040). Ini diikuti oleh Bumiputera Lain dan
Cina yang mencatatkan peningkatan masing-
masing sebanyak 1.8 juta dan 0.7 juta. India
dan Bukan warganegara pula mencatatkan
peningkatan sebanyak 0.4 juta manakala Lain-
lain mencatatkan peningkatan terendah iaitu
0.2 juta bagi tempoh yang sama.
On the whole, all ethnic groups are expected
to record an increase in the total population.
The Malays recorded the highest increase of
more than six million people from 14.3 million
(2010) to 20.9 million (2040). This is followed
by Other Bumiputera and Chinese with an
increase of 1.8 million and 0.7 million
respectively. Indians and non-Malaysian
citizens, however, increased by 0.4 million,
while the Others posted a low of 0.2 million
for the same period.
Jadual 3: Unjuran penduduk dan purata kadar pertumbuhan penduduk tahunan mengikut kumpulan
etnik, Malaysia, 2010–2040
Table 3: Population projection and average annual population growth rate by ethnic group, Malaysia,
2010–2040
Tahun Year
Melayu Malay
Bumiputera Lain
Other Bumiputera
Cina Chinese
India Indians
Lain-lain Others
Bukan warganegara
Malaysia Non-Malaysian
citizens
Bilangan penduduk (‘000) Number of population (‘000)
2010 14,322.1 3,354.7 6,430.4 1,924.9 232.0 2,324.5
2015 15,479.6 3,672.4 6,642.0 2,012.6 267.4 2,411.4
2020 16,717.7 4,005.0 6,827.1 2,096.5 306.1 2,488.8
2025 17,944.8 4,336.1 6,962.2 2,167.8 347.4 2,535.8
2030 19,083.2 4,647.9 7,042.2 2,220.9 389.8 2,581.7
2035 20,059.9 4,926.9 7,083.1 2,249.1 433.3 2,637.1
2040 20,865.5 5,166.7 7,098.9 2,257.8 477.3 2,691.6
Purata kadar pertumbuhan penduduk tahunan (%) Average annual population growth rate (%)
2010–2015 1.55 1.81 0.65 0.89 2.84 0.73
2015–2020 1.54 1.73 0.55 0.82 2.71 0.63
2020–2025 1.42 1.59 0.39 0.67 2.53 0.37
2025–2030 1.23 1.39 0.23 0.48 2.30 0.36
2030–2035 1.00 1.17 0.12 0.25 2.12 0.42
2035–2040 0.79 0.95 0.04 0.08 1.94 0.41
6
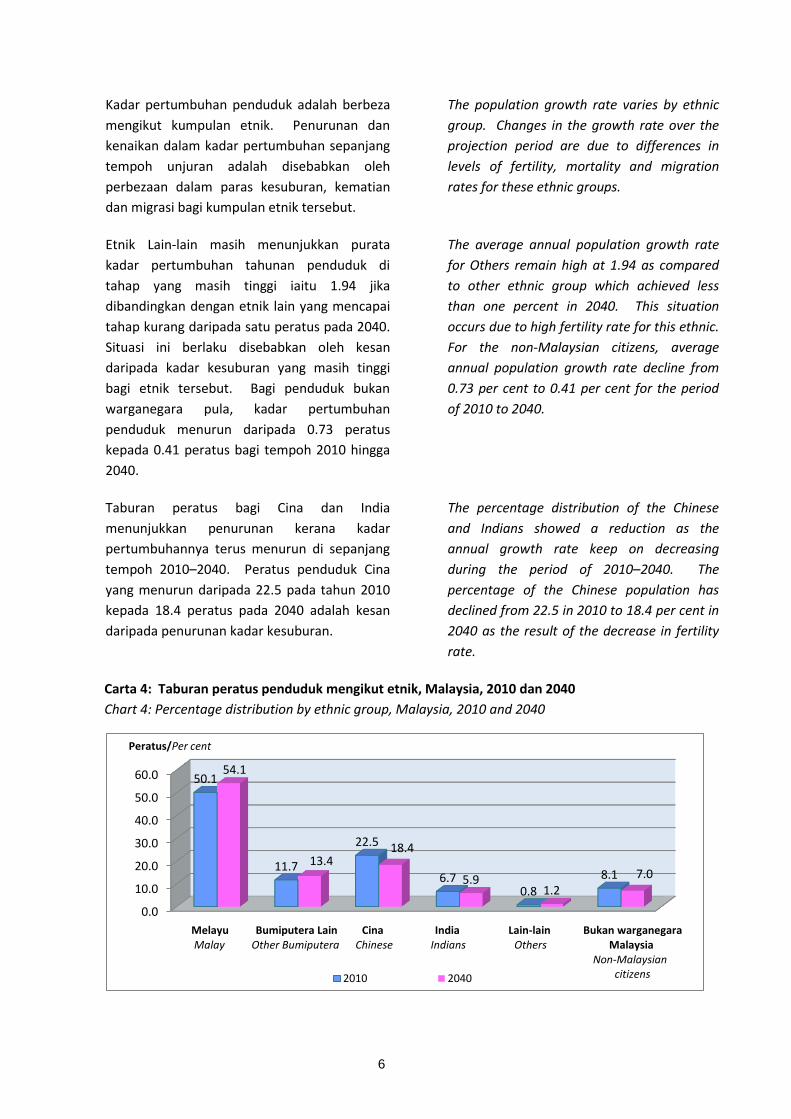
Kadar pertumbuhan penduduk adalah berbeza
mengikut kumpulan etnik. Penurunan dan
kenaikan dalam kadar pertumbuhan sepanjang
tempoh unjuran adalah disebabkan oleh
perbezaan dalam paras kesuburan, kematian
dan migrasi bagi kumpulan etnik tersebut.
The population growth rate varies by ethnic
group. Changes in the growth rate over the
projection period are due to differences in
levels of fertility, mortality and migration
rates for these ethnic groups.
Etnik Lain-lain masih menunjukkan purata
kadar pertumbuhan tahunan penduduk di
tahap yang masih tinggi iaitu 1.94 jika
dibandingkan dengan etnik lain yang mencapai
tahap kurang daripada satu peratus pada 2040.
Situasi ini berlaku disebabkan oleh kesan
daripada kadar kesuburan yang masih tinggi
bagi etnik tersebut. Bagi penduduk bukan
warganegara pula, kadar pertumbuhan
penduduk menurun daripada 0.73 peratus
kepada 0.41 peratus bagi tempoh 2010 hingga
2040.
The average annual population growth rate
for Others remain high at 1.94 as compared
to other ethnic group which achieved less
than one percent in 2040. This situation
occurs due to high fertility rate for this ethnic.
For the non-Malaysian citizens, average
annual population growth rate decline from
0.73 per cent to 0.41 per cent for the period
of 2010 to 2040.
Taburan peratus bagi Cina dan India
menunjukkan penurunan kerana kadar
pertumbuhannya terus menurun di sepanjang
tempoh 2010–2040. Peratus penduduk Cina
yang menurun daripada 22.5 pada tahun 2010
kepada 18.4 peratus pada 2040 adalah kesan
daripada penurunan kadar kesuburan.
The percentage distribution of the Chinese
and Indians showed a reduction as the
annual growth rate keep on decreasing
during the period of 2010–2040. The
percentage of the Chinese population has
declined from 22.5 in 2010 to 18.4 per cent in
2040 as the result of the decrease in fertility
rate.
Carta 4: Taburan peratus penduduk mengikut etnik, Malaysia, 2010 dan 2040
Chart 4: Percentage distribution by ethnic group, Malaysia, 2010 and 2040
0.0
10.0
20.0
30.0
40.0
50.0
60.0 50.1
11.7
22.5
6.7 0.8
8.1
54.1
13.4 18.4
5.9 1.2
7.0
2010 2040
Melayu Bumiputera Lain Cina India Lain-lain Bukan warganegara Malay Other Bumiputera Chinese Indians Others Malaysia Non-Malaysian citizens
Peratus/Per cent