no surat/pengumuman ae/150/10/am/dr nama … summit.pdf · rincian penjelasan terlampir : dokumen...
TRANSCRIPT

No Surat/Pengumuman AE/150/10/AM/dr
Nama Perusahaan PT ADARO ENERGY Tbk
Kode Emiten ADRO
Lampiran 1
Tanggal dan Jam 05 Nop 2010 20:27:12
Perihal Keterbukaan Informasi Yang Perlu Diketahui Publik
Dalam rangka memenuhi ketentuan Peraturan Nomor X.K.1 Lampiran Keputusan Ketua Bapepam Nomor: Kep 86/PM/1996 tanggal 24 Januari 1996 tentang Keterbukaan Informasi Yang Harus Segera Diumumkan Kepada Publik dan Peraturan Bursa, PT ADARO ENERGY Tbk memberitahukan bahwa pada tanggal 05 Nop 2010 , Perusahaan mengalami peristiwa/memperoleh informasi/fakta penting yang mungkin dapat mempengaruhi nilai Efek atau mempengaruhi keputusan investasi Pemodal yaitu berupa:
Lainnya: Penyampaian Bahan Presentasi Acara Investor Summit 2010
Dampak kejadian, informasi atau fakta penting tersebut terhadap Perseroan sebagai berikut:
Rincian Penjelasan Terlampir :
Dokumen ini merupakan dokumen resmi PT ADARO ENERGY Tbk yang tidak memerlukan tanda tangan karena dihasilkan secara elektronik oleh sistem pelaporan secara elektronik. PT
ADARO ENERGY Tbk bertanggung jawab penuh atas informasi yang tertera di dalam dokumen ini.
Validation ID: fd0211e1c2-541255-440590-08a534-7e2104b27e99deaa
0
Adaro EnergyOn Track to Build a Bigger and Better Adaro Energy
Investor Summit and Capital Market Expo 201010 November 2010
The Ritz-Carlton Pacific Place, Jakarta
1
Disclaimer
These materials have been prepared by PT Adaro Energy (the “Company”) and have not been independently verified. No representation or warranty, expressed or implied, is made and no reliance should be placed on the accuracy, fairness or completeness of the information presented or contained in these materials. The Company or any of its affiliates, advisers or representatives accepts no liability whatsoever for any loss howsoever arising from any information presented or contained in these materials. The information presented or contained in these materials is subject to change without notice and its accuracy is not guaranteed.
These materials contain statements that constitute forward-looking statements. These statements include descriptions regarding the intent, belief or current expectations of the Company or its officers with respect to the consolidated results of operations and financial condition of the Company. These statements can be recognized by the use of words such as “expects,” “plan,”“will,” “estimates,” “projects,” “intends,” or words of similar meaning. Such forward-looking statements are not guarantees of future performance and involve risks and uncertainties, and actual results may differ from those in the forward-looking statements as a result of various factors and assumptions. The Company has no obligation and does not undertake to revise forward-looking statements to reflect future events or circumstances.
These materials are for information purposes only and do not constitute or form part of an offer, solicitation or invitation of any offer to buy or subscribe for any securities of the Company, in any jurisdiction, nor should it or any part of it form the basis of, or be relied upon in any connection with, any contract, commitment or investment decision whatsoever. Any decision to purchase or subscribe for any securities of the Company should be made after seeking appropriate professional advice.
2
Key Messages
Our 3Q10 and 9M10 results were adversely affected by unusually heavy rainfall.
While the returns can be great, coal mining can also be a risky,long term, capital intensive and long term sector.
Despite this short term volatility, we remain positive on our longer term growth plans, driven by the expectations of increasing demand for power, and coal to fuel that power, especially in Asia.
With pricing determined by the market, we continue to focus on building long term, low cost assets, to create sustainable shareholder value.

3
Quick Updates
The volume of rain at the Tutupan pit averaged 238 mm per month, which was over 2.5 times more than the 5 year average for the third quarter. The average number of rain days per month of 15 days was more than double the five year average.
Although our 2010 full year target remains 45 million tonnes, and we will do our best to achieve it, due to the unprecendented rainfall we have revised our guidance to 42-43 million tonnes of production.
Planning for the Out of Pit Crusher and Conveyor (OPCC) made progress. With the feasibility work nearing completion, the EPC contractor will soon be appointed.
Work continued on the 2X30 MW mine-mouth power plant, which will power the new conveyors and other sectors of the operation.
Envirocoal-Wara received good acceptance and robust demand from both the domestic and international markets.
Adaro agreed to take a stake in an international consortium withinternational, blue chip, power companies that will soon bid on a large domestic IPP project.

4
3Q10 & 9M10 Operational and Financial Results
4
Quick Update
In Rp Bn In US$ Mn
9M10 9M09 % change 9M10 9M09 % changeNet Revenue 18,075 20,014 -9.7% 1,981 1,867 6.1%Cost of Revenue (12,027) (11,598) 3.7% (1,318) (1,082) 21.8%Operating income 5,410 7,576 -28.6% 593 707 -16.1%Net income 1,696 3,515 -51.7% 186 328 -43.3%EBITDA 6,400 8,419 -24.0% 701 786 -10.7%Total Assets 40,548 36,596 10.8% 4,544 3,780 20.2%Cash and Cash Equivalents 6,400 4,966 28.9% 717 513 39.8%Total Interest Bearing Debt 14,602 10,298 41.8% 1,636 1,064 53.8%Stockholders’ Equity 18,376 17,102 7.4% 2,059 1,767 16.6%Net Debt to Equity (x) 0.45 0.31 - 0.45 0.31 -Annualized net debt to EBITDA (x) 1.0 0.48 - 1.0 0.53 -
Units 3Q10 3Q09 % change
Production MT 10.22 10.48 -2%
Sales MT 10.61 11.15 -5%
Units 9M10 9M09 % change
Production MT 31.84 28.47 12%
Sales MT 32.36 28.98 12%

55
Adaro Energy at a Glance
Production/Sales 50Mt capacity40.6Mt production in 2009 (38.5Mt in 2008)
10 Years CAGR of 11.6%
Envirocoal Sub bituminous, moderate CV, high moisture ultra-low sulfur, ash and NoX emissions
Customers Substantially all customers are blue-chip power utilities
Pricing Substantially annual price negotiation part of which is index-linked
Cost Low to middle production costs compared to peers
Resources – JORC Compliant 3.5 billion tones
Location Tabalong and Balangan districts, South Kalimantan
License of Adaro Indonesia First Generation CCA valid until 2022
Operations The largest single site coal mine in the southern hemisphere, vertically integrated from pit to port
Pit to Port Subsidiaries (contracting, barging, shiploading, dredging, port services, marketing)
Each subsidiary is or will become an independent profit center and contribute value beyond the efficient high quality
services they provide Adaro
Growth Strategy Increase resources, organic annual growth, marketing focus on Asia and further integrate and improve operations
Company Overview
Approximately Approximately 882%of 2%of Adaro EnergyAdaro Energy’’s EBITDAs EBITDA is Adaro Indonesia, but as the subsidiaries grow is Adaro Indonesia, but as the subsidiaries grow and improve, their contribution will increaseand improve, their contribution will increase

6
Operating Subsidiaries to Increase Value Creation
100%
PIT TO PORT INTEGRATIONPIT TO PORT INTEGRATION
Alam Tri Abadi
PT Adaro Energy Tbk
IBT Coaltrade
100%100%
SDM
51.20%100%100%100% 100%OML-MBP-
HBIMSWSISAdaro
Listed on IDX in July 2008
Adaro Energy 9M10:Revenue: Rp18,075 billionEBITDA: Rp6,400 billion
Adaro Indonesia 9M10:Revenue: Rp16,378 billionEBITDA: Rp5,311 billion
Mining license holder- Thermal Coal
Mining and hauling
contractor
Mine mouth
power plant
Barging and ship loading
Dredging Barito River mouth
and water toll contractor
Coal storage, blending, loading
terminal and fuel facility
Coal export
marketing and trading
AdaroAdaro JPI
95%-100%-100%
Conveyor System
Sim
plifi
ed s
truc
ture
*) As of May 2010, Adaro received Government approval for 25% stake for IndoMet Coal Project
The Group has consolidated its holdings in key subsidiaries The Group has consolidated its holdings in key subsidiaries –– SIS, OML and MSWSIS, OML and MSW
ICP
25%
Mining license holder- Coking Coal
7
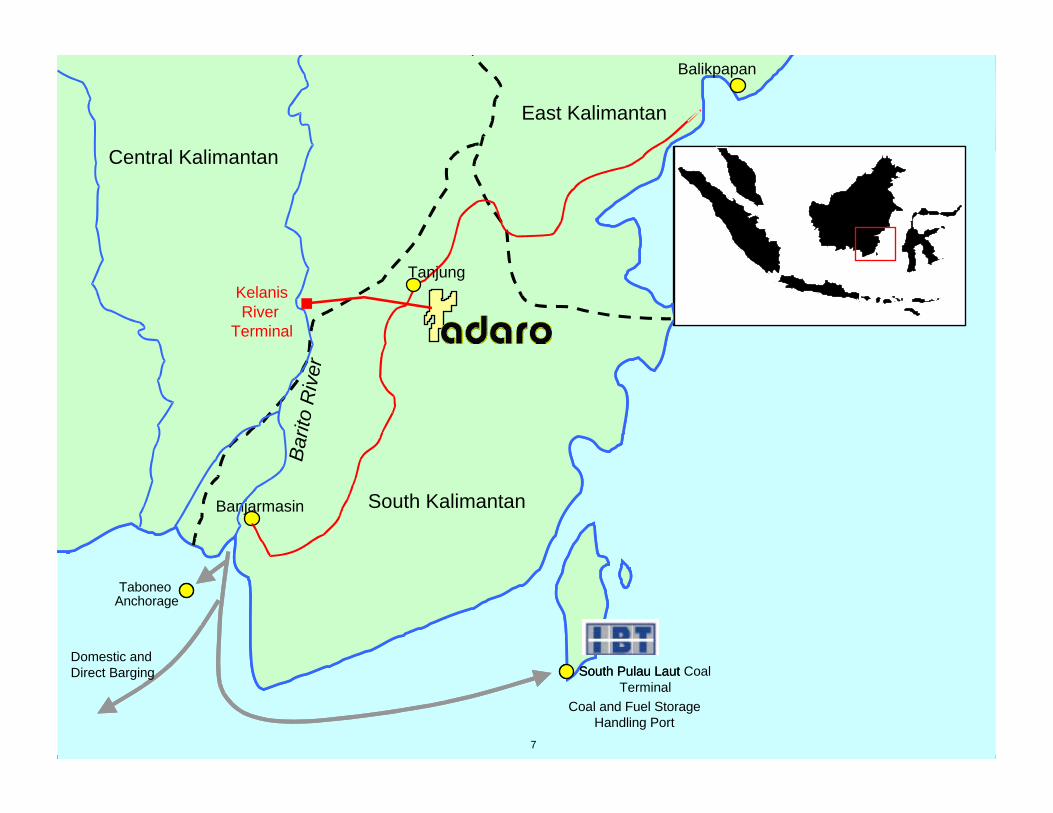
Banjarmasin
Barit
o R
iver
Tanjung
PT Adaro Indonesia
Kelanis Barge
Terminal
Balikpapan
South Kalimantan
Central Kalimantan
East Kalimantan
South Pulau Laut Coal Terminal
Anchorage
Banjarmasin
Barit
o R
iver
TanjungKelanis River
Terminal
Balikpapan
South Kalimantan
Central Kalimantan
East Kalimantan
South Pulau Laut
Coal and Fuel StorageHandling Port
Taboneo
Domestic and Direct Barging
7
8
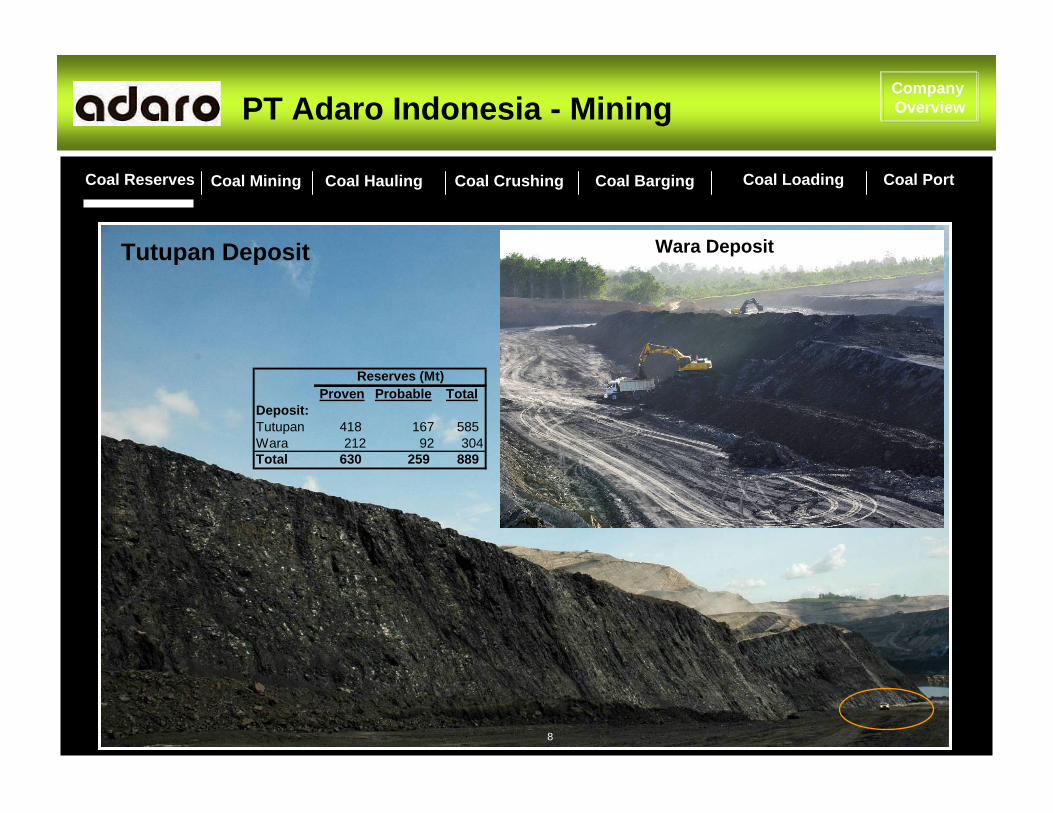
Coal Reserves Coal Mining Coal Hauling Coal Crushing Coal Barging Coal Loading Coal Port
PT Adaro Indonesia - Mining
8
Company Overview
Tutupan Deposit Wara Deposit
Proven Probable TotalDeposit:Tutupan 418 167 585 Wara 212 92 304Total 630 259 889
Reserves (Mt)
8

9
Coal Reserves Coal Mining Coal Hauling Coal Crushing Coal Barging Coal Loading Coal Port
9
PT Saptaindra Sejati (“SIS”) – Mining ContractingCompany Overview
9

10
Coal is loaded on the trailer by backhoes or wheel-loaders from run-of-mine stockpiles
Company Overview
9M10 Contractors:PAMA 38%SIS 29%BUMA 18%RAJ 13%RMI 2%
10

11
Hauling Equipment Capacity:60 million tonnes
Hauling Road Capacity:80 million tonnes
Hauling Road Distance:80 km
Coal Reserves Coal Mining Coal Hauling Coal Crushing Coal Barging Coal Loading Coal Port
Dedicated Coal Hauling Road
Hauling Road Vehicles:200 road trains
11The hauling road is 100% owned by Adaro EnergyThe hauling road is 100% owned by Adaro Energy
Company Overview
Banjarmasin
Barit
o R
iver
TanjungKelanis Barge
Terminal
Balikpapan
South Kalimantan
Central Kalimantan
East Kalimantan
South Pulau Laut Coal Terminal
Anchorage
Banjarmasin
Barit
o R
iver
TanjungKelanis River
Terminal
Balikpapan
South Kalimantan
Central Kalimantan
East Kalimantan
South Pulau Laut
Taboneo
Domestic and Direct Barging
9
11
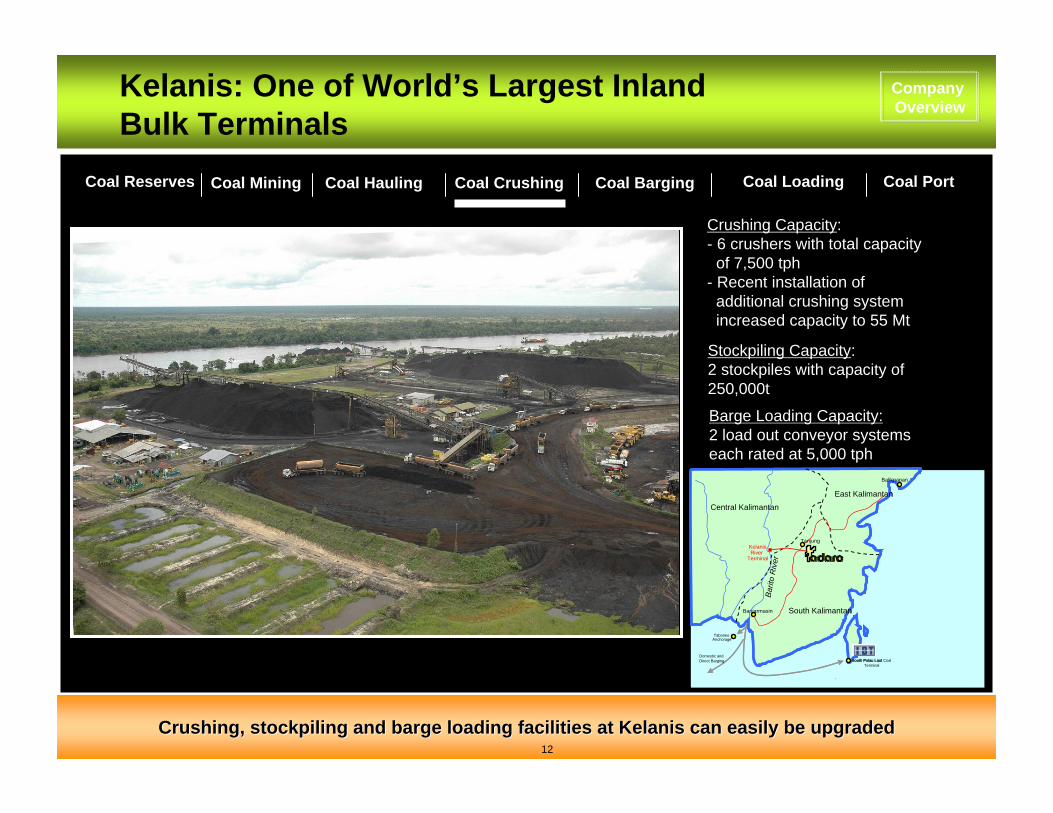
12
Crushing Capacity:- 6 crushers with total capacity
of 7,500 tph- Recent installation of
additional crushing system increased capacity to 55 Mt
Stockpiling Capacity:2 stockpiles with capacity of 250,000t
Coal Reserves Coal Mining Coal Hauling Coal Crushing Coal Barging Coal Loading Coal Port
Kelanis: One of World’s Largest Inland Bulk Terminals
12Crushing, stockpiling and barge loading facilities at Kelanis caCrushing, stockpiling and barge loading facilities at Kelanis can easily be upgradedn easily be upgraded
Barge Loading Capacity:2 load out conveyor systems each rated at 5,000 tph
Company Overview
Banjarmasin
Barit
o R
iver
TanjungKelanis Barge
Terminal
Balikpapan
South Kalimantan
Central Kalimantan
East Kalimantan
South Pulau Laut Coal Terminal
Anchorage
Banjarmasin
Barit
o R
iver
TanjungKelanis River
Terminal
Balikpapan
South Kalimantan
Central Kalimantan
East Kalimantan
South Pulau Laut
Taboneo
Domestic and Direct Barging
9
12

13
Coal Reserves Coal Mining Coal Hauling Coal Crushing Coal Barging Coal Loading Coal Port
PT Maritim Barito Perkasa (“MBP”) –Barging
13
Company Overview
Banjarmasin
Barit
o R
iver
TanjungKelanis Barge
Terminal
Balikpapan
South Kalimantan
Central Kalimantan
East Kalimantan
South Pulau Laut Coal Terminal
Anchorage
Banjarmasin
Barit
o R
iver
TanjungKelanis River
Terminal
Balikpapan
South Kalimantan
Central Kalimantan
East Kalimantan
South Pulau Laut
Taboneo
Domestic and Direct Barging
9
13
14
Coal Reserves Coal Mining Coal Hauling Coal Crushing Coal Barging Coal Loading Coal Port
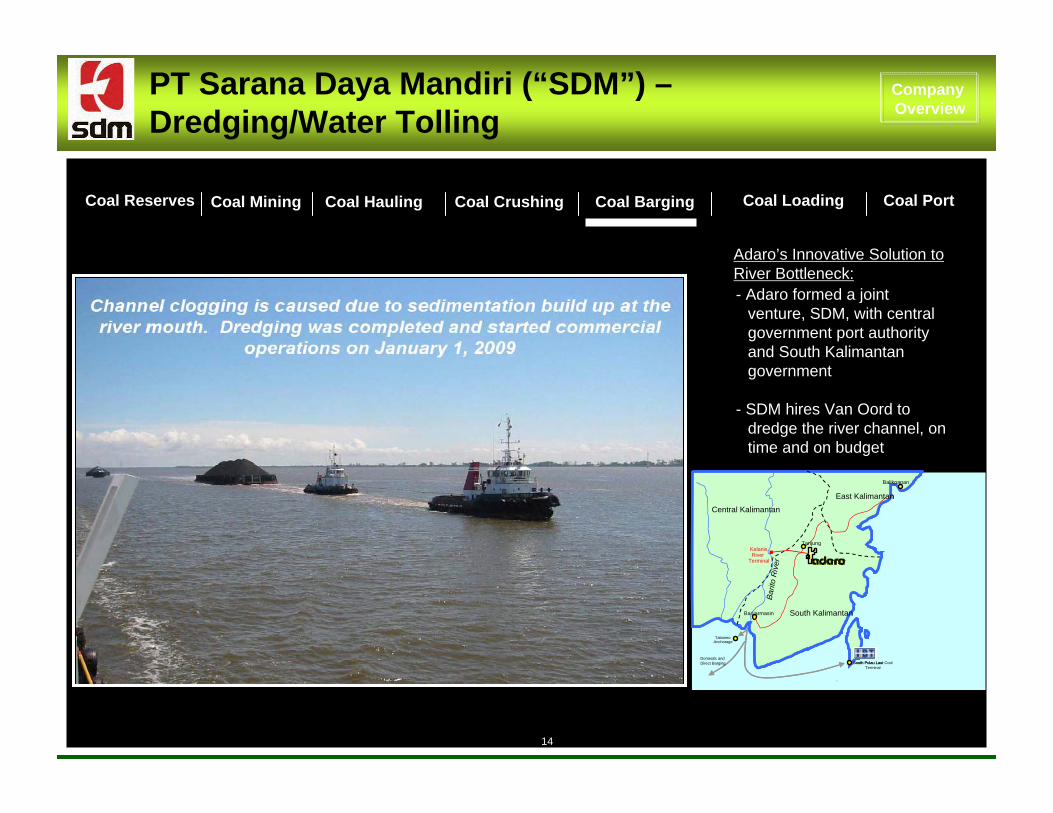
PT Sarana Daya Mandiri (“SDM”) –Dredging/Water Tolling
Adaro’s Innovative Solution to River Bottleneck:- Adaro formed a joint
venture, SDM, with central government port authority and South Kalimantan government
- SDM hires Van Oord to dredge the river channel, on time and on budget
- Maintenance of channel is self-funded
14
Company Overview
Banjarmasin
Barit
o R
iver
TanjungKelanis Barge
Terminal
Balikpapan
South Kalimantan
Central Kalimantan
East Kalimantan
South Pulau Laut Coal Terminal
Anchorage
Banjarmasin
Barit
o R
iver
TanjungKelanis River
Terminal
Balikpapan
South Kalimantan
Central Kalimantan
East Kalimantan
South Pulau Laut
Taboneo
Domestic and Direct Barging
9
14

1515
Capacity of the Barito River has increased to 200mt per year
Five barges towing Adaro Indonesia’s coal passing through new channel
Barges waiting at crossing from old channel
Company Overview
Capacity : 200 Mt per annum (old 60 Mt)Length : 15,000 m (old channel:14,000 m)Base width : 138 m (old: 60m) Min depth : -6 LWS (old: -3 to -4.7 LWS)

16
Coal Reserves Coal Mining Coal Hauling Coal Crushing Coal Barging Coal Loading Coal Port
16
PT Maritime Barito Perkasa (“MBP”) –Shiploading
Company Overview
Banjarmasin
Barit
o R
iver
TanjungKelanis Barge
Terminal
Balikpapan
South Kalimantan
Central KalimantanEast Kalimantan
South Pulau Laut Coal Terminal
Anchorage
Banjarmasin
Barit
o R
iver
TanjungKelanis River
Terminal
Balikpapan
South Kalimantan
Central KalimantanEast Kalimantan
South Pulau Laut
Taboneo
Domestic and Direct Barging
9
Vessels with their own gear and grabs at the Taboneo anchorage
MBP’s floating cranes
16
17
Coal Reserves Coal Mining Coal Hauling Coal Crushing Coal Barging Coal Loading Coal Port
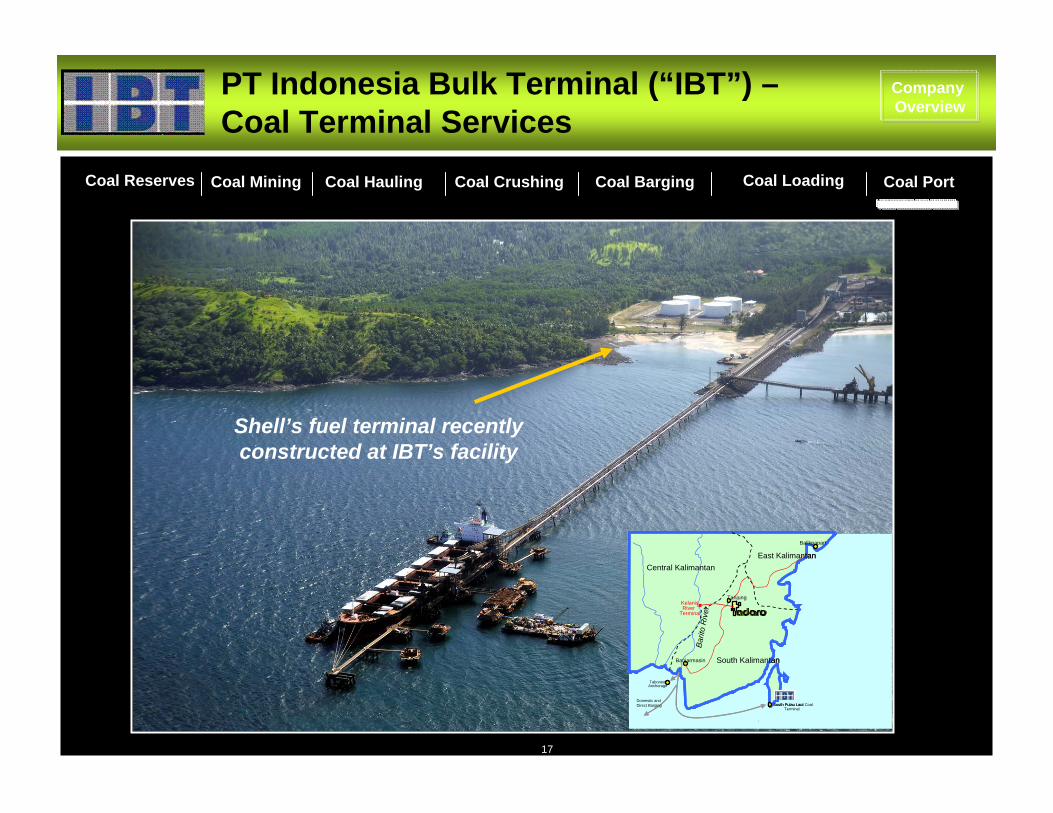
PT Indonesia Bulk Terminal (“IBT”) –Coal Terminal Services
17
Company Overview
Shell’s fuel terminal recently constructed at IBT’s facility
Banjarmasin
Barit
o R
iver
TanjungKelanis Barge
Terminal
Balikpapan
South Kalimantan
Central KalimantanEast Kalimantan
South Pulau Laut Coal Terminal
Anchorage
Banjarmasin
Barit
o R
iver
TanjungKelanis River
Terminal
Balikpapan
South Kalimantan
Central KalimantanEast Kalimantan
South Pulau Laut
Taboneo
Domestic and Direct Barging
9
17

1818
Vertical integration allows for control over each critical pieceVertical integration allows for control over each critical piece of the supply chainof the supply chain
Vertically Integrated from Pit to Port
Strong control
Medium control
Controlling stake heldby the Group
PT Adaro IndonesiaCoal Concession Owner
Kelanis River Terminal, Crushing Plant, 55 Mt
PT Sarana Daya MandiriDredging & Water Toll, 200 Mt
Hauling Road 80 km, 60 Mt
PT Indonesia Bulk TerminalCoal Terminal 12 Mt
PT Sapta Indra SejatiMining Contractors, 16 Mt
Taboneo ShiploadingActivities
Local customers
MBPCoal Barging, 250 km
Strategy is centred on improving control and efficiency of the supply chain
Company Overview
19
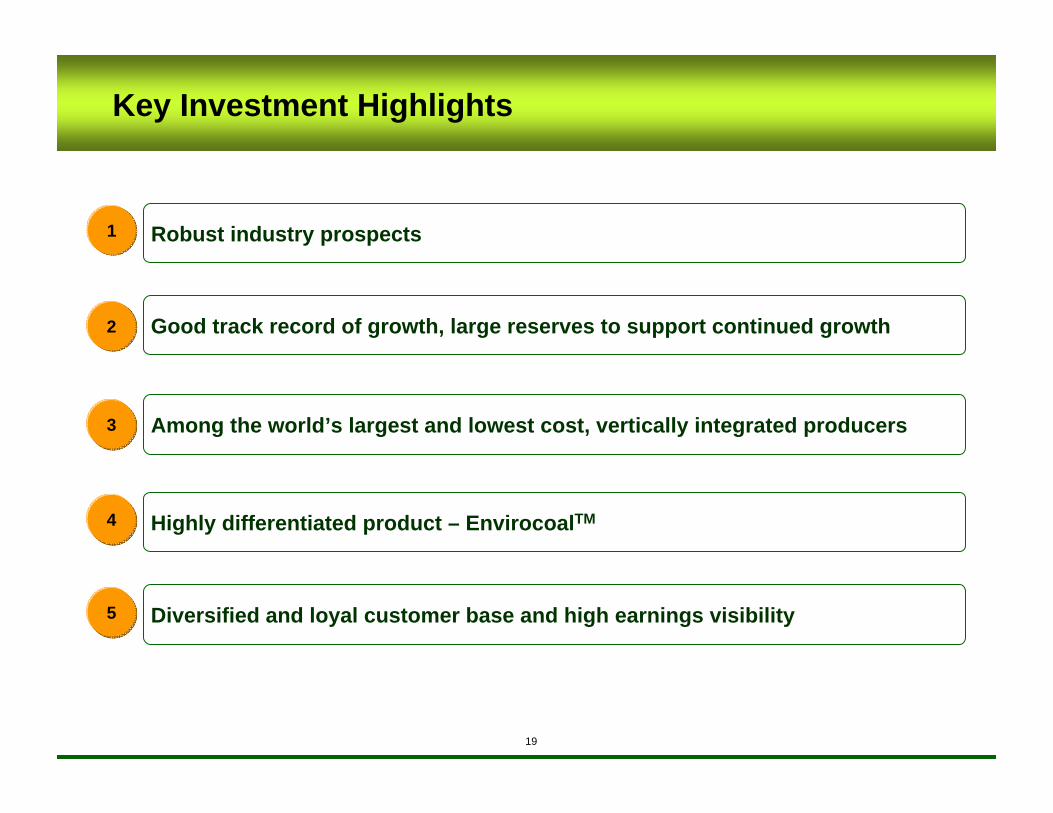
Good track record of growth, large reserves to support continued growth
Key Investment Highlights
Among the world’s largest and lowest cost, vertically integrated producers3
Highly differentiated product – EnvirocoalTM4
Diversified and loyal customer base and high earnings visibility5
2
Robust industry prospects1
20
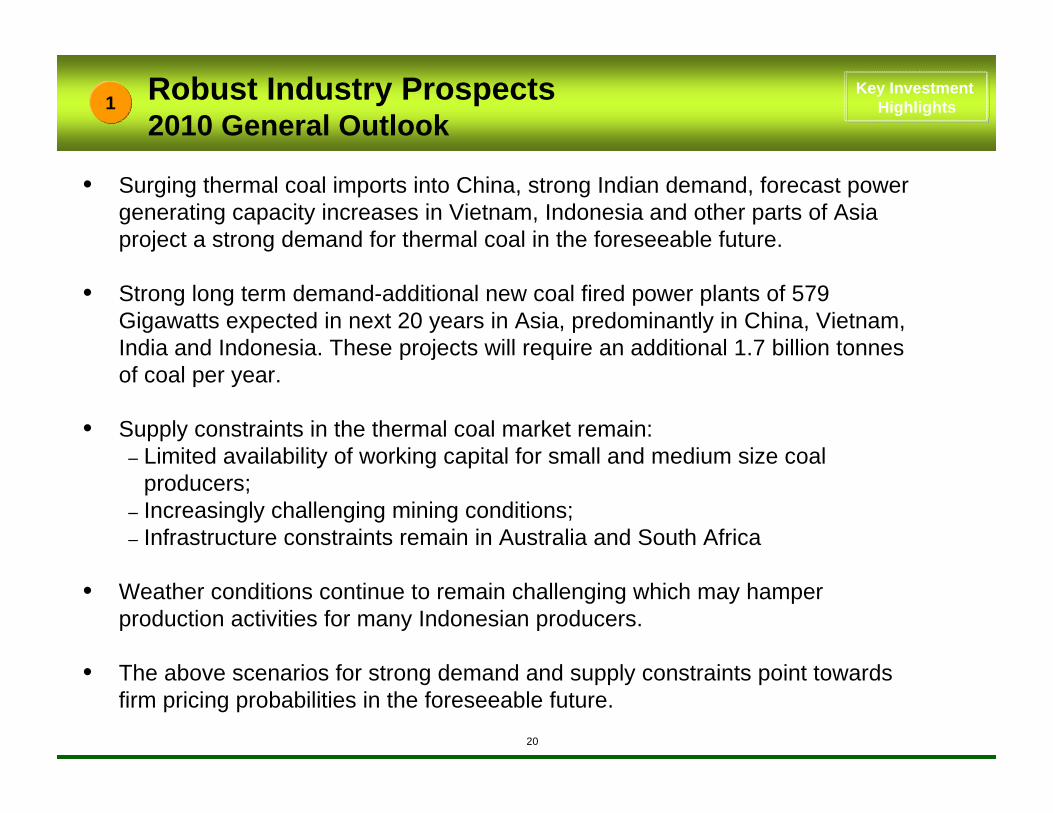
• Surging thermal coal imports into China, strong Indian demand, forecast power generating capacity increases in Vietnam, Indonesia and other parts of Asia project a strong demand for thermal coal in the foreseeable future.
• Strong long term demand-additional new coal fired power plants of 579 Gigawatts expected in next 20 years in Asia, predominantly in China, Vietnam, India and Indonesia. These projects will require an additional 1.7 billion tonnes of coal per year.
• Supply constraints in the thermal coal market remain:– Limited availability of working capital for small and medium size coal
producers;– Increasingly challenging mining conditions;– Infrastructure constraints remain in Australia and South Africa
• Weather conditions continue to remain challenging which may hamper production activities for many Indonesian producers.
• The above scenarios for strong demand and supply constraints point towards firm pricing probabilities in the foreseeable future.
1 Robust Industry Prospects2010 General Outlook
Key Investment Highlights
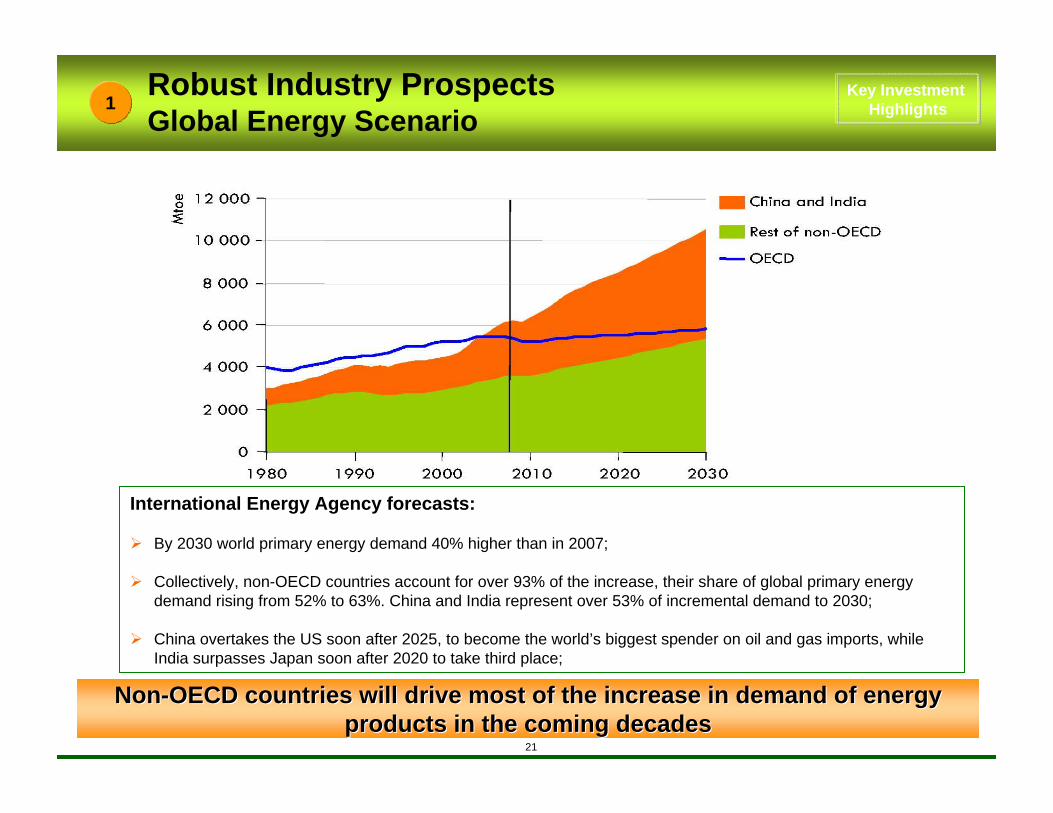
Robust Industry ProspectsGlobal Energy Scenario
21
International Energy Agency forecasts:
By 2030 world primary energy demand 40% higher than in 2007;
Collectively, non-OECD countries account for over 93% of the increase, their share of global primary energy demand rising from 52% to 63%. China and India represent over 53% of incremental demand to 2030;
China overtakes the US soon after 2025, to become the world’s biggest spender on oil and gas imports, while India surpasses Japan soon after 2020 to take third place;
NonNon--OECD countries will drive most of the increase in demand of enerOECD countries will drive most of the increase in demand of energy gy products in the coming decadesproducts in the coming decades
1Key Investment
Highlights

Robust Industry ProspectsGlobal Energy Scenario (cont’d)
22
Fossil fuels remain the dominant sources of energy worldwide, accounting for 77% of the demand increase in 2007-2030;
Electricity demand grows by 76% in 2007-2030, requiring 4,800 gigawatts (GW) of capacity additions –almost five times the existing capacity of the US. Coal remains the dominant fuel of the power sector;
1.3 billion people still lack access to electricity in 2030 compared with 1.5 billion people today.
Coal is forecast to be the primary source of supply for the incrCoal is forecast to be the primary source of supply for the increase in global ease in global demand for energydemand for energy
Fuel sources for incremental Global Demand for Electricity (2007-2030) in TWh
1Key Investment
Highlights

23
1 Robust Industry Prospects2010 General Outlook (cont’d)
Key Investment Highlights
Coal prices have corrected from the steep rises of early 2008, Coal prices have corrected from the steep rises of early 2008, yet remain at significantly higher levels than all but one of thyet remain at significantly higher levels than all but one of the last 5 yearse last 5 years
2002 2003 2004 2005 2006 2007 2008 2009 2010Richards Bay FOB Average 25.59 30.73 54.34 46.21 50.85 62.77 120.63 64.38 85.61
Newcastle FOB Average 25.27 26.30 53.90 47.35 49.03 65.98 128.83 71.89 94.75
US$
/tonn
e
Source : McCloskey Coal
24
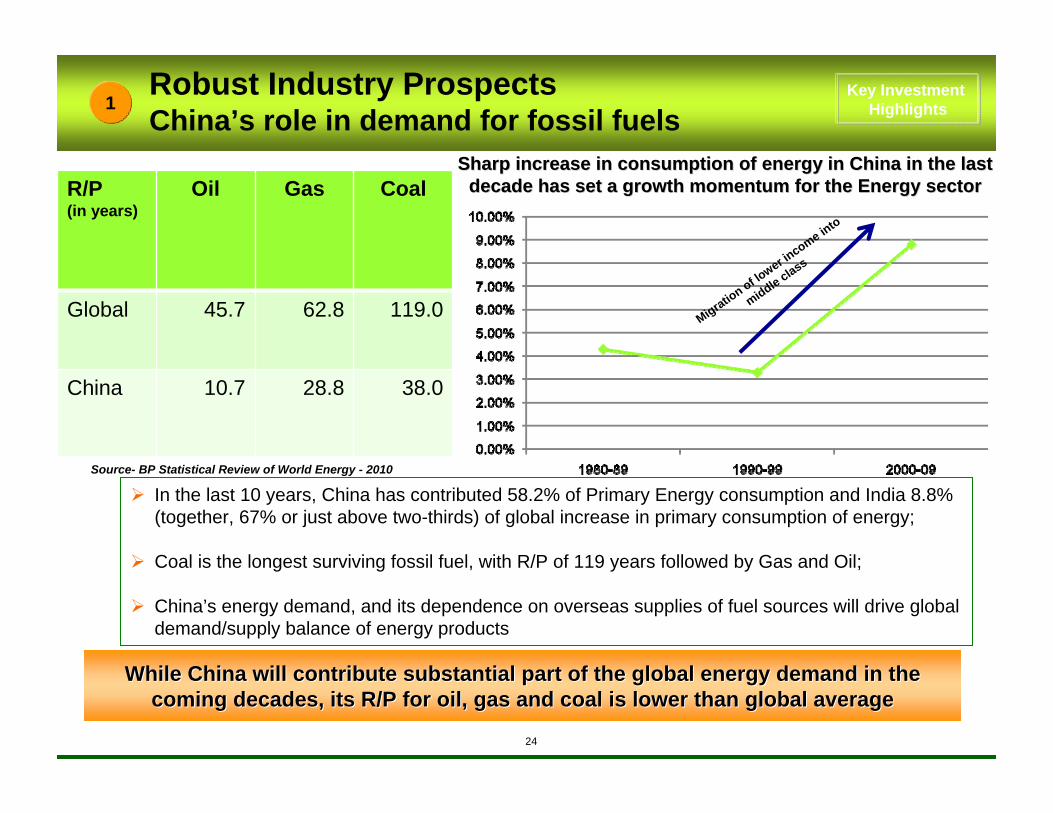
In the last 10 years, China has contributed 58.2% of Primary Energy consumption and India 8.8% (together, 67% or just above two-thirds) of global increase in primary consumption of energy;
Coal is the longest surviving fossil fuel, with R/P of 119 years followed by Gas and Oil;
China’s energy demand, and its dependence on overseas supplies of fuel sources will drive global demand/supply balance of energy products
Robust Industry ProspectsChina’s role in demand for fossil fuels
R/P(in years)
Oil Gas Coal
Global 45.7 62.8 119.0
China 10.7 28.8 38.0
While China will contribute substantial part of the global energWhile China will contribute substantial part of the global energy demand in the y demand in the coming decades, its R/P for oil, gas and coal is lower than globcoming decades, its R/P for oil, gas and coal is lower than global averageal average
Migration of lo
wer income into
middle class
Source- BP Statistical Review of World Energy - 2010
Sharp increase in consumption of energy in China in the last Sharp increase in consumption of energy in China in the last decade has set a growth momentum for the Energy sectordecade has set a growth momentum for the Energy sector
1Key Investment
Highlights

25
1 Robust Industry ProspectsChina’s urban population to reach one billion
Key Investment Highlights
26
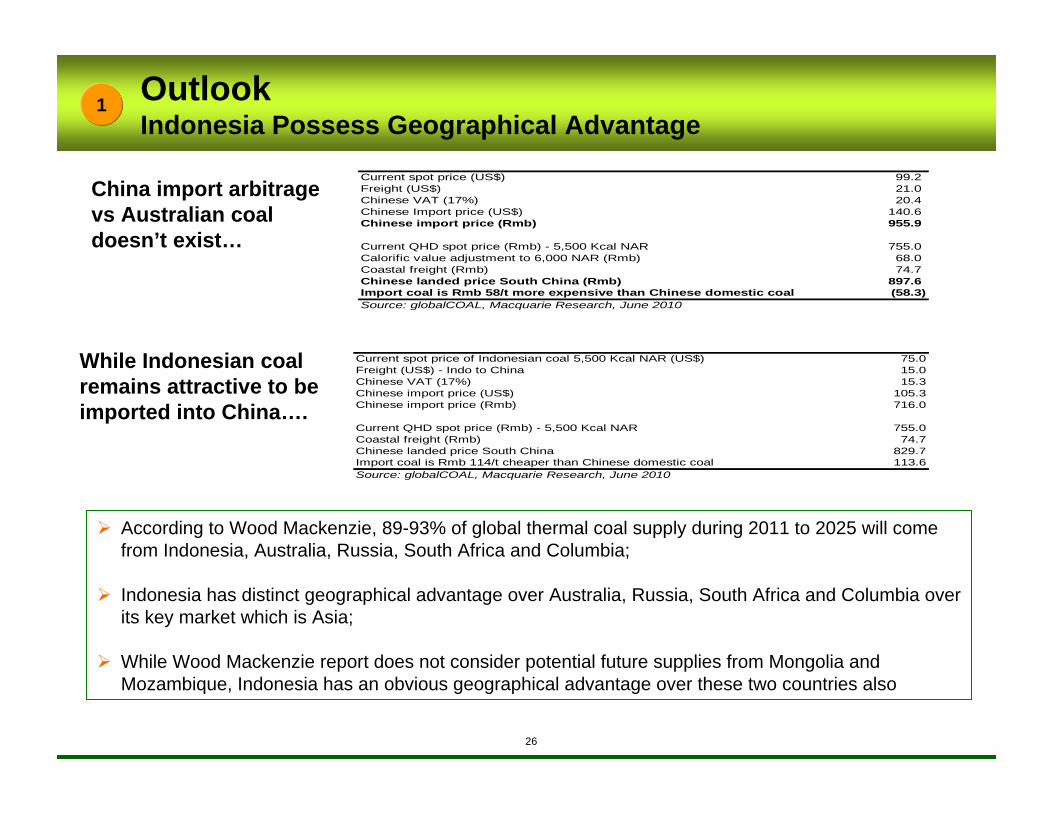
OutlookIndonesia Possess Geographical Advantage
Current spot price (US$) 99.2 Freight (US$) 21.0 Chinese VAT (17%) 20.4 Chinese Import price (US$) 140.6 Chinese import price (Rmb) 955.9
Current QHD spot price (Rmb) - 5,500 Kcal NAR 755.0 Calorific value adjustment to 6,000 NAR (Rmb) 68.0 Coastal freight (Rmb) 74.7 Chinese landed price South China (Rmb) 897.6 Import coal is Rmb 58/t more expensive than Chinese domestic coal (58.3) Source: globalCOAL, Macquarie Research, June 2010
Current spot price of Indonesian coal 5,500 Kcal NAR (US$) 75.0Freight (US$) - Indo to China 15.0Chinese VAT (17%) 15.3Chinese import price (US$) 105.3Chinese import price (Rmb) 716.0
Current QHD spot price (Rmb) - 5,500 Kcal NAR 755.0Coastal freight (Rmb) 74.7Chinese landed price South China 829.7Import coal is Rmb 114/t cheaper than Chinese domestic coal 113.6Source: globalCOAL, Macquarie Research, June 2010
China import arbitrage vs Australian coal doesn’t exist…
While Indonesian coal remains attractive to be imported into China….
According to Wood Mackenzie, 89-93% of global thermal coal supply during 2011 to 2025 will come from Indonesia, Australia, Russia, South Africa and Columbia;
Indonesia has distinct geographical advantage over Australia, Russia, South Africa and Columbia over its key market which is Asia;
While Wood Mackenzie report does not consider potential future supplies from Mongolia and Mozambique, Indonesia has an obvious geographical advantage over these two countries also
1
27
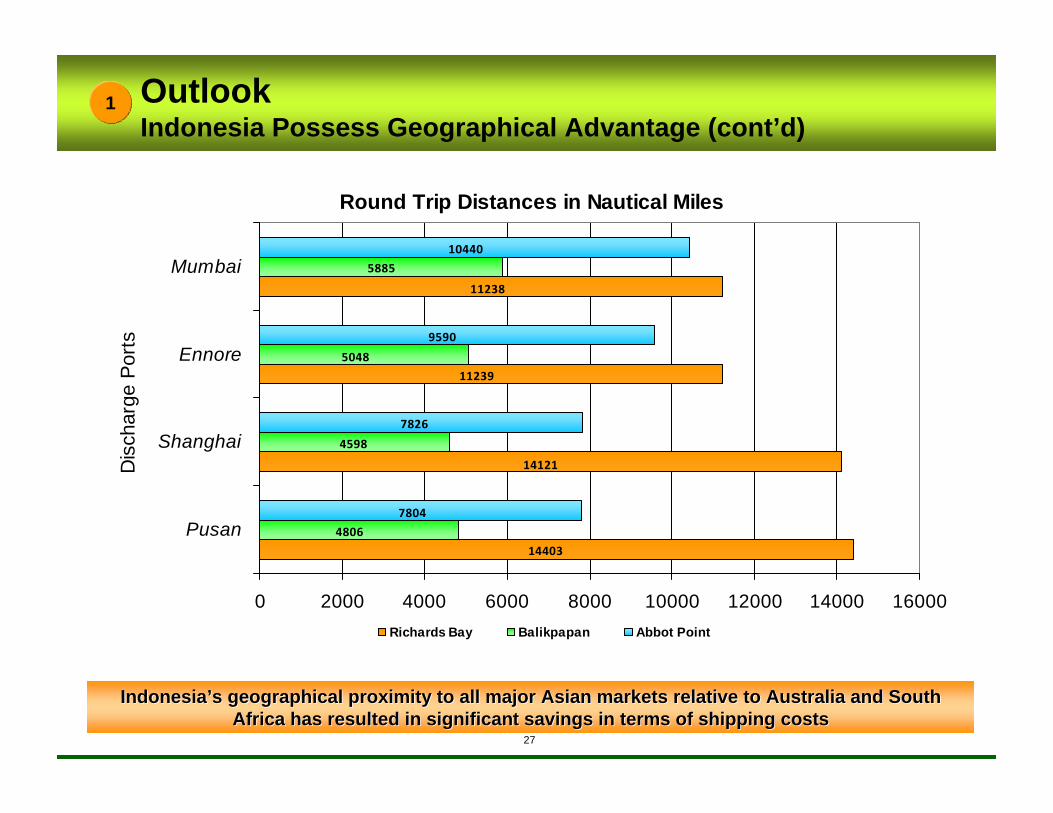
Round Trip Distances in Nautical Miles
14403
14121
11239
11238
4806
4598
5048
5885
7804
7826
9590
10440
0 2000 4000 6000 8000 10000 12000 14000 16000
Pusan
Shanghai
Ennore
Mumbai
Dis
char
ge P
orts
Richards Bay Balikpapan Abbot Point
IndonesiaIndonesia’’s geographical proximity to all major Asian markets relative to s geographical proximity to all major Asian markets relative to Australia and South Australia and South Africa has resulted in significant savings in terms of shipping Africa has resulted in significant savings in terms of shipping costscosts
1
27
OutlookIndonesia Possess Geographical Advantage (cont’d)

28
Track Record of Production Growth Continues…CAGR of 11% since LBO
Despite a difficult first half in 2009 due to global financial mDespite a difficult first half in 2009 due to global financial meltdown and seasonally wet conditions; eltdown and seasonally wet conditions; Adaro recovered sales in the second half by a significant marginAdaro recovered sales in the second half by a significant margin to register a to register a y/yy/y growth of 0.8%growth of 0.8%
2Key Investment
Highlights
Another Record Breaking Year Another Record Breaking Year –– AdaroAdaro’’s production crosses 40 million ton marks production crosses 40 million ton mark
1.0 1.4 2.45.5
8.6 9.410.9
13.615.5
17.7
20.822.5
24.326.7
34.436.1
38.540.6
0
5
10
15
20
25
30
35
40
45
1992 1993 1994 1995 1996 1997 1998 1999 2000 2001 2002 2003 2004 2005 2006 2007 2008 2009
MT
Start of Asian Financial Crisis
Start of US Financial Crisis
Law 41 on Forestry Passed
Period of Decentralization/Regional Autonomy
Law 22 and Law 25 of 1999 on Regional Autonomy
Bali Bomb Tsunami
LBO of Adaro
Adaro begins commercial operations
2005 - 09 CAGR: 11%
PeriodSales in
FY09Sales in
FY10Increase/Decrease
1Q 8.73 11.46 31%2Q 9.10 10.29 13%1H 17.83 21.75 22%

29
448 414938 930
1,920
2,841
2,8033,483 3,483
889
2005 2006 2007 2008 2009Reserves Resources
Through ongoing exploration, Adaro expects to be able to grow itThrough ongoing exploration, Adaro expects to be able to grow its reserve bases reserve base
Adaro Indonesia’s reserves growth
Large Reserve Base2Key Investment
Highlights
(Mt)3,483
2,803
2,368
2,841
(Mt)
Reserves and resources evolution
3,483
448
889+618
(177)
2005 2005-09Production
Addition 2009
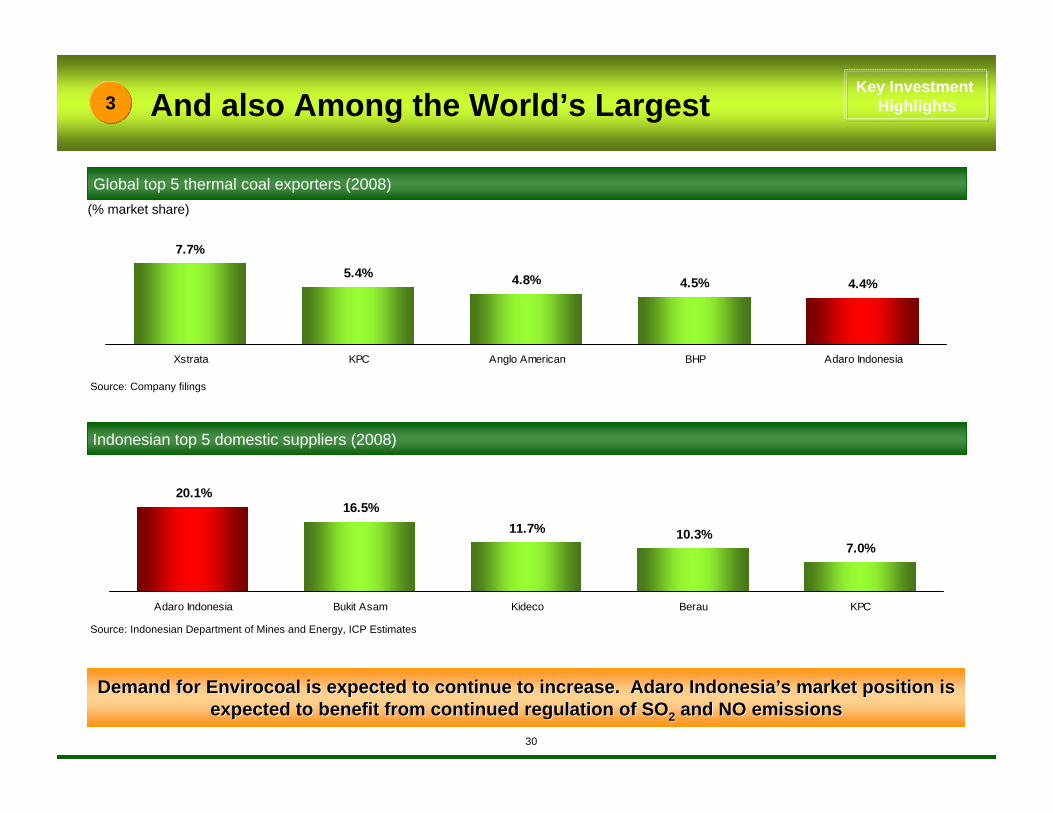
7.7%
5.4% 4.8% 4.5% 4.4%
Xstrata KPC Anglo American BHP Adaro Indonesia
Source: Company filings
Global top 5 thermal coal exporters (2008)(% market share)
Source: Indonesian Department of Mines and Energy, ICP Estimates
Indonesian top 5 domestic suppliers (2008)
Demand for Envirocoal is expected to continue to increase. AdarDemand for Envirocoal is expected to continue to increase. Adaro Indonesiao Indonesia’’s market position is s market position is expected to benefit from continued regulation of SOexpected to benefit from continued regulation of SO22 and NO emissionsand NO emissions
20.1%16.5%
11.7% 10.3%7.0%
Adaro Indonesia Bukit Asam Kideco Berau KPC
And also Among the World’s Largest3Key Investment
Highlights
30
31
20.221.6
23.7
29.730.3
10
15
20
25
30
35
2005 2006 2007 2008 2009
31
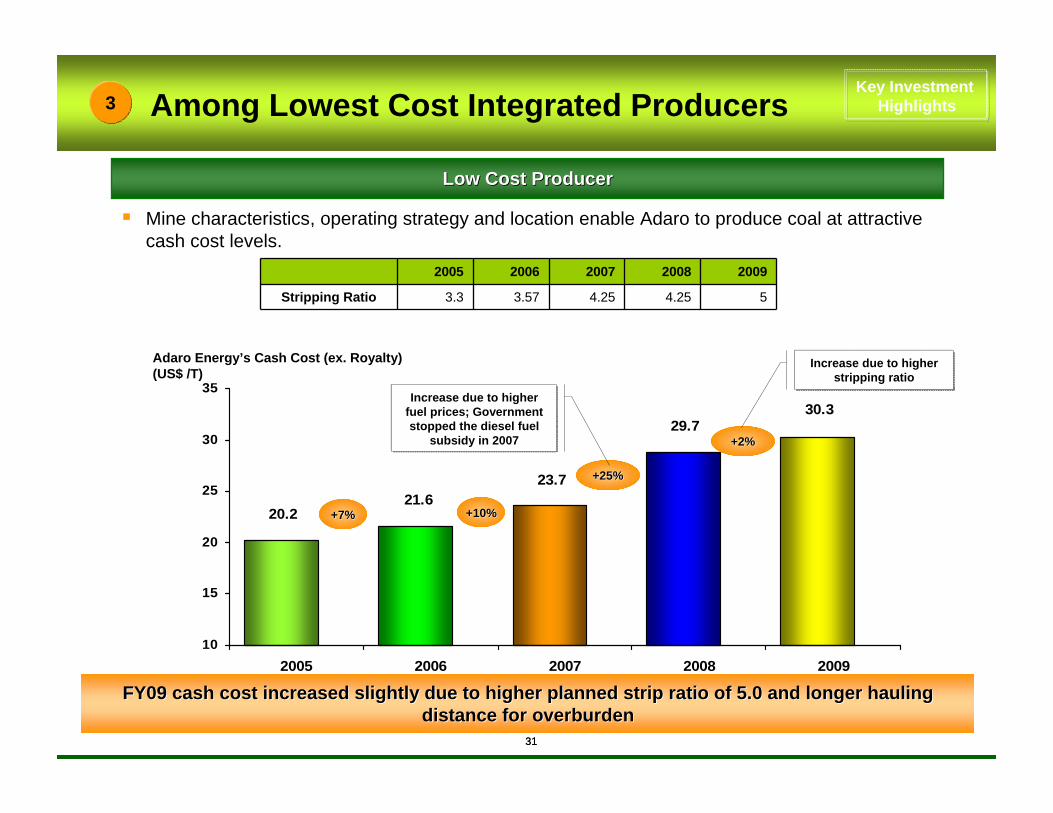
Low Cost ProducerLow Cost Producer
Mine characteristics, operating strategy and location enable Adaro to produce coal at attractive cash cost levels.
Adaro Energy’s Cash Cost (ex. Royalty) (US$ /T)
+10%+10%+7%+7%
+25%+25%
Among Lowest Cost Integrated Producers3Key Investment
Highlights
FY09 cash cost increased slightly due to higher planned strip raFY09 cash cost increased slightly due to higher planned strip ratio of 5.0 and longer hauling tio of 5.0 and longer hauling distancedistance for overburdenfor overburden
Increase due to higher fuel prices; Government stopped the diesel fuel
subsidy in 2007
2005 2006 2007 2008 2009
Stripping Ratio 3.3 3.57 4.25 4.25 5
+2%+2%
Increase due to higher stripping ratio
3232
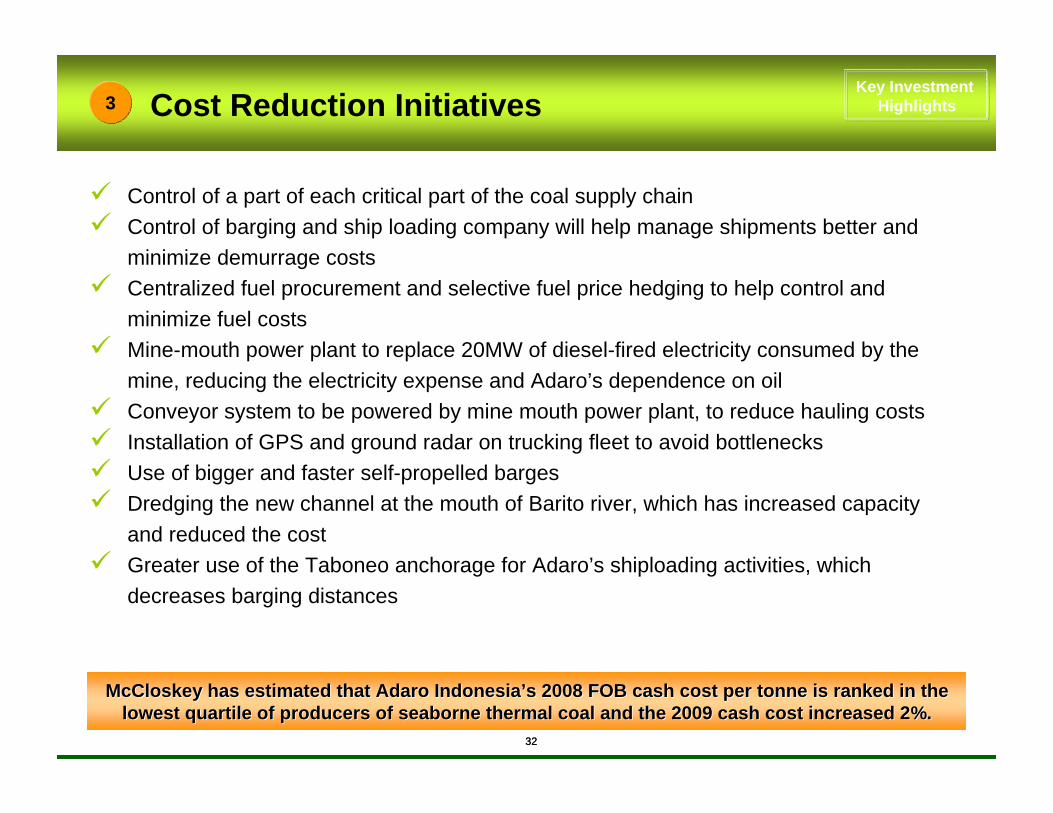
Control of a part of each critical part of the coal supply chainControl of barging and ship loading company will help manage shipments better and minimize demurrage costsCentralized fuel procurement and selective fuel price hedging to help control and minimize fuel costsMine-mouth power plant to replace 20MW of diesel-fired electricity consumed by the mine, reducing the electricity expense and Adaro’s dependence on oilConveyor system to be powered by mine mouth power plant, to reduce hauling costsInstallation of GPS and ground radar on trucking fleet to avoid bottlenecksUse of bigger and faster self-propelled bargesDredging the new channel at the mouth of Barito river, which has increased capacity and reduced the costGreater use of the Taboneo anchorage for Adaro’s shiploading activities, which decreases barging distances
Cost Reduction Initiatives3
McCloskey has estimated that Adaro IndonesiaMcCloskey has estimated that Adaro Indonesia’’s 2008 FOB cash cost per tonne is ranked in the s 2008 FOB cash cost per tonne is ranked in the lowest quartile of producers of seaborne thermal coal and the 20lowest quartile of producers of seaborne thermal coal and the 2009 cash cost increased 2%.09 cash cost increased 2%.
Key Investment Highlights
33
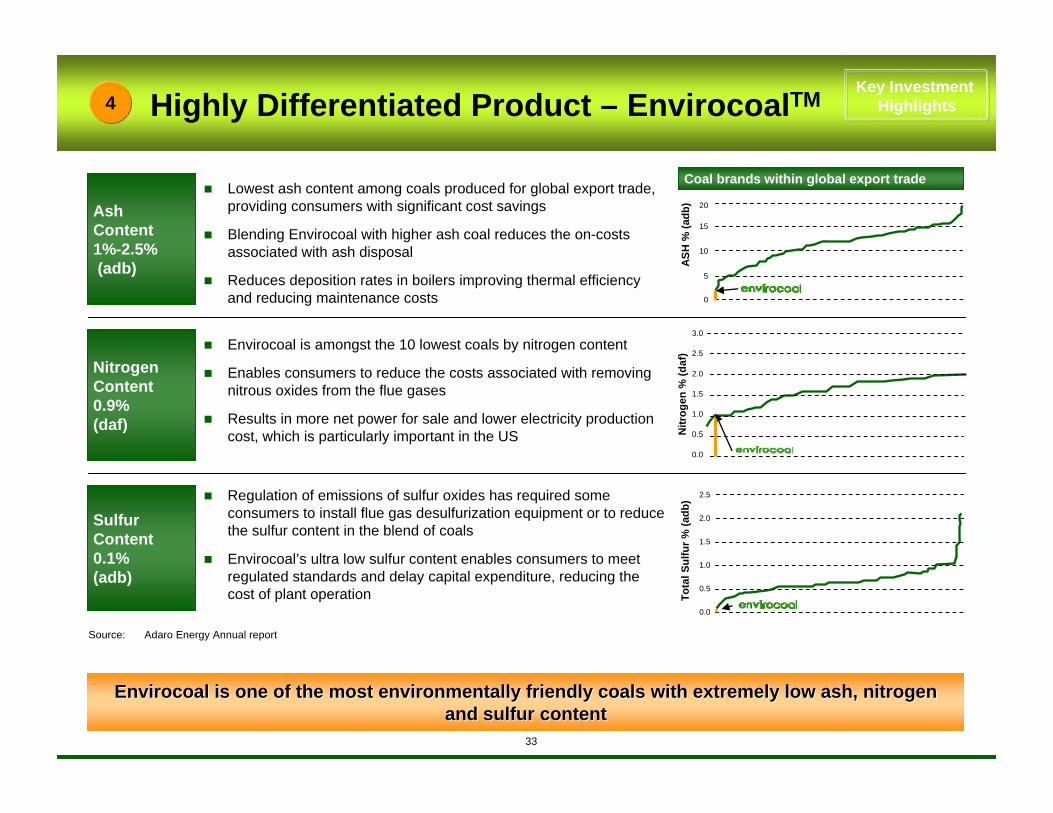
Highly Differentiated Product – EnvirocoalTM
Lowest ash content among coals produced for global export trade,providing consumers with significant cost savings
Blending Envirocoal with higher ash coal reduces the on-costs associated with ash disposal
Reduces deposition rates in boilers improving thermal efficiencyand reducing maintenance costs
Ash Content1%-2.5%(adb)
Nitrogen Content0.9%(daf)
Sulfur Content0.1% (adb)
Envirocoal is amongst the 10 lowest coals by nitrogen content
Enables consumers to reduce the costs associated with removing nitrous oxides from the flue gases
Results in more net power for sale and lower electricity production cost, which is particularly important in the US
Regulation of emissions of sulfur oxides has required some consumers to install flue gas desulfurization equipment or to reduce the sulfur content in the blend of coals
Envirocoal’s ultra low sulfur content enables consumers to meet regulated standards and delay capital expenditure, reducing the cost of plant operation
25
ASH
% (a
db)
0
5
10
15
20
0.0
0.5
1.0
1.5
2.0
2.5
3.0
Nitr
ogen
% (d
af)
0.0
0.5
1.0
1.5
2.0
2.5
Tota
l Sul
fur %
(adb
)Envirocoal is one of the most environmentally friendly coals witEnvirocoal is one of the most environmentally friendly coals with extremely low ash, nitrogen h extremely low ash, nitrogen
and sulfur contentand sulfur content
Source: Adaro Energy Annual report
Coal brands within global export trade
4Key Investment
Highlights

34
Envirocoal was the design coal for Manjung Power Station and is used to meet strict emission standards
Malaysia Tata Power uses Envirocoal to limit sulfur emissions from its Mumbai power station
India
Sales to power plants switching to low sulfur, low NOX emission coals to meet strict environmental requirements
United KingdomPuentes and Meirama power stations converted to use Envirocoal to meet strict EEC emission regulations
Spain
Brindisi North station was closed due to high emissions. The government allowed it to re-open but only if it uses Envirocoal
Italy
Allows power stations to save substantially on ash disposal costs
Exports to Huntly power station due to severe restrictions on ash disposal
Hong Kong Use of Envirocoal at its power station has allowed Castle Peak Power to meet emission requirements of the Government
Japan
New Zealand
Envirocoal has proven global acceptanceEnvirocoal has proven global acceptance
Distributes coal to multiple power stations in Indonesia
Indonesia
Around 80% of customers by volume in FY09 were power generation companies
A power station uses pure Envirocoal as an alternative to spending on advanced emissions control equipment
East Coast U.S.
Global Leader in Growing International Market of ‘Environmental Coal’
5Key Investment
Highlights
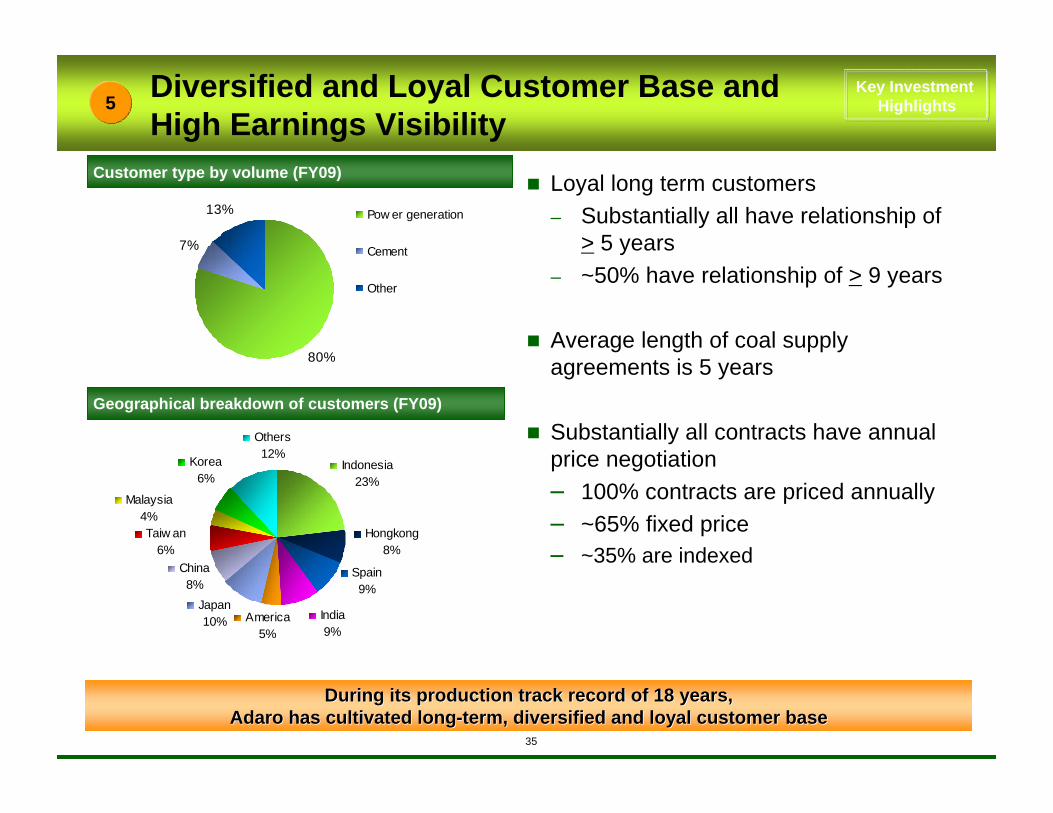
35
Spain9%
India9%
America5%
Hongkong8%
Indonesia23%
Others12%
Taiw an6%
Malaysia4%
Japan10%
China8%
Korea6%
7%
13%
80%
Pow er generation
Cement
Other
Diversified and Loyal Customer Base and High Earnings Visibility
Customer type by volume (FY09)
Geographical breakdown of customers (FY09)
During its production track record of 18 years, During its production track record of 18 years, Adaro has cultivated longAdaro has cultivated long--term, diversified and loyal customer baseterm, diversified and loyal customer base
Loyal long term customers– Substantially all have relationship of
> 5 years– ~50% have relationship of > 9 years
Average length of coal supply agreements is 5 years
Substantially all contracts have annual price negotiation– 100% contracts are priced annually– ~65% fixed price– ~35% are indexed
5Key Investment
Highlights

36
Thank you