maylina dinda a / 21208433 pembimbing: prof. dr. ir...
TRANSCRIPT
ANALISIS POTENSI KEBANGKRUTAN PADA
PERUSAHAAN PROPERTI DAN REAL ESTATE YANG TELAH GO
PUBLIK DI BURSA EFEK INDONESIA DENGAN MODEL
ALTMAN Z-SCORE
Maylina Dinda A / 21208433
Pembimbing:
Prof. Dr. Ir. Euphrasia Susy Suhendra, MS
1. Pendahuluan Latar Belakang Masalah
VP Research & Analys PT Valbury Asia Securities, Nico Omer
Jonckheere menyatakan :
• Selain adanya Subprime mortgage juga terdapat Alt-A dan Option
ARM
• Turunnya harga properti komersial lebih dari 34% sepanjang 2009
• Nasabah yang gagal membayar cicilannya meningkat dari 1%
menjadi 9%
• Lebih dari 2.600 bank di AS memiliki portofolio pinjaman
properti komersial di atas 300% dari batasan risiko yang
ditetapkan
• Analisis kebangkrutan z-score

• Bagaimana penentuan potensi kebangkrutan pada perusahaan
properti dan real estate yang telah go publik di Bursa Efek
Indonesia dengan model Altman Z-Score?
• Bagaimana potensi kebangkrutan pada perusahaan properti dan
real estate yang telah go publik di Bursa Efek Indonesia?
• Bagaimana pengaruh rasio Working Capital to Total Asset Ratio
(WCTA), Retained Earned to Total Asset Ratio (RETA), Earning
Before Interest and Taxes to Total Assets Ratio (EBITTA),Market
Value of Equity to Book Value of Total Liabilities Ratio
(MVEBVL) terhadap potensi kebangkrutan pada perusahaan
properti dan real estate yang telah go publik di Bursa Efek
Indonesia?
Rumusan Masalah
Tujuan Penelitian
1. Untuk mengetahui penentuan potensi kebangkrutan pada
perusahaan properti dan real estate yang telah go public di Bursa
Efek Indonesia dengan model Altman Z-Score.
2. Untuk mengetahui potensi kebangkrutan pada perusahaan properti
dan real estate yang telah go publik di Bursa Efek Indonesia.
3. Untuk menganalisis pengaruh rasio Working Capital to Total
Asset Ratio (WCTA), Retained Earned to Total Asset Ratio
(RETA), Earning Before Interest and Taxes to Total Assets Ratio
(EBITTA), Market Value of Equity to Book Value of Total
Liabilities Ratio (MVEBVL) terhadap potensi kebangkrutan pada
perusahaan properti dan real estate yang telah go publik di Bursa
Efek Indonesia.

Alat Analisis WCTA
(X1)
RETA
(X2)
EBITA
(X3)
MVEBVL
(X4)
POTENSI
KEBANGKRUTAN MODEL
ALTMAN Z-SCORE
Rumusan Altman Z-score :
Z = 6,56 X1 + 3,26 X2 + 6,72 X3 + 1,05 X4
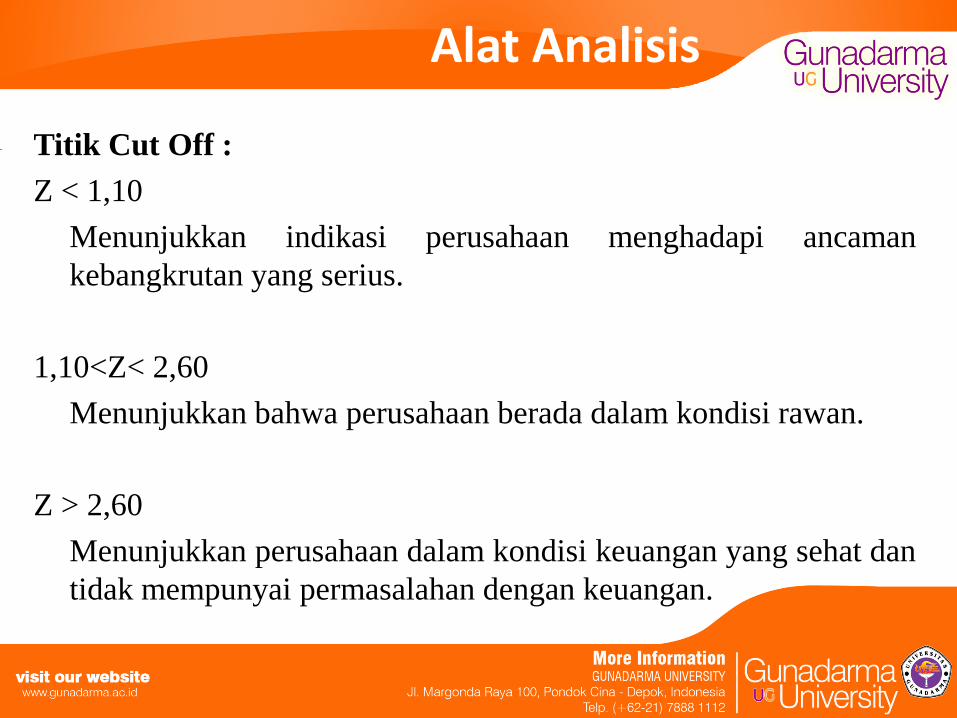
Titik Cut Off :
Z < 1,10
Menunjukkan indikasi perusahaan menghadapi ancaman
kebangkrutan yang serius.
1,10<Z< 2,60
Menunjukkan bahwa perusahaan berada dalam kondisi rawan.
Z > 2,60
Menunjukkan perusahaan dalam kondisi keuangan yang sehat dan
tidak mempunyai permasalahan dengan keuangan.
Alat Analisis

2. Landasan Teori
• Laporan Keuangan
• Kebangkrutan
• Metode Altman Z-score
3. Metodologi Penelitian
Pemilihan sampel penelitian didasarkan pada metode
purposive sampling.
Kriteria pemilihan sampel:
• Perusahaan sudah terdaftar di Bursa Efek Indonesia
minimal sejak Januari 2009.
• Menerbitkan laporan keuangan per 31 Desember
berturut-turut selama periode 2009-2011.
• Perusahaan tersebut menyertakan besarnya biaya bunga
secara eksplisit, sehingga nilai EBIT dapat ditentukan.
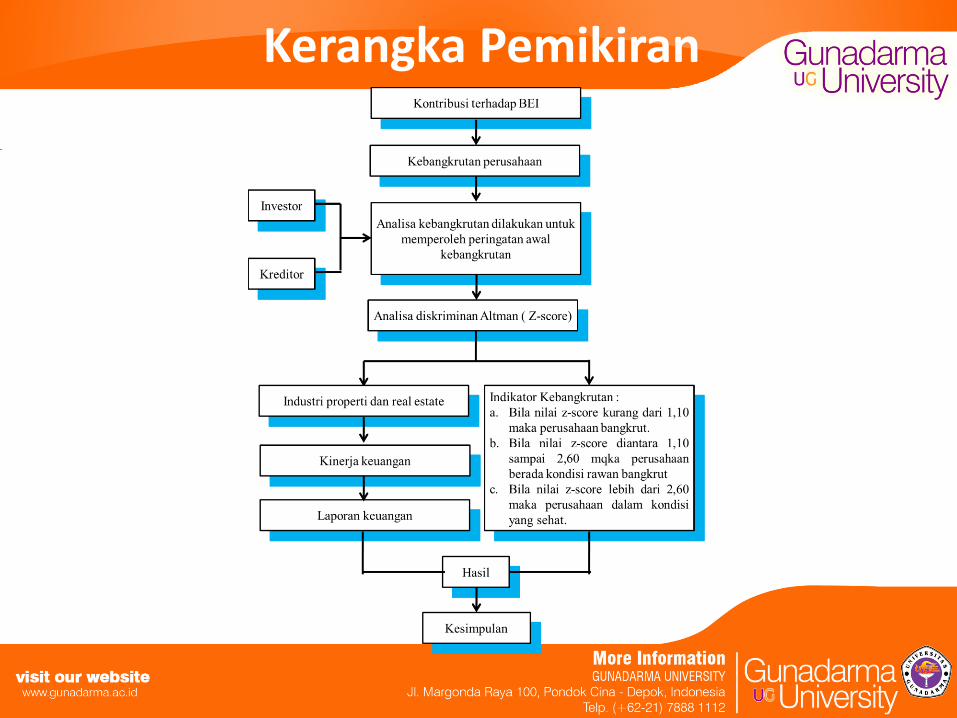
Kerangka Pemikiran
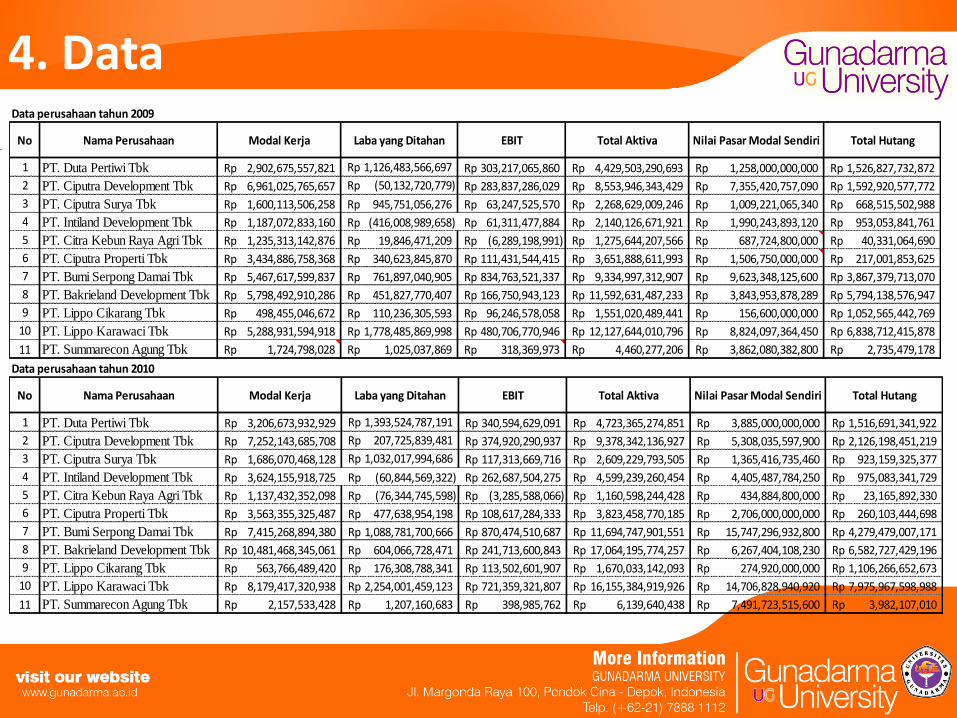
4. Data Data perusahaan tahun 2009
1 PT. Duta Pertiwi Tbk 2,902,675,557,821Rp 1,126,483,566,697Rp 303,217,065,860Rp 4,429,503,290,693Rp 1,258,000,000,000Rp 1,526,827,732,872Rp
2 PT. Ciputra Development Tbk 6,961,025,765,657Rp (50,132,720,779)Rp 283,837,286,029Rp 8,553,946,343,429Rp 7,355,420,757,090Rp 1,592,920,577,772Rp
3 PT. Ciputra Surya Tbk 1,600,113,506,258Rp 945,751,056,276Rp 63,247,525,570Rp 2,268,629,009,246Rp 1,009,221,065,340Rp 668,515,502,988Rp
4 PT. Intiland Development Tbk 1,187,072,833,160Rp (416,008,989,658)Rp 61,311,477,884Rp 2,140,126,671,921Rp 1,990,243,893,120Rp 953,053,841,761Rp
5 PT. Citra Kebun Raya Agri Tbk 1,235,313,142,876Rp 19,846,471,209Rp (6,289,198,991)Rp 1,275,644,207,566Rp 687,724,800,000Rp 40,331,064,690Rp
6 PT. Ciputra Properti Tbk 3,434,886,758,368Rp 340,623,845,870Rp 111,431,544,415Rp 3,651,888,611,993Rp 1,506,750,000,000Rp 217,001,853,625Rp
7 PT. Bumi Serpong Damai Tbk 5,467,617,599,837Rp 761,897,040,905Rp 834,763,521,337Rp 9,334,997,312,907Rp 9,623,348,125,600Rp 3,867,379,713,070Rp
8 PT. Bakrieland Development Tbk 5,798,492,910,286Rp 451,827,770,407Rp 166,750,943,123Rp 11,592,631,487,233Rp 3,843,953,878,289Rp 5,794,138,576,947Rp
9 PT. Lippo Cikarang Tbk 498,455,046,672Rp 110,236,305,593Rp 96,246,578,058Rp 1,551,020,489,441Rp 156,600,000,000Rp 1,052,565,442,769Rp
10 PT. Lippo Karawaci Tbk 5,288,931,594,918Rp 1,778,485,869,998Rp 480,706,770,946Rp 12,127,644,010,796Rp 8,824,097,364,450Rp 6,838,712,415,878Rp
11 PT. Summarecon Agung Tbk 1,724,798,028Rp 1,025,037,869Rp 318,369,973Rp 4,460,277,206Rp 3,862,080,382,800Rp 2,735,479,178Rp
Total Aktiva Nilai Pasar Modal Sendiri Total HutangNo Nama Perusahaan Modal Kerja Laba yang Ditahan EBIT
Data perusahaan tahun 2010
1 PT. Duta Pertiwi Tbk 3,206,673,932,929Rp 1,393,524,787,191Rp 340,594,629,091Rp 4,723,365,274,851Rp 3,885,000,000,000Rp 1,516,691,341,922Rp
2 PT. Ciputra Development Tbk 7,252,143,685,708Rp 207,725,839,481Rp 374,920,290,937Rp 9,378,342,136,927Rp 5,308,035,597,900Rp 2,126,198,451,219Rp
3 PT. Ciputra Surya Tbk 1,686,070,468,128Rp 1,032,017,994,686Rp 117,313,669,716Rp 2,609,229,793,505Rp 1,365,416,735,460Rp 923,159,325,377Rp
4 PT. Intiland Development Tbk 3,624,155,918,725Rp (60,844,569,322)Rp 262,687,504,275Rp 4,599,239,260,454Rp 4,405,487,784,250Rp 975,083,341,729Rp
5 PT. Citra Kebun Raya Agri Tbk 1,137,432,352,098Rp (76,344,745,598)Rp (3,285,588,066)Rp 1,160,598,244,428Rp 434,884,800,000Rp 23,165,892,330Rp
6 PT. Ciputra Properti Tbk 3,563,355,325,487Rp 477,638,954,198Rp 108,617,284,333Rp 3,823,458,770,185Rp 2,706,000,000,000Rp 260,103,444,698Rp
7 PT. Bumi Serpong Damai Tbk 7,415,268,894,380Rp 1,088,781,700,666Rp 870,474,510,687Rp 11,694,747,901,551Rp 15,747,296,932,800Rp 4,279,479,007,171Rp
8 PT. Bakrieland Development Tbk 10,481,468,345,061Rp 604,066,728,471Rp 241,713,600,843Rp 17,064,195,774,257Rp 6,267,404,108,230Rp 6,582,727,429,196Rp
9 PT. Lippo Cikarang Tbk 563,766,489,420Rp 176,308,788,341Rp 113,502,601,907Rp 1,670,033,142,093Rp 274,920,000,000Rp 1,106,266,652,673Rp
10 PT. Lippo Karawaci Tbk 8,179,417,320,938Rp 2,254,001,459,123Rp 721,359,321,807Rp 16,155,384,919,926Rp 14,706,828,940,920Rp 7,975,967,598,988Rp
11 PT. Summarecon Agung Tbk 2,157,533,428Rp 1,207,160,683Rp 398,985,762Rp 6,139,640,438Rp 7,491,723,515,600Rp 3,982,107,010Rp
No Nama Perusahaan Modal Kerja Laba yang Ditahan EBIT Total Aktiva Nilai Pasar Modal Sendiri Total Hutang
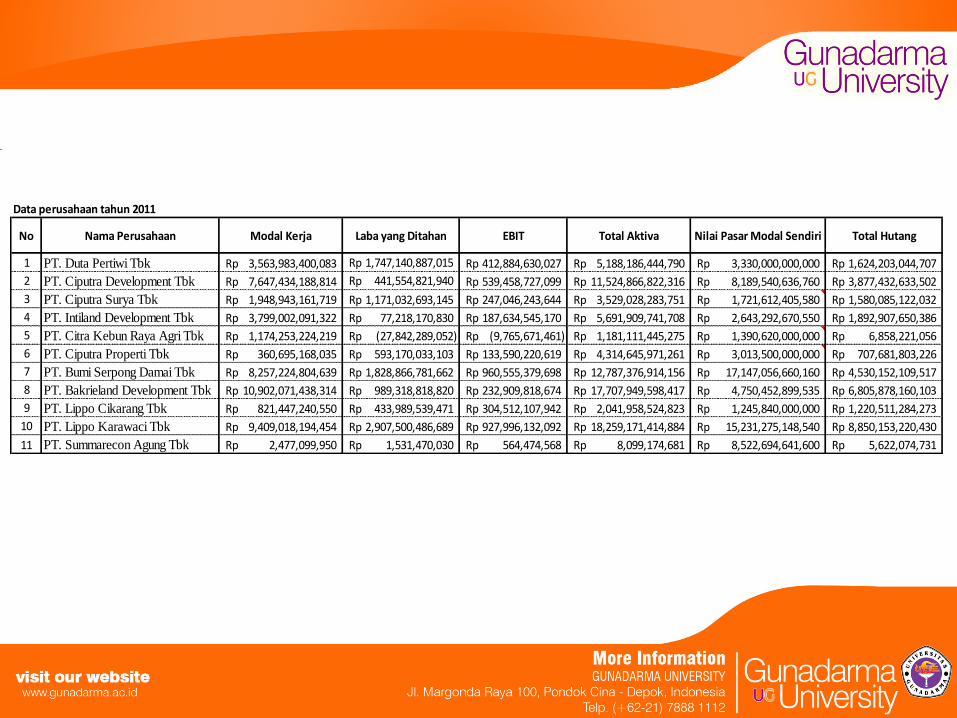
Data perusahaan tahun 2011
1 PT. Duta Pertiwi Tbk 3,563,983,400,083Rp 1,747,140,887,015Rp 412,884,630,027Rp 5,188,186,444,790Rp 3,330,000,000,000Rp 1,624,203,044,707Rp
2 PT. Ciputra Development Tbk 7,647,434,188,814Rp 441,554,821,940Rp 539,458,727,099Rp 11,524,866,822,316Rp 8,189,540,636,760Rp 3,877,432,633,502Rp
3 PT. Ciputra Surya Tbk 1,948,943,161,719Rp 1,171,032,693,145Rp 247,046,243,644Rp 3,529,028,283,751Rp 1,721,612,405,580Rp 1,580,085,122,032Rp
4 PT. Intiland Development Tbk 3,799,002,091,322Rp 77,218,170,830Rp 187,634,545,170Rp 5,691,909,741,708Rp 2,643,292,670,550Rp 1,892,907,650,386Rp
5 PT. Citra Kebun Raya Agri Tbk 1,174,253,224,219Rp (27,842,289,052)Rp (9,765,671,461)Rp 1,181,111,445,275Rp 1,390,620,000,000Rp 6,858,221,056Rp
6 PT. Ciputra Properti Tbk 360,695,168,035Rp 593,170,033,103Rp 133,590,220,619Rp 4,314,645,971,261Rp 3,013,500,000,000Rp 707,681,803,226Rp
7 PT. Bumi Serpong Damai Tbk 8,257,224,804,639Rp 1,828,866,781,662Rp 960,555,379,698Rp 12,787,376,914,156Rp 17,147,056,660,160Rp 4,530,152,109,517Rp
8 PT. Bakrieland Development Tbk 10,902,071,438,314Rp 989,318,818,820Rp 232,909,818,674Rp 17,707,949,598,417Rp 4,750,452,899,535Rp 6,805,878,160,103Rp
9 PT. Lippo Cikarang Tbk 821,447,240,550Rp 433,989,539,471Rp 304,512,107,942Rp 2,041,958,524,823Rp 1,245,840,000,000Rp 1,220,511,284,273Rp
10 PT. Lippo Karawaci Tbk 9,409,018,194,454Rp 2,907,500,486,689Rp 927,996,132,092Rp 18,259,171,414,884Rp 15,231,275,148,540Rp 8,850,153,220,430Rp
11 PT. Summarecon Agung Tbk 2,477,099,950Rp 1,531,470,030Rp 564,474,568Rp 8,099,174,681Rp 8,522,694,641,600Rp 5,622,074,731Rp
Total AktivaNo Nama Perusahaan Modal Kerja Laba yang Ditahan EBIT Nilai Pasar Modal Sendiri Total Hutang

4. Hasil dan Pembahasan
PT. Duta Pertiwi
0.655 0.254 0.068 0.824 6.453 Sehat A
0.679 0.295 0.072 2.561 8.589 Sehat AAA
0.687 0.337 0.080 2.050 8.292 Sehat AAA
PT Ciputra Development
0.814 -0.006 0.033 4.618 10.391 Sehat AAA
0.773 0.022 0.040 2.496 8.035 Sehat AA+
0.664 0.038 0.047 2.112 7.010 Sehat AA-
PT Ciputra Surya
0.705 0.417 0.028 1.510 7.758 Sehat AA
0.646 0.396 0.045 1.479 7.384 Sehat AA
0.552 0.332 0.070 1.090 6.319 Sehat BBB+
PT Intiland development
0.539 -0.194 0.028 2.088 5.283 Sehat BB+
0.788 -0.013 0.057 4.518 10.253 Sehat AAA
0.667 0.014 0.033 1.396 6.110 Sehat BBB
PT Citra Kebun Raya Agri
0.968 0.016 -0.005 17.052 24.275 Sehat AAA
0.980 -0.066 -0.003 18.773 25.907 Sehat AAA
0.994 -0.024 -0.008 202.767 219.295 Sehat AAA
PT Ciputra Properti
0.941 0.093 0.031 6.943 13.970 Sehat AAA
0.932 0.125 0.028 10.404 17.636 Sehat AAA
0.084 0.137 0.031 4.258 5.676 Sehat BBB-
PT Bumi Serpong Damai
0.586 0.082 0.089 2.488 7.322 Sehat AA
0.634 0.093 0.074 3.680 8.827 Sehat AAA
0.646 0.143 0.075 3.785 9.181 Sehat AAA
PT Bakrieland Development
0.500 0.039 0.014 0.663 4.202 Sehat B
0.614 0.035 0.014 0.952 5.240 Sehat BB
0.616 0.056 0.013 0.698 5.042 Sehat BB
PT Lippo Cikarang
0.321 0.071 0.062 0.149 2.913 Rawan CCC
0.338 0.106 0.068 0.249 3.276 Sehat CCC+
0.402 0.213 0.149 1.021 5.406 Sehat BB+
PT Lippo Karawaci
0.436 0.147 0.040 1.290 4.960 Sehat BB
0.506 0.140 0.045 1.844 6.012 Sehat BBB
0.515 0.159 0.051 1.721 6.048 Sehat BBB
PT Summarecon Agung
0.387 0.230 0.071 1411.848 1486.206 Sehat AAA
0.351 0.197 0.065 1881.347 1978.797 Sehat AAA
0.306 0.189 0.070 1515.934 1594.822 Sehat AAA
RatingX1 X2 X3 X4 Z-Score Kategori
2010
2011
2009
2010
2011
Nama Perusahaan
2011
2010
2011
2009
2009
2011
2009
2010
2011
2009
2010
2011
2009
2010
2011
2009
2010
2009
2010
2011
2009
2010
2011
2009
2010
11
4
5
6
7
8
No.
1
2
3
10
9
2011
2009
2010

4. Hasil dan Pembahasan
PT. Duta Pertiwi
0.655 0.254 0.068 0.824 6.453 Sehat A
0.679 0.295 0.072 2.561 8.589 Sehat AAA
0.687 0.337 0.080 2.050 8.292 Sehat AAA
PT Ciputra Development
0.814 -0.006 0.033 4.618 10.391 Sehat AAA
0.773 0.022 0.040 2.496 8.035 Sehat AA+
0.664 0.038 0.047 2.112 7.010 Sehat AA-
PT Ciputra Surya
0.705 0.417 0.028 1.510 7.758 Sehat AA
0.646 0.396 0.045 1.479 7.384 Sehat AA
0.552 0.332 0.070 1.090 6.319 Sehat BBB+
PT Intiland development
0.539 -0.194 0.028 2.088 5.283 Sehat BB+
0.788 -0.013 0.057 4.518 10.253 Sehat AAA
0.667 0.014 0.033 1.396 6.110 Sehat BBB
PT Citra Kebun Raya Agri
0.968 0.016 -0.005 17.052 24.275 Sehat AAA
0.980 -0.066 -0.003 18.773 25.907 Sehat AAA
0.994 -0.024 -0.008 202.767 219.295 Sehat AAA
PT Ciputra Properti X1 X2 X3 X4 Z-Score Kategori Rating
0.941 0.093 0.031 6.943 13.970 Sehat AAA
0.932 0.125 0.028 10.404 17.636 Sehat AAA
0.084 0.137 0.031 4.258 5.676 Sehat BBB-
PT Bumi Serpong Damai
0.586 0.082 0.089 2.488 7.322 Sehat AA
0.634 0.093 0.074 3.680 8.827 Sehat AAA
0.646 0.143 0.075 3.785 9.181 Sehat AAA
PT Bakrieland Development
0.500 0.039 0.014 0.663 4.202 Sehat B
0.614 0.035 0.014 0.952 5.240 Sehat BB
0.616 0.056 0.013 0.698 5.042 Sehat BB
PT Lippo Cikarang
0.321 0.071 0.062 0.149 2.913 Rawan CCC
0.338 0.106 0.068 0.249 3.276 Sehat CCC+
0.402 0.213 0.149 1.021 5.406 Sehat BB+
PT Lippo Karawaci
0.436 0.147 0.040 1.290 4.960 Sehat BB
0.506 0.140 0.045 1.844 6.012 Sehat BBB
0.515 0.159 0.051 1.721 6.048 Sehat BBB
PT Summarecon Agung
0.387 0.230 0.071 1411.848 1486.206 Sehat AAA
0.351 0.197 0.065 1881.347 1978.797 Sehat AAA
0.306 0.189 0.070 1515.934 1594.822 Sehat AAA
RatingX1 X2 X3 X4 Z-Score Kategori
2010
2011
2009
2010
2011
Nama Perusahaan
2011
2010
2011
2009
2009
2011
2009
2010
2011
2009
2010
2011
2009
2010
2011
2009
2010
2009
2010
2011
2009
2010
2011
2009
2010
11
4
5
6
7
8
No.
1
2
3
10
9
2011
2009
2010

5. Kesimpulan 1. Penentuan Z-Score :
Rumusan Altman Z-score :
Z = 6,56 X1 + 3,26 X2 + 6,72 X3 + 1,05 X4
Kesimpulan
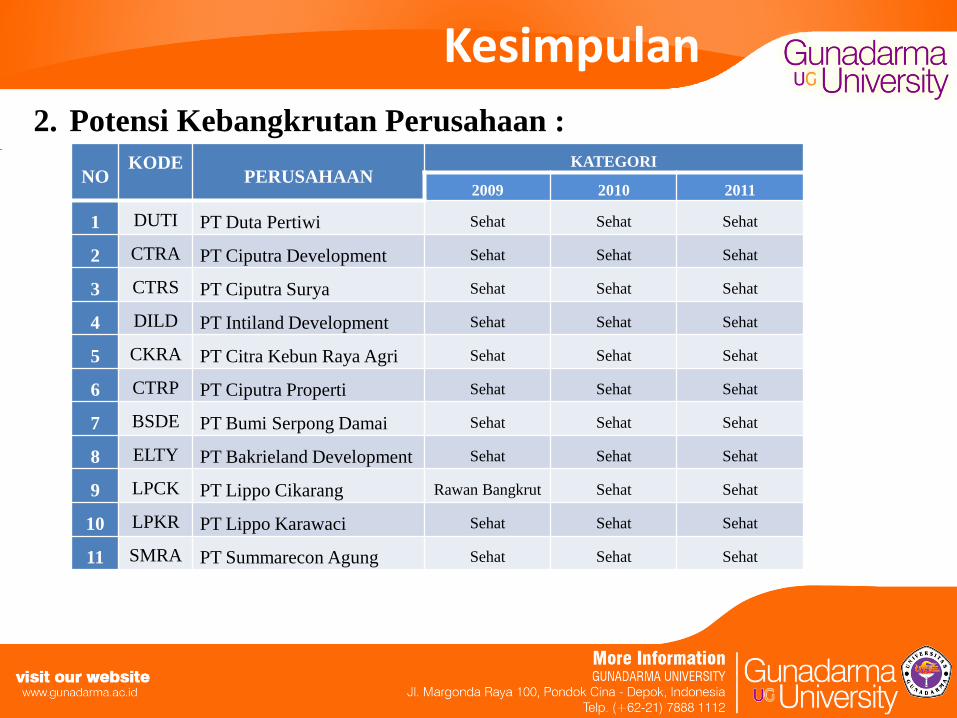
2. Potensi Kebangkrutan Perusahaan :
NO KODE
PERUSAHAAN KATEGORI
2009 2010 2011
1 DUTI PT Duta Pertiwi Sehat Sehat Sehat
2 CTRA PT Ciputra Development Sehat Sehat Sehat
3 CTRS PT Ciputra Surya Sehat Sehat Sehat
4 DILD PT Intiland Development Sehat Sehat Sehat
5 CKRA PT Citra Kebun Raya Agri Sehat Sehat Sehat
6 CTRP PT Ciputra Properti Sehat Sehat Sehat
7 BSDE PT Bumi Serpong Damai Sehat Sehat Sehat
8 ELTY PT Bakrieland Development Sehat Sehat Sehat
9 LPCK PT Lippo Cikarang Rawan Bangkrut Sehat Sehat
10 LPKR PT Lippo Karawaci Sehat Sehat Sehat
11 SMRA PT Summarecon Agung Sehat Sehat Sehat
Kesimpulan
3. Pengaruh WCTA, RETA, EBITTA, MVEBVL
Semakin tinggi nilai WCTA, RETA, EBITTA, MVEBVL maka
nilai Overall Indeks (Z-Score) keseluruhan semakin tinggi pula,
sehingga perusahaan yang memiliki nilai Overall Indeks tinggi,
maka kondisi keuangan perusahaan tersebut sehat atau aman dari
kebangkrutan.

Saran dan Implikasi
1. Bagi perusahaan yang berada pada kondisi keuangan yang sehat
2. Bagi perusahaan yang berada pada posisi gray area
3. Bila perusahaan ingin selalu berada pada kondisi keuangan yang
sehat

THE END THANK YOU