gold (usd/ounce) 1,524.84 8:08:05 am 18.94 nickel (usd/mn … · 2019. 9. 2. · hun 2016 tentang...
TRANSCRIPT
1
Today’s Market:
IHSG diperkirakan bergerak mixed dengan kecenderungan
melemah. Bursa AS ditutup mixed pada perdagangan Ju-
mat (30/08). Harga batubara stabil di level USD 65.75 per
Mt. Crude oil turun ke level USD 54.82 per barrel. Rupiah
menguat terhadap Dollar AS di level Rp 14.189. 10Yr Gov-
ernment Bonds Yield turun ke level 7.33%.
Dari global, Presiden AS memastikan tarif 15% atas seba-
gian dari USD 300 miliar barang impor Tiongkok mulai
berlaku pada 1 September 2019.
Dari dalam negeri, realisasi penyerapan dana fasilitas
likuiditas pembiayaan perumahan (FLPP) hingga Agustus
2019 mencapai 54 ribu unit rumah, atau Rp 5,2 tn, men-
capai 79% dari target tahunan.
Sehubungan dengan industri, pemerintah mempercepat
pelarangan ekspor bijih nikel dari rencana awal Januari
2022 menjadi Desember 2019.
Sehubungan dengan emiten, Elnusa (ELSA) melalui anak
usahanya, PT Elnusa Petrofin (EPN), mengambil alih De-
pot Liquified Petroleum Gas (LPG) Pressurized di Amurang,
Minahasa Selatan. Hal ini dilakukan sebagai cara mendi-
versifikasi bisnis pada segmen distribusi & logistik energi.
Secara teknikal indeks hari Jumat (30/08), IHSG diprediksi
bergerak di kisaran 6289-6353.
Source: Bloomberg, Sinarmas Investment Research See pg. 6-8 for Technical Corner
www.sinarmassekuritas.co.id See important disclaimer at the end of this report
Monday, September 2, 2019
ID X Stat ist ics C lo sing
JCI 6,328.47
Transaction Value Regular M arket (IDR tn) 7.697
Transaction Volume Regular M arket (mn shares) 13,286
Foreign Net Buy (Sell) (IDR bn) 68
Foreign Net Buy (Sell) 4.17
Total M arket Capitalization (IDR tn) 7,284.63
LQ45 995.76 1.41 1.33
EIDO 25.19 0.72 1.49
IDX 22.46 0.66 3.21
DOW JONES 26,403.28 0.16 13.19
S&P 500 2,926.46 0.06 16.74
NASDAQ 7,962.88 (0.13) 20.01
FTSE 7,207.18 0.32 7.12
NIKKEI 20,704.37 1.19 3.45
HANG SENG 25,724.73 0.08 (0.47)
STRAITS TIM ES 3,106.52 0.80 1.23
KLSE 1,612.14 1.06 (4.64)
USD/IDR 14,189.00 (0.24) (1.35)
EUR/IDR 15,600.22 (0.88) (5.50)
JPY/IDR 133.75 0.08 2.35
SGD/IDR 10,211.64 (0.32) (3.34)
AUD/IDR 9,541.79 (0.30) (6.58)
GBP/IDR 17,249.01 (0.44) (6.24)
Crude Oil (USD/barrel) 54.82 7:58:03 AM 20.72
Coal (USD/mn tons) 65.75 8/30/2019 (37.04)
Natural Gas (USD/mmBtu) 2.27 7:57:31 AM (22.62)
Gold (USD/ounce) 1,524.84 8:08:05 AM 18.94
Nickel (USD/mn tons) 18,350.00 8:06:42 AM 71.66
Tins (USD/mn tons) 16,085.00 8:08:03 AM (17.41)
CPO (M YR/mn tons) 2,168.00 8/30/2019 8.18
Rubber (JPY/kg) 159.80 4:43:58 PM (7.09)
Wheat (USD/bushel) 451.25 8/30/2019 (10.33)
Corn (USD/bushel) 358.00 8/30/2019 (4.53)
C o mmo dit ies
Other Indices C lo sing 1-D ay C hg (%)YT D
C hg (%)
C urrency Spo t R ate R ate ( ID R ) 1-D ay C hg (%)YT D
C hg (%)
P riceLast
T ransact io n
YT D
C hg (%)
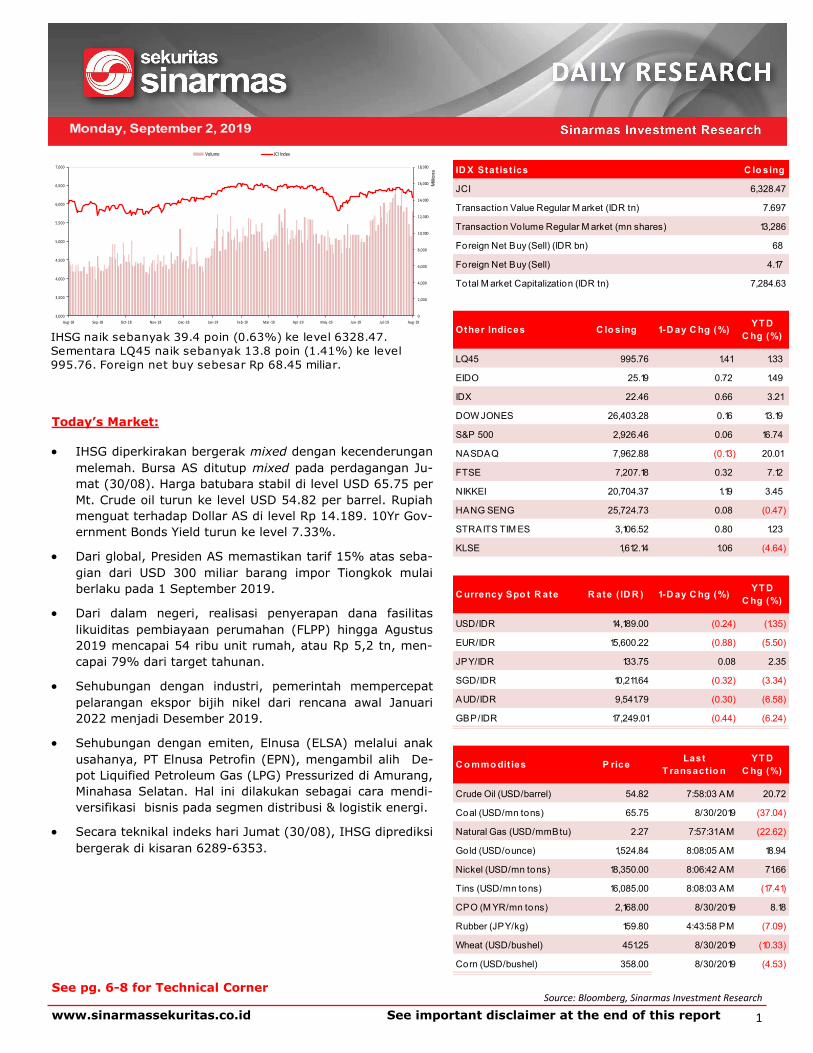
IHSG naik sebanyak 39.4 poin (0.63%) ke level 6328.47.
Sementara LQ45 naik sebanyak 13.8 poin (1.41%) ke level
995.76. Foreign net buy sebesar Rp 68.45 miliar.
0
2,000
4,000
6,000
8,000
10,000
12,000
14,000
16,000
18,000
3,000
3,500
4,000
4,500
5,000
5,500
6,000
6,500
7,000
Aug-18 Sep-18 Oct-18 Nov-18 Dec-18 Jan-19 Feb-19 Mar-19 Apr-19 May-19 Jun-19 Jul-19 Aug-19
Millio
ns
Volume JCI Index
2
Daily Corporate and Industry News
Presiden AS Donald Trump memastikan tarif 15% atas sebagian dari US$ 300 miliar barang impor Tiongkok akan berlaku 1 September 2019. Source: Investor Daily Pemerintah mempercepat pelarangan ekspor bijih nikel dari rencana awal Januari 2022 menjadi Desember 2019. Source: Bisnis Indonesia Koalisi Indonesia Kerja (KIK) yang mendukung presiden terpilih Joko Widodo (Jokowi) dan wakil presiden terpilih Ma’ruf Amin menguasai 60,69% atau 349 kursi di DPR. Mereka terdiri atas PDIP, Golkar, PKB, Nasdem dan PPP. Source: Investor Daily Pembebasan lahan untuk pembangunan Kereta Cepat Jakarta-Bandung (KCJB) memasuki tahap akhir. Hal itu me-nyusul informasi Kementerian Agraria dan Tata Ruang/ Badan Pertanahan Nasional yang menyebutkan 99% lahan telah dibebaskan. Source: Investor Daily Harga jual ayam hidup (livebird/LB) tingkat peternak (farmgate) kembali anjlok, setelah sempat bergerak naik seki-tar Juli. Di Jawa Tengah (Jateng) dan Yogyakarta misalnya, harga jual ayam LB di tingkat peternak rata-rata hanya Rp 8-12 ribu per kilogram (kg) pada Sabtu (31/8). Kondisi tersebut tidak jauh berbeda dengan di sejumlah daerah lain di Indonesia. Source: Investor Daily Industri kaca lembaran mendesak pemerintah untuk segera mengeksekusi Peraturan Presiden (Perpres) No 40 Ta-hun 2016 tentang Penetapan Harga Gas Bumi dan menurunkan harga gas menjadi US$ 6 per mmbtu. Tingginya har-ga gas semakin melemahkan industri kaca nasional dan menghambat investasi yang masuk ke sektor ini. Source: Investor Daily Penyerapan dana fasilitas likuiditas pembiayaan perumahan (FLPP) tahun ini diprediksi memenuhi target sebesar Rp 7,1 triliun untuk 68 ribu rumah. Hingga akhir Agustus 2019, realisasi sudah mencapai 54 ribu unit rumah atau senilai Rp 5,2 triliun. Source: Kontan XL Axiata (EXCL) terus mengembangkan fitur baru aplikasi laut nusantara yang telah dimanfaatkan oleh ribuan ne-layan Indonesia di berbagai daerah. Source: IQPlus Tunas Baru Lampung (TBLA) mengatakan dengan keputusan percepatan implementasi B30 seharusnya porsi per-mintaan biodiesel perseroan meningkat. Source: Bisnis Indonesia Japfa Comfeed Indonesia (JPFA) menaikkan fasilitas pinjaman bank dalam negeri menjadi Rp 5 triliun, dari semula Rp 3 triliun. Kredit anyar tersebut akan digunakan oleh perusahaan yang dikendalikan keluarga Santosa ini untuk kebutuhan pelunasan kembali utang (refinancing) dan belanja modal (capital expenditure/capex). Source: Investor Daily Waskita Karya (WSKT) sebagai kontraktor terus berupaya menyelesaikan pembangunan sejumlah ruas tol yang se-dang dikerjakan, terutama tol Trans Sumatera. Source: IQPlus Erajaya Swasembada (ERAA) membuka gerai baru Erafone Megastore 3.0 di Kemang, Jakarta yang mengusung Digi-tal Lifestyle Experience dan memuat aneka produk IoT. Source: Kontan Elnusa (ELSA) melalui anak usahanya, PT Elnusa Petrofin (EPN), mengambil alih Depot Liquified Petroleum Gas (LPG) Pressurized di Amurang, Minahasa Selatan. Hal ini dilakukan sebagai cara mendiversifikasi bisnis pada seg-men distribusi & logistik energi. Source: Investor Daily
www.sinarmassekuritas.co.id See important disclaimer at the end of this report

3
World Equity Indices
Source: Bloomberg, Sinarmas Investment Research
www.sinarmassekuritas.co.id See important disclaimer at the end of this report
WOR LD EQUIT Y IN D IC ES
N O T IC KER
1 INDU Index 27,398.68 21,712.53 1,684.06 6.81 20.65 17.38 3.88 3.97 7,319.48 7,319.48
2 SPX Index 3,027.98 2,346.58 252.85 9.46 22.32 17.68 3.30 3.38 25,268.15 25,268.15
3 CCM P Index 8,339.64 6,190.17 1,059.49 15.35 41.85 23.87 3.80 3.17 12,328.27 12,328.27
4 SPTSX Index 16,672.71 13,776.88 232.94 1.44 19.80 15.08 1.91 1.92 2,513.03 1,889.36
5 M EXBOL Index 50,041.60 38,265.51 (6,731.92) (13.64) 19.74 14.05 2.65 2.80 5,296.50 264.26
6 SX5E Index 3,573.57 2,908.70 (77.20) (2.20) 18.44 14.15 1.64 1.69 3,038.74 3,338.97
7 UKX Index 7,727.49 6,536.53 (480.59) (6.25) 23.35 12.58 1.99 2.01 1,925.60 2,342.69
8 CAC Index 5,672.77 4,555.99 167.92 3.16 18.44 14.63 1.62 1.68 1,683.11 1,849.41
9 DAX Index 12,656.05 10,279.20 (978.36) (7.57) 19.14 13.97 1.86 1.90 1,105.48 1,214.70
10 IBEX Index 9,665.40 8,286.20 (1,231.00) (12.26) 15.10 11.79 1.47 1.48 551.57 606.07
11 FTSEM IB Index 22,357.39 17,914.03 (530.44) (2.43) 741.92 10.84 1.18 1.21 486.87 534.97
12 AEX Index 586.32 472.19 13.77 2.53 18.89 16.01 1.91 1.97 667.04 732.94
13 SM I Index 10,091.48 8,138.56 513.78 5.48 24.59 16.82 2.59 2.63 1,201.75 1,213.52
14 AS51 Index 6,875.50 5,410.20 539.09 8.89 17.96 16.75 2.08 2.08 1,961.50 1,319.50
15 AS30 Index 6,958.70 5,478.40 530.89 8.61 18.90 16.60 2.00 2.00 2,148.84 1,445.52
16 SHSZ300 Index 4,126.09 2,935.83 (231.27) (5.74) 16.49 12.41 2.05 2.11 30,257.30 4,227.83
17 SHASHR Index 3,444.44 2,555.84 (439.77) (12.70) 16.90 11.27 1.80 1.84 31,920.27 4,460.19
18 SZASHR Index 1,881.65 1,267.27 (334.68) (16.85) 29.07 18.24 3.12 3.23 21,294.85 2,975.51
19 HSI Index 30,280.12 24,540.63 (4,194.42) (14.02) 13.71 10.35 1.39 1.38 16,655.24 2,124.01
20 HSCEI Index 11,881.68 9,731.89 (1,626.10) (13.89) 9.19 8.11 1.05 1.07 11,396.69 1,453.40
21 SENSEX Index 40,312.07 33,291.58 3,275.96 9.62 24.62 19.19 3.12 3.17 66,789.19 933.88
22 NIFTY Index 12,103.05 10,004.55 492.55 4.68 23.97 18.20 3.11 3.16 80,687.86 1,128.22
23 JCI Index 6,636.33 5,621.60 (27.18) (0.43) 24.60 15.42 2.58 2.70 7,284,630.79 514.05
24 LQ45 Index 1,059.65 871.05 (83.62) (7.75) 21.16 15.81 3.39 3.49 4,760,154.30 335.91
25 KSE100 Index 42,243.83 28,670.98 (10,799.36) (26.68) 9.14 5.35 1.47 1.41 5,158.20 32.75
26 NKY Index 24,448.07 18,948.58 (2,060.57) (9.05) 19.30 15.00 1.89 1.89 341,751.53 3,213.16
27 NEY Index 366.42 284.63 (49.51) (13.85) 16.08 11.11 1.40 1.40 403,899.69 3,797.48
28 TPX Index 1,838.30 1,408.89 (305.70) (16.82) 16.33 12.26 1.41 1.41 577,352.14 5,428.28
29 FBM KLCI Index 1,823.24 1,572.03 (184.67) (10.28) 16.69 16.75 1.67 1.67 1,031.10 244.48
30 NZSE Index 1,854.52 1,488.82 306.60 20.29 19.27 24.32 2.03 1.48 149.82 94.29
31 PCOM P Index 8,419.59 6,790.58 (578.76) (6.76) 23.05 17.21 2.51 2.54 10,006.74 191.83
32 FSSTI Index 3,415.18 2,955.68 (296.40) (8.71) 11.04 12.42 1.22 1.19 540.09 389.00
33 KOSPI Index 2,356.62 1,891.81 (499.70) (20.25) 12.74 12.65 1.06 1.06 1,266,981.83 1,047.30
34 TWSE Index 11,097.11 9,319.28 (24.81) (0.23) 15.56 16.07 1.75 1.79 31,917.01 1,019.06
35 SET Index 1,766.62 1,546.62 (98.79) (5.63) 18.91 2.08 2.08 16,995.67 555.23
36 SET50 Index 1,166.78 1,031.45 (38.67) (3.41) 17.52 16.71 2.26 2.26 11,756.99 384.09
37 VNINDEX Index 1,024.68 861.85 (0.18) (0.02) 18.96 16.39 2.81 2.72 3,327,022.79 143.39
A sia/ P acif ic
A merica
52-WEEK C H A N GE YT D P ER (x) P B V (x) M A R KET C A P (B n)
Euro pe
H IGH LOW P OIN T % 2017 2018E 2017 2018ED o main
C urrencyUSD
4
LQ45
Source: Bloomberg, Sinarmas Investment Research
www.sinarmassekuritas.co.id See important disclaimer at the end of this report
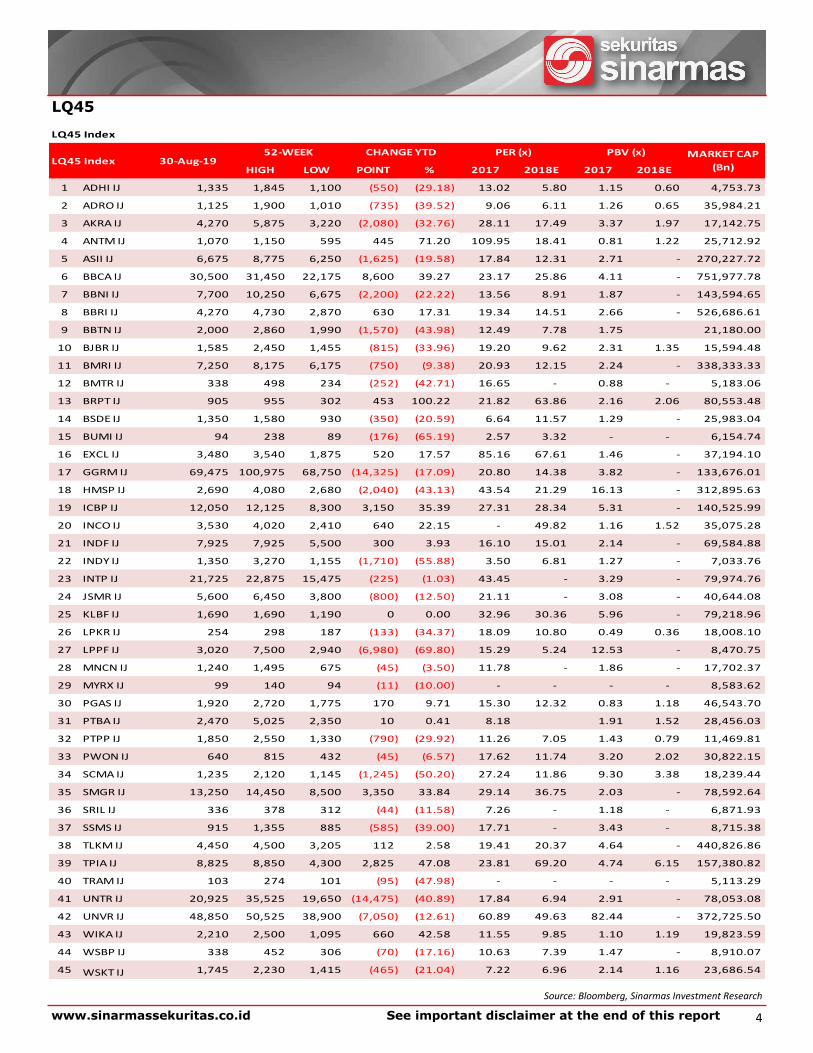
LQ45 Index
HIGH LOW POINT % 2017 2018E 2017 2018E
1 ADHI IJ 1,335 1,845 1,100 (550) (29.18) 13.02 5.80 1.15 0.60 4,753.73
2 ADRO IJ 1,125 1,900 1,010 (735) (39.52) 9.06 6.11 1.26 0.65 35,984.21
3 AKRA IJ 4,270 5,875 3,220 (2,080) (32.76) 28.11 17.49 3.37 1.97 17,142.75
4 ANTM IJ 1,070 1,150 595 445 71.20 109.95 18.41 0.81 1.22 25,712.92
5 ASII IJ 6,675 8,775 6,250 (1,625) (19.58) 17.84 12.31 2.71 - 270,227.72
6 BBCA IJ 30,500 31,450 22,175 8,600 39.27 23.17 25.86 4.11 - 751,977.78
7 BBNI IJ 7,700 10,250 6,675 (2,200) (22.22) 13.56 8.91 1.87 - 143,594.65
8 BBRI IJ 4,270 4,730 2,870 630 17.31 19.34 14.51 2.66 - 526,686.61
9 BBTN IJ 2,000 2,860 1,990 (1,570) (43.98) 12.49 7.78 1.75 21,180.00
10 BJBR IJ 1,585 2,450 1,455 (815) (33.96) 19.20 9.62 2.31 1.35 15,594.48
11 BMRI IJ 7,250 8,175 6,175 (750) (9.38) 20.93 12.15 2.24 - 338,333.33
12 BMTR IJ 338 498 234 (252) (42.71) 16.65 - 0.88 - 5,183.06
13 BRPT IJ 905 955 302 453 100.22 21.82 63.86 2.16 2.06 80,553.48
14 BSDE IJ 1,350 1,580 930 (350) (20.59) 6.64 11.57 1.29 - 25,983.04
15 BUMI IJ 94 238 89 (176) (65.19) 2.57 3.32 - - 6,154.74
16 EXCL IJ 3,480 3,540 1,875 520 17.57 85.16 67.61 1.46 - 37,194.10
17 GGRM IJ 69,475 100,975 68,750 (14,325) (17.09) 20.80 14.38 3.82 - 133,676.01
18 HMSP IJ 2,690 4,080 2,680 (2,040) (43.13) 43.54 21.29 16.13 - 312,895.63
19 ICBP IJ 12,050 12,125 8,300 3,150 35.39 27.31 28.34 5.31 - 140,525.99
20 INCO IJ 3,530 4,020 2,410 640 22.15 - 49.82 1.16 1.52 35,075.28
21 INDF IJ 7,925 7,925 5,500 300 3.93 16.10 15.01 2.14 - 69,584.88
22 INDY IJ 1,350 3,270 1,155 (1,710) (55.88) 3.50 6.81 1.27 - 7,033.76
23 INTP IJ 21,725 22,875 15,475 (225) (1.03) 43.45 - 3.29 - 79,974.76
24 JSMR IJ 5,600 6,450 3,800 (800) (12.50) 21.11 - 3.08 - 40,644.08
25 KLBF IJ 1,690 1,690 1,190 0 0.00 32.96 30.36 5.96 - 79,218.96
26 LPKR IJ 254 298 187 (133) (34.37) 18.09 10.80 0.49 0.36 18,008.10
27 LPPF IJ 3,020 7,500 2,940 (6,980) (69.80) 15.29 5.24 12.53 - 8,470.75
28 MNCN IJ 1,240 1,495 675 (45) (3.50) 11.78 - 1.86 - 17,702.37
29 MYRX IJ 99 140 94 (11) (10.00) - - - - 8,583.62
30 PGAS IJ 1,920 2,720 1,775 170 9.71 15.30 12.32 0.83 1.18 46,543.70
31 PTBA IJ 2,470 5,025 2,350 10 0.41 8.18 1.91 1.52 28,456.03
32 PTPP IJ 1,850 2,550 1,330 (790) (29.92) 11.26 7.05 1.43 0.79 11,469.81
33 PWON IJ 640 815 432 (45) (6.57) 17.62 11.74 3.20 2.02 30,822.15
34 SCMA IJ 1,235 2,120 1,145 (1,245) (50.20) 27.24 11.86 9.30 3.38 18,239.44
35 SMGR IJ 13,250 14,450 8,500 3,350 33.84 29.14 36.75 2.03 - 78,592.64
36 SRIL IJ 336 378 312 (44) (11.58) 7.26 - 1.18 - 6,871.93
37 SSMS IJ 915 1,355 885 (585) (39.00) 17.71 - 3.43 - 8,715.38
38 TLKM IJ 4,450 4,500 3,205 112 2.58 19.41 20.37 4.64 - 440,826.86
39 TPIA IJ 8,825 8,850 4,300 2,825 47.08 23.81 69.20 4.74 6.15 157,380.82
40 TRAM IJ 103 274 101 (95) (47.98) - - - - 5,113.29
41 UNTR IJ 20,925 35,525 19,650 (14,475) (40.89) 17.84 6.94 2.91 - 78,053.08
42 UNVR IJ 48,850 50,525 38,900 (7,050) (12.61) 60.89 49.63 82.44 - 372,725.50
43 WIKA IJ 2,210 2,500 1,095 660 42.58 11.55 9.85 1.10 1.19 19,823.59
44 WSBP IJ 338 452 306 (70) (17.16) 10.63 7.39 1.47 - 8,910.07
45 WSKT IJ 1,745 2,230 1,415 (465) (21.04) 7.22 6.96 2.14 1.16 23,686.54
MARKET CAP
(Bn)LQ45 Index
CHANGE YTD PER (x) PBV (x)30-Aug-19
52-WEEK

5
Macro data
Source: Bloomberg, Sinarmas Investment Research
www.sinarmassekuritas.co.id See important disclaimer at the end of this report
D escript io n 1-D ay (%) 5-D ays (%) 1-M o nth (%) YT D (%)
Property 1.59 0.25 2.95 11.55
Basic Industry 0.25 5.05 7.05 3.44
Trade 0.92 1.68 (1.66) 1.87
Finance 0.83 0.87 (3.33) 7.50
M iscellaneous Industry 3.37 1.41 (4.77) (14.76)
Consumer (0.82) (0.17) 1.18 (6.62)
Infrastructure 0.77 1.18 2.81 15.63
Agriculture 0.48 (0.61) 1.61 (13.03)
M ining 0.82 1.37 (0.41) (9.27)
A ug-19 Jul-19
2.36 3.61
3.32 3.28
0.31 0.55
125.90 123.82
F OR EX Spo t R ate 1-D ay (%) 1-M o nth (%) YT D (%)
USD/IDR 14,198.00 - (1.20) 1.35
USD/CNY 7.16 (0.17) (3.80) (3.88)
USD/EUR 0.91 0.00 1.11 4.36
USD/JPY 106.12 0.15 0.44 3.36
USD/SGD 1.39 (0.20) (0.91) (1.95)
USD/AUD 1.49 0.21 1.17 4.86
USD/GBP 0.82 0.10 0.10 4.99
( in %)
6.40
0.84
1.46
6.82
7.33
7.76
Indonesia 5-Year Government Bonds Yield
Indonesia 10-Year Government Bonds Yield
Indonesia 15-Year Government Bonds Yield
Lending and D epo sit R ates
JIBOR (in IDR)
LIBOR (in GBP)
SIBOR ( in USD)
Inflation M oM (in %)
Foreign Reserves (in USD bn)
Secto rs
Eco no mic Indicato rs
Inflation YTD (in %)
Eco no mic P arameters
Inflation YoY (in %)
Technical Corner
www.sinarmassekuritas.co.id See important disclaimer at the end of this report
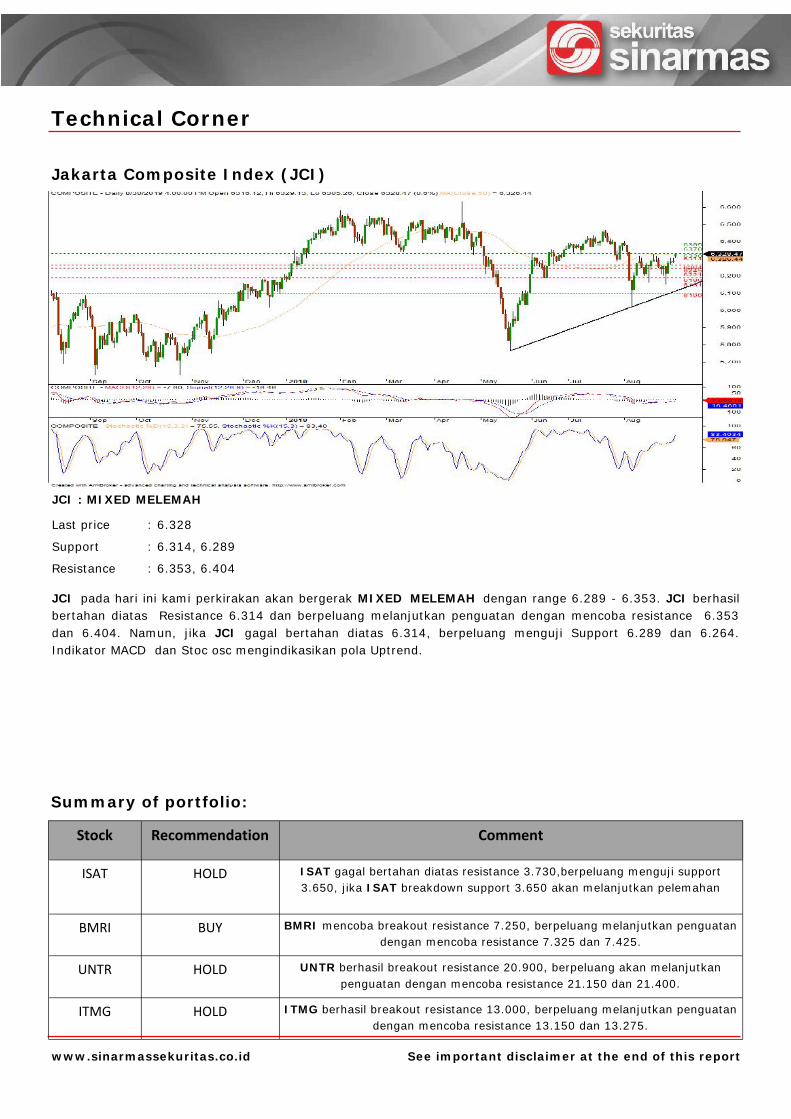
JCI : MIXED MELEMAH
Last price : 6.328
Support : 6.314, 6.289
Resistance : 6.353, 6.404
JCI pada hari ini kami perkirakan akan bergerak MIXED MELEMAH dengan range 6.289 - 6.353. JCI berhasilbertahan diatas Resistance 6.314 dan berpeluang melanjutkan penguatan dengan mencoba resistance 6.353dan 6.404. Namun, jika JCI gagal bertahan diatas 6.314, berpeluang menguji Support 6.289 dan 6.264.Indikator MACD dan Stoc osc mengindikasikan pola Uptrend.
Jakarta Composite Index (JCI)
Summary of portfolio:
Stock Recommendation Comment
ISAT HOLD ISAT gagal bertahan diatas resistance 3.730,berpeluang menguji support3.650, jika ISAT breakdown support 3.650 akan melanjutkan pelemahan
BMRI BUY BMRI mencoba breakout resistance 7.250, berpeluang melanjutkan penguatandengan mencoba resistance 7.325 dan 7.425.
UNTR HOLD UNTR berhasil breakout resistance 20.900, berpeluang akan melanjutkanpenguatan dengan mencoba resistance 21.150 dan 21.400.
ITMG HOLD ITMG berhasil breakout resistance 13.000, berpeluang melanjutkan penguatandengan mencoba resistance 13.150 dan 13.275.
Indosat Tbk (ISAT)
Bank Mandiri (Persero) Tbk (BMRI)
www.sinarmassekuritas.co.id See important disclaimer at the end of this report
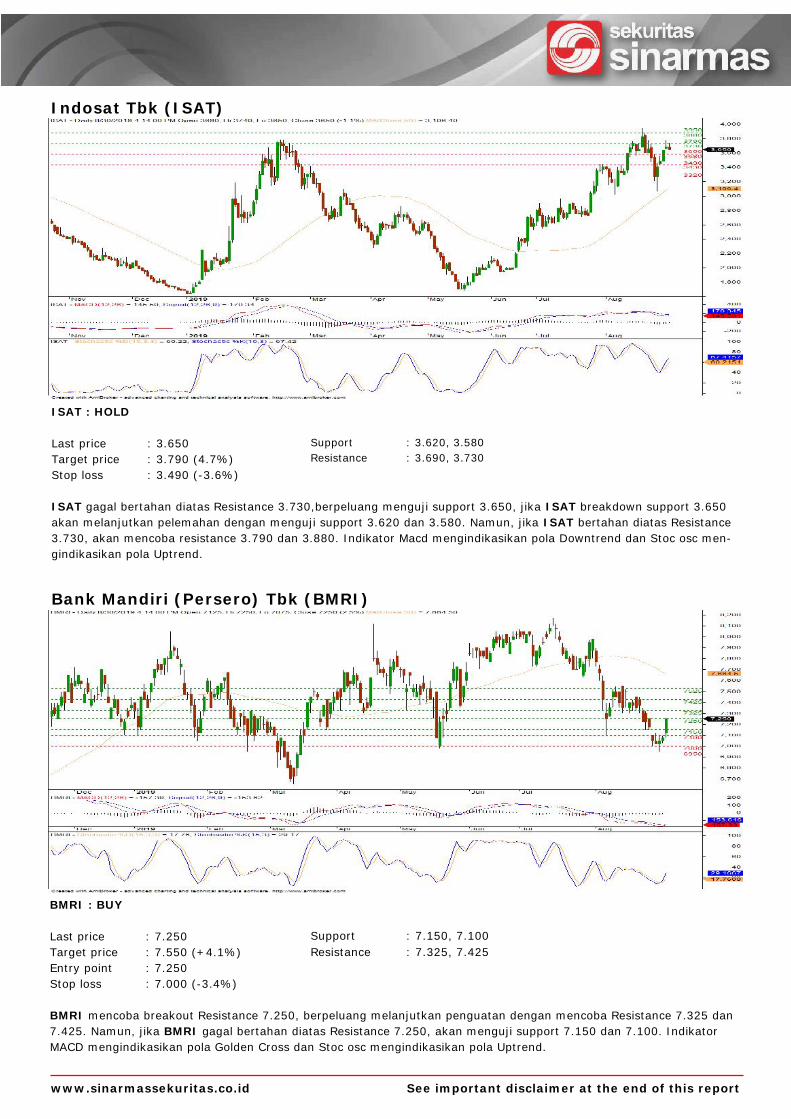
ISAT : HOLD
Last price : 3.650Target price : 3.790 (4.7%)Stop loss : 3.490 (-3.6%)
ISAT gagal bertahan diatas Resistance 3.730,berpeluang menguji support 3.650, jika ISAT breakdown support 3.650akan melanjutkan pelemahan dengan menguji support 3.620 dan 3.580. Namun, jika ISAT bertahan diatas Resistance3.730, akan mencoba resistance 3.790 dan 3.880. Indikator Macd mengindikasikan pola Downtrend dan Stoc osc men-gindikasikan pola Uptrend.
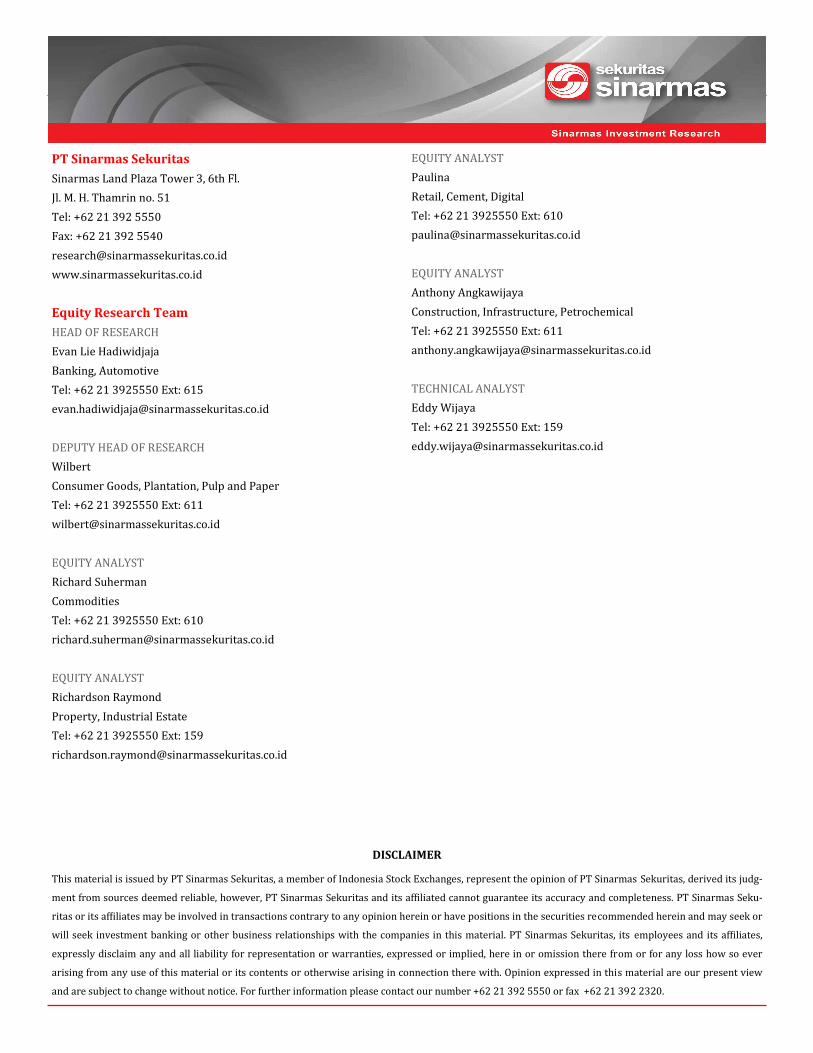
BMRI : BUY
Last price : 7.250Target price : 7.550 (+4.1%)Entry point : 7.250Stop loss : 7.000 (-3.4%)
BMRI mencoba breakout Resistance 7.250, berpeluang melanjutkan penguatan dengan mencoba Resistance 7.325 dan7.425. Namun, jika BMRI gagal bertahan diatas Resistance 7.250, akan menguji support 7.150 dan 7.100. IndikatorMACD mengindikasikan pola Golden Cross dan Stoc osc mengindikasikan pola Uptrend.
Support : 3.620, 3.580Resistance : 3.690, 3.730
Support : 7.150, 7.100Resistance : 7.325, 7.425

UNTR : HOLD
Last price : 20.925Target price : 21.400 (6.0%)Stop loss : 19.725 (-3.8%)
UNTR berhasil breakout Resistance 20.900, berpeluang akan melanjutkan penguatan dengan mencoba Resistance21.150 dan 21.400. Namun, jika UNTR gagal bertahan diatas resistance 21.150, akan kembali menguji support 20.900dan 20.675. UNTR dilihat dari indikator MACD dan Stoc osc mengindikasikan pola Uptrend.
ITMG : HOLD
Last price : 13.000Target price : 13.150 (4.0%)Stop loss : 12.225 (-3.4%)
ITMG berhasil breakout resistance 13.000 dan berpeluang melanjutkan penguatan dengan mencoba resistance 13.150dan 13.275. Namun, jika ITMG gagal bertahan diatas resistance 13.000, berpeluang menguji support 12.825 dan12.675. ITMG dilihat dari indikator MACD mengindikasikan pola Golden Cross dan Stos osc mengindikasikan polaUptrend.
Support : 20.675, 20.500Resistance : 21.150, 21.400
Support : 12.825, 12.675Resistance : 13.150, 13.275
Indo Tambangraya Megah Tbk (ITMG)
United Tractors Tbk (UNTR)
www.sinarmassekuritas.co.id See important disclaimer at the end of this report
PT Sinarmas Sekuritas
Sinarmas Land Plaza Tower 3, 6th Fl.
Jl. M. H. Thamrin no. 51
Tel: +62 21 392 5550
Fax: +62 21 392 5540
www.sinarmassekuritas.co.id
Equity Research Team
HEAD OF RESEARCH
Evan Lie Hadiwidjaja
Banking, Automotive
Tel: +62 21 3925550 Ext: 615
DEPUTY HEAD OF RESEARCH
Wilbert
Consumer Goods, Plantation, Pulp and Paper
Tel: +62 21 3925550 Ext: 611
EQUITY ANALYST
Richard Suherman
Commodities
Tel: +62 21 3925550 Ext: 610
EQUITY ANALYST
Richardson Raymond
Property, Industrial Estate
Tel: +62 21 3925550 Ext: 159
EQUITY ANALYST
Paulina
Retail, Cement, Digital
Tel: +62 21 3925550 Ext: 610
EQUITY ANALYST
Anthony Angkawijaya
Construction, Infrastructure, Petrochemical
Tel: +62 21 3925550 Ext: 611
TECHNICAL ANALYST
Eddy Wijaya
Tel: +62 21 3925550 Ext: 159
DISCLAIMER
This material is issued by PT Sinarmas Sekuritas, a member of Indonesia Stock Exchanges, represent the opinion of PT Sinarmas Sekuritas, derived its judg-
ment from sources deemed reliable, however, PT Sinarmas Sekuritas and its affiliated cannot guarantee its accuracy and completeness. PT Sinarmas Seku-
ritas or its affiliates may be involved in transactions contrary to any opinion herein or have positions in the securities recommended herein and may seek or
will seek investment banking or other business relationships with the companies in this material. PT Sinarmas Sekuritas, its employees and its affiliates,
expressly disclaim any and all liability for representation or warranties, expressed or implied, here in or omission there from or for any loss how so ever
arising from any use of this material or its contents or otherwise arising in connection there with. Opinion expressed in this material are our present view
and are subject to change without notice. For further information please contact our number +62 21 392 5550 or fax +62 21 392 2320.