bidang kesejahteraan rakyat bappenas pnpm rural public ...documents.worldbank.org/curated/en/... ·...
TRANSCRIPT
April 2012
PNPM RURALIMPACT EVALUATION
Kementrian KoordinatorBidang Kesejahteraan Rakyat BAPPENAS
PNPM
RURA
L IMPA
CT EVA
LUA
TION
Pub
lic D
iscl
osur
e A
utho
rized
Pub
lic D
iscl
osur
e A
utho
rized
Pub
lic D
iscl
osur
e A
utho
rized
Pub
lic D
iscl
osur
e A
utho
rized
Pub
lic D
iscl
osur
e A
utho
rized
Pub
lic D
iscl
osur
e A
utho
rized
Pub
lic D
iscl
osur
e A
utho
rized
Pub
lic D
iscl
osur
e A
utho
rized

IMPACT EVALUATIONPNPM RURAL
APRIL 2012
v
CONTENTS
ACKNOWLEDGEMENTS
ABSTRACT
LIST OF ABBREVIATIONS
EXECUTIVE SUMMARY
I. BACKGROUND
II. THE PROGRAM NASIONALPEMBERDAYAAN MASYARAKATRURAL COMPONENT
III. METHODOLOGY
IV. RESULTS
V. DISCUSSION AND CONCLUSIONS
VI. RECOMMENDATIONS ANDPOLICY IMPLICATIONS
REFERENCES
ANNEX 1: METHODOLOGY
ANNEX 2: A NOTE ON POWER CALCULATIONS
ANNEX 3: EXECUTIVE SUMMARY FROM THE QUALITATIVE STUDY
Table 1:Distribution of Block Grant Fundingby Type of Activity in 2009
Table 2:Social Dynamics and Governance Variables
Table 3:Change in Logged Real Per Capita Consumption
Table 4:Households Moving Out of Poverty
Table 5:Households Moving Into Poverty
Table 6:Change in Household Access to Outpatient Care
Table 7:Change in Transition Rate from Primaryto Lower Secondary School
Table 8:Change in Employment Status
Table 9:Change in Social Capital and Governance Indicators
Table A1.1:Distribution of Matched Kecamatan by Province
Table A1.2:Balancing Tests for Covariates
Table A1.3:Table of Means for Indicators at Baseline
Table A1.4:Rural Provincial Poverty Lines Used to Assign Poverty Status
List of Parameters for Cluster Assigned Treatment
TABLE
vi
vii
ix
x
1
5
9
15
23
28
29
41
49
52
6
12
33
34
35
36
37
38
38
41
44
46
47
50
AuthorJohn Voss
PhotographyDoc. PNPM Support Facility
Graphic DesignAnang Saptoto – Minimi Studio
Published in an edition of 250 exp
Published by PNPM Support FacilityJakarta, Indonesia, 2013
Print in Jakarta, Indonesia
The views expressed in this paper are those of the authors alone and do not represent the views of the PNPM Support Facilty or any of the many individuals or organizations acknowledged here.
vi vii
ABSTRACT
This paper reports on a quasi–experimental evaluation of the PNPM–Rural program designed to assess the impact of the project on household welfare, poverty, access to services, employment, social dynamics and governance. Across 17 provinces, a panel of 6319 households and 26,811 individuals from 300 sub–districts were interviewed at baseline in 2007 and again in 2009/2010. A propensity score matching approach was used to select the sample of sub–districts participating in PNPM beginning in 2007 and a comparison sub–district group that has similar characteristics based on data taken from the 2005 national village census that began participation in 2009/2010. Qualitative studies were also conducted in eighteen villages in 3 provinces in 2007 and 2010 to enhance understanding of the findings from the quantitative analysis. The study found that households participating in the program experienced positive benefits with respect to household welfare via increased real per capita consumption and increased chances of escaping poverty. Households participating in the project also saw access to outpatient health services increase and increased chances of being employed. While these positive impacts were strong amongst poorer households, marginalized groups (including female–headed households and households with lower levels of education) did not see the same benefits from the project
with respect to household welfare and poverty reduction, but did see increased access to outpatient health services. With respect to social dynamics and governance, PNPM created positive impacts on measures of social capital and governance within the program but these impacts did not spill over into larger village decision–making processes. Impacts are strongest in poor and remote areas where the interests of the poor and the community as a whole are aligned around filling critical infrastructure gaps. The project is less effective for less poor and less remote areas where infrastructure gaps are not as significant, leading to a divergence between communities who still seek to utilize funding for additional infrastructure and the poor who seek skill training, access to capital, and improved access to and quality of health and education services.
ACKNOWLEDGEMENTS
This report was prepared by a team from PNPM Support Facility (PSF) led by John Voss. Natasha Hayward was Task Team Leader and Jan Weetjens provided overall guidance. Yulia Herawati and Gregorius K. Endarso supervised the data collection and cleaning. Critical support was provided by Lina Marliani, Ritwik Sarkar, Juliana Wilson, Lily Hoo, Arya Gaduh and Christine Panjaitan. The overall conceptual development of the study was led by Susan Wong as initial Task Team Leader (2008–2009). The qualitative inputs to the report were conducted by the SMERU Research Institute, led by Muhammad Syukri and are published additionally in a separate study.
The team received critical guidance from Scott Guggenheim (AUSAID), Susanne Holste (PSF), Sentot Satria (PSF), Robert Wrobel (PSF), Vic Bottini (consultant, TNP2K), Jed Friedman (World Bank), and Gus Papanek (BIDE). The report benefited from valuable inputs from peer reviewers Vivi Alatas (World Bank), Asep Suryahadi (SMERU Research Institute), Menno Pradhan (University of Amsterdam), Neil McCullough (AUSAID) and Marcus Goldstein (World Bank). We would also like to thank BAPPENAS, in particular, Rudy S. Prawiradinata (Bappenas) and Vivi Yulaswati (Bappenas) for their coordination and support during field work and dissemination; TNP2K, in particular the support and guidance of Sudarno Sumarto and Elan Satriawan and the Ministry of Home Affairs (Depdagri). The team would also like to thank Surveymeter, the firm conducting the SEDAP 2007 and 2009/2010 household surveys, for excellent
management of the data collection process as well as initial input on the survey instrument and field work methodology. The Surveymeter team was led by Wayan Suriastini, under the overall guidance of Bondan Siloki.
Finally, the team would like to extend its thanks to the thousands of households from 17 provinces across Indonesia who took time from their day to sit down with the survey team and provide the most valuable input to the project, the collected data. The Government of Indonesia and the PNPM Support Facility provided financial support for the project.

ix
LIST OF ABBREVIATIONS
BAPPENAS : State Ministry of National Developmental Planning
BLM : Community Block GrantBLT : Direct Cash TransferBPR : People’s Credit BankBPS : Central Statistics AgencyCDD : Community Driven DevelopmentDepdagri : The Ministry of Home AffairsEA : Enumeration AreaFGD : Focus Group DiscussionsJamkesmas : Health insurance for the PoorKDP : Kecamatan (Sub–District) Development
ProgramNMC : National Management ConsultantPKH : Household Conditional Cash TransferPKK : Family Welfare EmpowermentPNPM : National Program on Community
EmpowermentPODES : Village Potential StatisticsPPK : Kecamatan (Sub–District) Development
ProgramPSF : PNPM Support Facility
Polindes : Village Maternity CenterPosyandu : Integrated Health Service CenterPustu : Secondary Health Center (Puskesmas)RT : Neighborhood unit consisting of several
householdsRW : Administrative unit consisting of several RTRaskin : Rice for the PoorSPP : Women’s Savings and LoanSEDAP : PNPM Impact Evaluation SurveySUSENAS : National Sosioeconomic SurveyTNP2K : National Team for Accelerating Poverty
ReductionTPK : Program Implementation Team
x xi
EXECUTIVE SUMMARY
The past decade has seen governments and multilateral donors significantly expand their engagement with communities in project decision–making and implementation through Community–Driven Development (CDD) interventions, which place community members in control of the planning, design, implementation and monitoring of project activities conducted in their communities. The CDD approach comprises not only the enhancement of community welfare, poverty reduction and access to services of more traditional rural infrastructure delivery mechanisms, but also the objective of fostering increased participation in decision–making on the part of communities to develop the skills and capacities needed to further their own development, and promote better governance by increasing the demand for transparency and accountability in the local government environment.
project in less poor areas; fourth, the length of time needed for impacts to develop in the CDD context, and fifth, that the impact of the project on social dynamics and governance has not been assessed using quantitative methods due to the lack of data in the previous KDP evaluation. This paper attempts to address these issues via a set of indicators based on responses to questions from the SUSENAS 2002 survey instrument and a social capital and governance module are constructed to address the following core research questions:
• Does PNPM–Rural increase household welfare (measured as real per capita consumption)?
• Does PNPM–Rural move households out of poverty?• Do individuals in PNPM–Rural sub–districts experience
increased access to education and health care services, and employment opportunities?
•What is the impact for these indicators for poor and disadvantaged groups?
• Does PNPM–Rural impact social dynamics in the community and the quality of local governance?
The research methodology was designed to ensure the impacts found can be attributed to the program. A household panel was constructed from the SUSENAS 2002 national household survey, followed by separate surveys conducted in 2007 (Survei Evaluasi Dampak PNPM or SEDAP 2007) and 2010 (SEDAP 2010) on the same set of households. A propensity score matching approach was used to select sub–districts participating in PNPM beginning in 2007 and a control sub–district group that has similar characteristics based on data taken from the 2005 PODES village census that began participation in 2009/2010. The sample consisted of 6319 households and 26,811 households from 300 sub–districts across 17 provinces. Qualitative studies were also conducted in eighteen villages in 3 provinces in 2007 and 2010 to enhance understanding of the findings from the quantitative analysis. This enabled the evaluation to conduct difference–in–differences estimates of the impact of PNPM on a set of six groups of indicators:
• Real per capita consumption• Poverty status• Use of outpatient health services• Unemployment rate• Primary and secondary enrollment rates•Measures of social dynamics and governance
The main results from the study are listed below:
As a result of participation in the program, real per capita consumption gains were 9.1 percentage points higher among poor households in PNPM areas compared with control households. This represents an overall monthly consumption gain of Rp 39,000 per capita per month in comparison with control areas. The results also point to PNPM being most effective at reaching poor households and households in poor sub–districts. Households in the lowest predicted 2007 consumption quintile participating in PNPM saw their real per capita consumption increase by
The Government of Indonesia has embraced this approach as a key part of its poverty reduction strategy by delegating a portion of its poverty portfolio to community–based programs.1 The centerpiece of the community–based portfolio is the National Community Empowerment Program (PNPM), a key component, of which PNPM–Rural, implemented by the Ministry of Home Affairs, is an expansion of the previous Kecamatan Development Project (KDP). PNPM–Rural currently reaches over 60,000 villages in over 5,000 sub–districts, including all rural kecamatan in Indonesia. PNPM–Rural has scaled–up from an initial 1993 kecamatan (sub–districts) in 2007 to cover more than 4,000 rural sub–districts in the
1 Community–based programs constitute Cluster 2 of the poverty portfolio along with Cluster 1 (household–based programs) and Cluster 3 (small and medium enterprise development).
country by 2010. It provides block grants of approximately Rp. 1 billion to 3.5 billion (US$ 111,000 to US$ 365,000) to sub–districts depending upon population size and poverty incidence. Villagers engage in a participatory planning and decision–making process prior to receiving block grants to fund their self–defined development needs and priorities.
Previous studies on the predecessor project KDP found positive impacts on household welfare, poverty and service delivery (see Alatas (2005) and Voss (2008)). Building on these findings, several issues emerge with respect to the effectiveness of the project as it has expanded to become a national program: First, that marginalized groups do not share in the benefits from the program; second, the impact of the scale up on implementation quality; third, effectiveness of the
xii xiii
PNPM is most effective at reducing poverty and impacting poor households when the needs of the poor are aligned with those of the wider community. The qualitative study provided insight into the greater effectiveness of PNPM in poor and remote areas. In situations in which there is a gap in basic infrastructure, the needs of the poor are aligned with those of the community with respect to decision–making on sub–project infrastructure. However, when basic infrastructure is in place, communities continue to select additional infrastructure sub–projects which have less potential to reduce poverty in contrast to alternative needs expressed by the poor that center on capacity and skill development, and access to capital.
PNPM is not perceived by communities as a poverty reduction program but rather as a program for the entire community. Communities view PNPM as a program for the village and select infrastructure sub–projects on the basis of the broadest impact for the collective community rather than an opportunity to target the poor.
As PNPM continues its current phase as a national level program, the results above point toward the following recommendations for the program and future research:
Continued funding for infrastructure with a focus on maintenance and sustainability: PNPM remains an effective means of delivering needed infrastructure to rural communities
11.8 percentage points more than in control areas. PNPM households in the poorest quintile sub–districts saw similar positive impacts of 12.7 percentage points in comparison with control areas. In addition, positive impacts extended to the near poor as households in the second and third consumption quintiles also saw their wider consumption increase relative to control households.
The proportion of households moving out of poverty in poor sub–districts was 2.1 percent higher in PNPM areas compared with control areas. There was no impact on PNPM in preventing households from falling into poverty.
Impacts on households in less poor sub–districts are limited. In general, for both real per capita consumption and movement out of poverty, households in higher consumption quintiles or households in less poor sub–district yielded insignificant results.
Disadvantaged groups, other than the poor, are less likely to benefit from the program. Disadvantaged groups, such as female–headed households and households with head lacking primary education, see insignificant or lesser impacts for real per capita consumption and movement out of poverty as compared to control areas.
The proportion of individuals gaining access to outpatient care was 5.1 percentage points higher in PNPM areas compared with control areas. Among individuals not seeking outpatient care in 2007, individuals in PNPM areas were 5.1 percentage points more likely to seek outpatient care in 2010 than household heads in the control group. In contrast to the real per capita consumption and poverty status results above, disadvantaged groups also benefit in terms of expansion of access to outpatient care.
Among those unemployed in 2007, individuals in PNPM areas were 1.4 percent more likely to be employed in comparison with control areas. PNPM did not have an impact on overall rates of unemployment.
PNPM had no impact on school enrollment rates. High rates of existing enrollment at both the primary and junior secondary levels likely reduce the potential effectiveness of PNPM on education utilization rates.
PNPM has impacts on measures of social dynamics and governance within the program but these impacts do not spill over into larger village decision–making processes. Key findings from the qualitative study indicate that while the program was effective in creating participation, transparency and accountability for processes within the PNPM program, these impacts did not spill over into general local/village governance as the capacity of communities to impact elite control of decision–making was limited. Contributing factors include a routinized approach to program implementation on the part of the community and the quality of participation.
governance practices in the rural space. Further research on the barriers to adoption of PNPM principles of transparency and accountability and potential design changes to address identified barriers are needed.
Continued focus on marginalized groups: The program should determine whether the program is best–placed to address the needs of marginalized groups and consider additional design changes or other development approaches to address their needs.
Renewed focus on strength of participation and inclusion of the poor and disadvantaged groups in program decision–making: To overcome the “routine” approach to program implementation that has developed due to scale up and the long period of implementation in many locations, the program needs a renewed effort to strengthen its core approach of community engagement in program activities to ensure that all groups are included and participate fully in decision–making over the program cycle.
Continued collection of data: Although the expansion of PNPM–Rural to cover all rural sub–districts in the country necessitates the loss of control areas, the panel nature of the survey can still be valuable in tracking the progress of key indicators going forward. Subsequent survey rounds in 2012 and 2014 should be conducted to ensure continued examination of program effectiveness.
to increase household welfare. The program should continue given the existing infrastructure gap in rural areas. However, these benefits will only be sustained if the infrastructure is of sufficient quality to continue to be utilized effectively. Future research should focus on the quality of maintenance and overall sustainability of use for infrastructure built by the program as well as current mechanisms and procedures in place to ensure proper maintenance is conducted.
Targeted approach to Block Grant allocation: As noted above, the largest gains are made in poor and remote areas. Block grant amounts should be targeted toward areas with low levels of existing infrastructure in order to maximize household welfare impacts. Additional research is needed to understand the effectiveness of program in a wider range of contexts (poverty, infrastructure, regional) and implementation procedures (BLM size, length of participation in the program) and consideration given to how to customize the block grant size menu to meet the needs of different local contexts.
Strategy to address constraints to stronger downward social accountability from local government: The fact that institutions other than PNPM do not yet emulate the transparency and governance features of the program indicates that a key objective of increased social accountability is not yet being met. While PNPM is not the sole vehicle nor primarily responsible for changes in the local government environment, it is included as one means to introduce and institute good

xiv xv
I. BACKGROUND
1 2
I. BACKGROUND
The past decade has seen governments and multilateral donors significantly expand their engagement with communities in project decision–making and implementation. Among several related objectives, participation by communities is expected to allow local information to impact planning, develop the skills and capacities of communities to further their own development, create a greater sense of ownership on the part of communities to reduce corruption and better maintain project–built infrastructure, and promote better governance by increasing the demand for transparency and accountability in the local government environment. In a standard approach, Community–Driven Development (CDD) interventions seek to achieve this by placing community members in control of the planning, design, implementation and monitoring of project activities conducted in their communities. In addition to these objectives, which differentiate the CDD approach from more traditional means of project delivery, CDD approaches also claim to realize development objectives, frequently associated with traditional approaches, which seek to enhance community member welfare: increased access to services, poverty alleviation, employment and consumption.
The Government of Indonesia has embraced this approach as a key part of its poverty reduction strategy by delegating a portion of its poverty portfolio to community–based programs.2 The centerpiece of the community–based portfolio is the National Community Empowerment Program (PNPM), a key component of which, PNPM–Rural is an expansion of the previous Kecamatan Development Project (KDP). PNPM–Rural now reaches over 60,000 villages in over 5,000 sub–districts, including all rural kecamatan in Indonesia. Previous studies on the predecessor project KDP found positive impacts on household welfare, poverty and service delivery. Alatas (2005), in a study of KDP Phase 1, found that KDP had a significant impact on per capita consumption in comparison with a control group, and that the longer communities participated in the program, benefits increased. Voss (2008) also found significant gains in consumption, access to outpatient care and employment for households participating in the second phase of the project (KDP2).
Building on these findings, several areas of concern emerged on the effectiveness of the project going forward. First, despite positive gains in household welfare among the poor under KDP, marginalized groups did not share in the benefits from the program. Second, as PNPM–Rural scaled up to cover every rural sub–district in the country, capacity was stressed to a greater extent than under the smaller KDP
program potentially affecting the quality of implementation and subsequent effectiveness. Third, the program began implementation in areas which on average were less poor than the more poverty–targeted selection process for KDP, creating uncertainty over the effectiveness over the project in different contexts.3 Fourth, the length of time needed for impacts to develop in the CDD context: the evaluation of KDP was over a five year timeframe (2002–2007) whereas existing PNPM–Rural locations have had the project for a much shorter period (from 1–4 years). Finally, the impact of the project on social dynamics and governance has not been assessed using quantitative methods due to the lack of data in the previous KDP evaluation.
The research design for the PNPM–Rural evaluation attempts to address these concerns by utilizing a household panel generated from the SUSENAS 2002 national household survey, and separate surveys conducted in 2007 (Survei Evaluasi Dampak PNPM or SEDAP 2007) and 2010 (SEDAP 2010) collected from the same set of households.4 A set of indicators based on responses to questions from the SUSENAS 2002 survey instrument and a social capital and governance module are constructed to address the following core research questions:
• Does PNPM–Rural increase household welfare (measured as real per capita consumption)?
• Does PNPM–Rural move households out of poverty?• Do individuals in PNPM–Rural sub–districts experience
increased access to education and health care services, and employment opportunities?
•What is the impact for these indicators for poor and disadvantaged groups?
• Does PNPM–Rural impact social dynamics in the community and the quality of local governance?
Qualitative studies were also conducted in eighteen villages in 3 provinces at baseline in 2007 and at endline in 2010 to enhance understanding of the findings from the quantitative analysis.5
The paper is organized as follows:
• Section 2 presents background information on the PNPM–Rural program.
• Section 3 describes the methodology used to select the sample and the data gathered.
• Section 4 presents the main results.• Section 5 discusses the findings and offers conclusions
on key issues for the program going forward presented above.
• Section 6 provides recommendations and policy implications.
2 Community–based programs constitute Cluster 2 of the poverty portfolio along with Cluster 1 (household–based programs) and Cluster 3 (small and medium enterprise development).
3 A study examining the EIRR for KDP infrastructure sub–projects concluded that the largest gains were found in poor and remote areas with a low base of existing infrastructure.
4 The sample was selected from the 2002 SUSENAS in order to satisfy the needs of the KDP2 impact evaluation. For that evaluation, the SEDAP07 was used as the post–project survey.
5 This study will utilize key findings from the qualitative study to enhance the understanding of results from the quantitative analysis. For a full discussion of the findings presented from the qualitative study, see SMERU (2010).

3 4
II. THE PROGRAM NASIONALPEMBERDAYAAN MASYARAKAT
PNPM – RURAL COMPONENT
5 6
Since the 1997 economic crisis, the Government of Indonesia and the World Bank have increased their engagement with communities in development projects through the use of the Community–Driven Development (CDD) approach to project design. In September 2006, the government decided to launch a new program utilizing the CDD approach to accelerate poverty reduction and increase employment opportunities in order to achieve the targets set in the Mid–Term National Development Plan (2005–2009) and the Millennium Development Goals. Existing community–based poverty reduction programs were consolidated into a National Program on Community Empowerment (PNPM–MANDIRI). The program is described as a national movement of stakeholders to reduce poverty and generate employment by increasing community capacity and self–help to achieve a better standard of community welfare.
The rural component of PNPM–MANDIRI, PNPM Rural is the successor to the Kecamatan Development Program (KDP). KDP was initiated in 1998 and continued over three phases through 2007 in approximately 2500 sub–districts. The first year of PNPM–Rural was comprised of 1993 sub–districts as a continuation from participation in KDP. The program then expanded in 2008 and 2009 to cover almost all rural sub–districts in the country. By 2009, 4,871 sub–districts in Indonesia were participating in the program. The overall objective of the program is to improve the welfare of poor communities. Specific objectives include:
• Increased participation of community members not fully involved in the development process including the poor, women, and indigenous communities.
• Improved capacity of locally based community institutions.• Improved local government capacity to provide public
services through the development of pro–poor programs, policies and budgets.
• Increased synergy between communities, local government and other pro–poor stakeholders.
• Enhanced capacity and capability of the community and local government in reducing poverty.
PNPM–Rural utilizes a Community–Driven Development approach by involving all community members in planning, implementing and monitoring of community activities funded by the program, with a special emphasis on marginalized groups (including women and the poor). The project provides block grants of between Rp 1 billion to Rp 3.5 billion to sub–districts depending upon population size and poverty incidence. Villagers engage in a participatory planning and decision–making process prior to receiving block grants to
fund self–defined development needs and priorities. Village proposals (one of which must come from a women’s group) are sent to a sub–district forum where village representatives evaluate proposals based on predetermined poverty criteria and allocate funding for individual proposals.
The project cycle generally takes 12–14 months and is described in brief below:6
Information dissemination and socialization: Workshops are held at the provincial, district, sub–district and village level to disseminate information and popularize the program.
Participatory planning: Villagers elect village facilitators (one man and one woman) to assist with the socialization and planning process. The facilitators hold group meetings, including separate women’s meetings, to discuss the needs of the village and their development priorities. Social and technical consultants at the sub–district and district level assist with socialization, planning, and implementation. Villagers then create proposals and come together in a village–level forum to decide which proposals will be sent to a subsequent sub–district–level meeting. Each village can submit up to two proposals to this forum with the requirement that the second proposal must come from a women’s group.
Project selection: Communities then meet at the village and sub–district levels to decide which proposals should be funded. Meetings are open to all community members. An inter–village forum composed of elected village representatives makes the final decisions on project funding. Project menus are open to all productive investments except for those on a short negative list.
Implementation: PNPM–Rural community forums select members to be part of an implementation team to manage the projects. Technical facilitators help the village implementation team with infrastructure design, project budgeting, quality verification, and supervision. Workers are hired primarily from the beneficiary village.
Accountability and reporting maintenance.During implementation, the implementation team reports on progress twice at an open village meeting. At the final meeting, the implementation team hands over the project to the village and a designated village operations and maintenance committee.
and include a cash–for–work component during construction which provide temporary employment; second, roads and new public service infrastructure such as schools and health clinics will allow greater access to services by reducing transportation time and cost; third, increased community engagement with government, enhancement of community skills and capacity and increased willingness to hold government accountable is expected to result in better local governance, resulting in decision–making that sees greater benefits for the community.
Block grants can be used to fund any public infrastructure, training or capacity building project, subject to a short negative list, along with up to 25 percent of funds used for micro–credit activities with project–created women’s savings groups. During 20097, the breakdown of block grant funding by type of approved sub–project was as above in table 1.
PNPM is designed to achieve its objective through the following three primary mechanisms: first, new infrastructure projects, including roads, bridges, irrigation are designed to increase production and market access in the local economy
II. THE PROGRAM NASIONAL PEMBERDAYAAN MASYARAKATPNPM – RURAL COMPONENT
Activity Public Infrastructure (Roads, Bridges, Irrigation)
Education Health Micro–credit
Percentage of Block Grant Funding
65.97 12.71 4.31 17.12
Table 1:Distribution of Block Grant Funding by Type of Activity in 2009
6 Taken from the PNPM project website. For a more detailed description see: www.ppk.or.id.
7 These percentages are consistent with 2007 and 2008.

7 8
III. METHODOLOGY
9 10
III. METHODOLOGY
In this section we develop the methods used in sampling, identification of future impacts, and data issues. See Annex 1 for a more detailed description.
A. Identification
The approach of the research design is to use the most rigorous viable methodology to select a sample that is able to attribute impacts on indicators to PNPM–Rural after the 2010 follow up survey.The primary problem in program evaluation is that we wish to compare the experience of those participating in the project with the counterfactual, or experience without the project. Unfortunately, it is not possible to observe the counterfactual outcome of no project in areas where the project is assigned. Instead, a control group must be created which represents the counterfactual scenario comprised of sub–districts similar to those receiving PNPM–Rural. To solve this problem, the research design takes advantage of the phased approach to the program’s implementation to create a control group using sub–districts which began participation in PNPM–Rural in late 2009. Due to measurable similarities across a range of observable characteristics the control group represents outcomes that would have occurred had the project not taken place. The treatment group consists of sub–districts beginning participation in PNPM–Rural in late 2007 while the control groups consists of sub–districts beginning participation in late 2009/early 2010. The analysis below compares how the experience of areas which participated in the program differs from changes observed in the control group. The difference between the magnitude of the respective changes in the treatment (PNPM–Rural 2007 Kecamatan) and control (PNPM–Rural 2009) groups for outcome indicators is the impact attributable to the program.
A propensity score matching methodology was used to construct the counterfactual. The ideal method for generating the counterfactual is a randomized selection of sub–districts for participation in the program. However, entry into the program was not assigned randomly and although the program sought to target the poorest locations, other considerations that were taken into account in assigning participation render the use of poverty mapping and other objective criteria problematic to the extent that it is not possible to formulate a systematic method for selection of sub–districts into the 2007 or 2009 phases of the program. Lacking randomization or clearly specified and systematic selection criteria, the evaluation employed a propensity score matching technique in which a set of variables or covariates are selected based on their availability and likely correlation with
both PNPM–Rural 2007 participation and outcome indicators. From this process, a set of 150 pairs of matched treatment and control sub–districts were selected for the sample. Tests to compare the effectiveness of the propensity score matching procedure demonstrate that for all of the observed covariates there is no significant difference based on participation in PNPM–Rural 2007. Thus the covariates are “well–balanced” between treatment and control groups indicate a high degree of similar for the variables which were included in the matching process. While the methodology represents the best opportunity given the data available to properly identify impacts, there are some caveats. The methodology described above does not account for factors which are not included in the matching process and which have the potential to introduce bias into the results. However, this is mitigated, to some extent, by the fact that the methods used to estimate impacts eliminate factors which do not vary over time.8
B. Data
Primary data sources include the 2002 SUSENAS, the 2005 PODES village census, and Survei Evaluasi Dampak PNPM–Rural (SEDAP 2007) 2007 survey and the 2010 SEDAP 2010 survey. The evaluation utilizes a household panel with data collected from the SEDAP 2007 survey conducted from August to September 2007. The household sample was selected from households participating in the 2002 SUSENAS. A second survey of the same households was conducted in early 2010 (SEDAP 2010) to create a panel. The overall sample includes 6319 households from 300 sub–districts with 26,811 individuals for the 2007 survey round and 6139 households from the 2009/2010 survey round indicating an attrition rate of less than 3 percent. Data used for the sub–district level propensity score matching were taken from the 2005 PODES census of villages conducted by BPS, including a range of variables (see Annex 1) describing the infrastructure, economic and demographic conditions of all sub–districts in the sampling frame. Demographic variables were derived through aggregation from yearly SUSENAS household surveys.
The survey instrument is comprised of questions from the 2002 SUSENAS national household survey and a separate social capital and governance module. Due the demands of the research design, sections of the instrument available for analysis are limited to a subset of questions taken from the 2002 SUSENAS core instrument and a separate social capital and governance module. Specifically, from the 2002 SUSENAS core instrument:
Box 1: Data Sources
The SUSENAS is an annual household survey administered by the Central Statistics Agency (BPS) designed to assess household welfare conditions on a national scale. Currently interviewing over 200,000 households in every district in Indonesia, the survey covers such topics as household consumption, housing conditions, health care, pre natal care, education, employment and income. Specialized modules dealing with specific topics such as housing, health, culture and education are administered to a subset on a rotating basis. The data is representative of both a national and district level.
The PODES is a national village census, also administered by BPS, and conducted three times per decade in all villages across Indonesia. The data are a complete enumeration of every village in Indonesia, recording information on characteristics (such as land size, population, water supply) and available infrastructure (number of schools, hospitals, doctors, markets, transportation and financial institutions). The survey used in this study is the 2005 version, including data on 68,819 villages.
Household Level:
• SUSENAS 2002 Section VI: dwelling characteristics, sanitation and access to drinking water;
• SUSENAS 2002 Section VII: Household food and non–food consumption;
• Social Dynamics and Governance Module: community participation in village meetings and activities, trust in community members and government officials, collective action, access to information, access to services and self–assessed poverty.
Individual Level:
• SUSENAS 2002 Section Va: Health• SUSENAS 2002 Section Vc: Education• SUSENAS 2002 Section Vd: Employment
Consumption is measured as the change in the logged real per capita consumption between 2007 and 2010. Measures for consumption per capita in 2007 and 2010 are taken directly from the 2007 SEDAP I and 2010 SEDAP II surveys,9 using the 2002 SUSENAS instrument.10 The 2010 data are then adjusted using a set of regional price deflators to arrive at a constant
2007 Rupiah measure for 2010 consumption per capita.11 The totals for each year were then logged and differenced. The advantage of using logs in this fashion is that estimates can be interpreted as the percentage point difference in growth rates of real per capita consumption between treatment and control groups.
Poverty status is assigned based on the 2007 and 2010 BPS provincial poverty lines. Households are assigned as “poor” or “non–poor” using their 2007 and 2010 BPS real per capita consumption measures and the 2007 and 2010 BPS Rural poverty line. Households are then placed into one of four Poverty Status categories: 1) Remained Poor, 2) Never Poor, 3) Out of Poverty, 4) Into Poverty.
Access to health indicators are also constructed using a “change in status” categorical variable. The sample for access to health indicators consists of individuals that were sick in both 2007 and 2010. For incidence of outpatient care conditional on being sick, individuals are assigned into one of four categories: 1) Always sought outpatient care, 2) Never sought outpatient care, 3) Newly seeking outpatient care in 2007, 4) Previously sought outpatient care and not seeking in 2007.
Unemployment status is calculated via two methods. Following Suyadarma, Suryahadi and Sumarto (2005), we construct two different measures for unemployment. The first measure excludes discouraged workers and includes an active labor force population of adults aged 18–55 consisting of employed (both at work and not at work but still employed), self–employed and unemployed. The second measures adds discouraged workers to the labor force population
8 The discussion of the matching and estimation methods are deliberately kept brief in the main text. For a detailed discussion see Annex 1.
9 Food expenditure is defined as the sum of all weekly food categories multiplied by 30/7. Non–food expenditure is defined as the sum of yearly expenditure divided by 12. The total expenditure is calculated as the sum of food and non–food totals.
10 The fact that the 2007 survey was conducted in August/September and not in January may have impacted the data collection for the consumption measure. Because this time period was heading into the fasting month, we might expect estimates to be slightly higher than normal. Seasonal differences may also impact estimates.
11 The Farmers’ Terms of Trade Index, which reflect changes in rural consumer and producer prices by province, were used as the deflator.
11 12
and considers both declared unemployed and discouraged workers as unemployed. Discouraged workers are defined as those not working or declared unemployed that either indicate difficulty in finding a job or have no other valid reason for lack of employment (school attendance, retirement, household duties).
Education access is measured using transition rates for appropriate age cohorts between primary and lower secondary school. Net school enrollment is defined as the number of children enrolled in the appropriate age group divided by the number of children in the appropriate age group in the population. Age groups are defined as 7–12 years for primary school, and 13–18 years for secondary school. Transition rates are percentage of each age cohort enrolled in primary school in 2007 that is also enrolled in lower secondary school in 2010.
Social Dynamics and Governance variables reported on below are described in Table 2. These are a representative subset of a large set of variables included in the social dynamics and governance instrument.12
C. Sampling
Sample size was determined using power calculations.13 The sample size was calculated taking into account the multi–stage sampling design. The required sample size is 2250 households and 150 sub–districts (15 households per sub–district for both the treatment and control groups based on an estimated treatment effect size of .14. An additional 50 percent was added to the sample to account for expected attrition between 2002 and the final round survey in 2009/2010.
The sampling frame is constructed from households included in the 2002 SUSENAS. Due to the dual purpose of the 2007 SEDAP survey: 1) an endline survey for the evaluation of KDP2 (see Voss, 2008) and 2) a baseline for the planned PMPM–Rural evaluation, households were selected from the 2002 SUSENAS national household survey. It is important to note that the sample selection is taken from that dataset and not from all sub–districts and households in Indonesia. The sampling frame from which sample sub–districts and households were selected consists only of sub–districts and households which were surveyed in the 2002 SUSENAS.
In addition, some sub–districts from the 2002 SUSENAS are excluded from the sampling frame due to participation in similar CDD programs, location in conflict or tsunami affect areas, or due to limited coverage in the 2002 SUSENAS. The evaluation identified five programs using similar approaches in terms of implementation and per village disbursement
levels as PNPM–Rural.14 Kecamatan which participated in these programs or in any phase of KDP between 2002 and 2007 were not included in the sampling frame. In addition, areas which were under sampled in the 2002 SUSENAS, including Aceh, Maluku, North Maluku and Papua are not included in the sampling frame. The remaining sub–districts from the 2002 SUSENAS not excluded from the previous participation in similar CDD program or under sampled in the 2002 SUSENAS were then pooled and matched using the methods described above. The sampling was not stratified by region in order to ensure the largest pool of control sub–district available for matching to each treatment sub–district. For the geographical distribution of sub–district by province, see Table A1.1.
For each selected sub–districts, twenty–two households are sampled from the 2002 SUSENAS. From each sub–district, two enumeration areas (EA’s), a sampling unit of sixteen households defined by geographic proximity and used by the BPS for SUSENAS sampling procedures, were selected. At the household level, eleven of the sixteen households were sampled in the 2007 survey. Selection was based on the order of households listed in the 2002 SUSENAS with replacements (households numbered 12–16) used when it was found that members of the first eleven on the list were no longer in the village where the EA was located.
Attrition for the 2007–2009/2010 period was approximately 2.8 percent. From the total number of households sampled in the 2007 survey, 6143 were interviewed in 2009/2010. The survey attempted to follow all households leaving their original 2007 location from the 2007 sample within or to existing SEDAP provinces, or Jakarta. Households which could not be interviewed either moved out of the country or to non–SEDAP provinces (excluding Jakarta), or saw all household members pass away during the period under evaluation. Households migrating out of the sub–district but which could not be tracked represented only 8 percent of the sample.
D. Estimation15
Estimation was conducted using a difference–in–differences approach. While the specific methods vary depending upon the specific variable16, a difference–in–differences approach is used to generate estimates of program impact. The change in control areas, which represent the counterfactual of changes in indicators if the program had not been run yet, is compared with changes in indicators in the treatment areas. The difference in these changes is the impact attributable to the project. It is important to note that impacts are representative at the sub–district level for all households and do not represent impacts specifically limited to villages where sub–projects are constructed.
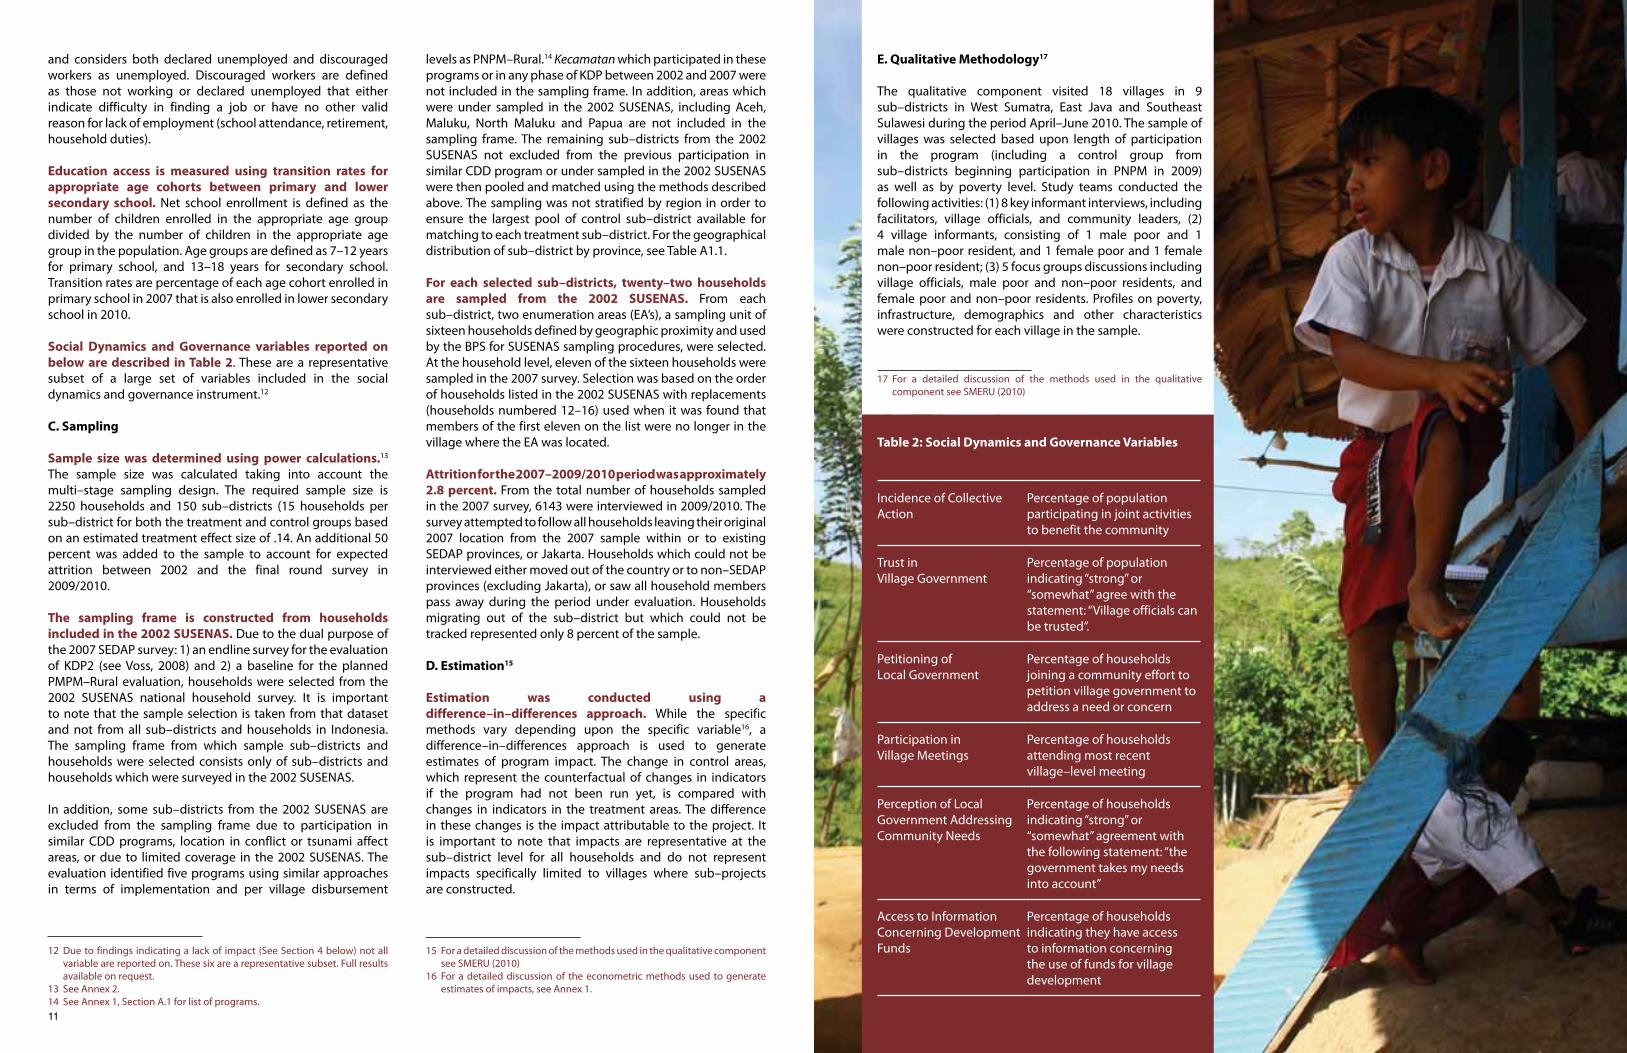
E. Qualitative Methodology17
The qualitative component visited 18 villages in 9 sub–districts in West Sumatra, East Java and Southeast Sulawesi during the period April–June 2010. The sample of villages was selected based upon length of participation in the program (including a control group from sub–districts beginning participation in PNPM in 2009) as well as by poverty level. Study teams conducted the following activities: (1) 8 key informant interviews, including facilitators, village officials, and community leaders, (2) 4 village informants, consisting of 1 male poor and 1 male non–poor resident, and 1 female poor and 1 female non–poor resident; (3) 5 focus groups discussions including village officials, male poor and non–poor residents, and female poor and non–poor residents. Profiles on poverty, infrastructure, demographics and other characteristics were constructed for each village in the sample.
Incidence of Collective Action
Percentage of population participating in joint activities to benefit the community
Trust in Village Government
Percentage of population indicating “strong” or “somewhat” agree with the statement: “Village officials can be trusted”.
Petitioning of Local Government
Percentage of households joining a community effort to petition village government to address a need or concern
Participation in Village Meetings
Percentage of households attending most recent village–level meeting
Perception of Local Government Addressing Community Needs
Percentage of households indicating “strong” or “somewhat” agreement with the following statement: “the government takes my needs into account”
Access to Information Concerning Development Funds
Percentage of households indicating they have access to information concerning the use of funds for village development
Table 2: Social Dynamics and Governance Variables
12 Due to findings indicating a lack of impact (See Section 4 below) not all variable are reported on. These six are a representative subset. Full results available on request.
13 See Annex 2.14 See Annex 1, Section A.1 for list of programs.
15 For a detailed discussion of the methods used in the qualitative component see SMERU (2010)
16 For a detailed discussion of the econometric methods used to generate estimates of impacts, see Annex 1.
17 For a detailed discussion of the methods used in the qualitative component see SMERU (2010)

13 14
IV. RESULTS
15 16
IV. RESULTS
This section discusses the main results from the analysis, including both the quantitative and qualitative components. Section 4.1 addresses household welfare as measured by real per capita consumption. Section 4.2 considers the impact of changes in household welfare on changes in poverty status. Section 4.3 presents evidence on expanding access to health care. Section 4.4 addresses impacts on access to education, specifically transition from primary to lower secondary school. Section 4.5 looks at employment. Section 4.6 discusses findings on social dynamics and governance. References to significant results refer to the 5 percent level, unless otherwise noted. See Annex 3 for a summary of key findings from the Qualitative Component.
A. Household Welfare
As described in Section 3.2, the measure of the change in household welfare is the difference in logged real per capita consumption between 2007 and 2010. We compare the changes in consumption between treatment and control households using a first differences approach with the full sample and then using a difference–in–differences matching
PNPM has a significant impact on consumption.The results suggest that PNPM has a significant impact on changes in logged real per capita consumption. Looking at the full sample, households receiving PNPM saw their consumption per capita increase by 9.1 percentage points more than in control areas over the period 2007–2010. This finding is in contrast to the previous evaluation of the predecessor project KDP2 which lacked consistent and robust evidence for impact from the project on the full sample.20
PNPM has a stronger impact on poor households.For the first quintile of households ordered by 2007 per capita consumption, there is an 11.8 percentage point difference in the growth rate of real per capita consumption between PNPM, and control households. For households in relatively wealthier quintiles, PNPM appears to be less effective. At the top end of the consumption distribution, there is no significant impact for households in the 4th and 5th quintiles. There is stronger evidence for impacts in the 3rd and, to some extent, 2nd quintiles: for the former, consumption growth was 15.6 percentage points higher. For the 2nd quintile, the impact was 8.4 percentage points higher, although significant only at the 10% level.
PNPM impacts extend to the near poor. As might be expected given the significant finding for the full sample, we find evidence for significant impacts for the 2nd and 3rd quintiles for PNPM in contrast with impacts confined to the first quintile for the previous evaluation of KDP2. While the 2nd and 3rd quintiles do not represent poor households, given the relatively concentrated consumption distribution in Indonesia, they do represent households which are “near poor”, given that over half of all Indonesian households are clustered around the national poverty as of early 2010.21
PNPM has a stronger impact on households in poor sub–districts. In addition to quintiles based on predicted per capita consumption, we also generate quintiles based on a 2005 BAPPENAS generated poverty score of sub–districts. The poverty score is based on a range of factors, including education, health, demographic and poverty data. The results are similar with a positive 12.7 percentage point impact in the log growth rate of real per capita consumption on PNPM households in the first (poorest) quintile.
Estimates from matched households demonstrate consistent and robust results. A further concern for the validity of the results presented above is heterogeneity at the household level. Although matching at the sub–district level ensures that households from the same sub–districts experience the same sub–district level conditions in terms of the economic, social and other environments, significant household level heterogeneity for variables that could impact consumption (and the indicators considered below) could remain. Such heterogeneity could introduce bias if correlated with PNPM treatment assignment. Through the difference–in–
differences estimation approach which yielded the results discussed above, we can eliminate heterogeneous factors which are fixed over time. We correct for this problem via a second household level matching using household level variables from the 2007 SEDAP data and generate the same estimates as above using the matched household sample.22 Looking at the column “Household–level matched sample”, the results shown in Table 3 show a similar pattern to those observed with the first differencing approach discussed above. Positive impacts for the full sample, 1st quintiles of 2007 predicted per capita consumption, and 2005 sub–district poverty score are significant at 5.3, 11.2 and 9.5 percentage points respectively. In addition, there is a positive impact of 8.6 percentage points for the 3rd quintile of predicted per capita consumption also consistent with the first differencing approach.23
For real per capita consumption, the distribution of PNPM benefits does not extend to traditionally disadvantaged groups. The impacts attributed to PNPM for poor households are not realized by female headed households or households with heads lacking primary education. Given the results for real per capita consumption above, we might expect similar results for these groups. However, looking at impacts on female headed households and households stratified by education of the household head, the same pattern does not emerge as we find no significant positive impacts for PNPM. This is perhaps somewhat surprising given the emphasis PNPM places on incorporating women into the project process. Separate women’s meetings are conducted as part of facilitation activities and one of the proposals from each village must come from women’s groups. Evidence from a recent study on PNPM and Marginalized groups, as well as the PNPM Rural Evaluation Qualitative component, supports these findings. Despite procedures within the program to incorporate women and the poor, the project still has difficulty reaching various pockets of highly vulnerable groups, including female–headed households and household heads with no primary education. Decision–making is still concentrated among elites and activists in the village who tend to have strong influence over not only overall project decision–making, but also within sub–groups such as women’s groups designed to generate proposals for use of project funds.24 Program managers also cite PNPM project facilitators’ focus on reducing elite capture vis–a–vis the majority in the village and the fact that less attention and effort have been paid to include the hard–to–reach population segments. Facilitators, tasked with inclusion of marginalized groups are less than effective, due in part to a large administrative burden which creates time constraints, as well as lack of proper training. The result is that marginalized groups are typically not included in the decision–making process and that sub–projects funded by PNPM block grants are not typically those which are perceived by marginalized households as bringing the largest benefits.
estimator with a household matched sample.18 Effects are presented for the full sample and samples stratified by predicted 2007 consumption quintiles19, sub–district poverty quintiles, and the education level and gender of the household head. The results are shown in Table 2.
18 See Annex 1 for a detailed discussion of the estimation approaches.19 A primary concern for the validity of the results demonstrated in Table
2 is the potential for bias due to measurement error. Households which were measured too low or too high in 2007 and then properly measured in 2010 (or vice versa), will see large changes which do not represent the true change in consumption. This effect has a tendency of convergence within the consumption distribution: poorer households see large gains relative to richer households. Moreover, using the 2007 real per capita consumption measures to generate quintiles could lead to biased and inconsistent results as mismeasured households are not assigned to their true quintiles. For example, non–poor households that were under measured relative to their true consumption would populate the sample for the first quintile rendering it a poor representation of true first quintile households measured without error. To address this concern we create predicted per capita consumption quintiles referenced above using household level asset and demographic variables from the 2007 SEDAP survey.
20 See Voss (2008) p 26.21 World Bank (2010). US$2 per day poverty headcount ratio was 50.6% in
2010 and 58% in rural areas.
22 Variables include ownership of durable assets, household income, housing conditions and demographic characteristics of the household, including age and education. See Annex 1.
23 The matched household sample also shows a significant positive impact for the 4th quintile of kecamatan poverty score however this is not reflected in the first differencing model.
24 AKATIGA (2010), pp. 3–4
17 18
Consumption gains represent a significant return on project investment. In 2009, the approximate block grant amount per capita was Rp 67,000 for the 2009 cycle. Considering the 9.1 percentage point differential between PNPM and control household per capita consumption growth rates, the amount per month generated by the project is approximately Rp 39,000 in 2010 Rupiah at the per capita consumption average, indicating that the yearly impact on average per household from the project is Rp 384,000 or 5.7 times the amount invested in 2009. Considering the more conservative estimate of 5.3 percentage points from the matched household sample, the year impact is approximately Rp 221,000 or 3.3 times the block grant invested in 2009. However, as we have noted above, these benefits are not homogeneously distributed.
PNPM is most effective at reaching poor households and households in poor areas. The results discussed above for household welfare point to PNPM being most effective at reaching poor households and households in poor sub–districts. Previous studies on KDP support this conclusion by demonstrating the advantages of the PNPM approach in poor and remote areas. Torrens (2005) and Dent (2001) in analyzing the return to subproject investments showed that the largest gains for KDP2 participants were in areas where potential production was suppressed due to barriers to market access. New roads, irrigation infrastructure and water projects created access to markets that were previously inaccessible or not viable due to high transportation costs, allowed more than one crop planting per year, or greatly reduced the time devoted to water collection. One of the primary reasons for the lack of proper infrastructure is the high cost of construction in poor and remote areas. Torrens (2005) finds that KDP is able to build local infrastructure at a lower cost than comparison estimates for standard government contractors due to locally sourced materials and community contributions; this would be even more advantageous from a cost perspective in remote areas where the potential for consumption gains are large.
Impact are largest when needs of the poor are aligned with needs of the community. Evidence from the qualitative component provides some additional insight into the relative effectiveness of the project in poorer and more remote areas. In poor villages with low levels of existing infrastructure, the needs identified by the poor were aligned proposed sub–projects proposed and subsequently funded by communities, focusing on irrigation, roads, agricultural inputs and training. Where existing infrastructure was in place, typically in less poor villages, the needs identified by the poor were not aligned with the projects funded by communities. In these cases, communities continued to fund infrastructure projects, such as roads, bridges and irrigation, whereas the poor identified capital, skill training, jobs, education and health as primary needs. Under PNPM over the course of the period under evaluation, 66 percent of all project funds were spent on infrastructure in comparison with 17 percent on health and education and 17 percent on microfinance activities.25 As noted above via the Torrens and Dent studies, in infrastructure–poor
areas, large returns can result in consumption impacts which are beneficial to the poor. When infrastructure is already in place, the marginal impact on household welfare for the poor is small given the lack of impact on the local economy and consequently consumption gains are not significant.
B. Poverty Status
In this section, we employ two models to obtain estimates on changes in poverty status. We use a multinomial logit model on the full household sample and then a conditional comparison of means test using the matched household sample constructed for the per capita consumption analysis above. Households are placed into four categories based on poverty status in 2007 and 2010: 1) never poor; 2) moved out of poverty; 3) moved into poverty; and 4) stayed poor. Poverty lines are taken directly from BPS provincial rural poverty lines. The multinomial logit model for the full sample allows us to consider the probability of inclusion into the four categories simultaneously, whereas the conditional comparison of means model on the match–household sample considers only households which were (1) poor in 2007 and moved out of poverty; and (2) not poor in 2007 and moved into poverty.26
Given comparable 2007 poverty rates for treatment and control households27, the categories of greatest interest are 2) and 3): households moving out of poverty and households falling into poverty. In the conditional comparison of means model, using the household matched sample, we restrict the sample to those households which were poor in 2007 for category 3) and to those not poor in 2007 for category 4. Coefficients indicate the percentage point difference in households moving out of or into poverty in treatment households relative to control households. Results refer to Tables 4–5.
While there is some evidence that PNPM moves households out of poverty, PNPM is not effective at preventing households from moving into poverty. Looking at the full sample, we find that poor PNPM households are 2.1 percentage points more likely to move out of poverty than control households using the multinomial logit model, and 7.9 percentage points more likely employing the household–matched conditional comparison of means model. This is somewhat consistent with the findings from the previous evaluation of KDP2.28 However, results are significant only at the 10 percent level. In contrast to findings from the evaluation of KDP2, we do not find any impact from PNPM on preventing households from moving into poverty.
Impacts on poverty status are largest for the poor in poor areas. The findings for changes in poverty status are generally consistent with the results for per capita consumption. Based
on the household–matched conditional comparison of means model poor households in 2007 in poor sub–districts in PNPM locations were 16.7 percentage points more likely to escape poverty than control areas. There is limited support for this finding using the full sample multinomial logit model at 3.2 percentage points more likely to escape poverty, at the 10 percent level. In addition, there is a strong significant impact of 22.5 percentage points for poor households in the least poor sub–districts using the household–matched comparison of means model. However, this finding is not repeated using the multinomial logit model where there is no significant impact specification.
Female–headed households and households with heads lacking primary education do not see positive changes in poverty status due to PNPM. Consistent with the findings on per capita consumption, the lack of consumption gains because PNPM is not creating positive changes in poverty status for marginalized groups. Female–headed households and households with low household head education follow a similar pattern to consumption with insignificant impacts from the program.
PNPM is not regarded as a poverty reduction program by community members. Considering the discussion with respect to alignment of needs identified by the poor and sub–projects proposed and funded by communities, the qualitative component provides additional findings on how communities perceive PNPM which may contribute to the findings from the quantitative survey. While a primary PNPM objective is improved household welfare and poverty reduction, communities themselves do not regard PNPM as a poverty reduction program. Instead, the program is viewed as for the community as a whole, rather than targeted toward the poor. In some cases, PNPM was perceived as a direct counterbalance to the household level poverty–targeted program: community members expressed the view that PNPM should not be pro–poor targeted given the existence of other prominent programs for the poor. In the majority of villages, poverty criteria with respect to proposal planning were not included in the decision–making process and poor household members were not specifically targeted for inclusion on temporary employment lists for PNPM infrastructure sub–project construction.29
C. Access to Health Care
This section utilizes a similar approach to section 4.2 by considering changes in usage of outpatient facilities by household heads using a multilevel logit model on the full sample of individuals and a conditional comparison of means model on the matched household sample.30 As described in section 3.2, household members that were sick in 2007 and 2010 were divided into 4 categories based on 2007 and 2010 usage of outpatient services. Here we focus on individuals that
changed their status with respect to use of outpatient services by moving into outpatient care in 2010 after not seeking it in 2007. Estimates represent the percentage point difference between treatment and control individuals that were sick and did not seek outpatient care in 2007, but were sick and accessed outpatient care in 2007.31 The results are shown in Table 6.
PNPM community members are more likely to access outpatient care as a result of the program. As shown in Table 6, the results from the multinomial logit and the matched household conditional models demonstrate that PNPM expands access to outpatient care. Among individuals that did not seek outpatient care in 2007, PNPM community members were 5.1 and 4.5 percentage points more likely to use outpatient services than control households in 2010 for the multinomial logit and conditional comparison of means models, respectively. There is also some evidence of similar impacts among poor households. For the first quintile of 2007 per capita consumption the likelihood of moving into outpatient care was 6.2 and 5.7 percentage points higher for PNPM2 households but only at a 10 percent level of significance.
Community members with relatively less education see gains in access to outpatient services due to PNPM. In contrast to the consumption and poverty results above, household heads with no primary education benefit significantly in terms of expanding access to outpatient services. Considering both models, we see a 4.3 and 7.5 percentage point difference for PNPM household heads with no primary education for the multinomial logit and conditional comparison of means models respectively. Female household heads do not see the same benefits.
The distribution of health benefits is more favorable to disadvantaged groups and less concentrated in poor sub–districts. Aside from female headed household, the poor, and less educated households show consistent benefits from the program. This is despite infrastructure activities for health comprising just 2.4 percent of all funds disbursement.32 Moreover, given the small percentage of funds used for construction of health facilities, the biggest factors may come from new roads reducing transportation and time costs and consumption gains noted above which allow for greater spending on health care, rather than new health infrastructure. The fact that impacts are widespread but not found in poor sub–districts may indicate a preference in poor sub–districts in favor of roads, irrigation or other projects which have a more direct impact on production, but which given their more remote status, may not reduce the transportation and time costs enough to see increased access to health care. In other sub–districts, communities may find it easier to prioritize improving health facilities. Findings from the qualitative component confirm this view in that access was considered sufficient in most communities.33
25 See SMERU (2010) for background discussion. Further evidence is based on field notes from the Qualitative Study and consultation with Qualitative Study authors.
26 For a detailed discussion see Annex 1, Section 1.3.27 See Voss (2008) p 11 for 2007 SEDAP baseline indicators by treatment
group.28 See Voss (2008), pp. 27–28.
29 See SMERU (2010), pp. 40–41.30 The lack of a full individual level panel precludes considering the entire
sample.
31 The sample size was not adequate to compare household heads that sought care in 2002 but did not seek care in 2007.
32 NMC (2007)33 See SMERU (2010), Section 5.4.
19 20
D. Access to Education
Similar to the consideration of access to health care services above, the amount of funds spent on education projects under PNPM is relatively low. The primary means of PNPM impacting access to education is likely to arise from consumption gains as well as reduced time and cost of access. As noted above, in contrast to the previous evaluation of KDP2, the current dataset contains an individual level panel which allows for an estimation of the impact of PNPM on individual cohort enrollment. We employ the multinomial logit model on cohorts which over the course of the evaluation period would graduate from primary to school to lower secondary school34 creating three categories: (1) not in primary school, (2) in primary school at baseline but not transitioning to lower secondary school in 2010 and (3) in primary school at baseline and transitioning to lower secondary school. The conditional logit model with fixed effects is also considered to check robustness. We also evaluate the impact of the project on enrollment rates for primary and lower secondary school using household level cohort panel.35
PNPN does not impact transition rates from primary to lower secondary school. As shown in Table 7, there is no significant impact from the project on transition from primary to lower secondary school. This result extends not only to the full sample but also to marginalized groups as well as by gender. In addition, no significant differences emerge in primary and lower secondary enrollment rates.36 This result is similar in part to results found in the previous KDP2 evaluation. The existing high rate of enrollment in primary and, to some extent, secondary schools (at approximately 95 percent and 85 percent respectively) indicate that access may not be a significant barrier in most communities given the relatively low amount of PNPM funds spend on education sub–projects. Findings from the qualitative component confirm this view.37 First, existing primary and lower secondary infrastructure is typically available in most villages in the sample. Due to increased interest in pre–primary education the majority of education sub–projects built under PNPM and its predecessor KDP have focused on pre–school and kindergarten facilities. Second, poverty was not a significant factor in access to primary and lower secondary schooling. Although approximately 25 percent of the quantitative sample stated that they had difficulty accessing education, the primary obstacle was the lack of resources to send children to upper secondary schooling which is typically located in the district center.
Third, communities indicate that gender is disappearing as a factor under consideration for schooling through the lower secondary level.
E. Access to Employment
PNPM has limited impact on a long–term employment status in participating sub–districts. One of the key features of the PNPM approach is the employment of community members in the construction of village projects. Given that this employment is temporary for the purpose of project construction, it might be expected that such employment gains would disappear once the project reached completion. However, as Papanek (2007) argues, the majority of employment gains due to PNPM–RURAL are likely to result from indirect sources due to increased economic activity rather than direct employment through the program. The results shown in Table 8 support the view that PNPM has had a limited impact on employment: adults aged 18–55 who were unemployed in 2007 had a 1.35 percent chance of being employed in 2010. When discouraged workers are added to the labor force, these impacts disappear, indicating PNPM is less effective in assisting individuals who have stopped looking to work due to difficulties with finding employment.
F. Social Dynamics and Governance
As stated above, a separate module was added to the survey instrument addressing key indicators of social dynamics and governance. Here we employ a conditional logit model to identify the impact of PNPM on changes in proportions given the binary nature of the indicators and also consider a matched household logit model to test robustness. For the purposes of this paper, we limit the discussion to the following variables: incidence of collective action, communal trust in village government, collective action to petition local government, participation in village meetings, perception of local government addressing needs of the community and access to information on village development funds. Questions from the module discuss general village affairs and are not specific to PNPM or any particular project aside from questions concerning village government. Results refer to Table 9.38
PNPM demonstrates no significant impact on social dynamics and governance. The primary finding for social dynamics and governance is that there is no significant pattern of impacts which emerge, either for the full sample or subgroups including the poor, poor sub–districts and marginalized groups. As shown in Table 9, regression results from the conditional logit model as well as the matched household logit model demonstrate no significant coefficients. Also included are baseline and endline means for treatment and control groups which indicate little movement over the period under evaluation.
Project data indicates that key indicators are strong within the project but are not replicated for general village governance. Data gathered from the MIS system has demonstrated that participation, access to information and satisfaction of beneficiaries, particularly for women and the poor is strong and meets project targets. Women participate in meetings at a rate of 48 percent and the poor at 60 percent based on project data from the 2007–2009 period. In addition, questions looking at access to information about PNPM and satisfaction of beneficiaries demonstrate rates of 60 percent and 68 percent respectively. When we look at these indicators from the standpoint of the larger arena of village affairs incorporating all meetings/projects, rates of participation, access to information and satisfaction are significantly lower in comparison with PNPM at approximately 24 percent and 29 percent. This suggests that while the project is successful with regard to inclusion and governance within PNPM, the factors contributing to PNPM attendance do not spill over into wider village affairs.
Findings from the qualitative component indicate that community capacity to influence elite control of decision–making outside the program is limited. The qualitative component offers some insight into the reasons behind the lack of spill over for social dynamics and governance. The primary factor cited is continued elite domination of decision–making and control over access to information and participation. The study found that traditional power structures, both religious and customary have not been impacted significantly by the project. While in many cases, PNPM is able to operate with significantly less influence in comparison with regular village government affairs and other development projects, capacity built within the community to successfully implement PNPM according to community needs and with full participation from different segments of the
community is not perceived as influencing decision–making in non–PNPM village affairs.39 Two key barriers are cited. First, the short time frame for evaluation of two project cycles is likely to be less than sufficient given the long incumbency of traditional and religious power structures. Second, both groups do not consider that incentives are strong enough to warrant undertaking PNPM approaches to other aspects of village governance. Communities do not view their participation and input into village affairs as having the potential to impact decision–making. With respect to local government village officials are primarily responsive to regulatory and legal requirements, for which most other activities do not include key PNPM principles such as participation and transparency.
Facilitation effectiveness and “routine” implementation is a contributing factor. Also from the qualitative component, a contributing factor to the lack of effectiveness in the social and community capacity built by PNPM in influencing non–PNPM affairs is the approach to project implementation. Frequently, the project process and procedures are viewed as routine or “mechanistic” in their implementation in the sense that procedures are followed in order to satisfy requirements rather than to build the capacity of community members. One factor cited is the tendency of “requirement satisfaction” among village officials in implementation of other project activities that can lead community members in PNPM cases to simply follow PNPM procedures but not embrace the principles behind them. A second factor, also cited in other studies on PNPM40 is the quality of facilitation, which is impacted by administrative burden, lack of sufficient training and lack of quality candidates. Facilitators frequently either have too many administrative tasks to devote enough time to community empowerment and/or do not have the skills or training to be effective.41
34 These cohorts are children aged 11 and 12 in classes 5 and 6 of the typical six year primary school course.
35 Given that the location of upper secondary schools is typically in district and sometimes sub–district centers, requiring students to live away from home, it is difficult to accurately assess enrollment rates at this level. Doing so would have required tracking of individuals which was not feasible given the scope and budget of the study.
36 Results for net enrollment rates are only given for the full sample in the tables. However, additional estimates on sub–groups also demonstrated lack of impact. These results are available on request.
37 See SMERU (2011), Section 5.3. 38 Results from regression results not shown in Table 8 pertaining to social dynamics and governance are available upon request.
39 SMERU (2010), p 14–15, 29, 64–67.40 See AKATIGA (2010)41 SMERU (2010) p 64–67.

21 22
V. DISCUSSION AND CONCLUSIONS
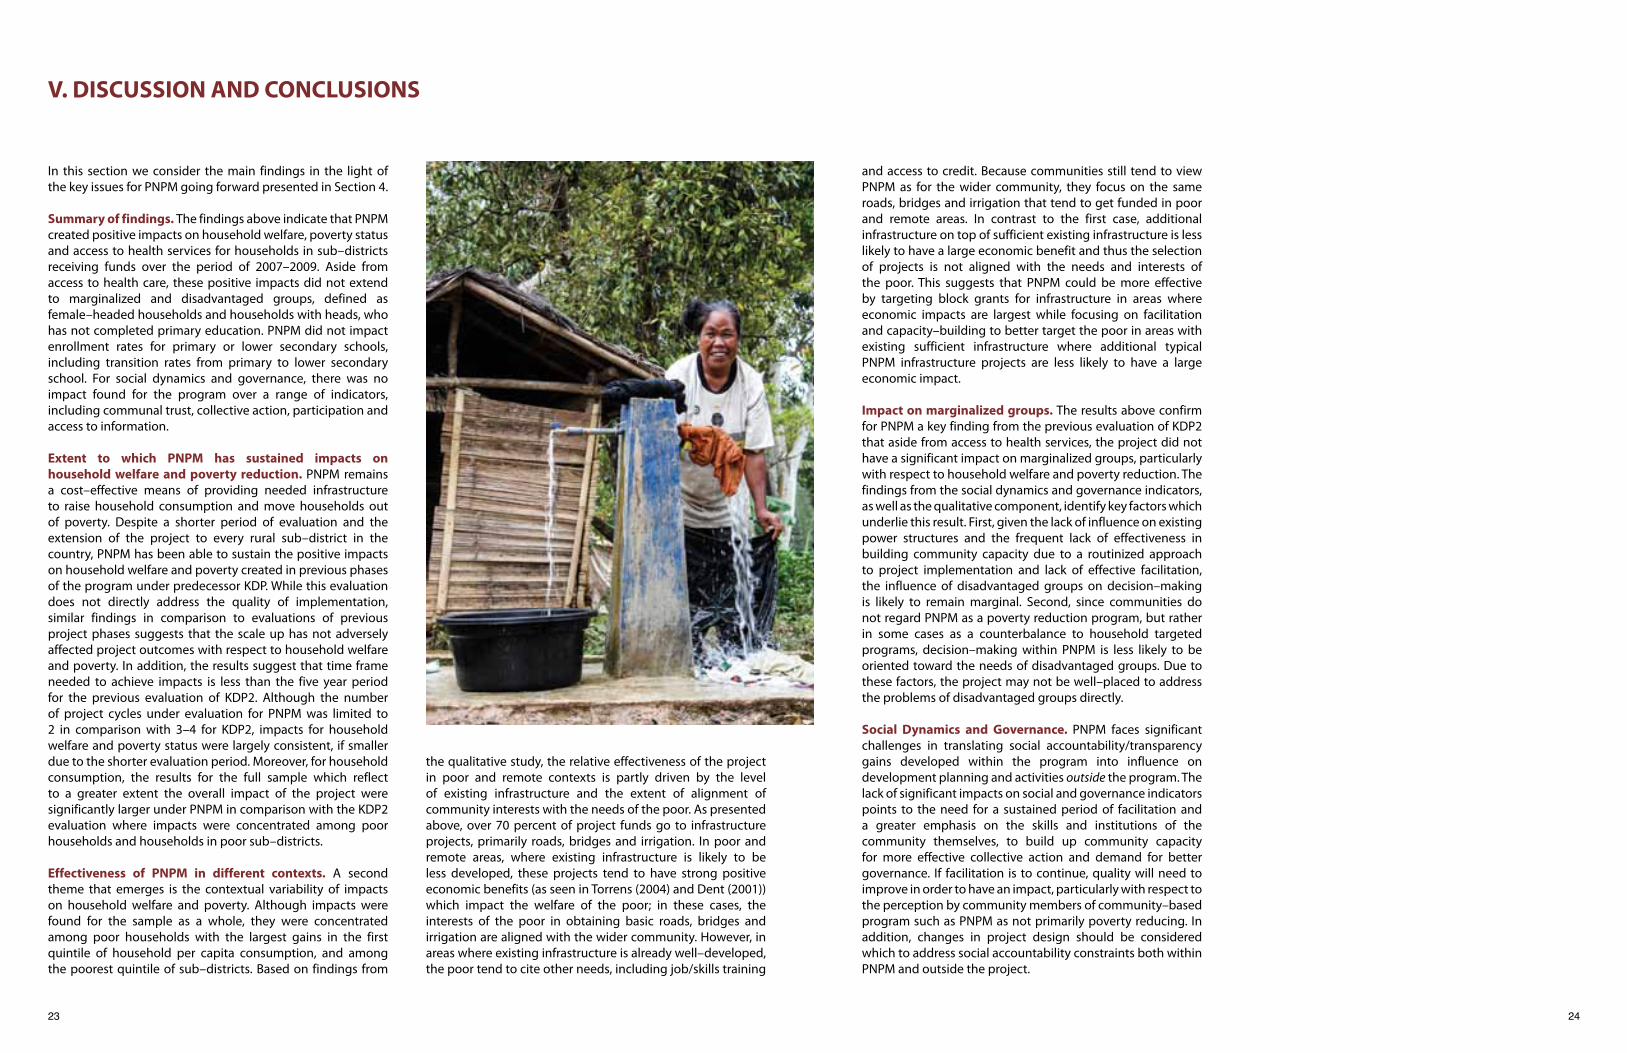
23 24
V. DISCUSSION AND CONCLUSIONS
In this section we consider the main findings in the light of the key issues for PNPM going forward presented in Section 4.
Summary of findings. The findings above indicate that PNPM created positive impacts on household welfare, poverty status and access to health services for households in sub–districts receiving funds over the period of 2007–2009. Aside from access to health care, these positive impacts did not extend to marginalized and disadvantaged groups, defined as female–headed households and households with heads, who has not completed primary education. PNPM did not impact enrollment rates for primary or lower secondary schools, including transition rates from primary to lower secondary school. For social dynamics and governance, there was no impact found for the program over a range of indicators, including communal trust, collective action, participation and access to information.
Extent to which PNPM has sustained impacts on household welfare and poverty reduction. PNPM remains a cost–effective means of providing needed infrastructure to raise household consumption and move households out of poverty. Despite a shorter period of evaluation and the extension of the project to every rural sub–district in the country, PNPM has been able to sustain the positive impacts on household welfare and poverty created in previous phases of the program under predecessor KDP. While this evaluation does not directly address the quality of implementation, similar findings in comparison to evaluations of previous project phases suggests that the scale up has not adversely affected project outcomes with respect to household welfare and poverty. In addition, the results suggest that time frame needed to achieve impacts is less than the five year period for the previous evaluation of KDP2. Although the number of project cycles under evaluation for PNPM was limited to 2 in comparison with 3–4 for KDP2, impacts for household welfare and poverty status were largely consistent, if smaller due to the shorter evaluation period. Moreover, for household consumption, the results for the full sample which reflect to a greater extent the overall impact of the project were significantly larger under PNPM in comparison with the KDP2 evaluation where impacts were concentrated among poor households and households in poor sub–districts.
Effectiveness of PNPM in different contexts. A second theme that emerges is the contextual variability of impacts on household welfare and poverty. Although impacts were found for the sample as a whole, they were concentrated among poor households with the largest gains in the first quintile of household per capita consumption, and among the poorest quintile of sub–districts. Based on findings from
the qualitative study, the relative effectiveness of the project in poor and remote contexts is partly driven by the level of existing infrastructure and the extent of alignment of community interests with the needs of the poor. As presented above, over 70 percent of project funds go to infrastructure projects, primarily roads, bridges and irrigation. In poor and remote areas, where existing infrastructure is likely to be less developed, these projects tend to have strong positive economic benefits (as seen in Torrens (2004) and Dent (2001)) which impact the welfare of the poor; in these cases, the interests of the poor in obtaining basic roads, bridges and irrigation are aligned with the wider community. However, in areas where existing infrastructure is already well–developed, the poor tend to cite other needs, including job/skills training
and access to credit. Because communities still tend to view PNPM as for the wider community, they focus on the same roads, bridges and irrigation that tend to get funded in poor and remote areas. In contrast to the first case, additional infrastructure on top of sufficient existing infrastructure is less likely to have a large economic benefit and thus the selection of projects is not aligned with the needs and interests of the poor. This suggests that PNPM could be more effective by targeting block grants for infrastructure in areas where economic impacts are largest while focusing on facilitation and capacity–building to better target the poor in areas with existing sufficient infrastructure where additional typical PNPM infrastructure projects are less likely to have a large economic impact.
Impact on marginalized groups. The results above confirm for PNPM a key finding from the previous evaluation of KDP2 that aside from access to health services, the project did not have a significant impact on marginalized groups, particularly with respect to household welfare and poverty reduction. The findings from the social dynamics and governance indicators, as well as the qualitative component, identify key factors which underlie this result. First, given the lack of influence on existing power structures and the frequent lack of effectiveness in building community capacity due to a routinized approach to project implementation and lack of effective facilitation, the influence of disadvantaged groups on decision–making is likely to remain marginal. Second, since communities do not regard PNPM as a poverty reduction program, but rather in some cases as a counterbalance to household targeted programs, decision–making within PNPM is less likely to be oriented toward the needs of disadvantaged groups. Due to these factors, the project may not be well–placed to address the problems of disadvantaged groups directly.
Social Dynamics and Governance. PNPM faces significant challenges in translating social accountability/transparency gains developed within the program into influence on development planning and activities outside the program. The lack of significant impacts on social and governance indicators points to the need for a sustained period of facilitation and a greater emphasis on the skills and institutions of the community themselves, to build up community capacity for more effective collective action and demand for better governance. If facilitation is to continue, quality will need to improve in order to have an impact, particularly with respect to the perception by community members of community–based program such as PNPM as not primarily poverty reducing. In addition, changes in project design should be considered which to address social accountability constraints both within PNPM and outside the project.

25 26
VI. RECOMMENDATIONS ANDPOLICY IMPLICATIONS
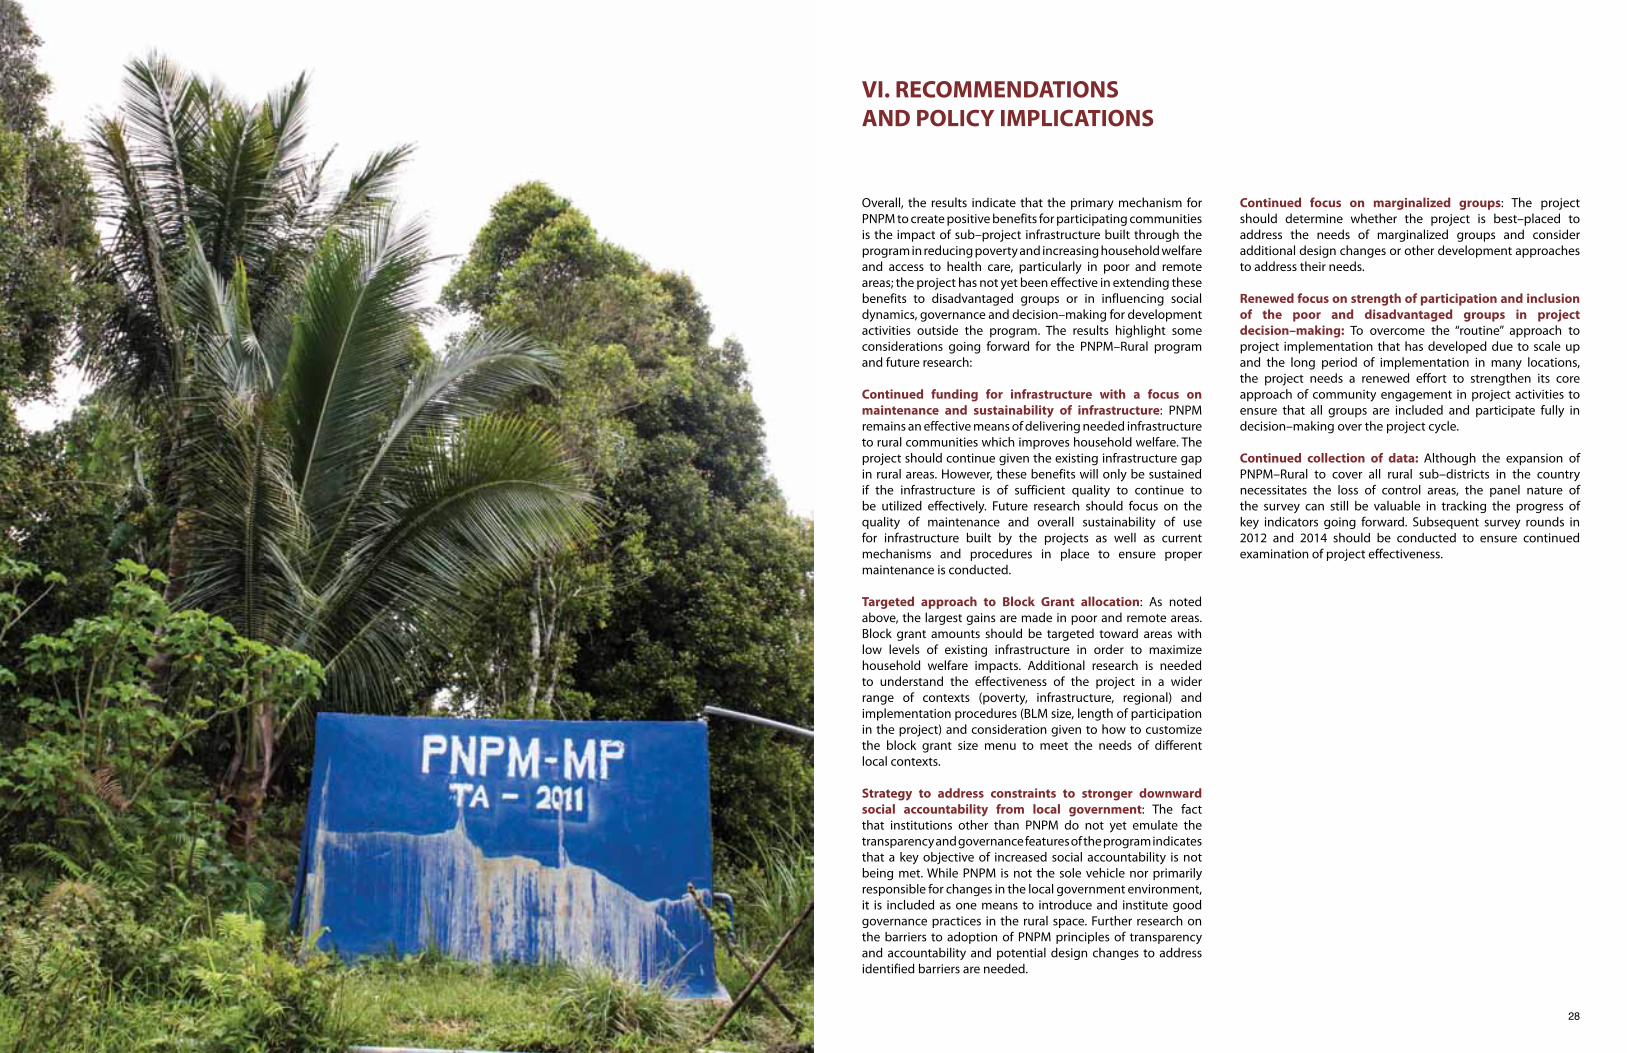
27 28
VI. RECOMMENDATIONSAND POLICY IMPLICATIONS
Overall, the results indicate that the primary mechanism for PNPM to create positive benefits for participating communities is the impact of sub–project infrastructure built through the program in reducing poverty and increasing household welfare and access to health care, particularly in poor and remote areas; the project has not yet been effective in extending these benefits to disadvantaged groups or in influencing social dynamics, governance and decision–making for development activities outside the program. The results highlight some considerations going forward for the PNPM–Rural program and future research: Continued funding for infrastructure with a focus on maintenance and sustainability of infrastructure: PNPM remains an effective means of delivering needed infrastructure to rural communities which improves household welfare. The project should continue given the existing infrastructure gap in rural areas. However, these benefits will only be sustained if the infrastructure is of sufficient quality to continue to be utilized effectively. Future research should focus on the quality of maintenance and overall sustainability of use for infrastructure built by the projects as well as current mechanisms and procedures in place to ensure proper maintenance is conducted.
Targeted approach to Block Grant allocation: As noted above, the largest gains are made in poor and remote areas. Block grant amounts should be targeted toward areas with low levels of existing infrastructure in order to maximize household welfare impacts. Additional research is needed to understand the effectiveness of the project in a wider range of contexts (poverty, infrastructure, regional) and implementation procedures (BLM size, length of participation in the project) and consideration given to how to customize the block grant size menu to meet the needs of different local contexts.
Strategy to address constraints to stronger downward social accountability from local government: The fact that institutions other than PNPM do not yet emulate the transparency and governance features of the program indicates that a key objective of increased social accountability is not being met. While PNPM is not the sole vehicle nor primarily responsible for changes in the local government environment, it is included as one means to introduce and institute good governance practices in the rural space. Further research on the barriers to adoption of PNPM principles of transparency and accountability and potential design changes to address identified barriers are needed.
Continued focus on marginalized groups: The project should determine whether the project is best–placed to address the needs of marginalized groups and consider additional design changes or other development approaches to address their needs.
Renewed focus on strength of participation and inclusion of the poor and disadvantaged groups in project decision–making: To overcome the “routine” approach to project implementation that has developed due to scale up and the long period of implementation in many locations, the project needs a renewed effort to strengthen its core approach of community engagement in project activities to ensure that all groups are included and participate fully in decision–making over the project cycle.
Continued collection of data: Although the expansion of PNPM–Rural to cover all rural sub–districts in the country necessitates the loss of control areas, the panel nature of the survey can still be valuable in tracking the progress of key indicators going forward. Subsequent survey rounds in 2012 and 2014 should be conducted to ensure continued examination of project effectiveness.
29 30
Abadie, Alberto and Guido W. Imbens, 2002, “Simple and Bias—Corrected Matching Estimators for Average Treatment Effects1”, NBER Technical Working Paper, No. 0283, Massachusetts: National Bureau of Economic Research, October 2002.
Abadie, Alberto, David Drukker, Jane Leber Herr and Guido W. Imbens1, 2001, ”Implementing Matching Estimators for Average Treatment Effects in Stata”, The Stata Journal, Vol. 1, Number 1, pp. 1–18.
Alatas, Vivi, 2005, “An Evaluation of Kecamatan Development Project”, June, Jakarta: The World Bank, June 2005.
AKATIGA, 2010, “Marginalized Groups in PNPM,” Jakarta, Indonesia: The World Bank, PNPM Support Facility.
Becker, Sascha O. and Marco Caliendo, 2007, “mhbounds – Sensitivity Analysis for Average Treatment Effects, German Institute of Economic Research, Working Paper, Berlin: DIW, January 2007.
Becker, Sascha O. and Andrea Ichino, 2002, “Estimation of average treatment effects based on propensity scores”, Centre for Employment Studies Working Paper, Laboratorio R. Revelli.
Chantala, Kim, Dan Blanchette and C. M. Suchindran, 2006, “Software to Compute Sampling Weights for Multilevel Analysis” Carolina Population Center, UNC at Chapel Hill, January 2006.
Chowhan, James and Neil J. Buckley, 2005, “Using Mean Bootstrap Weights in Stata: A BSWREG Revision”, The Research Data Centres Information and Technical Bulletin, Vol. 2 No. 1, pp. 23–37.
Cook, Thomas D., William R. Shadish, Jr., and Vivian C. Wong, 2005, “Within Study Comparisons of Experiments and Non–Experiments: Can they help decide on Evaluation Policy?”, Paper presented at the French Econometric Society Meeting on Program Evaluation, Paris, France, December 2005 .
Deaton, Angus, 2000. The Analysis of Household Surveys: A Microeconometric Approach to Development Policy. Baltimore: The Johns Hopkins University.
Demographic Institute Faculty of Economic University of Indonesia, 2002, “Evaluating KDP Impacts on Community Organization and Household Welfare”, Depok: Faculty of Economics University of Indonesia, July 2002.
Dehejia, Rajeev H. and Sadek Wahba, 2002, “Propensity Score–Matching Methods for Nonexperimental Causal Studies”, The Review of Economics and Statistics, Vol. 84, No. 1, pp. 151–161, February 2002.
Dent, Geoffrey, 2001 “Ex–Post Evaluation of Kecamatan Development Program (KDP1) Infrastructure Projects.”, Jakarta: The World Bank.
Dragoset, Lisa and Fields, Gary, 2006 “US Earnings Mobility: Comparing Survey–Based and Administrative–Based Estimates.” Society for the Study of Economic Inequality Working Paper, WP2006–55, ECINEQ.
Fields, Gary et. Al., 2001 “Household Income Dynamics: A Four Country Study.” Paper prepared for the NBER Conference on Labor and the Global Economy, Cambridge, MA, 2001.
Handa, Sudhanshu and John A. Maluccio, 2007, “Matching the gold standard: Evidence from a social experiment in Nicaragua”, Population and Health InfoShare, No. 07–100, August 2007.
Heckman, James J., Hidehiko Ichimura and Petra Todd, 1998, “Matching As An Econometric Evaluation Estimator”, Review of Economic Studies, Volume: 65, Issue: 2, April, pp. 261–94.
Institute for Social and Economic Research, Education and Information (LP3ES), 2008, “PNPM–RURAL Component Qualitative Baseline Report”, Jakarta: The World Bank.
Jalan, Jyotsna and Martin Ravallion, 2001, “Does Piped Water Reduce Children’s Health Improves on Average as A Result of Policy Diarrhea for Children Interventions that Expand in Rural India?”, Policy Research Working Paper, The World Bank Development Research Group Poverty, August 2001.
Kano, Shigeki, 2003, “Japanese Wage Curve: A Pseudo Panel Study”, University of Tsukuba, Japan, May 2003.
Labonne, Julien and Rob Chase, 2007, “Who’s at the Wheel when Communities Drive Development? The Case of the KALAHI–CIDSS in the Philippines”, Social Development Papers, Paper No. 107, The World Bank, September 2007.
Lawson, David, Andy McKay and John Okidi, 2003, “Poverty Persistence and Transitions in Uganda: A Combined Qualitative and Quantitative Analysis”, Kampala: Economic Policy Research Centre, December 2003.
Lawson, David, Andy McKay and John Okidi, 2003, “Poverty Persistence and Transitions in Uganda: A Combined Qualitative and Quantitative Analysis”, Kampala: Economic Policy Research Centre, December 2003.
Mansuri, Ghazala and Rao, Vijayendra, 2004. “Community Based (and Driven) Development: A Critical Review”. World Bank Policy Research Working Paper No. 3209.
McCulloch, Neil. and Baluch, B, 1999. “Distinguishing the Chronically From Transitory Poor– Evidence from Pakistan”, Working Paper No. 97, Institute of Development Studies, University of Sussex, UK.
McKenzie, David, John Gibson and Steven Stillman, 2006, “How Important is Selection? Experimental Vs Non–experimental Measures of the Income Gains from Migration1”, Policy Research Working Paper Series, No. 3906, The World Bank, May 2006.
McLaughlin Kerry, Satu Adam, and Hoppe, Michael 2007, “Kecamatan Development Program Qualitative Impact Evaluation.” Jakarta: The World Bank.
Morgan, Stephen L and David J. Harding, 2006, “Matching Estimators of Causal Effects: From Stratification and Weighting to Practical Data Analysis Routines”, Sociological Methods & Research, Vol. 35, No. 1, 3–60.
National Management Consultants 2005, “Kecamatan Development Program Phase Two: Fourth Annual Report 2005” : Jakarta, National Management Consultant for KDP National Secretariat, Directorate General Community and Rural Development, Ministry of Home Affairs
National Management Consultants 2007, “Kecamatan Development Program Phase Two: Final Report”: Jakarta, National Management Consultant for KDP National Secretariat, Directorate General Community and Rural Development, Ministry of Home Affairs
Olken, Ben. 2005. “Power Calculations for Community CCT Project”, Jakarta: The World Bank, mimeo.
Papanek, Gustav F., 2007, “Employment and the PNPM–RURAL Program”, Jakarta: The World Bank, December 2007.
Pritchett, Lant, Asep Suryahadi, Sudarno Sumarto, 2000, “Quantifying Vulnerability to Poverty: A Proposed Measure, with Application to Indonesia”, SMERU Working Paper, May 2002.
Raudenbush et. al. 2006. “Optimal Design for Logitudinal and Multilevel Research.”, National Institutes of Health, mimeo.
Rubin, Donald B. and Neal Thomas, 2000, “Combining Propensity Score Matching with Additional Adjustments for Prognostic Covariates”, Journal of the American Statistical Association, Vol. 95, No. 450, pp. 573–585, June 2000.
Rubin, Donald B., 1979, “Using Multivariate Matched Sampling and Regression Adjustment to Control Bias in Observational Studies”, Journal of the American Statistical Association, Vol. 74, No. 366, pp. 318–328, June 1979.
Rosenbaum P. R and Rubin, Donald, 1983, “The Central Role of the Propensity Score in Observational Studies for Causal Effects,” Biometrika, 70, pp 41–55.
SMERU, 2010, “A Qualitative Study on the Impact of the 2010 PNPM–Rural in East Java, West Sumatra, and Southeast Sulawesi,” Jakarta, Indonesia: The World Bank, PNPM Support Facility.
REFERENCES
31 32
Smith, Jeffrey and Todd, Petra, 2003. “Does Matching Overcome Lalonde’s Critique of Nonexperimental Estimators?,” University of Western Ontario, CIBC Human Capital and Productivity Project Working Papers No. 20035, University of Western Ontario, CIBC Human Capital and Productivity Project. Suryadarma, Daniel, Asep Suryahadi and Sudarno Sumarto, 2007, “Reducing Unemployment in Indonesia: Results from a Growth–Employment Elasticity Model”, SMERU Working Paper, Jakarta: SMERU Research Institute. January 2007.
Suryadarma, Daniel Asep Suryahadi and Sudarno Sumarto, 2005, “The Measurement and Trends of Unemployment in Indonesia: The Issue of Discouraged Workers”, SMERU Working Paper, Jakarta: SMERU Research Institute, July 2005.
Suryahadi, Asep and Sudarno Sumarto, 1999, “Update on the Impact on the Indonesian Crisis on the Consumption Expenditure and Poverty Incidence: Results from the December 1998 Round of 100 Village Survey”, SMERU Working Paper, Jakarta: Social Monitoring and Early Response Unit, SMERU, August 1999.
Torrens, Anthony, 2005, “Economic Impact Analysis of Kecamatan Development Program Infrastructure Projects”, Jakarta: The World Bank.
Voss, John, 2008. “Impact Evaluation of the Second Phase of the Kecamatan Development Program”, Jakarta, The World Bank.
Wassenich, Paul and Katherine Whiteside. 2003. “CDD Impact Assessment Study: Optimizing Evaluation Design Under Constraints”, World Bank CDD and Social Capital Anchor, Mimeo.
Wiehler, Stephan A., 2006, “Bias Reducing Estimation of Treatment Effects in the Presence of Partially Distorted Data”, Berlin: Swiss Institute for International Economics and Applied Research, University of St. Gallen, Switzer–land, January 2006.
World Bank, 2005, “CDD and Social Capital Impact Designing a Baseline Survey in the Philippines”, Washington, D.C.: The International Bank for Reconstruction and Development, The World Bank, May 2005.
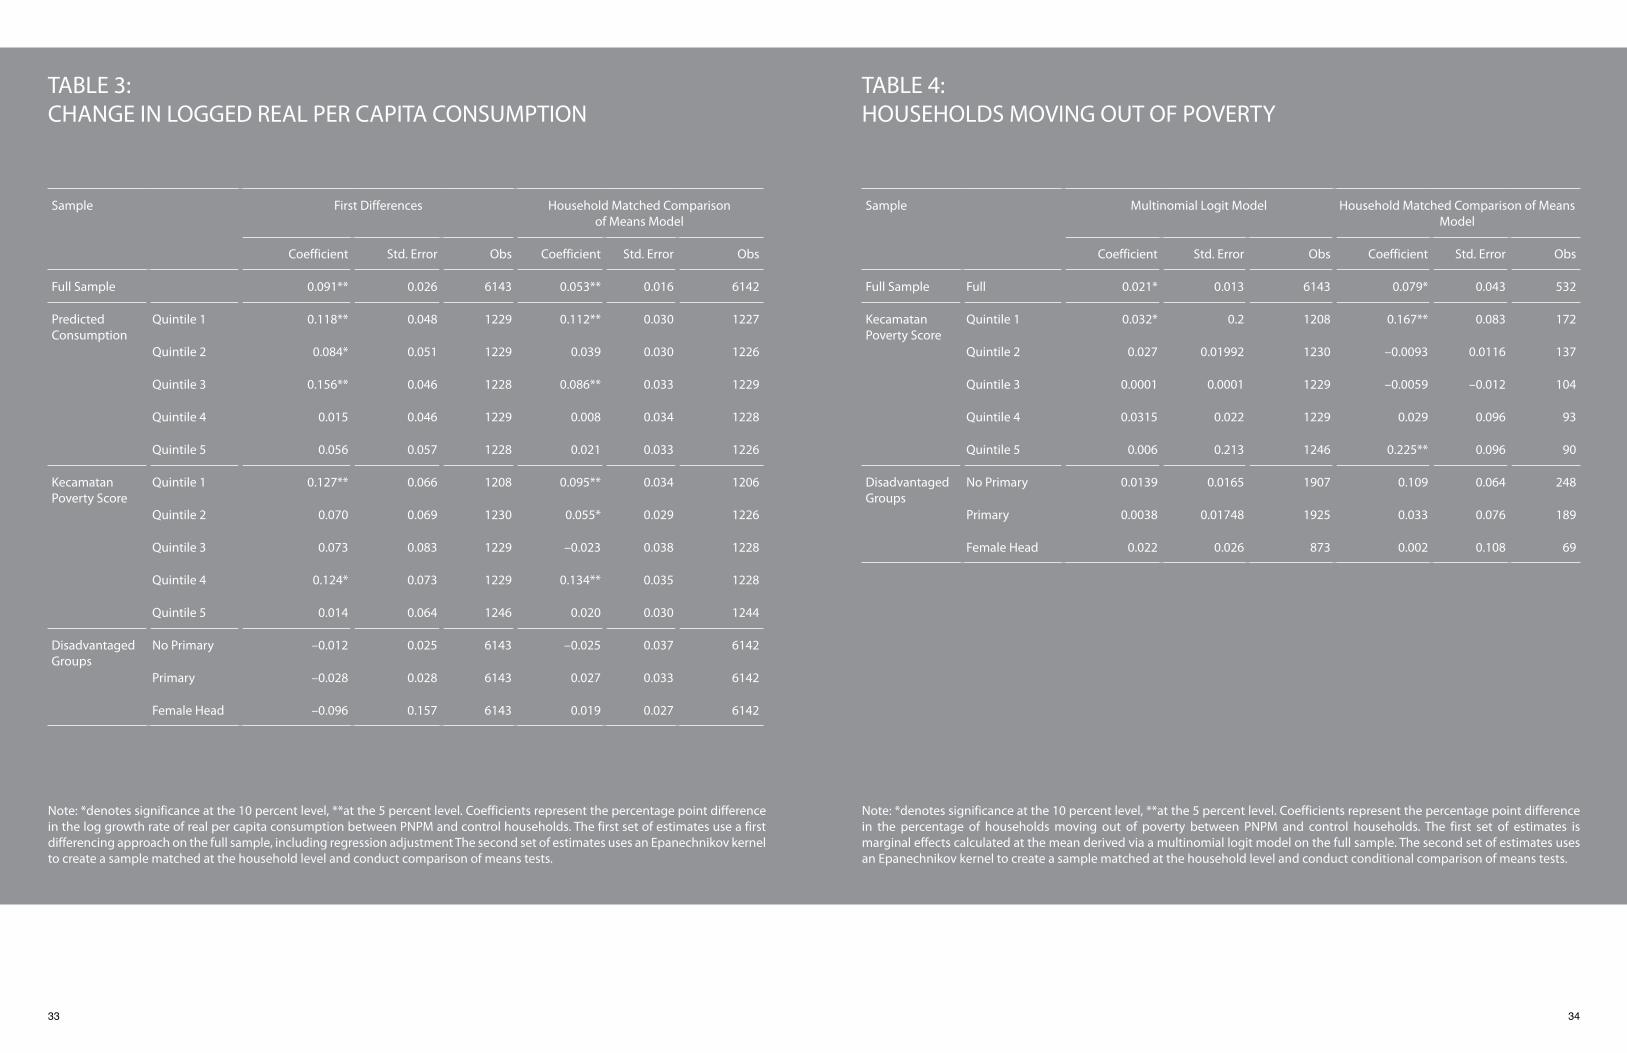
33 34
TABLE 3:CHANGE IN LOGGED REAL PER CAPITA CONSUMPTION
Note: *denotes significance at the 10 percent level, **at the 5 percent level. Coefficients represent the percentage point difference in the log growth rate of real per capita consumption between PNPM and control households. The first set of estimates use a first differencing approach on the full sample, including regression adjustment The second set of estimates uses an Epanechnikov kernel to create a sample matched at the household level and conduct comparison of means tests.
TABLE 4:HOUSEHOLDS MOVING OUT OF POVERTY
Note: *denotes significance at the 10 percent level, **at the 5 percent level. Coefficients represent the percentage point difference in the percentage of households moving out of poverty between PNPM and control households. The first set of estimates is marginal effects calculated at the mean derived via a multinomial logit model on the full sample. The second set of estimates uses an Epanechnikov kernel to create a sample matched at the household level and conduct conditional comparison of means tests.
Sample First Differences
Household Matched Comparison of Means Model
Coefficient Std. Error Obs Coefficient Std. Error Obs
Full Sample 0.091** 0.026 6143 0.053** 0.016 6142
Predicted Consumption
Quintile 1 0.118** 0.048 1229 0.112** 0.030 1227
Quintile 2 0.084* 0.051 1229 0.039 0.030 1226
Quintile 3 0.156** 0.046 1228 0.086** 0.033 1229
Quintile 4 0.015 0.046 1229 0.008 0.034 1228
Quintile 5 0.056 0.057 1228 0.021 0.033 1226
Kecamatan Poverty Score
Quintile 1 0.127** 0.066 1208 0.095** 0.034 1206
Quintile 2 0.070 0.069 1230 0.055* 0.029 1226
Quintile 3 0.073 0.083 1229 –0.023 0.038 1228
Quintile 4 0.124* 0.073 1229 0.134** 0.035 1228
Quintile 5 0.014 0.064 1246 0.020 0.030 1244
Disadvantaged Groups
No Primary –0.012 0.025 6143 –0.025 0.037 6142
Primary –0.028 0.028 6143 0.027 0.033 6142
Female Head –0.096 0.157 6143 0.019 0.027 6142
Sample
Multinomial Logit Model
Household Matched Comparison of Means Model
Coefficient Std. Error Obs Coefficient Std. Error Obs
Full Sample Full 0.021* 0.013 6143 0.079* 0.043 532
Kecamatan Poverty Score
Quintile 1 0.032* 0.2 1208 0.167** 0.083 172
Quintile 2 0.027 0.01992 1230 –0.0093 0.0116 137
Quintile 3 0.0001 0.0001 1229 –0.0059 –0.012 104
Quintile 4 0.0315 0.022 1229 0.029 0.096 93
Quintile 5 0.006 0.213 1246 0.225** 0.096 90
Disadvantaged Groups
No Primary 0.0139 0.0165 1907 0.109 0.064 248
Primary 0.0038 0.01748 1925 0.033 0.076 189
Female Head 0.022 0.026 873 0.002 0.108 69
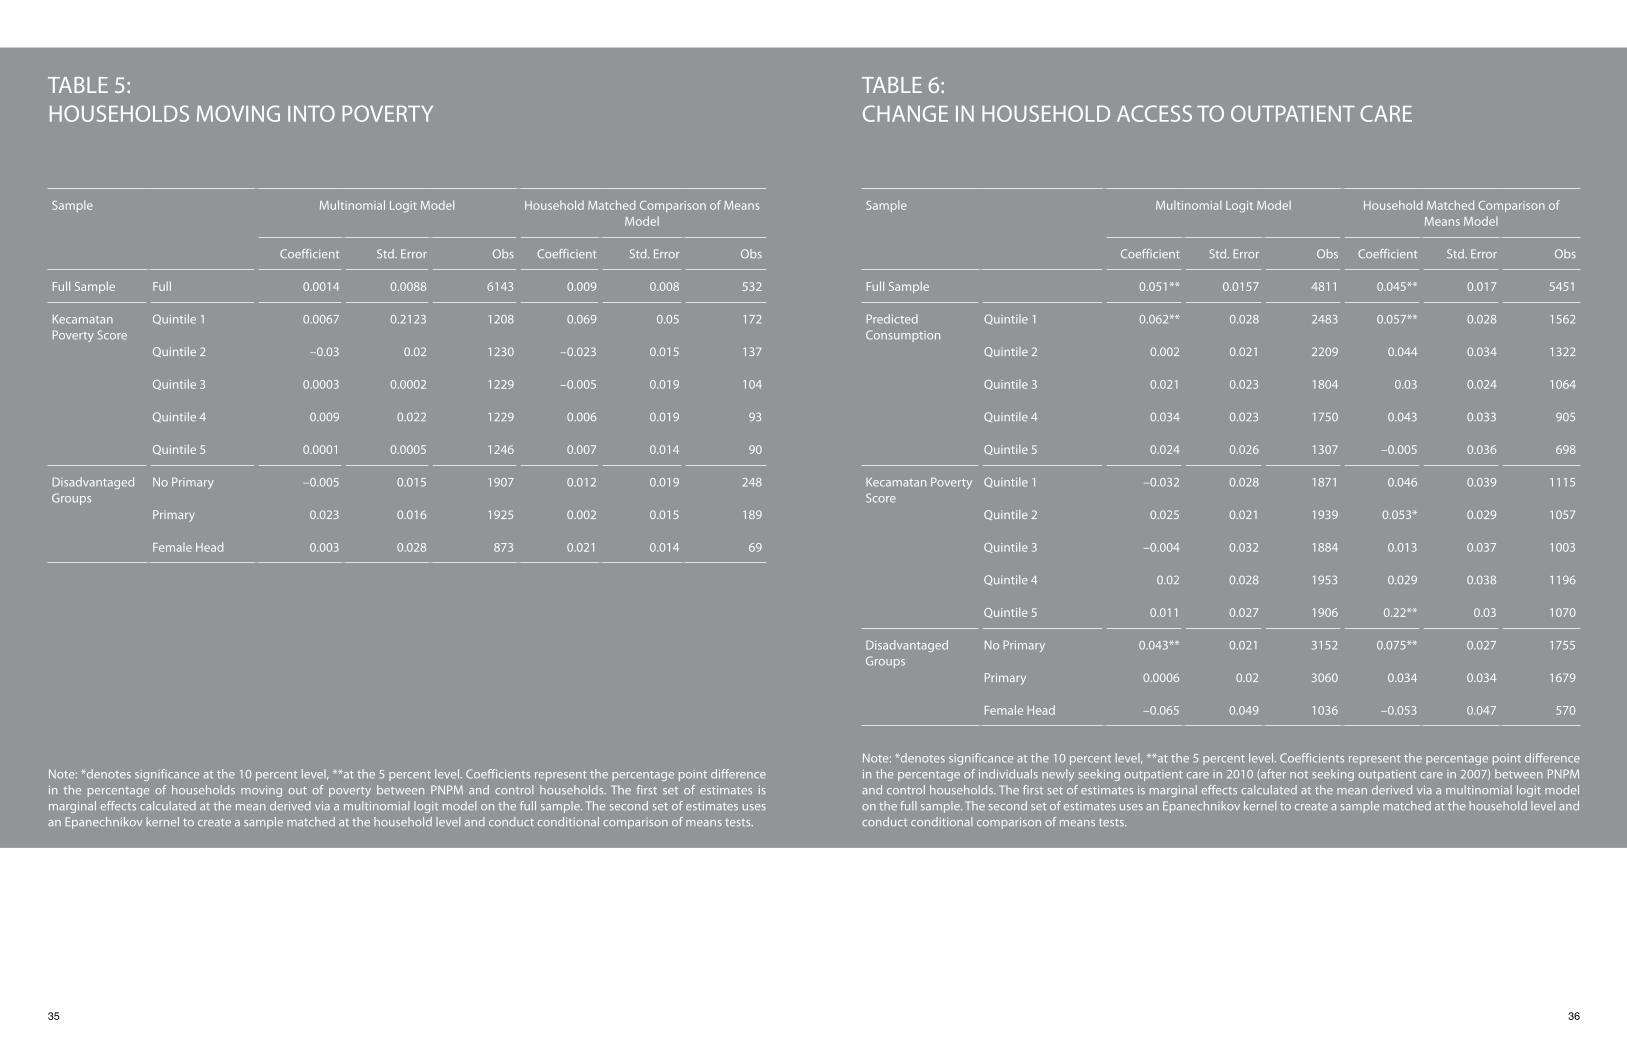
35 36
TABLE 5:HOUSEHOLDS MOVING INTO POVERTY
Note: *denotes significance at the 10 percent level, **at the 5 percent level. Coefficients represent the percentage point difference in the percentage of households moving out of poverty between PNPM and control households. The first set of estimates is marginal effects calculated at the mean derived via a multinomial logit model on the full sample. The second set of estimates uses an Epanechnikov kernel to create a sample matched at the household level and conduct conditional comparison of means tests.
TABLE 6: CHANGE IN HOUSEHOLD ACCESS TO OUTPATIENT CARE
Note: *denotes significance at the 10 percent level, **at the 5 percent level. Coefficients represent the percentage point difference in the percentage of individuals newly seeking outpatient care in 2010 (after not seeking outpatient care in 2007) between PNPM and control households. The first set of estimates is marginal effects calculated at the mean derived via a multinomial logit model on the full sample. The second set of estimates uses an Epanechnikov kernel to create a sample matched at the household level and conduct conditional comparison of means tests.
Sample Multinomial Logit Model
Household Matched Comparison of Means Model
Coefficient Std. Error Obs Coefficient Std. Error Obs
Full Sample Full 0.0014 0.0088 6143 0.009 0.008 532
Kecamatan Poverty Score
Quintile 1 0.0067 0.2123 1208 0.069 0.05 172
Quintile 2 –0.03 0.02 1230 –0.023 0.015 137
Quintile 3 0.0003 0.0002 1229 –0.005 0.019 104
Quintile 4 0.009 0.022 1229 0.006 0.019 93
Quintile 5 0.0001 0.0005 1246 0.007 0.014 90
Disadvantaged Groups
No Primary –0.005 0.015 1907 0.012 0.019 248
Primary 0.023 0.016 1925 0.002 0.015 189
Female Head 0.003 0.028 873 0.021 0.014 69
Sample Multinomial Logit Model Household Matched Comparison of Means Model
Coefficient Std. Error Obs Coefficient Std. Error Obs
Full Sample 0.051** 0.0157 4811 0.045** 0.017 5451
Predicted Consumption
Quintile 1 0.062** 0.028 2483 0.057** 0.028 1562
Quintile 2 0.002 0.021 2209 0.044 0.034 1322
Quintile 3 0.021 0.023 1804 0.03 0.024 1064
Quintile 4 0.034 0.023 1750 0.043 0.033 905
Quintile 5 0.024 0.026 1307 –0.005 0.036 698
Kecamatan Poverty Score
Quintile 1 –0.032 0.028 1871 0.046 0.039 1115
Quintile 2 0.025 0.021 1939 0.053* 0.029 1057
Quintile 3 –0.004 0.032 1884 0.013 0.037 1003
Quintile 4 0.02 0.028 1953 0.029 0.038 1196
Quintile 5 0.011 0.027 1906 0.22** 0.03 1070
Disadvantaged Groups
No Primary 0.043** 0.021 3152 0.075** 0.027 1755
Primary 0.0006 0.02 3060 0.034 0.034 1679
Female Head –0.065 0.049 1036 –0.053 0.047 570
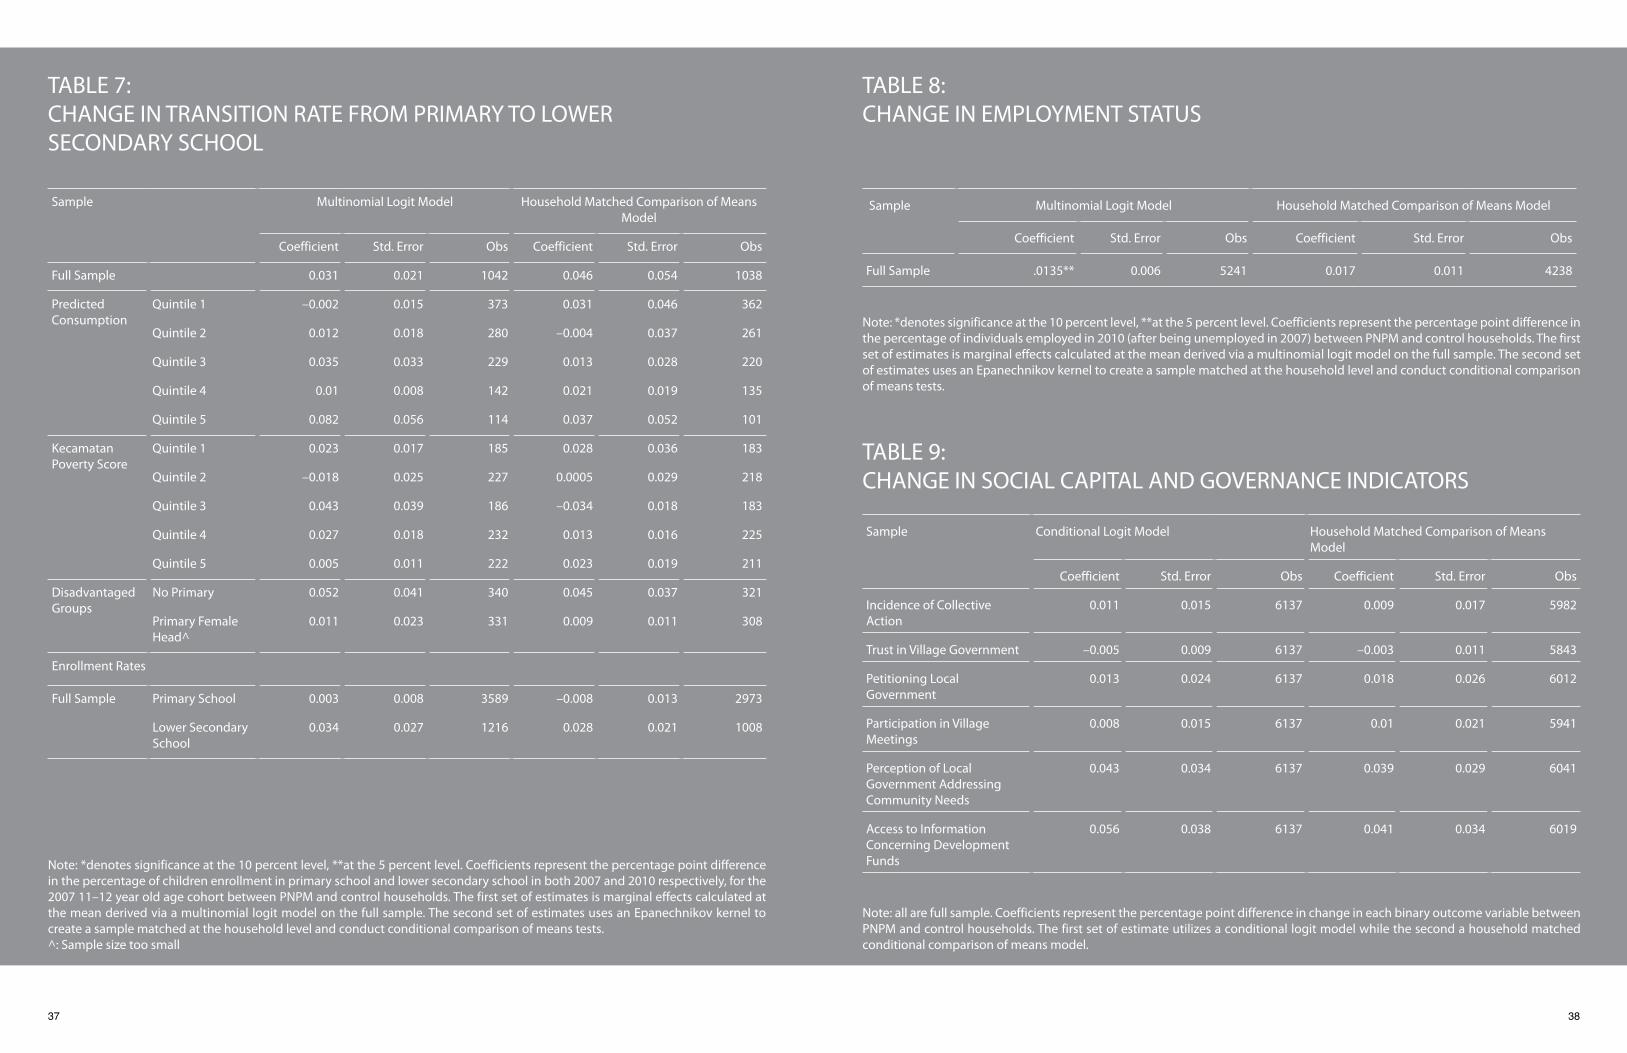
37 38
TABLE 7: CHANGE IN TRANSITION RATE FROM PRIMARY TO LOWER SECONDARY SCHOOL
Note: *denotes significance at the 10 percent level, **at the 5 percent level. Coefficients represent the percentage point difference in the percentage of children enrollment in primary school and lower secondary school in both 2007 and 2010 respectively, for the 2007 11–12 year old age cohort between PNPM and control households. The first set of estimates is marginal effects calculated at the mean derived via a multinomial logit model on the full sample. The second set of estimates uses an Epanechnikov kernel to create a sample matched at the household level and conduct conditional comparison of means tests.^: Sample size too small
TABLE 8: CHANGE IN EMPLOYMENT STATUS
Note: *denotes significance at the 10 percent level, **at the 5 percent level. Coefficients represent the percentage point difference in the percentage of individuals employed in 2010 (after being unemployed in 2007) between PNPM and control households. The first set of estimates is marginal effects calculated at the mean derived via a multinomial logit model on the full sample. The second set of estimates uses an Epanechnikov kernel to create a sample matched at the household level and conduct conditional comparison of means tests.
TABLE 9: CHANGE IN SOCIAL CAPITAL AND GOVERNANCE INDICATORS
Note: all are full sample. Coefficients represent the percentage point difference in change in each binary outcome variable between PNPM and control households. The first set of estimate utilizes a conditional logit model while the second a household matched conditional comparison of means model.
Sample Multinomial Logit Model
Household Matched Comparison of Means Model
Coefficient Std. Error Obs Coefficient Std. Error Obs
Full Sample 0.031 0.021 1042 0.046 0.054 1038
Predicted Consumption
Quintile 1 –0.002 0.015 373 0.031 0.046 362
Quintile 2 0.012 0.018 280 –0.004 0.037 261
Quintile 3 0.035 0.033 229 0.013 0.028 220
Quintile 4 0.01 0.008 142 0.021 0.019 135
Quintile 5 0.082 0.056 114 0.037 0.052 101
Kecamatan Poverty Score
Quintile 1 0.023 0.017 185 0.028 0.036 183
Quintile 2 –0.018 0.025 227 0.0005 0.029 218
Quintile 3 0.043 0.039 186 –0.034 0.018 183
Quintile 4 0.027 0.018 232 0.013 0.016 225
Quintile 5 0.005 0.011 222 0.023 0.019 211
Disadvantaged Groups
No Primary 0.052 0.041 340 0.045 0.037 321
Primary Female Head^
0.011 0.023 331 0.009 0.011 308
Enrollment Rates
Full Sample
Primary School 0.003 0.008 3589 –0.008 0.013 2973
Lower Secondary School
0.034 0.027 1216 0.028 0.021 1008
Sample Multinomial Logit Model Household Matched Comparison of Means Model
Coefficient Std. Error Obs Coefficient Std. Error Obs
Full Sample .0135** 0.006 5241 0.017 0.011 4238
Sample Conditional Logit Model Household Matched Comparison of Means Model
Coefficient Std. Error Obs Coefficient Std. Error Obs
Incidence of Collective Action
0.011 0.015 6137 0.009 0.017 5982
Trust in Village Government –0.005 0.009 6137 –0.003 0.011 5843
Petitioning Local Government
0.013 0.024 6137 0.018 0.026 6012
Participation in Village Meetings
0.008 0.015 6137 0.01 0.021 5941
Perception of Local Government Addressing Community Needs
0.043 0.034 6137 0.039 0.029 6041
Access to Information Concerning Development Funds
0.056 0.038 6137 0.041 0.034 6019

39 40
ANNEXES
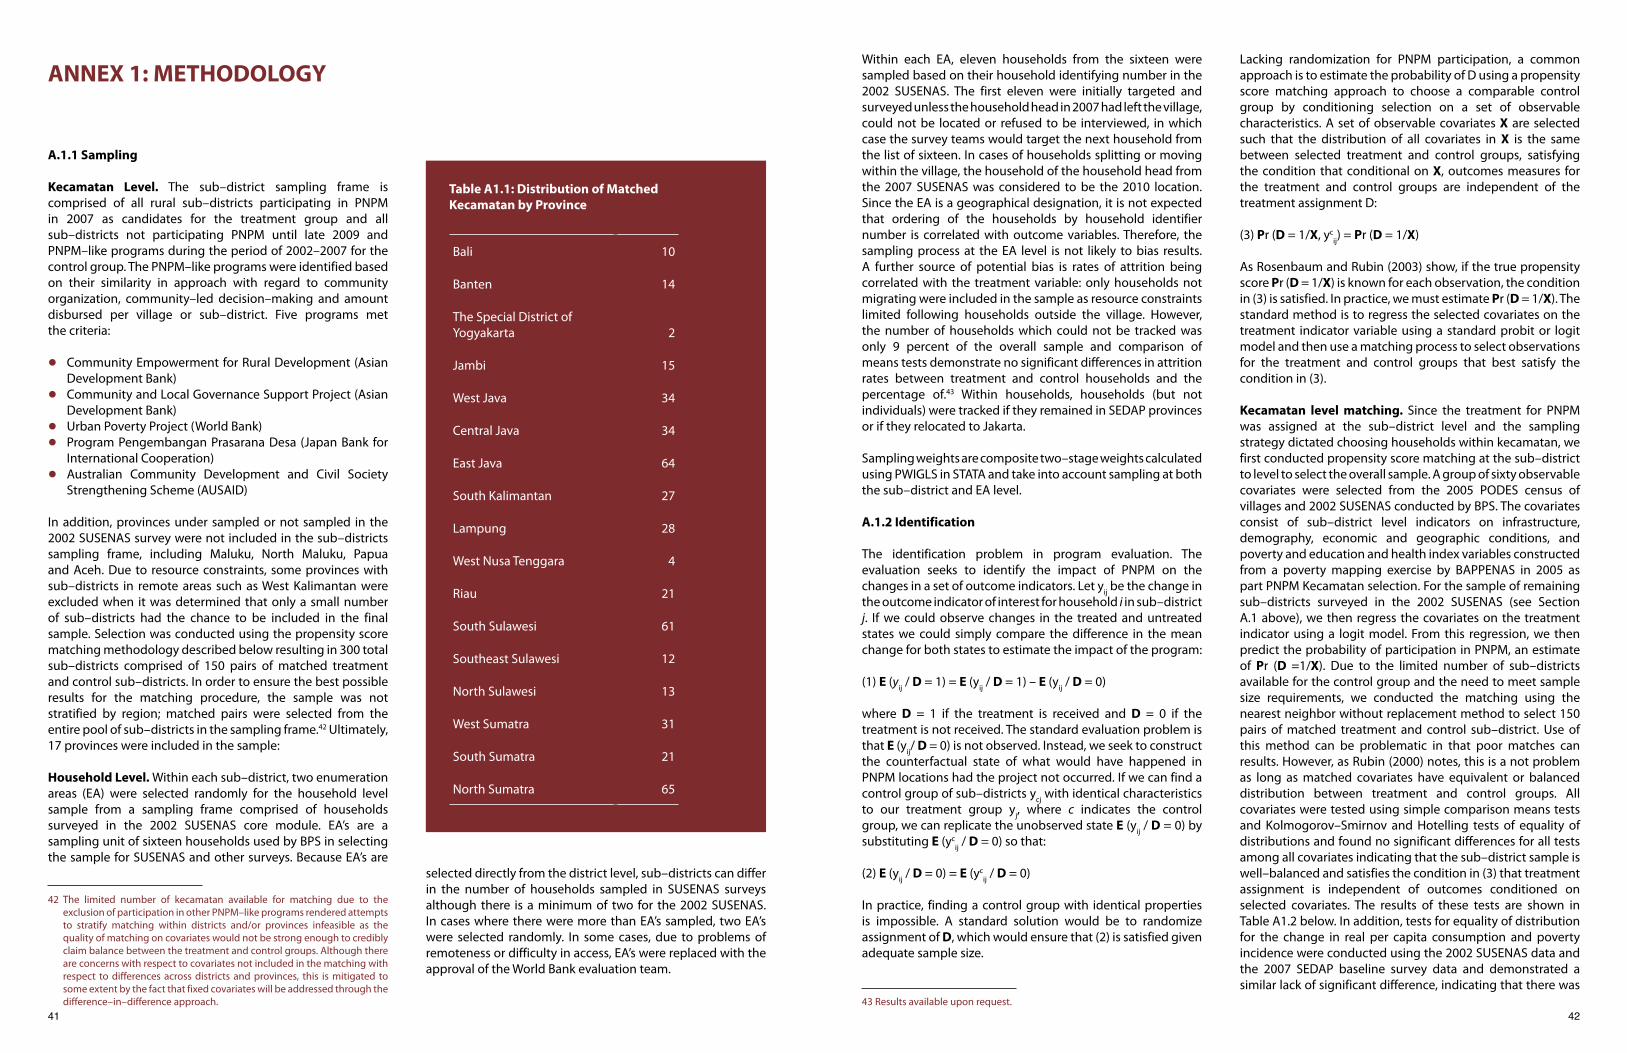
41 42
ANNEX 1: METHODOLOGY
A.1.1 Sampling
Kecamatan Level. The sub–district sampling frame is comprised of all rural sub–districts participating in PNPM in 2007 as candidates for the treatment group and all sub–districts not participating PNPM until late 2009 and PNPM–like programs during the period of 2002–2007 for the control group. The PNPM–like programs were identified based on their similarity in approach with regard to community organization, community–led decision–making and amount disbursed per village or sub–district. Five programs met the criteria:
• Community Empowerment for Rural Development (Asian Development Bank)
• Community and Local Governance Support Project (Asian Development Bank)
• Urban Poverty Project (World Bank)• Program Pengembangan Prasarana Desa (Japan Bank for
International Cooperation)• Australian Community Development and Civil Society
Strengthening Scheme (AUSAID)
In addition, provinces under sampled or not sampled in the 2002 SUSENAS survey were not included in the sub–districts sampling frame, including Maluku, North Maluku, Papua and Aceh. Due to resource constraints, some provinces with sub–districts in remote areas such as West Kalimantan were excluded when it was determined that only a small number of sub–districts had the chance to be included in the final sample. Selection was conducted using the propensity score matching methodology described below resulting in 300 total sub–districts comprised of 150 pairs of matched treatment and control sub–districts. In order to ensure the best possible results for the matching procedure, the sample was not stratified by region; matched pairs were selected from the entire pool of sub–districts in the sampling frame.42 Ultimately, 17 provinces were included in the sample:
Household Level. Within each sub–district, two enumeration areas (EA) were selected randomly for the household level sample from a sampling frame comprised of households surveyed in the 2002 SUSENAS core module. EA’s are a sampling unit of sixteen households used by BPS in selecting the sample for SUSENAS and other surveys. Because EA’s are
Table A1.1: Distribution of Matched Kecamatan by Province
selected directly from the district level, sub–districts can differ in the number of households sampled in SUSENAS surveys although there is a minimum of two for the 2002 SUSENAS. In cases where there were more than EA’s sampled, two EA’s were selected randomly. In some cases, due to problems of remoteness or difficulty in access, EA’s were replaced with the approval of the World Bank evaluation team.
42 The limited number of kecamatan available for matching due to the exclusion of participation in other PNPM–like programs rendered attempts to stratify matching within districts and/or provinces infeasible as the quality of matching on covariates would not be strong enough to credibly claim balance between the treatment and control groups. Although there are concerns with respect to covariates not included in the matching with respect to differences across districts and provinces, this is mitigated to some extent by the fact that fixed covariates will be addressed through the difference–in–difference approach.
Within each EA, eleven households from the sixteen were sampled based on their household identifying number in the 2002 SUSENAS. The first eleven were initially targeted and surveyed unless the household head in 2007 had left the village, could not be located or refused to be interviewed, in which case the survey teams would target the next household from the list of sixteen. In cases of households splitting or moving within the village, the household of the household head from the 2007 SUSENAS was considered to be the 2010 location. Since the EA is a geographical designation, it is not expected that ordering of the households by household identifier number is correlated with outcome variables. Therefore, the sampling process at the EA level is not likely to bias results. A further source of potential bias is rates of attrition being correlated with the treatment variable: only households not migrating were included in the sample as resource constraints limited following households outside the village. However, the number of households which could not be tracked was only 9 percent of the overall sample and comparison of means tests demonstrate no significant differences in attrition rates between treatment and control households and the percentage of.43 Within households, households (but not individuals) were tracked if they remained in SEDAP provinces or if they relocated to Jakarta.
Sampling weights are composite two–stage weights calculated using PWIGLS in STATA and take into account sampling at both the sub–district and EA level.
A.1.2 Identification
The identification problem in program evaluation. The evaluation seeks to identify the impact of PNPM on the changes in a set of outcome indicators. Let yij be the change in the outcome indicator of interest for household i in sub–district j. If we could observe changes in the treated and untreated states we could simply compare the difference in the mean change for both states to estimate the impact of the program:
(1) E (yij / D = 1) = E (yij / D = 1) – E (yij / D = 0)
where D = 1 if the treatment is received and D = 0 if the treatment is not received. The standard evaluation problem is that E (yij/ D = 0) is not observed. Instead, we seek to construct the counterfactual state of what would have happened in PNPM locations had the project not occurred. If we can find a control group of sub–districts ycj with identical characteristics to our treatment group yj, where c indicates the control group, we can replicate the unobserved state E (yij / D = 0) by substituting E (yc
ij / D = 0) so that:
(2) E (yij / D = 0) = E (ycij / D = 0)
In practice, finding a control group with identical properties is impossible. A standard solution would be to randomize assignment of D, which would ensure that (2) is satisfied given adequate sample size.
Lacking randomization for PNPM participation, a common approach is to estimate the probability of D using a propensity score matching approach to choose a comparable control group by conditioning selection on a set of observable characteristics. A set of observable covariates X are selected such that the distribution of all covariates in X is the same between selected treatment and control groups, satisfying the condition that conditional on X, outcomes measures for the treatment and control groups are independent of the treatment assignment D:
(3) Pr (D = 1/X, ycij) = Pr (D = 1/X)
As Rosenbaum and Rubin (2003) show, if the true propensity score Pr (D = 1/X) is known for each observation, the condition in (3) is satisfied. In practice, we must estimate Pr (D = 1/X). The standard method is to regress the selected covariates on the treatment indicator variable using a standard probit or logit model and then use a matching process to select observations for the treatment and control groups that best satisfy the condition in (3).
Kecamatan level matching. Since the treatment for PNPM was assigned at the sub–district level and the sampling strategy dictated choosing households within kecamatan, we first conducted propensity score matching at the sub–district to level to select the overall sample. A group of sixty observable covariates were selected from the 2005 PODES census of villages and 2002 SUSENAS conducted by BPS. The covariates consist of sub–district level indicators on infrastructure, demography, economic and geographic conditions, and poverty and education and health index variables constructed from a poverty mapping exercise by BAPPENAS in 2005 as part PNPM Kecamatan selection. For the sample of remaining sub–districts surveyed in the 2002 SUSENAS (see Section A.1 above), we then regress the covariates on the treatment indicator using a logit model. From this regression, we then predict the probability of participation in PNPM, an estimate of Pr (D =1/X). Due to the limited number of sub–districts available for the control group and the need to meet sample size requirements, we conducted the matching using the nearest neighbor without replacement method to select 150 pairs of matched treatment and control sub–district. Use of this method can be problematic in that poor matches can results. However, as Rubin (2000) notes, this is a not problem as long as matched covariates have equivalent or balanced distribution between treatment and control groups. All covariates were tested using simple comparison means tests and Kolmogorov–Smirnov and Hotelling tests of equality of distributions and found no significant differences for all tests among all covariates indicating that the sub–district sample is well–balanced and satisfies the condition in (3) that treatment assignment is independent of outcomes conditioned on selected covariates. The results of these tests are shown in Table A1.2 below. In addition, tests for equality of distribution for the change in real per capita consumption and poverty incidence were conducted using the 2002 SUSENAS data and the 2007 SEDAP baseline survey data and demonstrated a similar lack of significant difference, indicating that there was
43 Results available upon request.
Bali 10
Banten 14
The Special District of Yogyakarta 2
Jambi 15
West Java 34
Central Java 34
East Java 64
South Kalimantan 27
Lampung 28
West Nusa Tenggara 4
Riau 21
South Sulawesi 61
Southeast Sulawesi 12
North Sulawesi 13
West Sumatra 31
South Sumatra 21
North Sumatra 65
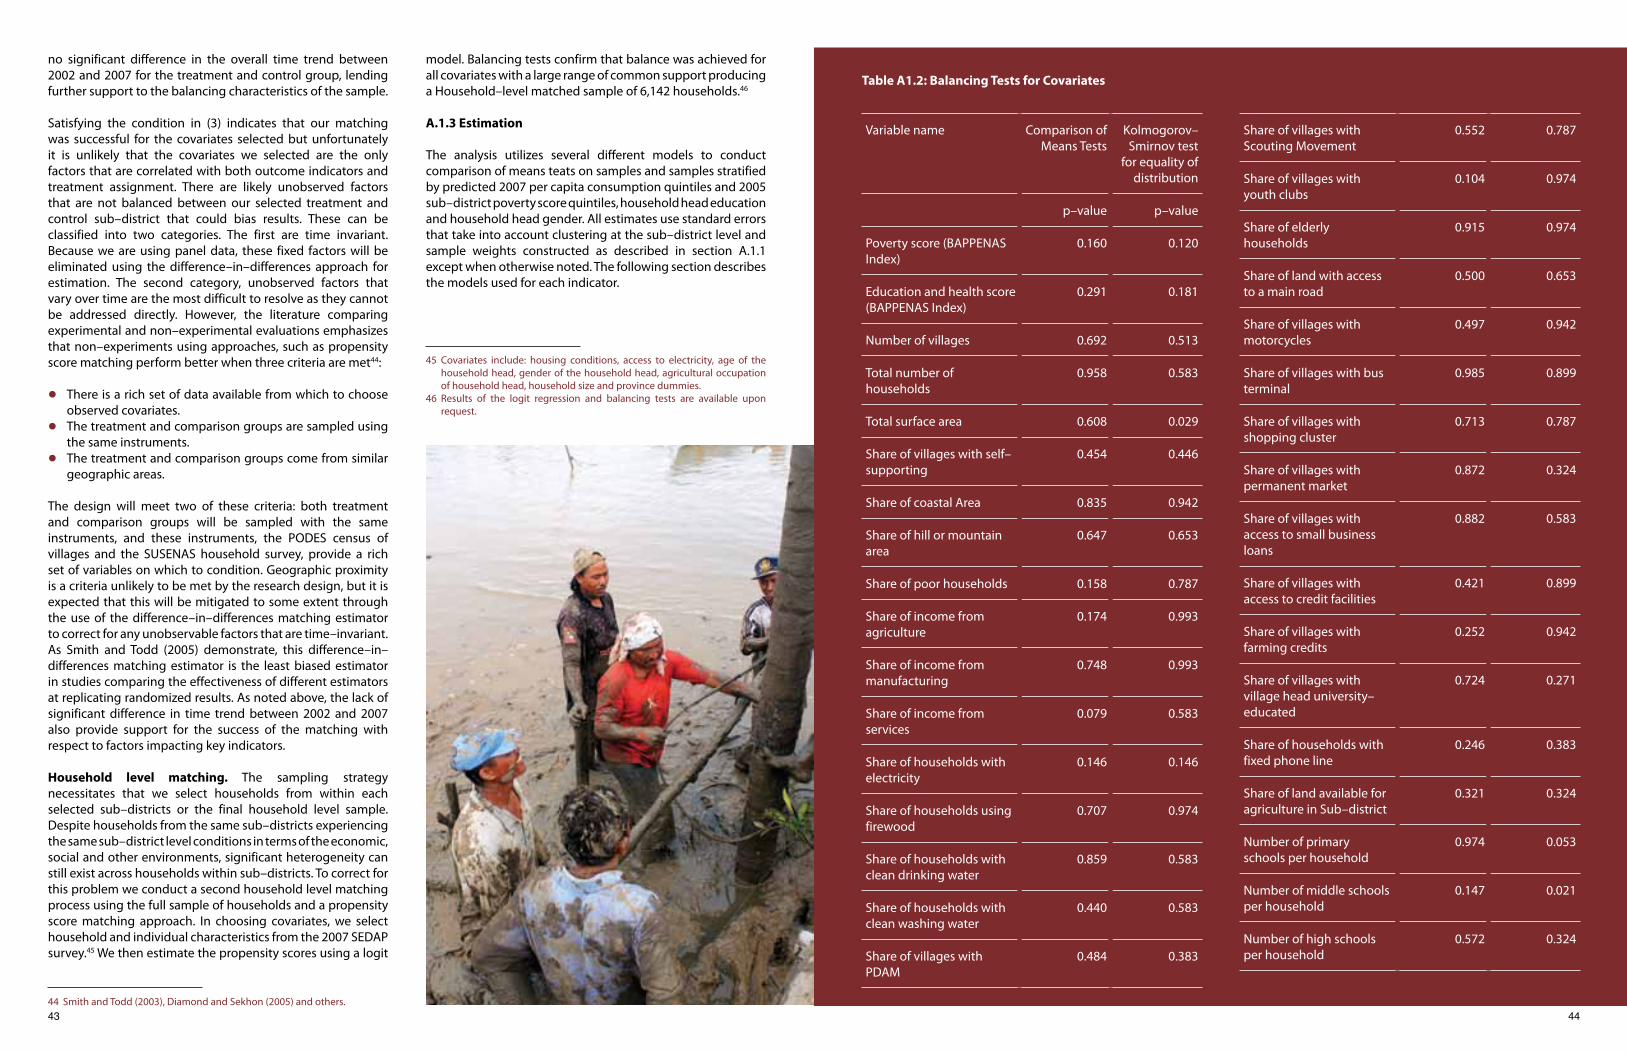
43 44
no significant difference in the overall time trend between 2002 and 2007 for the treatment and control group, lending further support to the balancing characteristics of the sample.
Satisfying the condition in (3) indicates that our matching was successful for the covariates selected but unfortunately it is unlikely that the covariates we selected are the only factors that are correlated with both outcome indicators and treatment assignment. There are likely unobserved factors that are not balanced between our selected treatment and control sub–district that could bias results. These can be classified into two categories. The first are time invariant. Because we are using panel data, these fixed factors will be eliminated using the difference–in–differences approach for estimation. The second category, unobserved factors that vary over time are the most difficult to resolve as they cannot be addressed directly. However, the literature comparing experimental and non–experimental evaluations emphasizes that non–experiments using approaches, such as propensity score matching perform better when three criteria are met44:
• There is a rich set of data available from which to choose observed covariates.
• The treatment and comparison groups are sampled using the same instruments.
• The treatment and comparison groups come from similar geographic areas.
The design will meet two of these criteria: both treatment and comparison groups will be sampled with the same instruments, and these instruments, the PODES census of villages and the SUSENAS household survey, provide a rich set of variables on which to condition. Geographic proximity is a criteria unlikely to be met by the research design, but it is expected that this will be mitigated to some extent through the use of the difference–in–differences matching estimator to correct for any unobservable factors that are time–invariant. As Smith and Todd (2005) demonstrate, this difference–in–differences matching estimator is the least biased estimator in studies comparing the effectiveness of different estimators at replicating randomized results. As noted above, the lack of significant difference in time trend between 2002 and 2007 also provide support for the success of the matching with respect to factors impacting key indicators.
Household level matching. The sampling strategy necessitates that we select households from within each selected sub–districts or the final household level sample. Despite households from the same sub–districts experiencing the same sub–district level conditions in terms of the economic, social and other environments, significant heterogeneity can still exist across households within sub–districts. To correct for this problem we conduct a second household level matching process using the full sample of households and a propensity score matching approach. In choosing covariates, we select household and individual characteristics from the 2007 SEDAP survey.45 We then estimate the propensity scores using a logit
model. Balancing tests confirm that balance was achieved for all covariates with a large range of common support producing a Household–level matched sample of 6,142 households.46
A.1.3 Estimation The analysis utilizes several different models to conduct comparison of means teats on samples and samples stratified by predicted 2007 per capita consumption quintiles and 2005 sub–district poverty score quintiles, household head education and household head gender. All estimates use standard errors that take into account clustering at the sub–district level and sample weights constructed as described in section A.1.1 except when otherwise noted. The following section describes the models used for each indicator.
44 Smith and Todd (2003), Diamond and Sekhon (2005) and others.
45 Covariates include: housing conditions, access to electricity, age of the household head, gender of the household head, agricultural occupation of household head, household size and province dummies.
46 Results of the logit regression and balancing tests are available upon request.
Table A1.2: Balancing Tests for Covariates
Variable name Comparison of Means Tests
Kolmogorov–Smirnov test
for equality of distribution
p–value p–value
Poverty score (BAPPENAS Index)
0.160 0.120
Education and health score (BAPPENAS Index)
0.291 0.181
Number of villages 0.692 0.513
Total number of households
0.958 0.583
Total surface area 0.608 0.029
Share of villages with self–supporting
0.454 0.446
Share of coastal Area 0.835 0.942
Share of hill or mountain area
0.647 0.653
Share of poor households 0.158 0.787
Share of income from agriculture
0.174 0.993
Share of income from manufacturing
0.748 0.993
Share of income from services
0.079 0.583
Share of households with electricity
0.146 0.146
Share of households using firewood
0.707 0.974
Share of households with clean drinking water
0.859 0.583
Share of households with clean washing water
0.440 0.583
Share of villages with PDAM
0.484 0.383
Share of villages with Scouting Movement
0.552 0.787
Share of villages with youth clubs
0.104 0.974
Share of elderly households
0.915 0.974
Share of land with access to a main road
0.500 0.653
Share of villages with motorcycles
0.497 0.942
Share of villages with bus terminal
0.985 0.899
Share of villages with shopping cluster
0.713 0.787
Share of villages with permanent market
0.872 0.324
Share of villages with access to small business loans
0.882 0.583
Share of villages with access to credit facilities
0.421 0.899
Share of villages with farming credits
0.252 0.942
Share of villages with village head university–educated
0.724 0.271
Share of households with fixed phone line
0.246 0.383
Share of land available for agriculture in Sub–district
0.321 0.324
Number of primary schools per household
0.974 0.053
Number of middle schools per household
0.147 0.021
Number of high schools per household
0.572 0.324
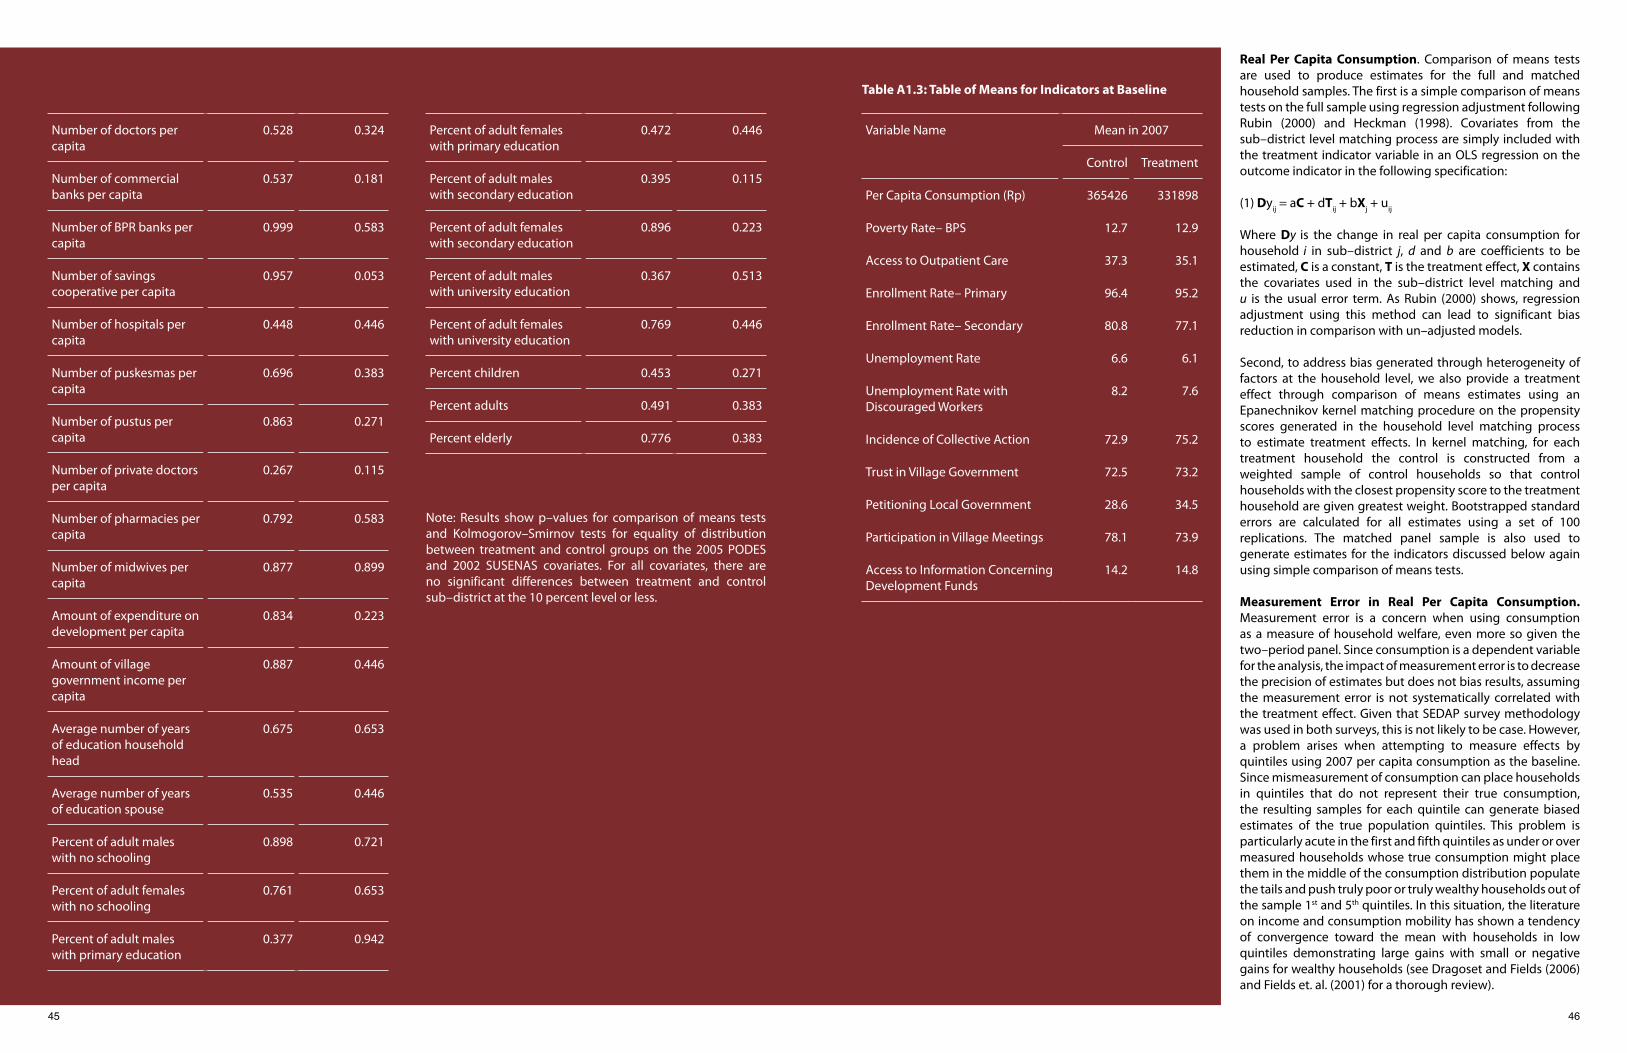
45 46
Note: Results show p–values for comparison of means tests and Kolmogorov–Smirnov tests for equality of distribution between treatment and control groups on the 2005 PODES and 2002 SUSENAS covariates. For all covariates, there are no significant differences between treatment and control sub–district at the 10 percent level or less.
Real Per Capita Consumption. Comparison of means tests are used to produce estimates for the full and matched household samples. The first is a simple comparison of means tests on the full sample using regression adjustment following Rubin (2000) and Heckman (1998). Covariates from the sub–district level matching process are simply included with the treatment indicator variable in an OLS regression on the outcome indicator in the following specification:
(1) Dyij = aC + dTij + bXj + uij
Where Dy is the change in real per capita consumption for household i in sub–district j, d and b are coefficients to be estimated, C is a constant, T is the treatment effect, X contains the covariates used in the sub–district level matching and u is the usual error term. As Rubin (2000) shows, regression adjustment using this method can lead to significant bias reduction in comparison with un–adjusted models.
Second, to address bias generated through heterogeneity of factors at the household level, we also provide a treatment effect through comparison of means estimates using an Epanechnikov kernel matching procedure on the propensity scores generated in the household level matching process to estimate treatment effects. In kernel matching, for each treatment household the control is constructed from a weighted sample of control households so that control households with the closest propensity score to the treatment household are given greatest weight. Bootstrapped standard errors are calculated for all estimates using a set of 100 replications. The matched panel sample is also used to generate estimates for the indicators discussed below again using simple comparison of means tests.
Measurement Error in Real Per Capita Consumption. Measurement error is a concern when using consumption as a measure of household welfare, even more so given the two–period panel. Since consumption is a dependent variable for the analysis, the impact of measurement error is to decrease the precision of estimates but does not bias results, assuming the measurement error is not systematically correlated with the treatment effect. Given that SEDAP survey methodology was used in both surveys, this is not likely to be case. However, a problem arises when attempting to measure effects by quintiles using 2007 per capita consumption as the baseline. Since mismeasurement of consumption can place households in quintiles that do not represent their true consumption, the resulting samples for each quintile can generate biased estimates of the true population quintiles. This problem is particularly acute in the first and fifth quintiles as under or over measured households whose true consumption might place them in the middle of the consumption distribution populate the tails and push truly poor or truly wealthy households out of the sample 1st and 5th quintiles. In this situation, the literature on income and consumption mobility has shown a tendency of convergence toward the mean with households in low quintiles demonstrating large gains with small or negative gains for wealthy households (see Dragoset and Fields (2006) and Fields et. al. (2001) for a thorough review).
Table A1.3: Table of Means for Indicators at Baseline
Number of doctors per capita
0.528 0.324
Number of commercial banks per capita
0.537 0.181
Number of BPR banks per capita
0.999 0.583
Number of savings cooperative per capita
0.957 0.053
Number of hospitals per capita
0.448 0.446
Number of puskesmas per capita
0.696 0.383
Number of pustus per capita
0.863 0.271
Number of private doctors per capita
0.267 0.115
Number of pharmacies per capita
0.792 0.583
Number of midwives per capita
0.877 0.899
Amount of expenditure on development per capita
0.834 0.223
Amount of village government income per capita
0.887 0.446
Average number of years of education household head
0.675 0.653
Average number of years of education spouse
0.535 0.446
Percent of adult males with no schooling
0.898 0.721
Percent of adult females with no schooling
0.761 0.653
Percent of adult males with primary education
0.377 0.942
Percent of adult females with primary education
0.472 0.446
Percent of adult males with secondary education
0.395 0.115
Percent of adult females with secondary education
0.896 0.223
Percent of adult males with university education
0.367 0.513
Percent of adult females with university education
0.769 0.446
Percent children 0.453 0.271
Percent adults 0.491 0.383
Percent elderly 0.776 0.383
Variable Name Mean in 2007
Control Treatment
Per Capita Consumption (Rp) 365426 331898
Poverty Rate– BPS 12.7 12.9
Access to Outpatient Care 37.3 35.1
Enrollment Rate– Primary 96.4 95.2
Enrollment Rate– Secondary 80.8 77.1
Unemployment Rate 6.6 6.1
Unemployment Rate with Discouraged Workers
8.2 7.6
Incidence of Collective Action 72.9 75.2
Trust in Village Government 72.5 73.2
Petitioning Local Government 28.6 34.5
Participation in Village Meetings 78.1 73.9
Access to Information Concerning Development Funds
14.2 14.8
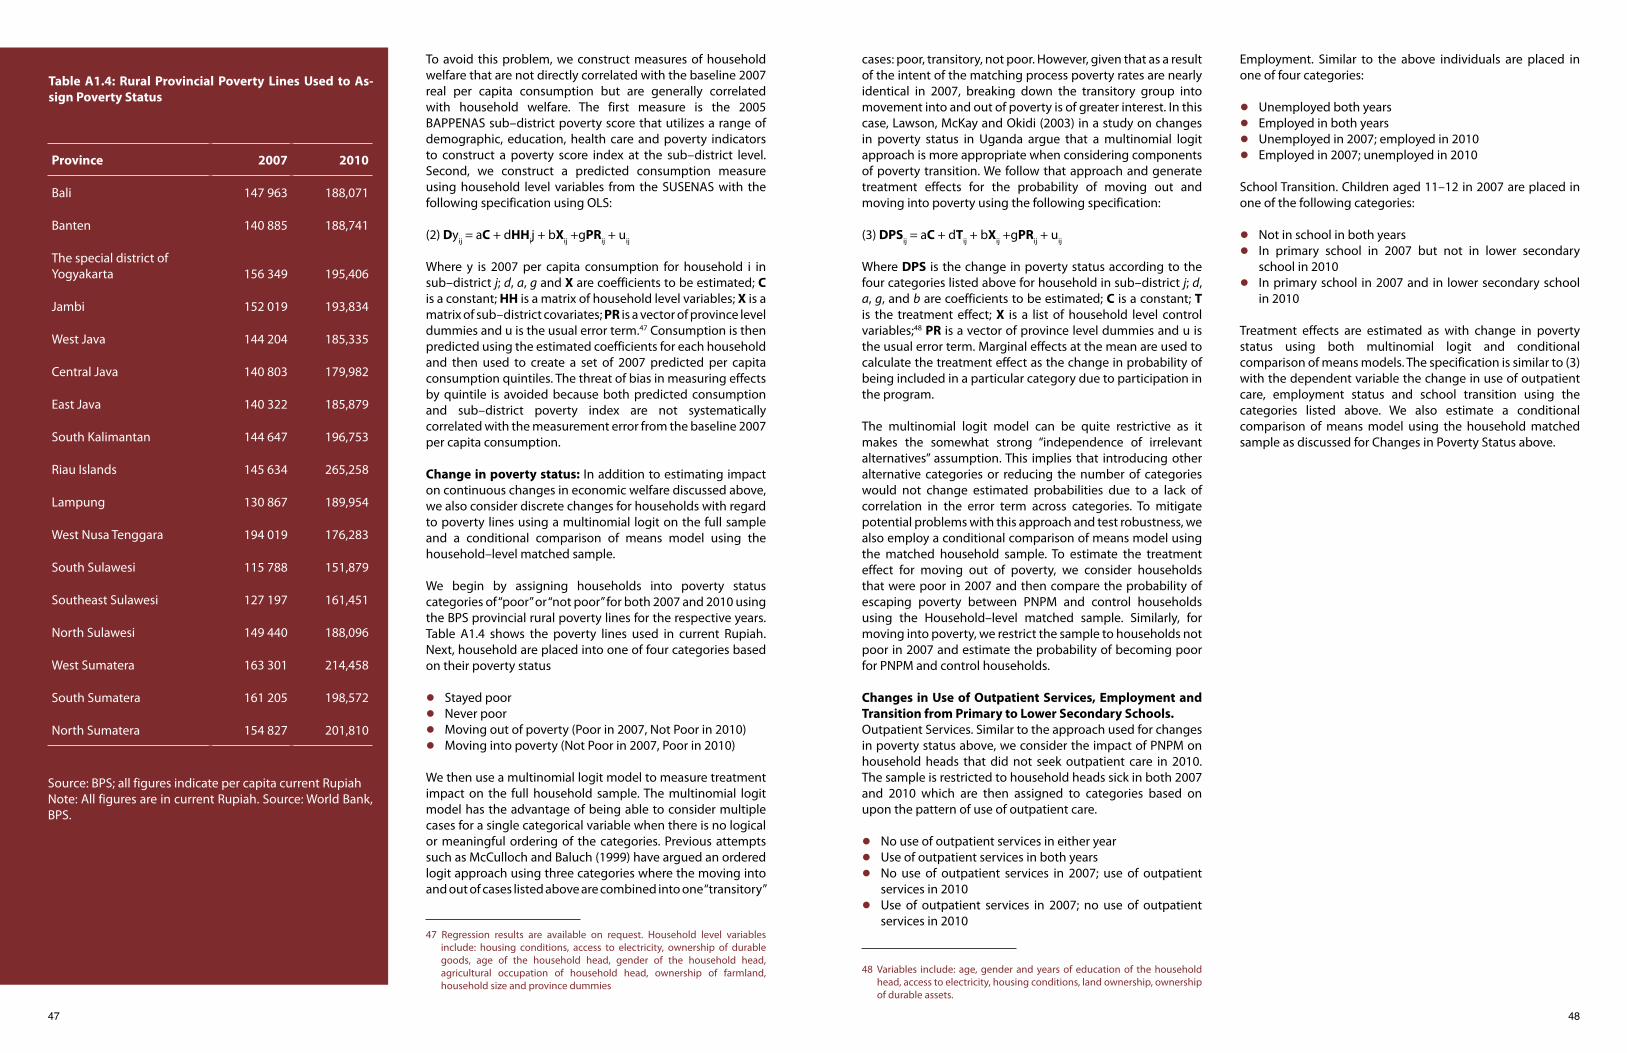
47 48
Table A1.4: Rural Provincial Poverty Lines Used to As-sign Poverty Status
Source: BPS; all figures indicate per capita current Rupiah Note: All figures are in current Rupiah. Source: World Bank, BPS.
To avoid this problem, we construct measures of household welfare that are not directly correlated with the baseline 2007 real per capita consumption but are generally correlated with household welfare. The first measure is the 2005 BAPPENAS sub–district poverty score that utilizes a range of demographic, education, health care and poverty indicators to construct a poverty score index at the sub–district level. Second, we construct a predicted consumption measure using household level variables from the SUSENAS with the following specification using OLS:
(2) Dyij = aC + dHHij + bXij +gPRij + uij
Where y is 2007 per capita consumption for household i in sub–district j; d, a, g and X are coefficients to be estimated; C is a constant; HH is a matrix of household level variables; X is a matrix of sub–district covariates; PR is a vector of province level dummies and u is the usual error term.47 Consumption is then predicted using the estimated coefficients for each household and then used to create a set of 2007 predicted per capita consumption quintiles. The threat of bias in measuring effects by quintile is avoided because both predicted consumption and sub–district poverty index are not systematically correlated with the measurement error from the baseline 2007 per capita consumption.
Change in poverty status: In addition to estimating impact on continuous changes in economic welfare discussed above, we also consider discrete changes for households with regard to poverty lines using a multinomial logit on the full sample and a conditional comparison of means model using the household–level matched sample.
We begin by assigning households into poverty status categories of “poor” or “not poor” for both 2007 and 2010 using the BPS provincial rural poverty lines for the respective years. Table A1.4 shows the poverty lines used in current Rupiah. Next, household are placed into one of four categories based on their poverty status
• Stayed poor • Never poor •Moving out of poverty (Poor in 2007, Not Poor in 2010)•Moving into poverty (Not Poor in 2007, Poor in 2010)
We then use a multinomial logit model to measure treatment impact on the full household sample. The multinomial logit model has the advantage of being able to consider multiple cases for a single categorical variable when there is no logical or meaningful ordering of the categories. Previous attempts such as McCulloch and Baluch (1999) have argued an ordered logit approach using three categories where the moving into and out of cases listed above are combined into one “transitory”
cases: poor, transitory, not poor. However, given that as a result of the intent of the matching process poverty rates are nearly identical in 2007, breaking down the transitory group into movement into and out of poverty is of greater interest. In this case, Lawson, McKay and Okidi (2003) in a study on changes in poverty status in Uganda argue that a multinomial logit approach is more appropriate when considering components of poverty transition. We follow that approach and generate treatment effects for the probability of moving out and moving into poverty using the following specification:
(3) DPSij = aC + dTij + bXij +gPRij + uij
Where DPS is the change in poverty status according to the four categories listed above for household in sub–district j; d, a, g, and b are coefficients to be estimated; C is a constant; T is the treatment effect; X is a list of household level control variables;48 PR is a vector of province level dummies and u is the usual error term. Marginal effects at the mean are used to calculate the treatment effect as the change in probability of being included in a particular category due to participation in the program.
The multinomial logit model can be quite restrictive as it makes the somewhat strong “independence of irrelevant alternatives” assumption. This implies that introducing other alternative categories or reducing the number of categories would not change estimated probabilities due to a lack of correlation in the error term across categories. To mitigate potential problems with this approach and test robustness, we also employ a conditional comparison of means model using the matched household sample. To estimate the treatment effect for moving out of poverty, we consider households that were poor in 2007 and then compare the probability of escaping poverty between PNPM and control households using the Household–level matched sample. Similarly, for moving into poverty, we restrict the sample to households not poor in 2007 and estimate the probability of becoming poor for PNPM and control households.
Changes in Use of Outpatient Services, Employment and Transition from Primary to Lower Secondary Schools. Outpatient Services. Similar to the approach used for changes in poverty status above, we consider the impact of PNPM on household heads that did not seek outpatient care in 2010. The sample is restricted to household heads sick in both 2007 and 2010 which are then assigned to categories based on upon the pattern of use of outpatient care.
• No use of outpatient services in either year• Use of outpatient services in both years• No use of outpatient services in 2007; use of outpatient
services in 2010• Use of outpatient services in 2007; no use of outpatient
services in 2010
Employment. Similar to the above individuals are placed in one of four categories:
• Unemployed both years• Employed in both years• Unemployed in 2007; employed in 2010• Employed in 2007; unemployed in 2010
School Transition. Children aged 11–12 in 2007 are placed in one of the following categories:
• Not in school in both years• In primary school in 2007 but not in lower secondary
school in 2010 • In primary school in 2007 and in lower secondary school
in 2010
Treatment effects are estimated as with change in poverty status using both multinomial logit and conditional comparison of means models. The specification is similar to (3) with the dependent variable the change in use of outpatient care, employment status and school transition using the categories listed above. We also estimate a conditional comparison of means model using the household matched sample as discussed for Changes in Poverty Status above.
47 Regression results are available on request. Household level variables include: housing conditions, access to electricity, ownership of durable goods, age of the household head, gender of the household head, agricultural occupation of household head, ownership of farmland, household size and province dummies
48 Variables include: age, gender and years of education of the household head, access to electricity, housing conditions, land ownership, ownership of durable assets.
Province 2007 2010
Bali 147 963 188,071
Banten 140 885 188,741
The special district of Yogyakarta 156 349 195,406
Jambi 152 019 193,834
West Java 144 204 185,335
Central Java 140 803 179,982
East Java 140 322 185,879
South Kalimantan 144 647 196,753
Riau Islands 145 634 265,258
Lampung 130 867 189,954
West Nusa Tenggara 194 019 176,283
South Sulawesi 115 788 151,879
Southeast Sulawesi 127 197 161,451
North Sulawesi 149 440 188,096
West Sumatera 163 301 214,458
South Sumatera 161 205 198,572
North Sumatera 154 827 201,810
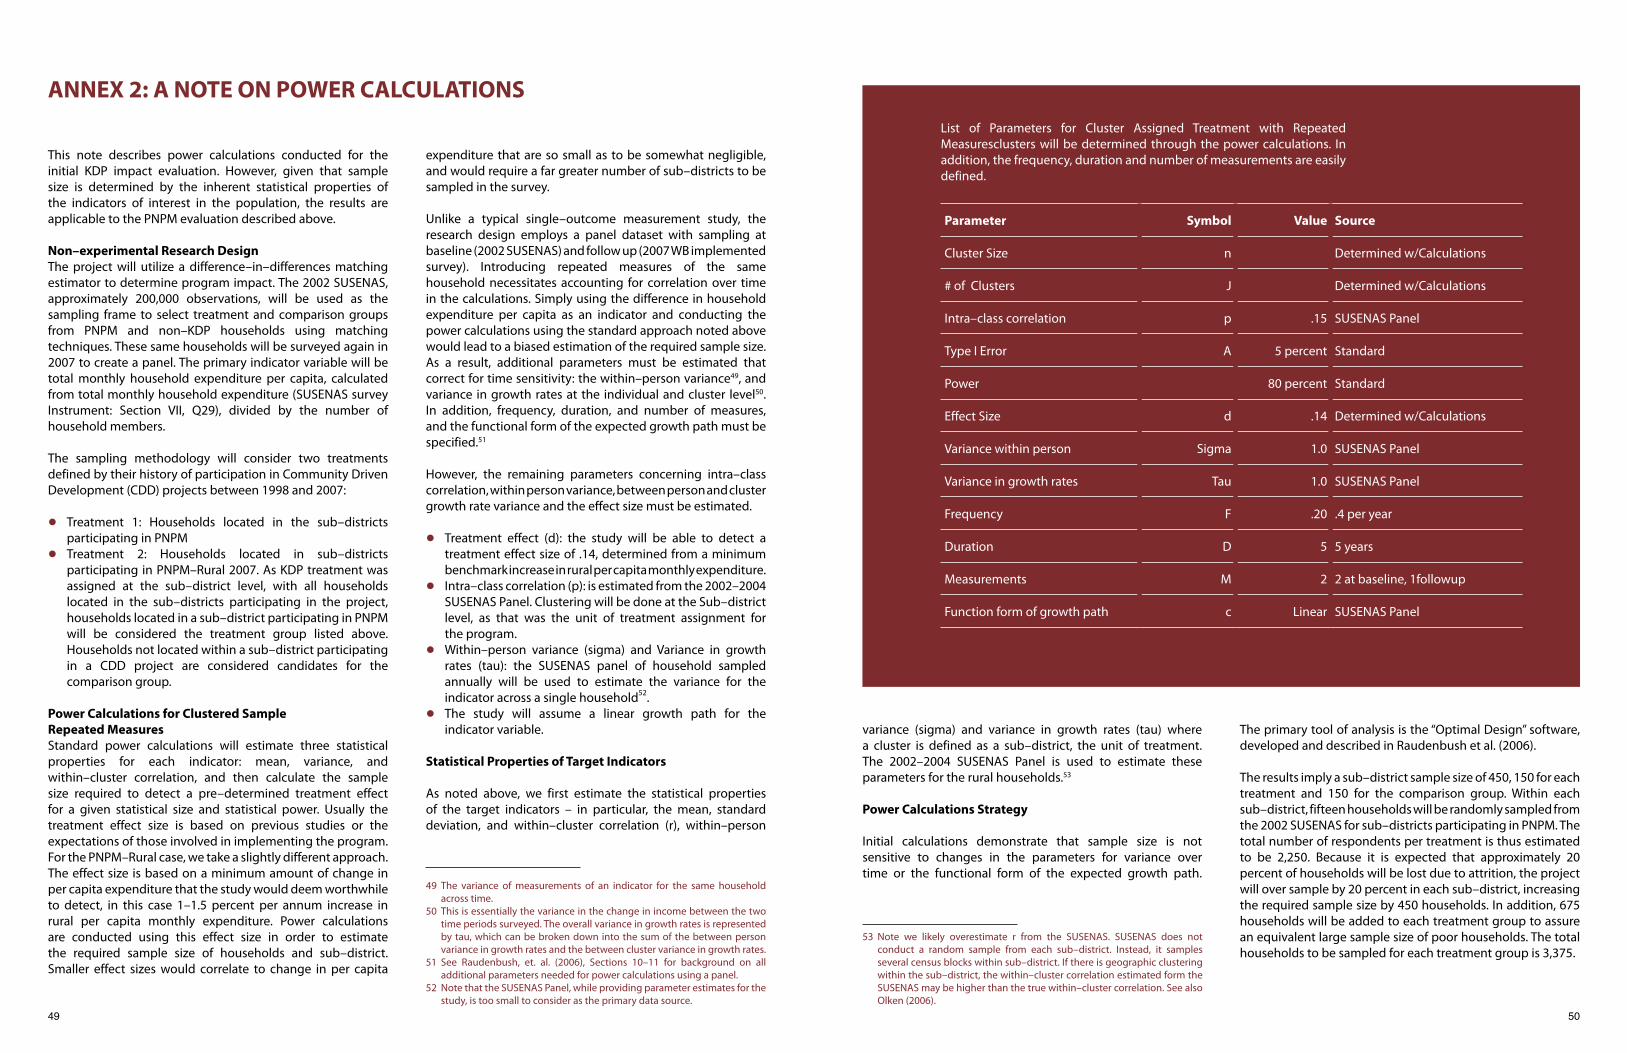
49 50
ANNEX 2: A NOTE ON POWER CALCULATIONS
This note describes power calculations conducted for the initial KDP impact evaluation. However, given that sample size is determined by the inherent statistical properties of the indicators of interest in the population, the results are applicable to the PNPM evaluation described above.
Non–experimental Research DesignThe project will utilize a difference–in–differences matching estimator to determine program impact. The 2002 SUSENAS, approximately 200,000 observations, will be used as the sampling frame to select treatment and comparison groups from PNPM and non–KDP households using matching techniques. These same households will be surveyed again in 2007 to create a panel. The primary indicator variable will be total monthly household expenditure per capita, calculated from total monthly household expenditure (SUSENAS survey Instrument: Section VII, Q29), divided by the number of household members.
The sampling methodology will consider two treatments defined by their history of participation in Community Driven Development (CDD) projects between 1998 and 2007:
• Treatment 1: Households located in the sub–districts participating in PNPM
• Treatment 2: Households located in sub–districts participating in PNPM–Rural 2007. As KDP treatment was assigned at the sub–district level, with all households located in the sub–districts participating in the project, households located in a sub–district participating in PNPM will be considered the treatment group listed above. Households not located within a sub–district participating in a CDD project are considered candidates for the comparison group.
Power Calculations for Clustered Sample Repeated MeasuresStandard power calculations will estimate three statistical properties for each indicator: mean, variance, and within–cluster correlation, and then calculate the sample size required to detect a pre–determined treatment effect for a given statistical size and statistical power. Usually the treatment effect size is based on previous studies or the expectations of those involved in implementing the program. For the PNPM–Rural case, we take a slightly different approach. The effect size is based on a minimum amount of change in per capita expenditure that the study would deem worthwhile to detect, in this case 1–1.5 percent per annum increase in rural per capita monthly expenditure. Power calculations are conducted using this effect size in order to estimate the required sample size of households and sub–district. Smaller effect sizes would correlate to change in per capita
expenditure that are so small as to be somewhat negligible, and would require a far greater number of sub–districts to be sampled in the survey.
Unlike a typical single–outcome measurement study, the research design employs a panel dataset with sampling at baseline (2002 SUSENAS) and follow up (2007 WB implemented survey). Introducing repeated measures of the same household necessitates accounting for correlation over time in the calculations. Simply using the difference in household expenditure per capita as an indicator and conducting the power calculations using the standard approach noted above would lead to a biased estimation of the required sample size. As a result, additional parameters must be estimated that correct for time sensitivity: the within–person variance49, and variance in growth rates at the individual and cluster level50. In addition, frequency, duration, and number of measures, and the functional form of the expected growth path must be specified.51
However, the remaining parameters concerning intra–class correlation, within person variance, between person and cluster growth rate variance and the effect size must be estimated.Treatment effect (d): the study• Treatment effect (d): the study will be able to detect a
treatment effect size of .14, determined from a minimum benchmark increase in rural per capita monthly expenditure.
• Intra–class correlation (p): is estimated from the 2002–2004 SUSENAS Panel. Clustering will be done at the Sub–district level, as that was the unit of treatment assignment for the program.
•Within–person variance (sigma) and Variance in growth rates (tau): the SUSENAS panel of household sampled annually will be used to estimate the variance for the indicator across a single household52.
• The study will assume a linear growth path for the indicator variable.
Statistical Properties of Target Indicators
As noted above, we first estimate the statistical properties of the target indicators – in particular, the mean, standard deviation, and within–cluster correlation (r), within–person
variance (sigma) and variance in growth rates (tau) where a cluster is defined as a sub–district, the unit of treatment. The 2002–2004 SUSENAS Panel is used to estimate these parameters for the rural households.53
Power Calculations Strategy
Initial calculations demonstrate that sample size is not sensitive to changes in the parameters for variance over time or the functional form of the expected growth path.
The primary tool of analysis is the “Optimal Design” software, developed and described in Raudenbush et al. (2006).
The results imply a sub–district sample size of 450, 150 for each treatment and 150 for the comparison group. Within each sub–district, fifteen households will be randomly sampled from the 2002 SUSENAS for sub–districts participating in PNPM. The total number of respondents per treatment is thus estimated to be 2,250. Because it is expected that approximately 20 percent of households will be lost due to attrition, the project will over sample by 20 percent in each sub–district, increasing the required sample size by 450 households. In addition, 675 households will be added to each treatment group to assure an equivalent large sample size of poor households. The total households to be sampled for each treatment group is 3,375.
List of Parameters for Cluster Assigned Treatment with Repeated Measuresclusters will be determined through the power calculations. In addition, the frequency, duration and number of measurements are easily defined.
49 The variance of measurements of an indicator for the same household across time.
50 This is essentially the variance in the change in income between the two time periods surveyed. The overall variance in growth rates is represented by tau, which can be broken down into the sum of the between person variance in growth rates and the between cluster variance in growth rates.
51 See Raudenbush, et. al. (2006), Sections 10–11 for background on all additional parameters needed for power calculations using a panel.
52 Note that the SUSENAS Panel, while providing parameter estimates for the study, is too small to consider as the primary data source.
53 Note we likely overestimate r from the SUSENAS. SUSENAS does not conduct a random sample from each sub–district. Instead, it samples several census blocks within sub–district. If there is geographic clustering within the sub–district, the within–cluster correlation estimated form the SUSENAS may be higher than the true within–cluster correlation. See also Olken (2006).
Parameter Symbol Value Source
Cluster Size n Determined w/Calculations
# of Clusters J Determined w/Calculations
Intra–class correlation p .15 SUSENAS Panel
Type I Error A 5 percent Standard
Power 80 percent Standard
Effect Size d .14 Determined w/Calculations
Variance within person Sigma 1.0 SUSENAS Panel
Variance in growth rates Tau 1.0 SUSENAS Panel
Frequency F .20 .4 per year
Duration D 5 5 years
Measurements M 2 2 at baseline, 1followup
Function form of growth path c Linear SUSENAS Panel
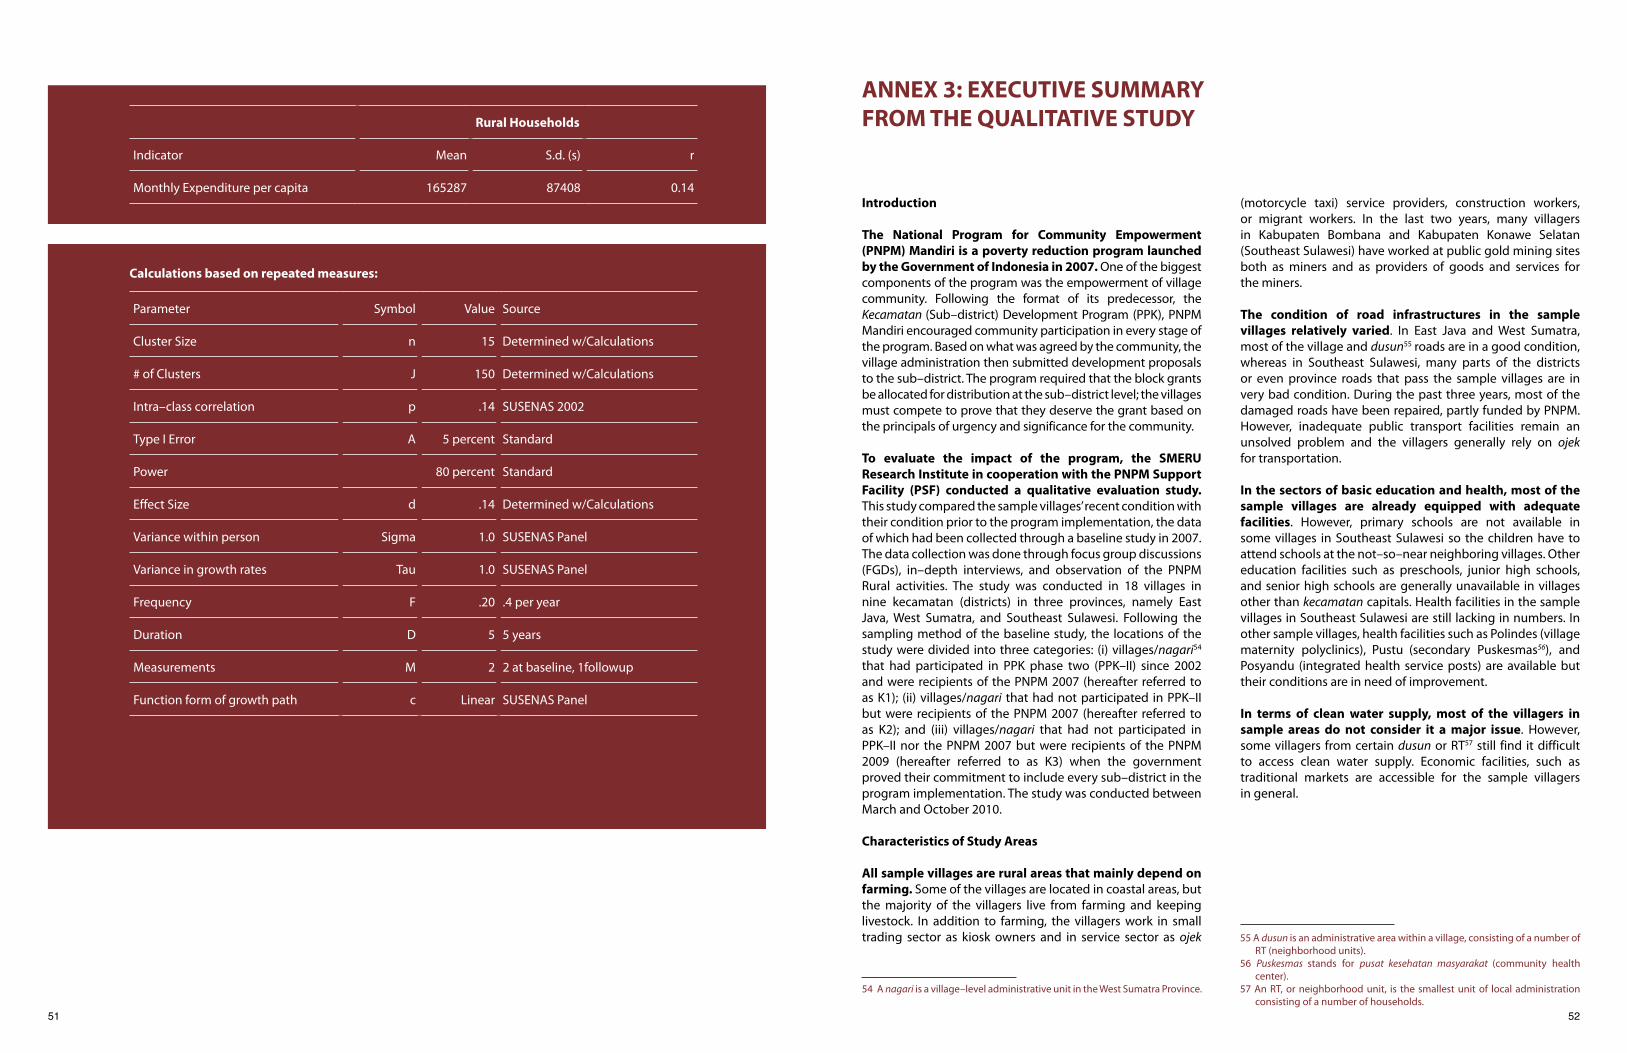
51 52
Calculations based on repeated measures:
ANNEX 3: EXECUTIVE SUMMARYFROM THE QUALITATIVE STUDY
Introduction
The National Program for Community Empowerment (PNPM) Mandiri is a poverty reduction program launched by the Government of Indonesia in 2007. One of the biggest components of the program was the empowerment of village community. Following the format of its predecessor, the Kecamatan (Sub–district) Development Program (PPK), PNPM Mandiri encouraged community participation in every stage of the program. Based on what was agreed by the community, the village administration then submitted development proposals to the sub–district. The program required that the block grants be allocated for distribution at the sub–district level; the villages must compete to prove that they deserve the grant based on the principals of urgency and significance for the community.
To evaluate the impact of the program, the SMERU Research Institute in cooperation with the PNPM Support Facility (PSF) conducted a qualitative evaluation study. This study compared the sample villages’ recent condition with their condition prior to the program implementation, the data of which had been collected through a baseline study in 2007. The data collection was done through focus group discussions (FGDs), in–depth interviews, and observation of the PNPM Rural activities. The study was conducted in 18 villages in nine kecamatan (districts) in three provinces, namely East Java, West Sumatra, and Southeast Sulawesi. Following the sampling method of the baseline study, the locations of the study were divided into three categories: (i) villages/nagari54 that had participated in PPK phase two (PPK–II) since 2002 and were recipients of the PNPM 2007 (hereafter referred to as K1); (ii) villages/nagari that had not participated in PPK–II but were recipients of the PNPM 2007 (hereafter referred to as K2); and (iii) villages/nagari that had not participated in PPK–II nor the PNPM 2007 but were recipients of the PNPM 2009 (hereafter referred to as K3) when the government proved their commitment to include every sub–district in the program implementation. The study was conducted between March and October 2010.
Characteristics of Study Areas
All sample villages are rural areas that mainly depend on farming. Some of the villages are located in coastal areas, but the majority of the villagers live from farming and keeping livestock. In addition to farming, the villagers work in small trading sector as kiosk owners and in service sector as ojek
(motorcycle taxi) service providers, construction workers, or migrant workers. In the last two years, many villagers in Kabupaten Bombana and Kabupaten Konawe Selatan (Southeast Sulawesi) have worked at public gold mining sites both as miners and as providers of goods and services for the miners.
The condition of road infrastructures in the sample villages relatively varied. In East Java and West Sumatra, most of the village and dusun55 roads are in a good condition, whereas in Southeast Sulawesi, many parts of the districts or even province roads that pass the sample villages are in very bad condition. During the past three years, most of the damaged roads have been repaired, partly funded by PNPM. However, inadequate public transport facilities remain an unsolved problem and the villagers generally rely on ojek for transportation.
In the sectors of basic education and health, most of the sample villages are already equipped with adequate facilities. However, primary schools are not available in some villages in Southeast Sulawesi so the children have to attend schools at the not–so–near neighboring villages. Other education facilities such as preschools, junior high schools, and senior high schools are generally unavailable in villages other than kecamatan capitals. Health facilities in the sample villages in Southeast Sulawesi are still lacking in numbers. In other sample villages, health facilities such as Polindes (village maternity polyclinics), Pustu (secondary Puskesmas56), and Posyandu (integrated health service posts) are available but their conditions are in need of improvement.
In terms of clean water supply, most of the villagers in sample areas do not consider it a major issue. However, some villagers from certain dusun or RT57 still find it difficult to access clean water supply. Economic facilities, such as traditional markets are accessible for the sample villagers in general.
54 A nagari is a village–level administrative unit in the West Sumatra Province.
55 A dusun is an administrative area within a village, consisting of a number of RT (neighborhood units).
56 Puskesmas stands for pusat kesehatan masyarakat (community health center).
57 An RT, or neighborhood unit, is the smallest unit of local administration consisting of a number of households.
Rural Households
Indicator Mean S.d. (s) r
Monthly Expenditure per capita 165287 87408 0.14
Parameter Symbol Value Source
Cluster Size n 15 Determined w/Calculations
# of Clusters J 150 Determined w/Calculations
Intra–class correlation p .14 SUSENAS 2002
Type I Error A 5 percent Standard
Power 80 percent Standard
Effect Size d .14 Determined w/Calculations
Variance within person Sigma 1.0 SUSENAS Panel
Variance in growth rates Tau 1.0 SUSENAS Panel
Frequency F .20 .4 per year
Duration D 5 5 years
Measurements M 2 2 at baseline, 1followup
Function form of growth path c Linear SUSENAS Panel
53 54
Main Findings
1. Implementation of PNPM Rural
Almost all sample villages chose infrastructure projects for the open menu program category. Only one village (in Dharmasraya) submitted proposal of non–infrastructure activity—training on developing home industries. Infrastructure projects constructed were roads, bridges, irrigation systems, waterways, school buildings, and posyandu. The villages chose infrastructure projects because (i) there is not adequate number of infrastructures at the study area; (ii) PNPM was regarded as a program for general public; (iii) they wanted to cushion the perceived negative impact of targeted programs such as the Direct Cash Transfer (BLT), Rice for the Poor (Raskin), Household Conditional Cash Transfer (PKH), and Health Insurance for the Poor (Jamkesmas); (iv) the bias towards elite and nonpoor villagers opinions during the decision making process.
The Female Savings and Loan (SPP) program is considered greatly beneficial because it has (i) developed the recipients’ businesses, (ii) improved households’ financial capacity, and (iii) replaced loan sharks. The recipients used the program fund to develop their old business and to create new business. The program implementers required that recipients already have their own business. A small portion of the program fund was used for households’ urgent needs. Especially in Ngawi, SPP has reduced the villagers’ dependency on loan sharks since the program offered competitive interest rates and simple procedures for those who have already had their own business.
There are cases where PNPM implementers limited the poor’s access to the SPP program by imposing strict requirements for fear that the poor would not be able to repay the loan. There were also cases in which certain people cheated to get the fund by including names of the poor on the list of people who submitted the program proposal without their consent. The fund would then be used by the cheating non–poor for their own benefit.
The SPP fund distribution was often considered by most of the program implementers in the villages and the village apparatus as a pre–requirement to get the open menu program. Therefore, a lot of community members did whatever they could to get the fund, including by means of deceptions. For example, many business groups applying for the SPP loan were instantly established only to get the fund. In many areas, names of the poor were falsely included on the list of the fund recipients; but when the money was disbursed, it was distributed among the non–poor. This is due to misinterpretation of SPP as prerequisite to get open menu program. Hence program implementers and villagers “collude” to make their village entitled to SPP in order to ensure they get the open menu fund. They gave the loan to non–poor out of fear that the poor cannot pay back the loan and thus jeoperdize the village’s chance to get open menu fund.For
them, this misuse of name is justifiable as long as there is no case of non–performing loan. The Bank is taking this seriously and is now conducting mission to improve the SPP practice. However, in one village in East Java, the community leaders deliberately refused to get the SPP fund for fear that they would not be able to repay the loan; consequently, they did not get the open menu program.
Participation is still high in PNPM forum, however, the villagers’ participation in the decision making of the open menu program and the SPP was often instrumental, only to fulfill the program’s formal requirement. The increasing number of villagers present at PNPM meetings did not fully alter the village elites domination in the decision making process. The villagers in general, particularly the poor, were still passive participants. The condition was due to some factors: (i) kinship, (ii) patronage system, (iii) the village elite’s reluctance to live by the principles of democracy, and (iv) the elite’s feeling of superiority over their fellow villagers. These factors caused inequality during the decision making process.
Female participation is high in PNPM planning and implementation process, however, the increasing female participation still did not reduce male dominance. Although male dominance was less noticeable in a special forum for female, a meeting held to generate females’ ideas which would propose one suggestion for the SPP and another for the open menu program, it was still critical in influencing the results of the special forum. In some sample villages, the final decisions regarding the suggestions from this forum were made at the village level where the decision makers were the village elites, which are dominantly males.
In sample villages, no serious conflicts have happened during PNPM implementation. However, in a small number of villages, PNPM implementation could and had led to conflicts, such as conflicts of interests between jorong58/dusun, conflicts between the village administrations and the program implementation team (TPK), between the TPK and the community, between the locals and the nonlocals (those who migrated to the villages from other places), and conflicts regarding supplies of goods and services. In addition to lack of knowledge about the program – most likely due to lack of program socialization, lack of coordination with or involvement of relevant people in the program implementation also caused the conflict. In West Sumatra, the area unit for the program implementation was jorong. The nagari leaders felt they were not involved so no one could facilitate communication between jorong. Lack of coordination also created conflicts between the village administration and the TPK, while conflicts between the locals and the nonlocals were triggered by jealousy over economic gap—the villages where the nonlocals live are more developed than those where the locals live—just like what happened in Dharmasraya. With the PNPM requiring the community self–sufficiency, the program funds were often granted to the nonlocals’ villages; the roads there are wider and the villagers had more lands so they were
willing to give up their lands for the program when requested. At the locals’ villages, the roads were narrow and the villagers were not willing to give away their small lands, so they did not get the PNPM infrastructure projects.
The sub–district facilitators considered that the workloads given were not evenly spread within the available resources. Some facilitators had working areas covering 10 villages, while some others had to facilitate more than 50 villages, just like what happened in one sub–district (not a sample sub–district) in Agam District, West Sumatra. Moreover, the facilitators thought that the technical and administrative works, such as monthly report writing, have taken most of their time so they could not make the most of their job as facilitators.
The sub–district facilitators also believed that there should have been special facilitators who were assigned to empower the SPP recipients, because they already had heavy workload and because not all facilitators at the sub–district had the skills related to microcredit empowerment. There were microcredit facilitators at the district level but they were actually more needed at the sub–district level.
2. Governance, Participation, and Representation in Decision Making
In most of the sample villages, although villagers participate in the decision making forum, the decision making process generally involved only the village elites—the village apparatus and the community leaders. These people believed that they already represented the whole community. Other members of the community were usually passive participants when they were present, only listening to and agreeing to what the elites decided. Some villagers, especially the poor, did not attend the meetings because they felt inferior. Other reasons for the villagers’ absence in the meetings were apathy, unfavorable time of the meetings, and not getting any invitation.
During the decision making process at the village level, the females were often represented by formal institutions regarded to speak for women, such as the Family Welfare and Empowerment (PKK) or Bundo Kanduang in West Sumatra. Consequently, women were less represented than men. However, compared to the past (i.e. pre–PPK/PNPM era), more women have attended the decision making process at the village level although it did not really change the fact that men still dominated the process. In addition, most villagers still believe that men are leaders so they, instead of women, should make the decisions.
The system of representation did not function properly, clearly seen from the absence of mechanisms at the RT/dusun level to get the villagers’ aspirations or to disseminate results of the village meetings. No meeting was held to absorb the villagers’ aspirations at RT/dusun level because the village elites claimed to understand the villagers’
problems more than the villagers themselves. The village elites also thought that not all the decisions made and information gathered from the village meetings should be disseminated to the community, especially if money was involved. The fact that the villagers very rarely asked their leaders about any information, decisions, and activities at the village level added to the problem. Information, if any, was usually given to the villagers during informal meetings, such as arisan59 and religious gatherings.
The villagers were generally passive when it came to information on development, except for that on direct aid such as Raskin and BLT. At the village or dusun level, such information was usually given orally from the head of the village to the head of dusun/RW60/RT and then from the head of dusun/RW/RT to the villagers. The information was generally on the program’s activities and implementation. Information regarding activity funds or budget was seldom given to the public. Moreover, the village administration staff generally gave information which was instructive and mobilizing, such as the information on community work.
When there were problems or unsatisfactory results, the villagers generally did not voice their complaints or dissatisfaction to the village administration. They only talked about the problems among themselves or with the community leaders. Only a few villagers were willing and had the courage to tell the village administration. This condition was due to some factors, such as the villagers’ reluctance, fear of the village apparatus, and apathy (because of previous unattended complaints).
In general, the participation model set out by the PNPM did not have any significant impact on the changes in the governance system (participation, transparency, and accountability) at the village level. This was apparent from all villages, regardless of whether they had been beneficiaries of the PNPM since 2002, 2007, or 2009. Only one village claimed to feel the impact of PNPM on other activities. In other villages, participation and transparency applied during the PNPM implementation were regarded as the program’s special features that did not have to be applied on other programs.
The fact that PNPM did not have any significant impact on the government system in general was caused by some factors, namely: (i) the elites dominance and the villagers’ lack of initiative, thus preserving the status quo; (ii) there is no guarantee (incentive) for the village apparatus and the villagers that if they applied the PNPM mechanisms on other programs, they would be given something in return, such as a project; and (iii) the village apparatus and the villagers’ tendency to live by the existing norms. If a program or an activity did not require participation, transparency, and accountability, they would not impose those requirements.
58 A jorong is a dusun–level administrative unit in the West Sumatra Province.
59 An arisan is a social gathering in which the participants operate a savings and loans mechanism.
60 An RW is a unit of local administration consisting of several RT (neighborhood units) within a kelurahan (a village–level administrative area located in an urban center).
55 56
3. Poverty and Its Dynamics
In the majority of the sample villages, the number of poor people was declining although the rates of decline differed among the villages. Factors that have brought about the decline were, among others, (i) new job opportunities such as the gold mine exploitation in Kabupaten Bombana, Southeast Sulawesi; (ii) opportunities to become migrant workers; (iii) regional segregation, creating new economic centers; and (iv) new factories/plantations at the neighborhood. In addition, the decline was also caused by the rising prices of dry land commodities in West Sumatra and sea commodities in Southeast Sulawesi. Other factors were the better rural roads infrastructures, the increase of farming productivity, and government aids. PNPM contributed by facilitating the construction of infrastructures such as roads and bridges for the general sectors and irrigation systems and farm roads for the farming sector.
In contrast, two villages in East Java saw an increase in the number of poor people. This was due to the decrease in sea commodities productivity caused by environment degradation (sea pollution by the industrial wastes) and the decline in labor participation caused by industrial mechanization. In the two villages, they did not make use of PNPM as an instrument to solve the problems.
Villagers usually only connected poverty characteristics with the aspects of asset ownership, daily needs (including education and health) fulfillment, and type of occupation. For example, having minimum assets and no fulltime job was considered as the main reason for someone being poor. This belief has not changed significantly during the period of PNPM implementation in the villages (three to eight years depend of village category).
Poverty dynamics were determined by factors, such as economy, social, public and government institutions, government’s support, and programs’ targeting. Economy factors, such as the rise and fall of prices of farm/sea commodities and prices of daily needs as well as government aids, played the biggest role in most of the cases of poor households whose economy condition has fluctuated for the past eight years.
Groups of poor people that remained poor were generally caused by the absence of skills and capitals to improve their livelihood. It was specifically because (i) there was limited number of alternative job opportunities in addition to their main field work, which is in farming sector; (ii) the poor were generally junior high school graduates and had only traditional skills (as farmers, fishers, or construction workers); (iii) they did not have enough capital, especially cash. Although there had been some aids offering credit for capital, what they really need was financial aid, like direct cash transfer, that they did not have to repay. Other significant factors according to the villagers were: mental attitude that did not feel the need
to develop or felt satisfied easily, unproductiveness due to old age, being economically dependent (widows who do not have job), and the increasing prices of daily needs.
Poverty alleviation programs, especially those with special targets, such as BLT, Raskin, and Jamkesmas, contributed significantly in preventing the poor from getting poorer. The BLT fund, Jamkesmas cards, and Raskin were considered to have helped the poor with their main needs of emergency cash, health expenses, and food. The three programs have also been regarded as the top three government programs which are considered most beneficial for the poor. Unfortunately, the program targeting was in the hands of the officials/village elites with no room for the poor to participate or for transparency in targeting.
PNPM implementers did not think of PNPM as a poverty reduction program. Hence, PNPM was regarded as not having significant direct role in reducing poverty. They regarded it as merely a regular village development program. Consequently, they did not put the poor as top priority. This was apparent from the fact that they made project plans without considering the benefits for the poor; they did not specifically include the poor on the list of workforce for the PNPM construction projects; and they did not exempt the poor from providing cash contribution for project activities.
4. Dynamics of Access and Quality of Public Service
In general, the sample villages already had public service facilities in education, health, water supply, and economy (market). This has contributed to the increase of the villagers’ access to public services during the past three to eight years (of PNPM implementation). In this matter, PNPM was thought to be quite beneficial since it helped to provide additional facilities or to improve the condition of the existing facilities, including road repairs. Besides, the road infrastructures improvement facilitated by the program was also considered helpful in improving the villagers’ economy. Nonetheless, in some sample villages, public facilities were still difficult to access by some villagers. This was caused by, among others, (i) the limited number of facilities, (ii) the unavailability of public transport to reach the facilities, and (iii) the absence of quality service especially in health.
The villagers thought that the quality of public services needs to be improved. In health, for example, Jamkesmas card holders felt that they are not treated as well as other patients. In some sample villages, civil administration services, especially the obtainment of ID card and family card, were considered complicated since the villagers had to go all the way to the kabupaten.
5. Dynamics of Needs and Fulfillment
In almost all sample villages, the poor’s main needs were job opportunities, additional capital, and skills upgrade. After that came scholarships, free health services, and infrastructures to support their main livelihood (such as an irrigation system and farm roads). The government and some groups of villagers have made efforts to fulfill the needs but to no real avail. This was because (i) the existing programs were not adequate to fulfill the villagers’ needs, (ii) sociocultural conditions in the villages, such as social envy, the elites’ or nonpoor’s bias, and (iii) corruption or ineffectiveness during the program implementation that reduced the impact on the villagers’ needs fulfillment.
PNPM–Rural was seldom used to fulfill the poor villagers’ fundamental needs. The PNPM open menu program was often used to build general infrastructures that did not directly cater for the poor’s needs. This is due to the view that PNPM is a program for all villagers, not for poor people. The SPP could partly fulfill the needs for capital loans, but it was difficult for the poor to gain access to the program due to its strict condition that required borrower to have business before applying for loan.
PNPM has not been successful in empowering the village community because of some factors: (i) the improper structure of power in the villages where the elites were dominant, marginalizing the poor; (ii) the mechanistic model of empowerment of the program, in which facilitators were only told to make sure that the program stages were properly conducted and not to improve villagers’ awareness or capacity with regard to program objectives to encourage the creation of good governance (participation, transparency, and accountability) and the improvement of the villagers economy capacity based on self–sufficiency; and (iii) the cases of mismatch between the program mechanisms and the local cultural characteristics, in which the PNPM encouraged individual participation in the program implementation or in the village/nagari administration matters, while the local culture (such as in West Sumatra) urged stronger communal representation by restoring the nagari administration tradition; (iv) the ineffective work of the facilitators due to heavy loads of technical and administrative work; and (v) poor quality and inexperienced facilitators and the frequent rotation as well as high facilitators turnover.

April 2012
PNPM RURALIMPACT EVALUATION
Kementrian KoordinatorBidang Kesejahteraan Rakyat BAPPENAS
PNPM
RURA
L IMPA
CT EVA
LUA
TION