bab 5 simpulan 5.1. simpulan - repository.wima.ac.idrepository.wima.ac.id/168/6/bab 5.pdf ·...
TRANSCRIPT

100
BAB 5
SIMPULAN
5.1. Simpulan
Konsentrasi superdisintegrant berpengaruh signifikan terhadap sifat
mutu fisik tablet. Konsentrasi superdisintegrant mempercepat waktu
hancur, memperlama waktu pembasahan, dan memperbesar rasio absorpsi
air. Sedangkan konsentrasi superdisintegrant yang tidak berpengaruh
signifikan yaitu kekerasan, kerapuhan tablet, dan %ED. Pada konsentrasi
pengikat yang berpengaruh signifikan yaitu memperlama waktu hancur dan
memperlama waktu pembasahan. Sedangkan konsentrasi pengikat yang
tidak berpengaruh signifikan yaitu kekerasan, kerapuhan, rasio absorpsi air,
dan %ED. Interaksi dari konsentrasi superdisintegrant dan pengikat tidak
berpengaruh signifikan terhadap sifat fisik mutu tablet dan profil pelepasan
ODT domperidone secara in vitro.
Formula optimum tablet dapat diperoleh dengan konsentrasi
superdisintegrant 5,075% (Ac-Di-Sol) dan konsentrasi pengikat 0,505%
(PVP K-30) dengan hasil teoritis kekerasan tablet 2,93 Kp, kerapuhan tablet
0,82%, waktu hancur 41 detik, waktu pembasahan 59 detik, rasio absorpsi
air 47%, dan %ED 79,4%.
5.2. Alur Penelitian Selanjutnya
Perlu dilakukan uji stabilitas dengan waktu pengamatan yang lebih
panjang, yaitu tidak kurang dari 3 bulan dan dilakukan penelitian
pembuktian beberapa formula optimum terpilih, yang kemudian
dibandingkan dengan hasil secara teoritis.

101
DAFTAR PUSTAKA
Albright, L. M., 2004, Domperidone in Lactation: Use as a Galactogogue,
International Journal of Pharmaceutical Compounding, 8 (5): 329-335.
Anonim, 1979, Farmakope Indonesia, ed. III, Departemen Kesehatan RI,
Jakarta, 6-8, 755.
Anonim, 1995, Farmakope Indonesia, ed. IV, Departemen Kesehatan RI,
Jakarta, 4, 166, 449-450, 488-489, 515, 683, 783-784, 999-1000.
Anonim, 2005, European Pharmacopeia, 5th
ed., EDQM English, 1473-
1475.
Anonim, 2006, USP29-NF24, General Information Chapter 1174 Powder
Flow, US Pharmacopeial Convention, Rockville, MD, USA.
Anonim, 2007, US Pharmacopeia XXX, US Pharmacopeial Convention,
Inc., Rockville, 680.
Ansel, C.H, 1989, Pengantar Bentuk Sediaan Farmasi, ed. 4, Penerbit
Universitas Indonesia, 244 – 245, 251- 259, 271 - 272.
Banakar, U.V., 1992, Pharmaceutical Disolution Testing, Marcel Dekker
Inc., New York, 19-25.
Bandari, S., Mittapalli, R.K., Gannu, R. and Y.M. Rao, 2008,
Orodispersible Tablets: An Overview, Asian J. Pharm. 2 (1): 2-11.
Banker, G.S. and N.R. Anderson, 1986, Tablet, in: The Theory and
Practice of Industrial Pharmacy: Tablet, L. Lachman, H.A. Lieberman,
and J.L. Kanig (Eds.), 3rd
ed., Lea and Febiger, Philadelphia, 259, 295, 299,
316-329.
Bhowmik, D., Chiranjib.B, Krishnakanth, Pankaj, and R.M. Chandira,
2009, Fast Dissolving Tablet: An Overview, Journal of Chemical and
Pharmaceutical Research, 1 (1): 163-177
102
Bolton, S., 1990, Pharmaceutical Statistics Practical and Clinical
Applications, 2nd
ed., Marcel Dekker, Inc., New York, 324-329.
Camarco, W., D. Ray and A. Druffner, 2006, Selecting Superdisintegrants
for Orally Disintegrating Tablet Formulations, Pharm. Tech. Supplement
28-37.
Deshmukh, V. N., 2012, Mouth Dissolving Drug Delivery System: A
Review, International Journal of PharmTech Research, 4 (1): 412-421.
Dibbern, H.W., R.M. Muller., E. Wirbitzki, 2002, UV and IR Spectra,
Editio Cantor Verlag, 579.
Dobetti L., 2001, Fast-Melting tablets: Development and Technologies.
Pharmaceutical technology drug delivery, 44-50.
Dobetti L., 2003, Fast Disintegrating Tablets, US Patent 6, 596, 311.
Duchene, D., 1983, Tablet Disintegration, In: Topic in Pharmaceutical
Science, P.D. Breimer, and P. Spesier (Eds.), Proceeding of The 43rd
International Congreess of Pharmaceutical, Amsterdam, 387-399.
Fiese, E.F. and Hagen, A.T., 1986, Preformulation, In Lachman, L,
Lieberman, H.A., and Kanig, J.L., (Eds.): The Theory and Practice of
Industrial Pharmacy, 3rd
Edition, Lea and Febiger, Philadelphia.
Folttmann, H., and Anisul Q., 2008, Polyvinylpyrrolidone (PVP) – One of
the Most Widely Used Excipients in Pharmaceuticals: An Overview, Drug
Delivery Technology, Vol (8) No 6.
Forner, D.E., N.R. Anderson, G.S. Banker, T.W. Rosanske, and R.E.
Gordon, 1981, Granulation and Tablet Characteristic, In: Pharmaceutical
Dosage Form, Lieberman H.A., Lachman L., and J.B. Schwartz, (Eds.),
Volume 2, Marcel Dekker,Inc., New York, 109-143, 188-190.
Fu Y, Yang S, Jeong SH, Kimura S, Park K, 2004, Orally fast disintegrating
tablets: Developments, technologies, taste-masking and clinical studies,
Crit Rev Ther Drug Carrier Sys, Vol 21, 433-476.
Ghost, T.K., Chatterjee, D.J., Pfister, W.R., Jarugula, V.R., Fadiran, E.O.,
Hunt, J.P., Lesko, L.J., Tammara, V.K. and D.B. Hare, 2005, Quick

103
Dissolving 67 Oral Dosage Forms: Scientific and Regulatory
Considerations from A Clinical Pharmacology and Biopharmaceutics
Perspective, In: T.K. Ghosh and W.R. Pfister (eds), Drug Delivery to The
Oral Cavity: Molecules to Market, Boca Raton: Taylor & Francis Group,
344.
Giri,T. K., D. K. Tripathi, and R. Majumdar, 2010, Formulation Aspects In
The Development of Orodispersible Tablets: An Overview, International
Journal of Pharmacy and Pharmaceutical Sciences, 2 (3): 38-42.
Goel, H., Rai, P., Rana, V. and A.K. Tiwary, 2008, Orally Disintegrating
Systems: Innovations in Formulation and Technology, Recent Pat. Drug
Deliv. Formul., 2 (3): 258-274
Goel, H., N. Vora, A. K. Tiwary, V. Rana, 2009, Formulation of
Orodispersible Tablets of Ondansentron HCl: Investigation Using Glycine-
Chitosan Mixture as Superdisintegrant, Yakugaku Zasshi, 129 (5): 513-
521.
Gohel, M. C. and P. D. Jogani, 2005, A Review Of Co-Processed Directly
Compressible Excipients, J. Pharm. Pharmaceut. Sci., 8 (1): 76-93.
Guleria, R., N. S. Kaith, R. Singh, 2011, Improved Dissolution of
Domperidone in Solid Dispersion with Polymeric Hydrophillic Additive, J.
Chem. Pharm. Res., 3(6):655-664.
Hsu, A.F. and C-H Han, 2005, Oral Disintegrating Dosage Form, US
Patent Application Publication Number 20050147670A1.
Khan, K.A., 1975, The Concept of Dissolution Efficiency. J. Pharm, 27
(1), 48-49.
Koseki, T., Onishi, H., Takahashi, Y., Uchida, M. and Y. Machida, 2008,
Development of Novel Fast-Disintegrating Tablets by Direct
Compression Using Sucrose Stearic Acid Esters as A Disintegration-
Accelerating Agent. Chem. Pharm. Bull., 56 (10): 1384-1388.
Kumar, M.V., Sethi, P., Kheri, R., Saraogi, G.K., Singhai, A.K., 2011,
Orally Disintegrating Tablets: A Review, International Research Journal
of Pharmacy, 2 (4), 16-22.

104
Kundu, S. and P.K. Sahoo, 2008, Recent Trends in The Developments of
Orally Disintegrating Tablet Technology, Pharma Times 40 (4): 11-21.
Lachman, L., H.A. Leiberman, and J.L. Kanig, 1986, The Theory and
Practice of Industrial Pharmacy, 3rd
Edition, Lea and Febiger,
Philadelphia, 564-588.
Langenbucher, F., 1972, Linearization of Dissolution Rate Curve by
Weibull Distribution, Journal of Pharmaceutical Sciences, 24, 979-981.
Lucas, T. I., R. H. Bishara, R. H. Seevers, 2004, A Stability Program for the
Distribution of Drug Products, Pharmaceutical Technology, 7: 68-73.
Manivannan, R., 2009, Oral Disintegrating Tablets: A Future Compaction,
International Journal of Pharmaceutical Research and Development, 1
(10): 1-10.
Martin, A., J. Swarbrick, and A. Cammarata, 1993, Farmasi Fisik: Dasar-
dasar Kimia Fisika dalam Ilmu Farmasetik, vol. 2, ed. 3, terjemahan
Yoshita, Universitas Indonesia, Jakarta, 1135.
Parashar, B. and A. Chauhan, 2012, Formulation And Evaluation of Fast
Disintegrating Tablets of Domperidone, International Journal of
Institutional Pharmacy and Life Sciences, 2 (3): 232-238.
Parmar R.B., Baria A.H., Tank H.M., Faldu S.D, 2009, Formulation and
Evaluation of Domperidone Fast Dissolving Tablets, International Journal
of PharmTech Research, Vol 1, No 3, 483-487.
Parrott, E.L., 1971, Pharmaceutical Technology Fundamental
Pharmaceutics, 3rd
ed., Burgess Publishing Company, Minneapolis, 17-19,
82, 160-162.
Prajapati, B.G. and D.V. Patel, 2010, Comparative Study of Efficiency of
Different Superdisintegrant for Fast Dissolve Tablet of Domperidone,
Journal of Pharmacy Research, 3(1): 151-155.
Rao, N.G.R., Patel, T. and S. Gandhi, 2009, Development and Evaluation
of Carbamazepine Fast Dissolving Tablets Prepared with A Complex by Direct Compression Technique, Asian J. Pharma, April-June, 3 (2):
97-103.

105
Rowe, R.C., P.J. Shekey, M.E. Quinn, 2009, Handbook of Pharmaceutical
Excipients, 6th
ed, The Pharmaceutical Press, London, 206-207, 364-368,
404-406, 424-427, 728-730.
Shargel, L. and A.B.C. Yu, 1999, Applied Biopharmaceutics and
Pharmacokinetics, 4th
ed McGraw-Hill. New York, 8, 132, 169-200.
Sharma, K., Pfister, W.R. and T.K. Ghosh, 2005, Quick-Dispersing Oral
Drug Delivery Systems, In: T.K. Ghosh and W.R. Pfister (eds), Drug
Delivery to The Oral Cavity: Molecules to Market, Boca Raton: Taylor
& Francis Group, 262-263.
Sharma, S and P. K. Suresh, 2010, Formulation, In Vitro Characterization
and Stability Studies of Self Microemulsifying Drug Delivery Systems of
Domperidone, International Journal of Innovative Pharmaceutical
Research, 1 (4): 66-73.
Shervingon, L.A. and A. Shervington, 1998, Guaifenesin, In: Analytical
Profiles of Drug Substances and Excipients, H.G. Brittain (Ed.), Vol 25,
Academic Press, London, 152.
Shukla, D., Chakraborty, S., Singh, S. and B. Mishra, 2009, Mouth
Dissolving Tablets I: An Overview of Formulation Technology, J. Sci.
Pharm, 76: 309-326.
Singh, S. K., D. N. Mishra, R. Jassal, P. Soni, 2009, Fast Disintegrating
Combination Tablets Of Omeprazole And Domperidone, Asian Journal of
Pharmaceutical and Clinical Research, 2 (3): 74-82.
Siregar, Ch. J. P., 1992, Proses validasi and Manufaktur Sediaan tablet,
In : Asyarie S., U. Mar’u, S. Badruzzaman (Eds), Prosiding Seminar
Validasi di Industri Farmasi, Jurusan Farmasi FMIPA ITB, Bandung, 26-41.
Sweetman, S.C., 2009, Martindale The Complete Drug Reference, 36th
ed, Pharmaceutical Press, London, 1726-1727.
Thatipamula R.P., Palem C.R., Gannu R., Mudragada S., Yamsani M.R.,
2011, Formulation and In Vitro Characterization of Domperidone Loaded
Solid Lipid Nanoparticles and Nanostructured Lipid Carriers, Daru, Vol 19,
No 1.

106
Wagner, J.G., 1971, Biopharmaceutics and Relevant Pharmacokinetics,
1st
ed., Drug Intelligence Publications, Illinois, 64-110.
Yadav, V., Bharat P., Brajesh M., Love S., 2012, Fast Dissolving Tablet,
International Journal of Apllied Pharmaceutics, Vol 4 (2), 17-22
Zainuddin, M., 2000, Validasi Metode Analisis Kuantitatif Secara
Spektrofotometris Ultra Ungu-Sinar Tampak (UV-Vis), Universitas
Airlangga, Surabaya.
107
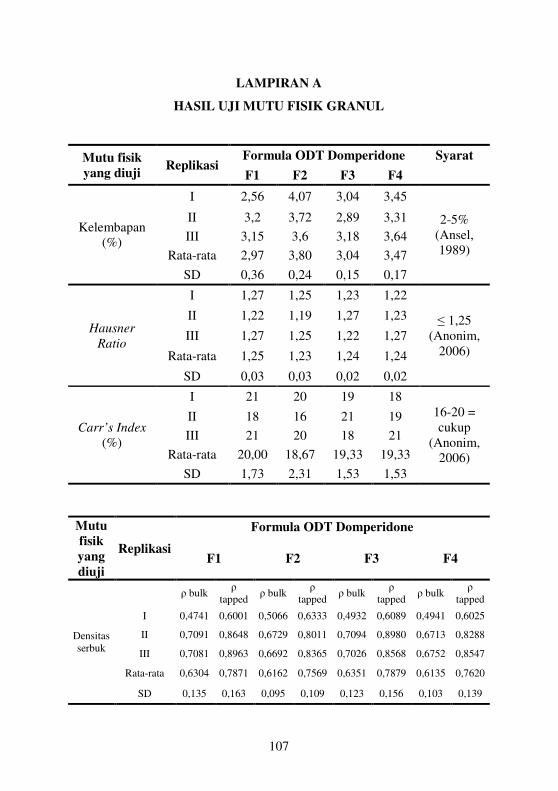
LAMPIRAN A
HASIL UJI MUTU FISIK GRANUL
Mutu fisik
yang diuji Replikasi
Formula ODT Domperidone Syarat
F1 F2 F3 F4
Kelembapan
(%)
I 2,56 4,07 3,04 3,45
2-5%
(Ansel,
1989)
II 3,2 3,72 2,89 3,31
III 3,15 3,6 3,18 3,64
Rata-rata 2,97 3,80 3,04 3,47
SD 0,36 0,24 0,15 0,17
Hausner
Ratio
I 1,27 1,25 1,23 1,22
≤ 1,25
(Anonim,
2006)
II 1,22 1,19 1,27 1,23
III 1,27 1,25 1,22 1,27
Rata-rata 1,25 1,23 1,24 1,24
SD 0,03 0,03 0,02 0,02
Carr’s Index
(%)
I 21 20 19 18
16-20 =
cukup
(Anonim,
2006)
II 18 16 21 19
III 21 20 18 21
Rata-rata 20,00 18,67 19,33 19,33
SD 1,73 2,31 1,53 1,53
Mutu
fisik
yang
diuji
Replikasi
Formula ODT Domperidone
F1 F2 F3 F4
Densitas
serbuk
ρ bulk
ρ
tapped ρ bulk
ρ
tapped ρ bulk
ρ
tapped ρ bulk
ρ
tapped
I 0,4741 0,6001 0,5066 0,6333 0,4932 0,6089 0,4941 0,6025
II 0,7091 0,8648 0,6729 0,8011 0,7094 0,8980 0,6713 0,8288
III 0,7081 0,8963 0,6692 0,8365 0,7026 0,8568 0,6752 0,8547
Rata-rata 0,6304 0,7871 0,6162 0,7569 0,6351 0,7879 0,6135 0,7620
SD 0,135 0,163 0,095 0,109 0,123 0,156 0,103 0,139
108
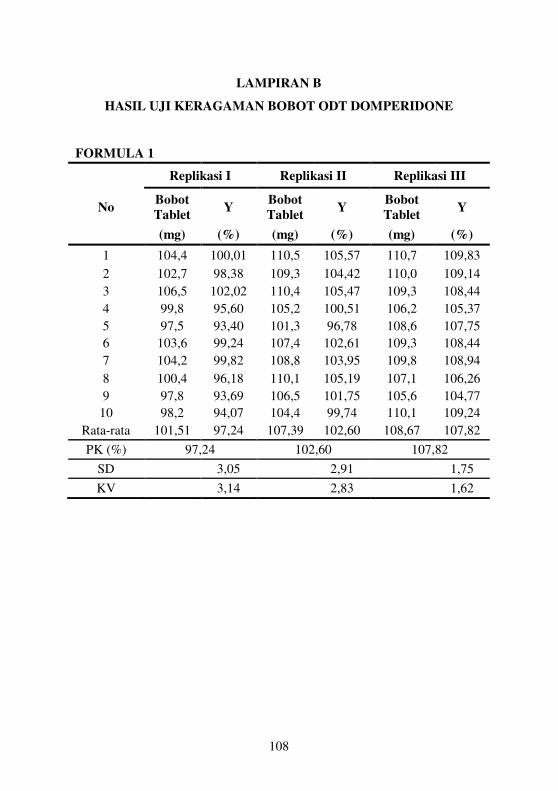
LAMPIRAN B
HASIL UJI KERAGAMAN BOBOT ODT DOMPERIDONE
FORMULA 1
Replikasi I Replikasi II Replikasi III
No Bobot
Tablet Y
Bobot
Tablet Y
Bobot
Tablet Y
(mg) (%) (mg) (%) (mg) (%)
1 104,4 100,01 110,5 105,57 110,7 109,83
2 102,7 98,38 109,3 104,42 110,0 109,14
3 106,5 102,02 110,4 105,47 109,3 108,44
4 99,8 95,60 105,2 100,51 106,2 105,37
5 97,5 93,40 101,3 96,78 108,6 107,75
6 103,6 99,24 107,4 102,61 109,3 108,44
7 104,2 99,82 108,8 103,95 109,8 108,94
8 100,4 96,18 110,1 105,19 107,1 106,26
9 97,8 93,69 106,5 101,75 105,6 104,77
10 98,2 94,07 104,4 99,74 110,1 109,24
Rata-rata 101,51 97,24 107,39 102,60 108,67 107,82
PK (%) 97,24 102,60 107,82
SD
3,05
2,91
1,75
KV
3,14
2,83
1,62

109
FORMULA 2
Replikasi I Replikasi II Replikasi III
No Bobot
Tablet Y
Bobot
Tablet Y
Bobot
Tablet Y
(mg) (%) (mg) (%) (mg) (%)
1 106,5 101,66 105,2 101,59 108,4 106,38
2 101,4 96,79 109,2 105,45 105,8 103,83
3 100,6 96,02 108,4 104,68 106,3 104,32
4 110,3 105,28 108,3 104,59 108,3 106,28
5 104,5 99,75 104,8 101,21 107,6 105,59
6 100,4 95,83 106,2 102,56 107,2 105,20
7 101,8 97,17 108,7 104,97 106,7 104,71
8 103,7 98,98 109,5 105,74 108,2 106,18
9 108,1 103,18 108,0 104,30 106,6 104,61
10 112,4 107,29 107,6 103,91 108,1 106,08
Rata-rata 104,97 100,20 107,59 103,90 107,32 105,32
PK (%) 100,20 103,90 105,32
SD
4,03
1,58
0,92
KV
4,02
1,53
0,87

110
FORMULA 3
Replikasi I Replikasi II Replikasi III
No Bobot
Tablet Y
Bobot
Tablet Y
Bobot
Tablet Y
(mg) (%) (mg) (%) (mg) (%)
1 103,8 106,55 102,6 97,04 110,4 107,20
2 101,8 104,50 100,5 95,05 110,3 107,11
3 98,4 101,01 102,4 96,85 106,8 103,71
4 100,8 103,47 104,6 98,93 110,6 107,40
5 101,4 104,09 102,7 97,13 107,3 104,19
6 103,5 106,25 100,1 94,67 110,9 107,69
7 100,6 103,27 100,5 95,05 110,5 107,30
8 99,5 102,14 101,2 95,71 110,6 107,40
9 100,7 103,37 100,7 95,24 106,3 103,22
10 100,3 102,96 101,4 95,90 105,4 102,35
Rata-rata 101,08 103,76 101,67 96,16 108,91 105,76
PK (%) 103,76 96,16 105,76
SD
1,70
1,32
2,11
KV
1,64
1,37
2,00

111
FORMULA 4
Replikasi I Replikasi II Replikasi III
No Bobot
Tablet Y
Bobot
Tablet Y
Bobot
Tablet Y
(mg) (%) (mg) (%) (mg) (%)
1 105,3 106,87 106,8 100,85 103,1 101,79
2 104,4 105,95 108,3 102,27 105,0 103,66
3 107,1 108,69 108,0 101,98 103,5 102,18
4 106,2 107,78 107,2 101,23 102,6 101,29
5 104,8 106,36 105,8 99,91 103,8 102,48
6 105,6 107,17 106,1 100,19 104,2 102,87
7 99,9 101,39 106,6 100,66 105,5 104,16
8 100,4 101,89 104,0 98,21 103,1 101,79
9 104,4 105,95 105,8 99,91 105,7 104,35
10 106,0 107,58 107,5 101,51 104,3 102,97
Rata-rata 104,41 105,96 106,61 100,67 104,08 102,75
PK (%) 105,96 100,67 102,75
SD
2,43
1,19
1,04
KV
2,30
1,18
1,02

112
LAMPIRAN C
HASIL UJI KESERAGAMAN KANDUNGAN ODT DOMPERIDONE
Hasil Uji Keseragaman Kandungan Tablet Formula 1 Replikasi I
Abs W tablet
(mg)
W sampel
(mg)
C sampel
(µg/ml)
C teoritis
(µg/ml)
Kadar
(%)
0,239 104,4 96,0 7,36 7,36 100,10
0,241 102,7 95,6 7,43 7,45 99,83
0,238 106,5 100,3 7,33 7,53 97,27
0,242 99,8 95,1 7,47 7,62 97,99
0,245 97,5 92,8 7,58 7,61 99,50
0,248 103,6 99,6 7,68 7,69 99,88
0,243 104,2 99,7 7,51 7,65 98,05
0,242 100,4 97,2 7,47 7,75 96,45
0,252 97,8 94,5 7,82 7,73 101,21
0,246 98,2 94,9 7,61 7,73 98,45
Rata-rata 98,87
SD 1,47
KV 1,48
113
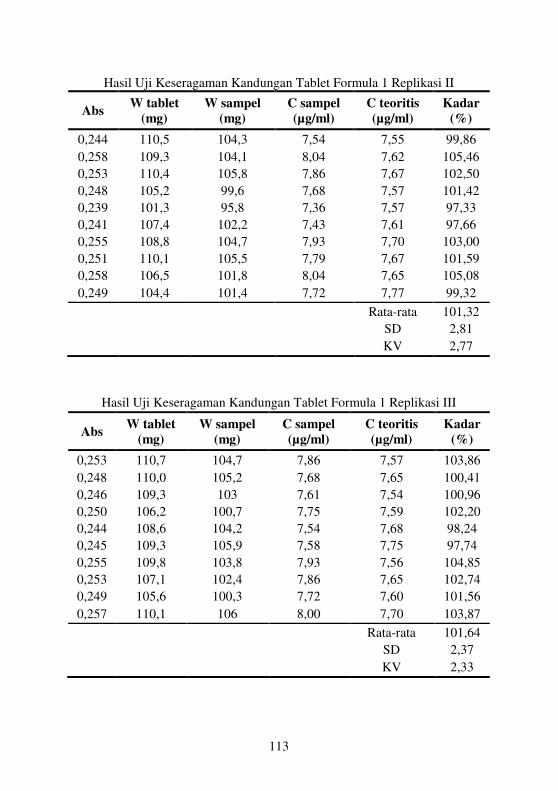
Hasil Uji Keseragaman Kandungan Tablet Formula 1 Replikasi II
Abs W tablet
(mg)
W sampel
(mg)
C sampel
(µg/ml)
C teoritis
(µg/ml)
Kadar
(%)
0,244 110,5 104,3 7,54 7,55 99,86
0,258 109,3 104,1 8,04 7,62 105,46
0,253 110,4 105,8 7,86 7,67 102,50
0,248 105,2 99,6 7,68 7,57 101,42
0,239 101,3 95,8 7,36 7,57 97,33
0,241 107,4 102,2 7,43 7,61 97,66
0,255 108,8 104,7 7,93 7,70 103,00
0,251 110,1 105,5 7,79 7,67 101,59
0,258 106,5 101,8 8,04 7,65 105,08
0,249 104,4 101,4 7,72 7,77 99,32
Rata-rata 101,32
SD 2,81
KV 2,77
Hasil Uji Keseragaman Kandungan Tablet Formula 1 Replikasi III
Abs W tablet
(mg)
W sampel
(mg)
C sampel
(µg/ml)
C teoritis
(µg/ml)
Kadar
(%)
0,253 110,7 104,7 7,86 7,57 103,86
0,248 110,0 105,2 7,68 7,65 100,41
0,246 109,3 103 7,61 7,54 100,96
0,250 106,2 100,7 7,75 7,59 102,20
0,244 108,6 104,2 7,54 7,68 98,24
0,245 109,3 105,9 7,58 7,75 97,74
0,255 109,8 103,8 7,93 7,56 104,85
0,253 107,1 102,4 7,86 7,65 102,74
0,249 105,6 100,3 7,72 7,60 101,56
0,257 110,1 106 8,00 7,70 103,87
Rata-rata 101,64
SD 2,37
KV 2,33

114
Hasil Uji Keseragaman Kandungan Tablet Formula 2 Replikasi I
Abs W tablet
(mg)
W sampel
(mg)
C sampel
(µg/ml)
C teoritis
(µg/ml)
Kadar
(%)
0,245 106,5 100,1 7,58 7,52 100,75
0,248 101,4 98,2 7,68 7,75 99,15
0,250 100,6 94,3 7,75 7,50 103,38
0,251 110,3 104,9 7,79 7,61 102,36
0,248 104,5 100,0 7,68 7,66 100,35
0,245 100,4 95,8 7,58 7,63 99,25
0,253 101,8 96,2 7,86 7,56 103,95
0,255 103,7 98,7 7,93 7,61 104,14
0,246 108,1 102,4 7,61 7,58 100,44
0,247 112,4 108,3 7,65 7,71 99,20
Rata-rata 101,30
SD 1,99
KV 1,97
Hasil Uji Keseragaman Kandungan Tablet Formula 2 Replikasi II
Abs W tablet
(mg)
W sampel
(mg)
C sampel
(µg/ml)
C teoritis
(µg/ml)
Kadar
(%)
0,245 105,2 99,9 7,58 7,60 99,72
0,246 109,2 103,7 7,61 7,60 100,19
0,248 108,4 104,5 7,68 7,71 99,61
0,246 108,3 103,8 7,61 7,67 99,27
0,252 104,8 100,1 7,82 7,64 102,38
0,254 106,2 100,2 7,89 7,55 104,58
0,255 108,7 103,8 7,93 7,64 103,80
0,251 109,5 105,0 7,79 7,67 101,52
0,248 108,0 103,4 7,68 7,66 100,30
0,244 107,6 101,7 7,54 7,56 99,73
Rata-rata 101,11
SD 1,89
KV 1,87

115
Hasil Uji Keseragaman Kandungan Tablet Formula 2 Replikasi III
Abs W tablet
(mg)
W sampel
(mg)
C sampel
(µg/ml)
C teoritis
(µg/ml)
Kadar
(%)
0,247 108,4 103,8 7,65 7,66 99,82
0,256 105,8 100,1 7,96 7,57 105,23
0,254 106,3 100,7 7,89 7,58 104,16
0,248 108,3 102,4 7,68 7,56 101,56
0,249 107,6 102,8 7,72 7,64 100,97
0,252 107,2 102,3 7,82 7,63 102,48
0,250 106,7 100,3 7,75 7,52 103,09
0,257 108,2 104,5 8,00 7,73 103,54
0,251 106,6 103,8 7,79 7,79 99,98
0,254 108,1 104,2 7,89 7,71 102,37
Rata-rata 102,32
SD 1,77
KV 1,73
Hasil Uji Keseragaman Kandungan Tablet Formula 3 Replikasi I
Abs W tablet
(mg)
W sampel
(mg)
C sampel
(µg/ml)
C teoritis
(µg/ml)
Kadar
(%)
0,256 103,8 100,6 7,96 7,75 102,73
0,251 101,8 96,3 7,79 7,57 102,91
0,248 98,4 94,2 7,68 7,66 100,31
0,245 100,8 96,2 7,58 7,63 99,23
0,249 101,4 97,3 7,72 7,68 100,53
0,253 103,5 96,5 7,86 7,46 105,36
0,255 100,6 94,7 7,93 7,53 105,29
0,251 99,5 93,6 7,79 7,53 103,49
0,245 100,7 95,1 7,58 7,56 100,28
0,247 100,3 94,8 7,65 7,56 101,13
Rata-rata 102,12
SD 2,16
KV 2,11

116
Hasil Uji Keseragaman Kandungan Tablet Formula 3 Replikasi II
Abs W tablet
(mg)
W sampel
(mg)
C sampel
(µg/ml)
C teoritis
(µg/ml)
Kadar
(%)
0,249 102,6 98,2 7,72 7,66 100,79
0,243 100,5 94,5 7,51 7,52 99,77
0,242 102,4 94,9 7,47 7,41 100,75
0,238 104,6 95,6 7,33 7,31 100,23
0,239 102,7 95,2 7,36 7,42 99,30
0,240 100,1 95,7 7,40 7,65 96,74
0,244 100,5 96,1 7,54 7,65 98,57
0,246 101,2 97,0 7,61 7,67 99,26
0,240 100,7 95,7 7,40 7,60 97,32
0,242 101,4 96,4 7,47 7,61 98,22
Rata-rata 99,10
SD 1,38
KV 1,39
Hasil Uji Keseragaman Kandungan Tablet Formula 3 Replikasi III
Abs W tablet
(mg)
W sampel
(mg)
C sampel
(µg/ml)
C teoritis
(µg/ml)
Kadar
(%)
0,260 110,4 106,3 8,11 7,70 105,23
0,254 110,3 105,8 7,89 7,67 102,87
0,255 106,8 100,7 7,93 7,54 105,12
0,249 110,6 103,9 7,72 7,52 102,69
0,247 107,3 102,6 7,65 7,65 99,96
0,252 110,9 106,3 7,82 7,67 102,02
0,256 110,5 104,7 7,96 7,58 105,07
0,258 110,6 106,1 8,04 7,67 104,70
0,249 106,3 100,5 7,72 7,56 102,03
0,257 105,4 100,7 8,00 7,64 104,67
Rata-rata 103,44
SD 1,79
KV 1,73

117
Hasil Uji Keseragaman Kandungan Tablet Formula 4 Replikasi I
Abs W tablet
(mg)
W sampel
(mg)
C sampel
(µg/ml)
C teoritis
(µg/ml)
Kadar
(%)
0,258 105,3 100,7 8,04 7,65 105,03
0,245 104,4 100,1 7,58 7,67 98,77
0,247 107,1 102,4 7,65 7,65 99,97
0,251 106,2 101,8 7,79 7,67 101,56
0,256 104,8 98,6 7,96 7,53 105,82
0,249 105,6 102,1 7,72 7,73 99,77
0,252 99,9 93,5 7,82 7,49 104,49
0,251 100,4 94,9 7,79 7,56 102,99
0,255 104,4 98,7 7,93 7,56 104,84
0,249 106,0 101,4 7,72 7,65 100,84
Rata-rata 102,41
SD 2,55
KV 2,49
Hasil Uji Keseragaman Kandungan Tablet Formula 4 Replikasi II
Abs W tablet
(mg)
W sampel
(mg)
C sampel
(µg/ml)
C teoritis
(µg/ml)
Kadar
(%)
0,250 106,8 102,3 7,75 7,66 101,17
0,249 108,3 103,6 7,72 7,65 100,84
0,253 108,0 104,7 7,86 7,76 101,33
0,251 107,2 102,5 7,79 7,65 101,81
0,250 105,8 100,3 7,75 7,58 102,22
0,246 106,1 101,8 7,61 7,68 99,16
0,250 106,6 102,4 7,75 7,68 100,88
0,247 104,0 100,1 7,65 7,70 99,31
0,249 105,8 100,5 7,72 7,60 101,55
0,253 107,5 104,0 7,86 7,74 101,54
Rata-rata 100,98
SD 1,01
KV 1,00

118
Hasil Uji Keseragaman Kandungan Tablet Formula 4 Replikasi III
Abs W tablet
(mg)
W sampel
(mg)
C sampel
(µg/ml)
C teoritis
(µg/ml)
Kadar
(%)
0,244 103,1 95,1 7,54 7,38 102,19
0,240 105,0 97,4 7,40 7,42 99,71
0,243 103,5 96,9 7,51 7,49 100,21
0,245 102,6 95,2 7,58 7,42 102,06
0,242 103,8 95,2 7,47 7,34 101,81
0,241 104,2 96,8 7,43 7,43 100,04
0,248 105,5 100,3 7,68 7,61 101,00
0,250 103,1 100,0 7,75 7,76 99,91
0,252 105,7 101,2 7,82 7,66 102,14
0,254 104,3 101,4 7,89 7,78 101,50
Rata-rata 101,06
SD 1,01
KV 1,00
119
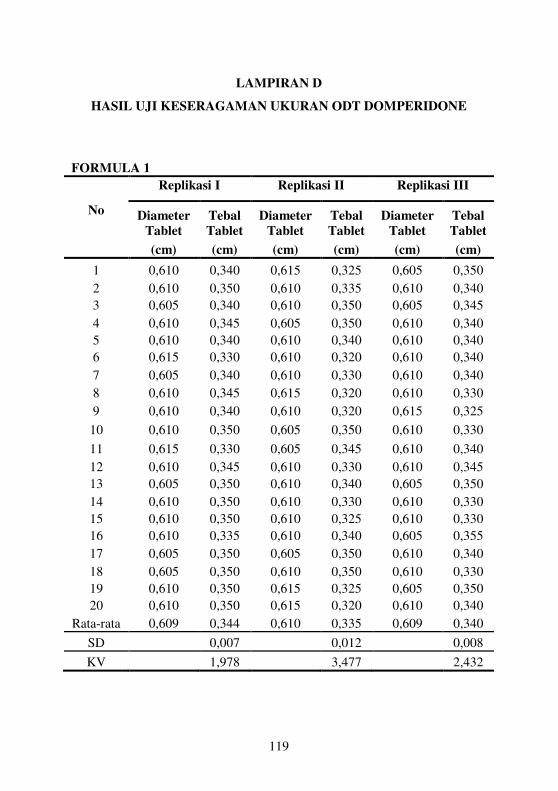
LAMPIRAN D
HASIL UJI KESERAGAMAN UKURAN ODT DOMPERIDONE
FORMULA 1
Replikasi I Replikasi II Replikasi III
No Diameter
Tablet
Tebal
Tablet
Diameter
Tablet
Tebal
Tablet
Diameter
Tablet
Tebal
Tablet
(cm) (cm) (cm) (cm) (cm) (cm)
1 0,610 0,340 0,615 0,325 0,605 0,350
2 0,610 0,350 0,610 0,335 0,610 0,340
3 0,605 0,340 0,610 0,350 0,605 0,345
4 0,610 0,345 0,605 0,350 0,610 0,340
5 0,610 0,340 0,610 0,340 0,610 0,340
6 0,615 0,330 0,610 0,320 0,610 0,340
7 0,605 0,340 0,610 0,330 0,610 0,340
8 0,610 0,345 0,615 0,320 0,610 0,330
9 0,610 0,340 0,610 0,320 0,615 0,325
10 0,610 0,350 0,605 0,350 0,610 0,330
11 0,615 0,330 0,605 0,345 0,610 0,340
12 0,610 0,345 0,610 0,330 0,610 0,345
13 0,605 0,350 0,610 0,340 0,605 0,350
14 0,610 0,350 0,610 0,330 0,610 0,330
15 0,610 0,350 0,610 0,325 0,610 0,330
16 0,610 0,335 0,610 0,340 0,605 0,355
17 0,605 0,350 0,605 0,350 0,610 0,340
18 0,605 0,350 0,610 0,350 0,610 0,330
19 0,610 0,350 0,615 0,325 0,605 0,350
20 0,610 0,350 0,615 0,320 0,610 0,340
Rata-rata 0,609 0,344 0,610 0,335 0,609 0,340
SD 0,007 0,012 0,008
KV 1,978 3,477 2,432

120
FORMULA 2
Replikasi I Replikasi II Replikasi III
No Diameter
Tablet
Tebal
Tablet
Diameter
Tablet
Tebal
Tablet
Diameter
Tablet
Tebal
Tablet
(cm) (cm) (cm) (cm) (cm) (cm)
1 0,615 0,345 0,610 0,350 0,610 0,340
2 0,610 0,350 0,610 0,350 0,610 0,340
3 0,615 0,345 0,605 0,365 0,610 0,340
4 0,610 0,350 0,610 0,360 0,605 0,350
5 0,610 0,360 0,610 0,340 0,610 0,335
6 0,610 0,360 0,610 0,360 0,610 0,340
7 0,615 0,340 0,610 0,355 0,610 0,345
8 0,610 0,365 0,610 0,340 0,610 0,340
9 0,605 0,370 0,605 0,350 0,610 0,340
10 0,610 0,360 0,610 0,345 0,610 0,330
11 0,610 0,370 0,610 0,340 0,615 0,325
12 0,605 0,370 0,615 0,335 0,610 0,330
13 0,610 0,370 0,605 0,360 0,605 0,350
14 0,605 0,385 0,610 0,350 0,610 0,340
15 0,610 0,370 0,610 0,350 0,610 0,325
16 0,605 0,380 0,610 0,350 0,605 0,350
17 0,610 0,360 0,615 0,335 0,615 0,315
18 0,610 0,365 0,610 0,350 0,610 0,340
19 0,605 0,370 0,605 0,360 0,610 0,340
20 0,610 0,360 0,610 0,350 0,610 0,340
Rata-rata 0,610 0,362 0,610 0,350 0,610 0,338
SD 0,012 0,009 0,009
KV 3,244 2,475 2,651

121
FORMULA 3
Replikasi I Replikasi II Replikasi III
No Diameter
Tablet
Tebal
Tablet
Diameter
Tablet
Tebal
Tablet
Diameter
Tablet
Tebal
Tablet
(cm) (cm) (cm) (cm) (cm) (cm)
1 0,610 0,340 0,605 0,350 0,610 0,330
2 0,610 0,330 0,610 0,340 0,605 0,325
3 0,610 0,335 0,605 0,350 0,605 0,330
4 0,610 0,330 0,610 0,340 0,610 0,320
5 0,610 0,330 0,610 0,340 0,610 0,320
6 0,610 0,345 0,610 0,350 0,610 0,320
7 0,610 0,330 0,610 0,340 0,615 0,315
8 0,610 0,335 0,610 0,345 0,610 0,330
9 0,610 0,330 0,610 0,340 0,615 0,315
10 0,610 0,330 0,605 0,350 0,610 0,330
11 0,610 0,330 0,610 0,345 0,605 0,320
12 0,610 0,330 0,610 0,340 0,615 0,315
13 0,610 0,335 0,610 0,340 0,610 0,330
14 0,605 0,350 0,610 0,340 0,610 0,325
15 0,610 0,330 0,610 0,335 0,610 0,320
16 0,610 0,335 0,610 0,335 0,605 0,340
17 0,610 0,330 0,610 0,335 0,615 0,310
18 0,610 0,330 0,610 0,340 0,615 0,315
19 0,610 0,340 0,615 0,335 0,610 0,315
20 0,605 0,350 0,610 0,340 0,610 0,320
Rata-rata 0,610 0,335 0,610 0,342 0,610 0,322
SD 0,007 0,005 0,008
KV 2,026 1,510 2,333

122
FORMULA 4
Replikasi I Replikasi II Replikasi III
No Diameter
Tablet
Tebal
Tablet
Diameter
Tablet
Tebal
Tablet
Diameter
Tablet
Tebal
Tablet
(cm) (cm) (cm) (cm) (cm) (cm)
1 0,610 0,375 0,610 0,360 0,615 0,330
2 0,610 0,380 0,605 0,370 0,610 0,340
3 0,615 0,375 0,610 0,360 0,610 0,340
4 0,610 0,380 0,610 0,360 0,610 0,335
5 0,610 0,380 0,610 0,360 0,610 0,300
6 0,610 0,380 0,610 0,360 0,610 0,340
7 0,610 0,385 0,610 0,365 0,610 0,340
8 0,605 0,390 0,610 0,360 0,615 0,330
9 0,610 0,380 0,610 0,360 0,615 0,330
10 0,610 0,380 0,610 0,360 0,610 0,335
11 0,610 0,380 0,610 0,360 0,610 0,345
12 0,605 0,390 0,610 0,360 0,610 0,340
13 0,605 0,390 0,610 0,360 0,610 0,340
14 0,610 0,375 0,610 0,365 0,610 0,340
15 0,610 0,380 0,610 0,360 0,605 0,350
16 0,615 0,375 0,615 0,355 0,605 0,345
17 0,610 0,380 0,610 0,360 0,610 0,340
18 0,610 0,380 0,610 0,360 0,610 0,340
19 0,610 0,380 0,610 0,365 0,610 0,345
20 0,610 0,380 0,610 0,360 0,610 0,340
Rata-rata 0,610 0,381 0,610 0,361 0,610 0,337
SD 0,005 0,003 0,010
KV 1,226 0,853 3,022

123
LAMPIRAN E
HASIL UJI KEKERASAN ODT DOMPERIDONE
Hasil Uji Kekerasan ODT Domperidone Replikasi I
No Kekerasan ODT Domperidone (Kp)
Formula 1 Formula 2 Formula 3 Formula 4
1 2,9 2,2 2,8 2,1
2 2,7 2,8 3,3 3,3
3 3,1 2,3 3,4 3
4 3,4 2 3,8 2,3
5 2,4 2 3,5 2,2
6 3 3,8 2,9 1,9
7 2,1 2 3,6 2,3
8 3,1 2,2 3,2 2
9 2,2 2,7 3,1 2,5
10 2,9 2,2 3,3 2,2
Rata-rata 2,78 2,42 3,29 2,38
SD 0,42 0,56 0,31 0,44
KV 15,24 23,11 9,34 18,66
124
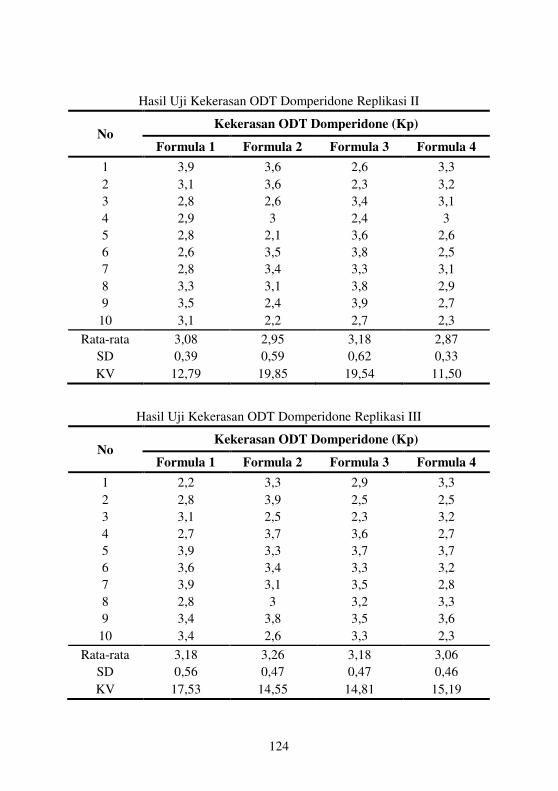
Hasil Uji Kekerasan ODT Domperidone Replikasi II
No Kekerasan ODT Domperidone (Kp)
Formula 1 Formula 2 Formula 3 Formula 4
1 3,9 3,6 2,6 3,3
2 3,1 3,6 2,3 3,2
3 2,8 2,6 3,4 3,1
4 2,9 3 2,4 3
5 2,8 2,1 3,6 2,6
6 2,6 3,5 3,8 2,5
7 2,8 3,4 3,3 3,1
8 3,3 3,1 3,8 2,9
9 3,5 2,4 3,9 2,7
10 3,1 2,2 2,7 2,3
Rata-rata 3,08 2,95 3,18 2,87
SD 0,39 0,59 0,62 0,33
KV 12,79 19,85 19,54 11,50
Hasil Uji Kekerasan ODT Domperidone Replikasi III
No Kekerasan ODT Domperidone (Kp)
Formula 1 Formula 2 Formula 3 Formula 4
1 2,2 3,3 2,9 3,3
2 2,8 3,9 2,5 2,5
3 3,1 2,5 2,3 3,2
4 2,7 3,7 3,6 2,7
5 3,9 3,3 3,7 3,7
6 3,6 3,4 3,3 3,2
7 3,9 3,1 3,5 2,8
8 2,8 3 3,2 3,3
9 3,4 3,8 3,5 3,6
10 3,4 2,6 3,3 2,3
Rata-rata 3,18 3,26 3,18 3,06
SD 0,56 0,47 0,47 0,46
KV 17,53 14,55 14,81 15,19

125
LAMPIRAN F
HASIL UJI KERAPUHAN ODT DOMPERIDONE
Formula Rep
Berat
awal
Berat
akhir Kerapuhan
Rata-
rata SD KV
(gram) (gram) (%)
1
I 1,98 1,95 1,52
0,83 0,60 71,89 II 2,07 2,06 0,48
III 2,06 2,05 0,49
2
I 2,01 1,98 1,49
0,82 0,59 71,69 II 2,13 2,12 0,47
III 2,05 2,04 0,49
3
I 1,94 1,93 0,52
0,34 0,29 86,68 II 2,04 2,03 0,49
III 2,03 2,03 0,00
4
I 2,01 1,98 1,49
0,81 0,59 72,94 II 2,23 2,22 0,45
III 2,04 2,03 0,49

126
LAMPIRAN G
HASIL UJI WAKTU HANCUR ODT DOMPERIDONE
Hasil Uji Waktu Hancur ODT Domperidone Replikasi I
No Waktu Hancur (detik)
Formula 1 Formula 2 Formula 3 Formula 4
1 40 28 159 40
2 38 26 121 38
3 38 32 151 45
4 49 31 148 38
5 36 32 164 39
Rata-rata 40,2 29,8 148,6 40
SD 5,12 2,68 16,68 2,92
KV 12,73 9,00 11,23 7,29
Hasil Uji Waktu Hancur ODT Domperidone Replikasi II
No Waktu Hancur (detik)
Formula 1 Formula 2 Formula 3 Formula 4
1 65 37 93 59
2 82 37 87 72
3 81 34 99 68
4 75 39 103 61
5 77 30 97 65
Rata-rata 76 35,4 95,8 65
SD 6,78 3,51 6,10 5,24
KV 8,92 9,91 6,37 8,07

127
Hasil Uji Waktu Hancur ODT Domperidone Replikasi III
No Waktu Hancur (detik)
Formula 1 Formula 2 Formula 3 Formula 4
1 36 32 110 67
2 53 38 167 65
3 30 28 172 83
4 44 35 113 66
5 43 32 117 70
Rata-rata 41,2 33 135,8 70,2
SD 8,70 3,74 30,91 7,40
KV 21,12 11,34 22,76 10,54
128
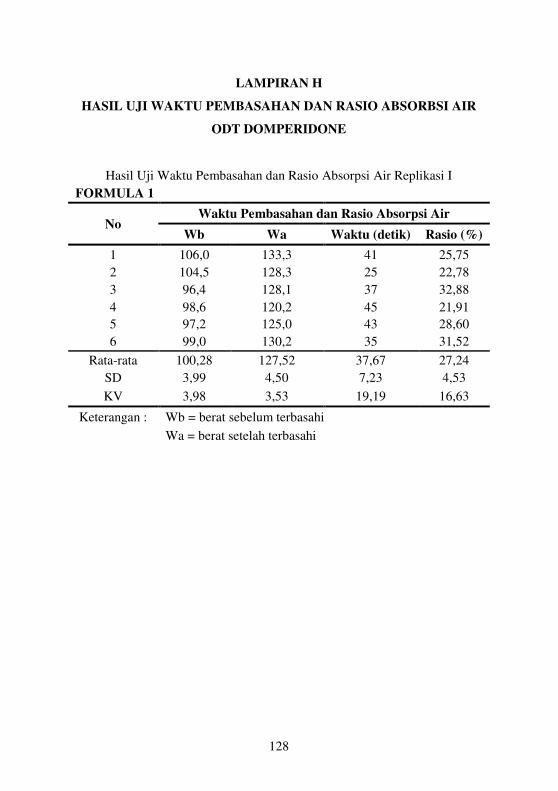
LAMPIRAN H
HASIL UJI WAKTU PEMBASAHAN DAN RASIO ABSORBSI AIR
ODT DOMPERIDONE
Hasil Uji Waktu Pembasahan dan Rasio Absorpsi Air Replikasi I
FORMULA 1
No Waktu Pembasahan dan Rasio Absorpsi Air
Wb Wa Waktu (detik) Rasio (%)
1 106,0 133,3 41 25,75
2 104,5 128,3 25 22,78
3 96,4 128,1 37 32,88
4 98,6 120,2 45 21,91
5 97,2 125,0 43 28,60
6 99,0 130,2 35 31,52
Rata-rata 100,28 127,52 37,67 27,24
SD 3,99 4,50 7,23 4,53
KV 3,98 3,53 19,19 16,63
Keterangan : Wb = berat sebelum terbasahi
Wa = berat setelah terbasahi
129
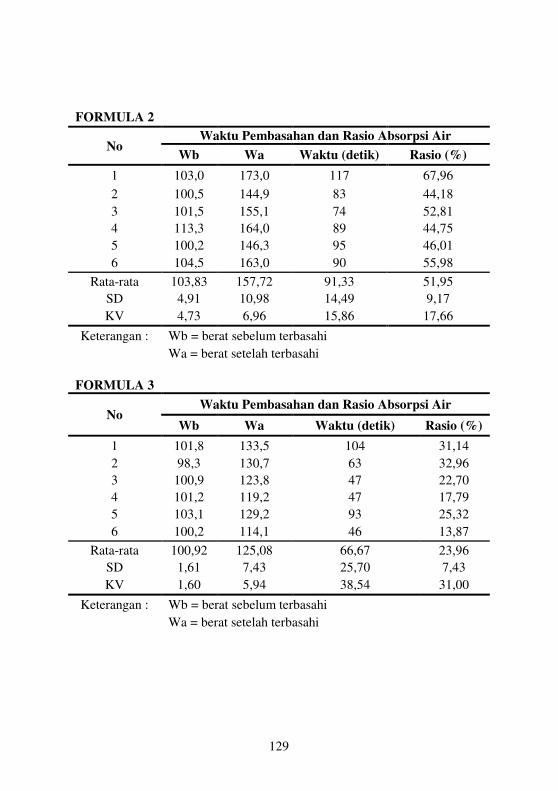
FORMULA 2
No Waktu Pembasahan dan Rasio Absorpsi Air
Wb Wa Waktu (detik) Rasio (%)
1 103,0 173,0 117 67,96
2 100,5 144,9 83 44,18
3 101,5 155,1 74 52,81
4 113,3 164,0 89 44,75
5 100,2 146,3 95 46,01
6 104,5 163,0 90 55,98
Rata-rata 103,83 157,72 91,33 51,95
SD 4,91 10,98 14,49 9,17
KV 4,73 6,96 15,86 17,66
Keterangan : Wb = berat sebelum terbasahi
Wa = berat setelah terbasahi
FORMULA 3
No Waktu Pembasahan dan Rasio Absorpsi Air
Wb Wa Waktu (detik) Rasio (%)
1 101,8 133,5 104 31,14
2 98,3 130,7 63 32,96
3 100,9 123,8 47 22,70
4 101,2 119,2 47 17,79
5 103,1 129,2 93 25,32
6 100,2 114,1 46 13,87
Rata-rata 100,92 125,08 66,67 23,96
SD 1,61 7,43 25,70 7,43
KV 1,60 5,94 38,54 31,00
Keterangan : Wb = berat sebelum terbasahi
Wa = berat setelah terbasahi

130
FORMULA 4
No Waktu Pembasahan dan Rasio Absorpsi Air
Wb Wa Waktu (detik) Rasio (%)
1 105,6 150,0 168 42,05
2 106,0 152,8 172 44,15
3 104,4 146,0 131 39,85
4 107,1 160,0 200 49,39
5 99,9 145,4 156 45,55
6 104,9 151,0 175 43,95
Rata-rata 104,65 150,87 167,00 44,15
SD 2,51 5,32 22,79 3,24
KV 2,40 3,53 13,64 7,33
Keterangan : Wb = berat sebelum terbasahi
Wa = berat setelah terbasahi
Hasil Uji Waktu Pembasahan dan Rasio Absorpsi Air Replikasi II
FORMULA 1
No Waktu Pembasahan dan Rasio Absorpsi Air
Wb Wa Waktu (detik) Rasio (%)
1 109,0 134,2 38 23,12
2 110,2 143,6 42 30,31
3 110,9 138,9 39 25,25
4 107,7 145,5 32 35,10
5 108,2 152,8 35 41,22
6 109,8 151,9 37 38,34
Rata-rata 109,30 144,48 37,17 32,22
SD 1,22 7,25 3,43 7,24
KV 1,12 5,02 9,23 22,46
Keterangan : Wb = berat sebelum terbasahi
Wa = berat setelah terbasahi

131
FORMULA 2
No Waktu Pembasahan dan Rasio Absorpsi Air
Wb Wa Waktu (detik) Rasio (%)
1 108,6 174,1 82 60,31
2 105,2 170,0 84 61,60
3 109,6 170,4 60 55,47
4 109,2 178,3 80 63,28
5 109,0 170,9 75 56,79
6 108,3 169,3 73 56,33
Rata-rata 108,32 172,17 75,67 58,96
SD 1,59 3,43 8,73 3,20
KV 1,47 2,00 11,54 5,43
Keterangan : Wb = berat sebelum terbasahi
Wa = berat setelah terbasahi
FORMULA 3
No Waktu Pembasahan dan Rasio Absorpsi Air
Wb Wa Waktu (detik) Rasio (%)
1 104,2 139,6 54 33,97
2 104,6 143,7 63 37,38
3 102,6 139,6 55 36,06
4 102,7 151,7 66 47,71
5 100,5 136,5 49 35,82
6 101,3 137,6 54 35,83
Rata-rata 102,65 141,45 56,83 37,80
SD 1,59 5,59 6,37 4,98
KV 1,55 3,95 11,21 13,17
Keterangan : Wb = berat sebelum terbasahi
Wa = berat setelah terbasahi
132
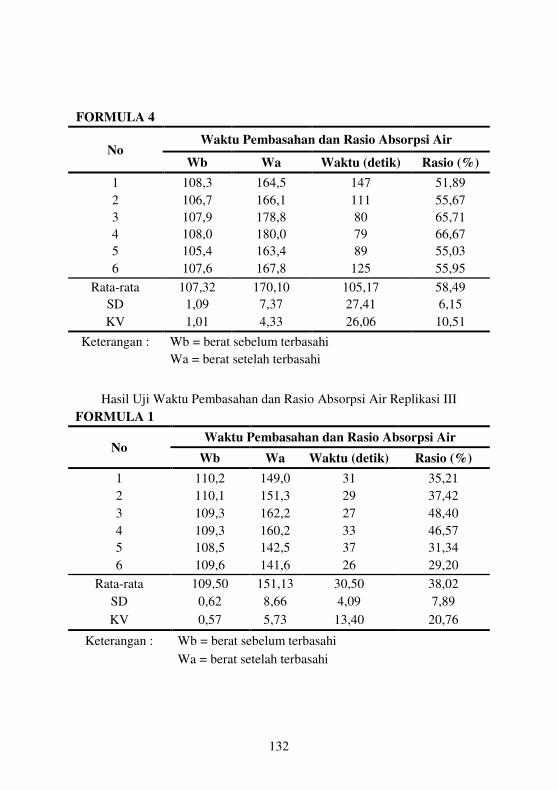
FORMULA 4
No Waktu Pembasahan dan Rasio Absorpsi Air
Wb Wa Waktu (detik) Rasio (%)
1 108,3 164,5 147 51,89
2 106,7 166,1 111 55,67
3 107,9 178,8 80 65,71
4 108,0 180,0 79 66,67
5 105,4 163,4 89 55,03
6 107,6 167,8 125 55,95
Rata-rata 107,32 170,10 105,17 58,49
SD 1,09 7,37 27,41 6,15
KV 1,01 4,33 26,06 10,51
Keterangan : Wb = berat sebelum terbasahi
Wa = berat setelah terbasahi
Hasil Uji Waktu Pembasahan dan Rasio Absorpsi Air Replikasi III
FORMULA 1
No Waktu Pembasahan dan Rasio Absorpsi Air
Wb Wa Waktu (detik) Rasio (%)
1 110,2 149,0 31 35,21
2 110,1 151,3 29 37,42
3 109,3 162,2 27 48,40
4 109,3 160,2 33 46,57
5 108,5 142,5 37 31,34
6 109,6 141,6 26 29,20
Rata-rata 109,50 151,13 30,50 38,02
SD 0,62 8,66 4,09 7,89
KV 0,57 5,73 13,40 20,76
Keterangan : Wb = berat sebelum terbasahi
Wa = berat setelah terbasahi

133
FORMULA 2
No Waktu Pembasahan dan Rasio Absorpsi Air
Wb Wa Waktu (detik) Rasio (%)
1 105,9 167,8 64 58,45
2 105,5 153,3 40 45,31
3 107,8 172,3 57 59,83
4 108,6 170,1 50 56,63
5 106,0 176,2 60 66,23
6 105,6 178,0 45 68,56
Rata-rata 106,57 169,62 52,67 59,17
SD 1,30 8,84 9,24 8,22
KV 1,22 5,21 17,55 13,89
Keterangan : Wb = berat sebelum terbasahi
Wa = berat setelah terbasahi
FORMULA 3
No Waktu Pembasahan dan Rasio Absorpsi Air
Wb Wa Waktu (detik) Rasio (%)
1 110,0 140,0 90 27,27
2 111,8 142,0 97 27,01
3 106,6 126,0 51 18,20
4 111,5 148,3 68 33,00
5 111,8 137,3 73 22,81
6 113,0 136,1 52 20,44
Rata-rata 110,78 138,28 71,83 24,79
SD 2,26 7,40 19,01 5,38
KV 2,04 5,35 26,46 21,71
Keterangan : Wb = berat sebelum terbasahi
Wa = berat setelah terbasahi
134
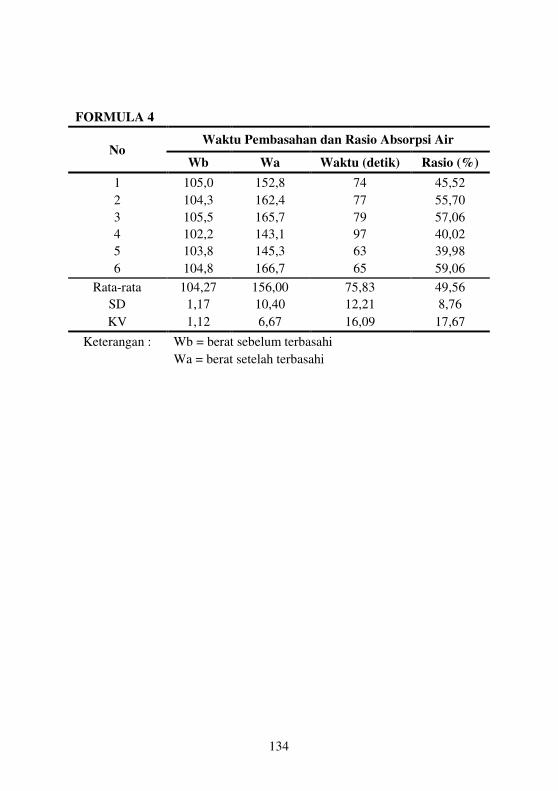
FORMULA 4
No Waktu Pembasahan dan Rasio Absorpsi Air
Wb Wa Waktu (detik) Rasio (%)
1 105,0 152,8 74 45,52
2 104,3 162,4 77 55,70
3 105,5 165,7 79 57,06
4 102,2 143,1 97 40,02
5 103,8 145,3 63 39,98
6 104,8 166,7 65 59,06
Rata-rata 104,27 156,00 75,83 49,56
SD 1,17 10,40 12,21 8,76
KV 1,12 6,67 16,09 17,67
Keterangan : Wb = berat sebelum terbasahi
Wa = berat setelah terbasahi
135
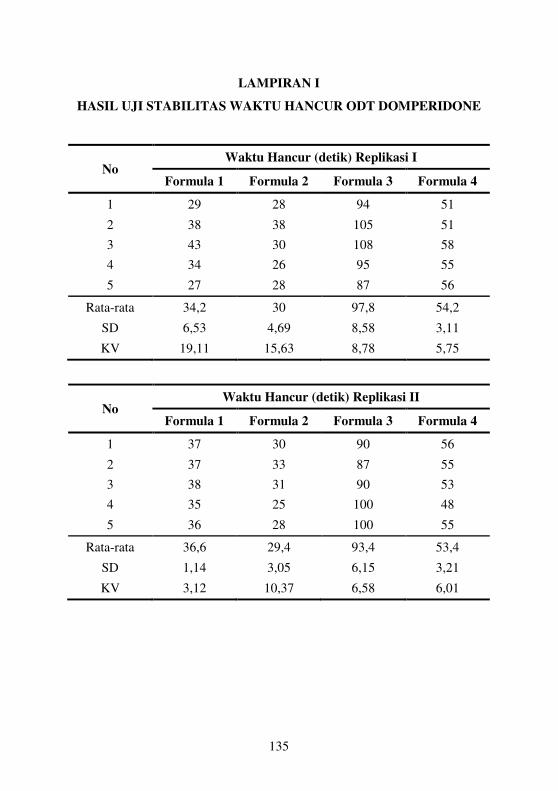
LAMPIRAN I
HASIL UJI STABILITAS WAKTU HANCUR ODT DOMPERIDONE
No Waktu Hancur (detik) Replikasi I
Formula 1 Formula 2 Formula 3 Formula 4
1 29 28 94 51
2 38 38 105 51
3 43 30 108 58
4 34 26 95 55
5 27 28 87 56
Rata-rata 34,2 30 97,8 54,2
SD 6,53 4,69 8,58 3,11
KV 19,11 15,63 8,78 5,75
No Waktu Hancur (detik) Replikasi II
Formula 1 Formula 2 Formula 3 Formula 4
1 37 30 90 56
2 37 33 87 55
3 38 31 90 53
4 35 25 100 48
5 36 28 100 55
Rata-rata 36,6 29,4 93,4 53,4
SD 1,14 3,05 6,15 3,21
KV 3,12 10,37 6,58 6,01

136
No Waktu Hancur (detik) Replikasi III
Formula 1 Formula 2 Formula 3 Formula 4
1 29 26 95 42
2 30 26 93 52
3 41 28 100 49
4 34 26 103 60
5 35 26 102 50
Rata-rata 33,8 26,4 98,6 50,6
SD 4,76 0,89 4,39 6,47
KV 14,10 3,39 4,46 12,78
137
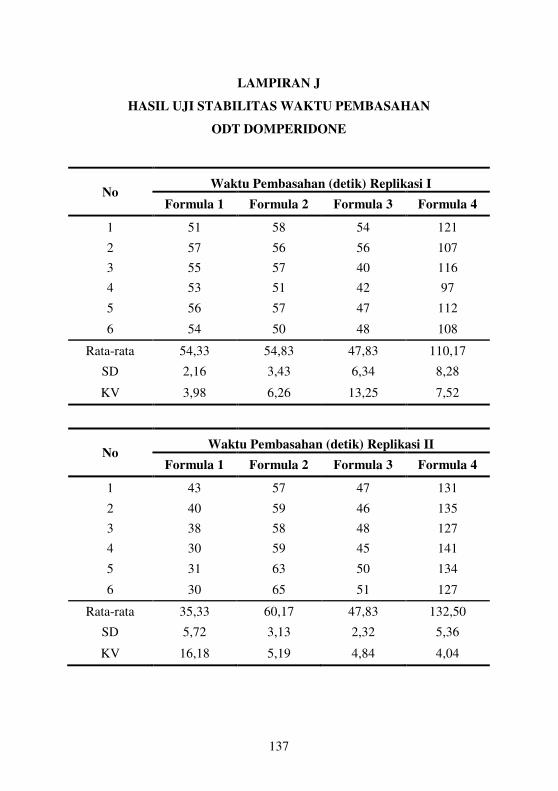
LAMPIRAN J
HASIL UJI STABILITAS WAKTU PEMBASAHAN
ODT DOMPERIDONE
No Waktu Pembasahan (detik) Replikasi I
Formula 1 Formula 2 Formula 3 Formula 4
1 51 58 54 121
2 57 56 56 107
3 55 57 40 116
4 53 51 42 97
5 56 57 47 112
6 54 50 48 108
Rata-rata 54,33 54,83 47,83 110,17
SD 2,16 3,43 6,34 8,28
KV 3,98 6,26 13,25 7,52
No Waktu Pembasahan (detik) Replikasi II
Formula 1 Formula 2 Formula 3 Formula 4
1 43 57 47 131
2 40 59 46 135
3 38 58 48 127
4 30 59 45 141
5 31 63 50 134
6 30 65 51 127
Rata-rata 35,33 60,17 47,83 132,50
SD 5,72 3,13 2,32 5,36
KV 16,18 5,19 4,84 4,04

138
No Waktu Pembasahan (detik) Replikasi III
Formula 1 Formula 2 Formula 3 Formula 4
1 53 60 55 108
2 40 63 60 94
3 45 63 52 132
4 52 62 58 112
5 48 57 46 110
6 58 70 57 109
Rata-rata 49,33 62,50 54,67 110,83
SD 6,38 4,32 5,05 12,21
KV 12,93 6,92 9,23 11,01

139
LAMPIRAN K
HASIL UJI PENETAPAN KADAR ODT DOMPERIDONE
Hasil Uji Penetapan Kadar ODT Dompeidone
Formula 1
Rep Massa
/tablet
Massa
(mg) Abs.
C
sampel
(ppm)
C
teoritis
(ppm)
%
Kadar
Rata-
rata SD
KV
(%)
1 99,585 100,6 0,253 7,86 8,08 97,24
2 109,47 100,1 0,243 7,51 7,32 102,60 102,55 5,29 5,16
3 105,14 100,1 0,263 8,21 7,62 107,82
Hasil Uji Penetapan Kadar ODT Dompeidone
Formula 2
Rep Massa
/tablet
Massa
(mg) Abs.
C
sampel
(ppm)
C
teoritis
(ppm)
%
Kadar
Rata-
rata SD
KV
(%)
1 103,97 100,1 0,249 7,72 7,70 100,20
2 108,85 100,6 0,248 7,68 7,39 103,90 103,14 2,64 2,56
3 106,42 100,6 0,256 7,96 7,56 105,32
Hasil Uji Penetapan Kadar ODT Dompeidone
Formula 3
Rep Massa
/tablet
Massa
(mg) Abs.
C
sampel
(ppm)
C
teoritis
(ppm)
%
Kadar
Rata-
rata SD
KV
(%)
1 99,35 100,4 0,268 8,39 8,08 103,76
2 103,185 100,2 0,242 7,47 7,77 96,16 101,89 5,07 4,97
3 110,245 100,1 0,248 7,68 7,26 105,76

140
Hasil Uji Penetapan Kadar ODT Dompeidone
Formula 4
Rep Massa
/tablet
Massa
(mg) Abs.
C
sampel
(ppm)
C
teoritis
(ppm)
%
Kadar
Rata-
rata SD
KV
(%)
1 105,815 100,3 0,258 8,04 7,58 105,96
2 107,445 100,6 0,244 7,54 7,49 100,67 103,13 2,67 2,59
3 103,52 100,3 0,256 7,96 7,75 102,75

141
LAMPIRAN L
HASIL UJI PENETAPAN KADAR TABLET PEMBANDING
DOMPERIDONE
Hasil Uji Penetapan Kadar Tablet
Pembanding 1
Rep
Massa
/tablet
(mg)
Massa
(mg) Abs.
C
sampel
(ppm)
C
teoritis
(ppm)
%
Kadar
Rata-
rata SD
KV
(%)
I 119,8 99,8 0,209 6,30 6,66 94,50
II 123,4 100,3 0,211 6,37 6,50 97,95 96,50 1,78 1,85
III 121,1 101 0,214 6,47 6,67 97,04
Hasil Uji Penetapan Kadar Tablet
Pembanding 2
Rep
Massa
/tablet
(mg)
Massa
(mg) Abs.
C
sampel
(ppm)
C
teoritis
(ppm)
%
Kadar
Rata-
rata SD
KV
(%)
I 121,5 100,3 0,229 7,00 6,60 106,06
II 125,4 99,7 0,213 6,44 6,36 101,24 103,05 2,62 2,55
III 124,6 100,1 0,216 6,55 6,43 101,84

142
LAMPIRAN M
HASIL UJI DISOLUSI ODT DOMPERIDONE
FORMULA 1
Rep t (menit) Abs. C
(µg/ml)
Wt
(mg)
% obat
terlepas
AUC (µg
menit /
ml)
I
0 0 0 0 0 0
0,5 0,232 7,12 6,4 65,87 1,60
1 0,275 8,64 7,8 79,93 3,54
2 0,29 9,17 8,2 84,83 8,01
4 0,273 8,57 7,7 79,27 15,96
6 0,263 8,21 7,4 76,00 15,10
8 0,273 8,57 7,7 79,27 15,10
10 0,259 8,07 7,3 74,70 14,97
15 0,257 8,00 7,2 74,04 36,16
20 0,249 7,72 6,9 71,43 35,36
25 0,251 7,79 7,0 72,08 34,89
30 0,247 7,65 6,9 70,77 34,73
Σ AUC
% ED
215,42
73,84

143
Rep t (menit) Abs. C
(µg/ml)
Wt
(mg)
% obat
terlepas
AUC (µg
menit /
ml)
II
0 0 0 0 0 0
0,5 0,13 3,51 3,2 30,81 0,79
1 0,206 6,20 5,6 54,37 2,18
2 0,289 9,13 8,2 80,10 6,90
4 0,291 9,20 8,3 80,72 16,50
6 0,293 9,27 8,3 81,34 16,63
8 0,295 9,34 8,4 81,96 16,75
10 0,296 9,38 8,4 82,27 16,85
15 0,292 9,24 8,3 81,03 41,88
20 0,29 9,17 8,2 80,41 41,41
25 0,29 9,17 8,2 80,41 41,25
30 0,288 9,10 8,2 79,79 41,09
Σ AUC
% ED
242,23
78,70
III
0 0 0 0 0 0
0,5 0,073 1,50 1,3 12,51 0,34
1 0,281 8,85 8,0 73,86 2,33
2 0,297 9,41 8,5 78,58 8,22
4 0,303 9,63 8,7 80,35 17,13
6 0,301 9,55 8,6 79,76 17,26
8 0,302 9,59 8,6 80,05 17,23
10 0,3 9,52 8,6 79,46 17,20
15 0,311 9,91 8,9 82,71 43,71
20 0,314 10,01 9,0 83,59 44,83
25 0,298 9,45 8,5 78,87 43,79
30 0,296 9,38 8,4 78,28 42,36
Σ AUC
% ED
254,40
78,65
144
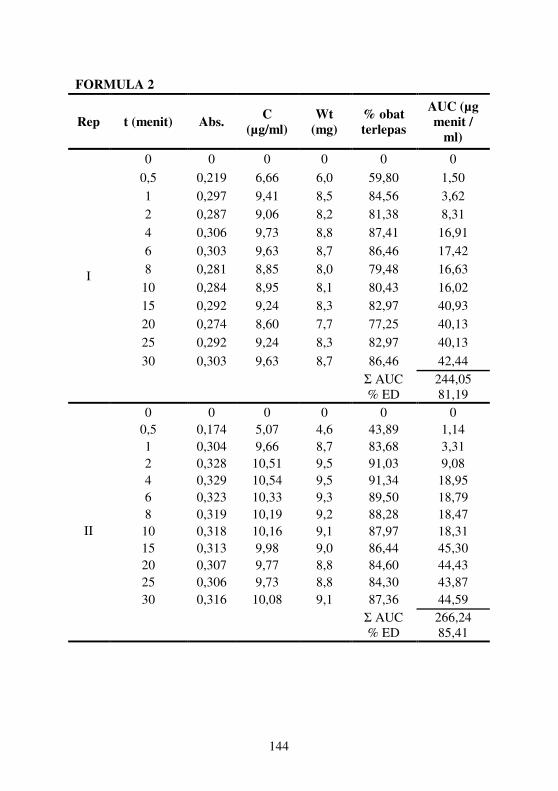
FORMULA 2
Rep t (menit) Abs. C
(µg/ml)
Wt
(mg)
% obat
terlepas
AUC (µg
menit /
ml)
I
0 0 0 0 0 0
0,5 0,219 6,66 6,0 59,80 1,50
1 0,297 9,41 8,5 84,56 3,62
2 0,287 9,06 8,2 81,38 8,31
4 0,306 9,73 8,8 87,41 16,91
6 0,303 9,63 8,7 86,46 17,42
8 0,281 8,85 8,0 79,48 16,63
10 0,284 8,95 8,1 80,43 16,02
15 0,292 9,24 8,3 82,97 40,93
20 0,274 8,60 7,7 77,25 40,13
25 0,292 9,24 8,3 82,97 40,13
30 0,303 9,63 8,7 86,46 42,44
Σ AUC
% ED
244,05
81,19
0 0 0 0 0 0
II
0,5 0,174 5,07 4,6 43,89 1,14
1 0,304 9,66 8,7 83,68 3,31
2 0,328 10,51 9,5 91,03 9,08
4 0,329 10,54 9,5 91,34 18,95
6 0,323 10,33 9,3 89,50 18,79
8 0,319 10,19 9,2 88,28 18,47
10 0,318 10,16 9,1 87,97 18,31
15 0,313 9,98 9,0 86,44 45,30
20 0,307 9,77 8,8 84,60 44,43
25 0,306 9,73 8,8 84,30 43,87
30 0,316 10,08 9,1 87,36 44,59
Σ AUC
% ED
266,24
85,41
145
Rep t
(menit) Abs. C (µg/ml)
Wt
(mg)
% obat
terlepas
AUC (µg
menit /
ml)
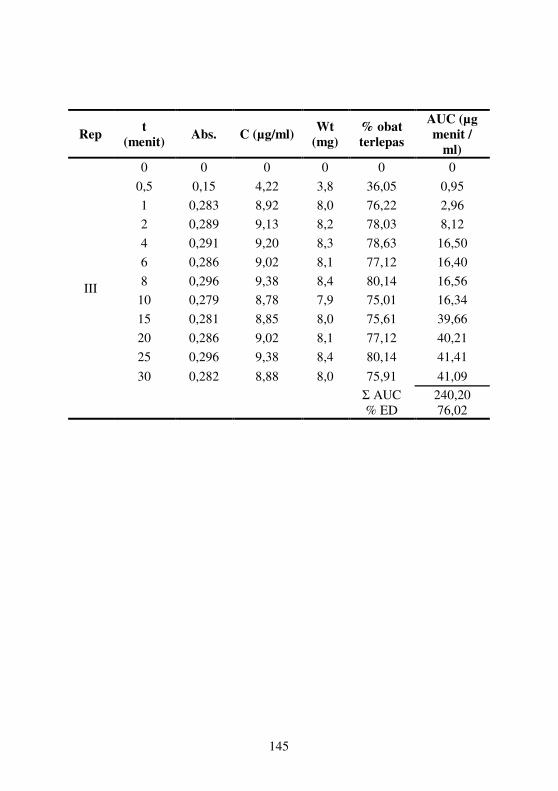
III
0 0 0 0 0 0
0,5 0,15 4,22 3,8 36,05 0,95
1 0,283 8,92 8,0 76,22 2,96
2 0,289 9,13 8,2 78,03 8,12
4 0,291 9,20 8,3 78,63 16,50
6 0,286 9,02 8,1 77,12 16,40
8 0,296 9,38 8,4 80,14 16,56
10 0,279 8,78 7,9 75,01 16,34
15 0,281 8,85 8,0 75,61 39,66
20 0,286 9,02 8,1 77,12 40,21
25 0,296 9,38 8,4 80,14 41,41
30 0,282 8,88 8,0 75,91 41,09
Σ AUC
% ED
240,20
76,02

146
FORMULA 3
Rep t (menit) Abs. C
(µg/ml)
Wt
(mg)
% obat
terlepas
AUC (µg
menit /
ml)
I
0 0 0 0 0 0
0,5 0,092 2,17 2,0 18,82 0,49
1 0,17 4,93 4,4 42,72 1,60
2 0,296 9,38 8,4 81,34 6,44
4 0,297 9,41 8,5 81,65 16,91
6 0,285 8,99 8,1 77,97 16,56
8 0,279 8,78 7,9 76,13 15,99
10 0,283 8,92 8,0 77,36 15,93
15 0,29 9,17 8,2 79,50 40,69
20 0,272 8,53 7,7 73,99 39,82
25 0,283 8,92 8,0 77,36 39,26
30 0,285 8,99 8,1 77,97 40,29
Σ AUC
% ED
233,97
75,16
II
0 0 0 0 0 0
0,5 0,087 1,99 1,8 18,65 0,45
1 0,246 7,61 6,9 71,24 2,16
2 0,3 9,52 8,6 89,10 7,71
4 0,302 9,59 8,6 89,76 17,20
6 0,299 9,48 8,5 88,77 17,17
8 0,303 9,63 8,7 90,09 17,20
10 0,297 9,41 8,5 88,11 17,13
15 0,3 9,52 8,6 89,10 42,60
20 0,297 9,41 8,5 88,11 42,60
25 0,284 8,95 8,1 83,81 41,33
30 0,294 9,31 8,4 87,12 41,09
Σ AUC
% ED
246,63
85,50

147
Rep t
(menit) Abs. C (µg/ml)
Wt
(mg)
% obat
terlepas
AUC (µg
menit /
ml)
III
0 0 0 0 0 0
0,5 0,061 1,07 1,0 9,14 0,24
1 0,218 6,62 6,0 56,35 1,73
2 0,287 9,06 8,2 77,10 7,06
4 0,31 9,87 8,9 84,02 17,04
6 0,302 9,59 8,6 81,61 17,52
8 0,309 9,84 8,9 83,72 17,48
10 0,307 9,77 8,8 83,12 17,64
15 0,309 9,84 8,9 83,72 44,11
20 0,301 9,55 8,6 81,31 43,63
25 0,301 9,55 8,6 81,31 43,00
30 0,293 9,27 8,3 78,91 42,36
Σ AUC
% ED
251,81
79,37
148
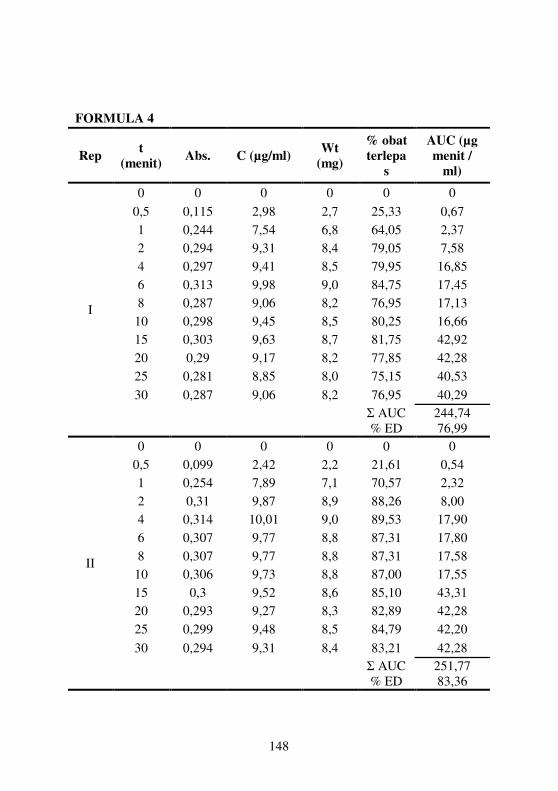
FORMULA 4
Rep t
(menit) Abs. C (µg/ml)
Wt
(mg)
% obat
terlepa
s
AUC (µg
menit /
ml)
I
0 0 0 0 0 0
0,5 0,115 2,98 2,7 25,33 0,67
1 0,244 7,54 6,8 64,05 2,37
2 0,294 9,31 8,4 79,05 7,58
4 0,297 9,41 8,5 79,95 16,85
6 0,313 9,98 9,0 84,75 17,45
8 0,287 9,06 8,2 76,95 17,13
10 0,298 9,45 8,5 80,25 16,66
15 0,303 9,63 8,7 81,75 42,92
20 0,29 9,17 8,2 77,85 42,28
25 0,281 8,85 8,0 75,15 40,53
30 0,287 9,06 8,2 76,95 40,29
Σ AUC
% ED
244,74
76,99
II
0 0 0 0 0 0
0,5 0,099 2,42 2,2 21,61 0,54
1 0,254 7,89 7,1 70,57 2,32
2 0,31 9,87 8,9 88,26 8,00
4 0,314 10,01 9,0 89,53 17,90
6 0,307 9,77 8,8 87,31 17,80
8 0,307 9,77 8,8 87,31 17,58
10 0,306 9,73 8,8 87,00 17,55
15 0,3 9,52 8,6 85,10 43,31
20 0,293 9,27 8,3 82,89 42,28
25 0,299 9,48 8,5 84,79 42,20
30 0,294 9,31 8,4 83,21 42,28
Σ AUC
% ED
251,77
83,36

149
Rep t
(menit) Abs. C (µg/ml)
Wt
(mg)
% obat
terlepa
s
AUC (µg
menit /
ml)
III
0 0 0 0 0 0
0,5 0,153 4,33 3,9 37,88 0,97
1 0,262 8,18 7,4 71,62 2,81
2 0,282 8,88 8,0 77,81 7,68
4 0,291 9,20 8,3 80,59 16,28
6 0,295 9,34 8,4 81,83 16,69
8 0,289 9,13 8,2 79,97 16,63
10 0,292 9,24 8,3 80,90 16,53
15 0,287 9,06 8,2 79,35 41,17
20 0,285 8,99 8,1 78,74 40,61
25 0,283 8,92 8,0 78,12 40,29
30 0,279 8,78 7,9 76,88 39,82
Σ AUC
% ED
239,47
77,69

150
LAMPIRAN N
HASIL UJI DISOLUSI TABLET PEMBANDING DOMPERIDONE
Pembanding 1
Rep t (menit) Abs. C
(µg/ml)
Wt
(mg)
% obat
terlepas
AUC (µg
menit /
ml)
I
0 0 0 0 0 0
0,5 0,167 4,82 4,3 45,86 1,08
1 0,204 6,12 5,5 58,30 2,46
2 0,306 9,72 8,7 92,59 7,13
4 0,312 9,93 8,9 94,60 17,69
6 0,322 10,29 9,3 97,97 18,20
8 0,334 10,71 9,6 102,00 18,90
10 0,321 10,25 9,2 97,63 18,87
15 0,327 10,46 9,4 99,65 46,61
20 0,307 9,76 8,8 92,92 45,50
25 0,313 9,97 9,0 94,94 44,39
30 0,319 10,18 9,2 96,96 45,34
Σ AUC
% ED
266,16
93,88

151
Rep t (menit) Abs. C
(µg/ml)
Wt
(mg)
% obat
terlepas
AUC (µg
menit /
ml)
II
0 0 0 0 0 0
0,5 0,117 3,05 2,7 28,03 0,69
1 0,240 7,39 6,7 67,93 2,35
2 0,277 8,70 7,8 79,93 7,24
4 0,310 9,86 8,9 90,63 16,71
6 0,324 10,36 9,3 95,17 18,20
8 0,328 10,50 9,4 96,47 18,77
10 0,320 10,22 9,2 93,88 18,64
15 0,310 9,86 8,9 90,63 45,18
20 0,326 10,43 9,4 95,82 45,66
25 0,318 10,15 9,1 93,23 46,29
30 0,322 10,29 9,3 94,52 45,97
Σ AUC
% ED
265,70
90,42
III
0 0 0 0 0 0
0,5 0,148 4,15 3,7 38,44 0,93
1 0,227 6,93 6,2 64,31 2,49
2 0,248 7,67 6,9 71,18 6,57
4 0,285 8,98 8,1 83,29 14,99
6 0,327 10,46 9,4 97,04 17,50
8 0,328 10,50 9,4 97,37 18,87
10 0,314 10,00 9,0 92,79 18,45
15 0,325 10,39 9,4 96,39 45,89
20 0,306 9,72 8,7 90,17 45,26
25 0,319 10,18 9,2 94,42 44,78
30 0,326 10,43 9,4 96,72 46,37
Σ AUC
% ED
262,11
90,04

152
Pembanding 2
Rep t (menit) Abs. C
(µg/ml) Wt (mg)
% obat
terlepas
AUC (µg
menit /
ml)
I
0 0 0 0 0 0
0,5 0,145 4,04 3,6 34,28 0,91
1 0,284 8,95 8,1 75,91 2,92
2 0,342 10,99 9,9 93,28 8,97
4 0,351 11,31 10,2 95,98 20,07
6 0,358 11,56 10,4 98,08 20,58
8 0,348 11,20 10,1 95,08 20,49
10 0,333 10,68 9,6 90,59 19,69
15 0,343 11,03 9,9 93,58 48,83
20 0,350 11,28 10,1 95,68 50,18
25 0,341 10,96 9,9 92,99 50,02
30 0,342 10,99 9,9 93,28 49,39
Σ AUC
% ED
292,06
94,48
II
0 0 0 0 0 0
0,5 0,196 5,84 5,3 51,91 1,31
1 0,208 6,26 5,6 55,68 2,72
2 0,291 9,19 8,3 81,72 6,96
4 0,352 11,35 10,2 100,86 18,48
6 0,346 11,13 10,0 98,98 20,23
8 0,338 10,85 9,8 96,47 19,79
10 0,336 10,78 9,7 95,84 19,47
15 0,341 10,96 9,9 97,41 48,91
20 0,331 10,60 9,5 94,27 48,51
25 0,334 10,71 9,6 95,21 47,96
30 0,326 10,43 9,4 92,70 47,56
Σ AUC
% ED
281,91
92,82

153
Rep t (menit) Abs. C
(µg/ml) Wt (mg)
% obat
terlepa
s
AUC (µg
menit /
ml)
III
0 0 0 0 0 0
0,5 0,13 3,51 3,2 31,02 0,79
1 0,241 7,43 6,7 65,64 2,46
2 0,341 10,96 9,9 96,84 8,27
4 0,359 11,59 10,4 102,45 20,30
6 0,348 11,20 10,1 99,02 20,52
8 0,352 11,35 10,2 100,27 20,30
10 0,347 11,17 10,1 98,71 20,26
15 0,337 10,82 9,7 95,59 49,47
20 0,344 11,06 10,0 97,77 49,23
25 0,312 9,93 8,9 87,79 47,24
30 0,331 10,60 9,5 93,72 46,21
Σ AUC
% ED
285,05
93,30

154
LAMPIRAN O
CONTOH PERHITUNGAN
Contoh perhitungan indeks kompresibilitas:
Formula 1 :
Berat gelas = 116,5536 g (W1)
Berat gelas + granul = 163,9652 g (W2)
V1 = 100 mL, V2 = 79 mL
Bj nyata =
1
12 )(
V
WW −=
100
) 116,5536 163,9652( −= 0,4741 g/mL
Bj mampat =
2
12 )(
V
WW − = 79
) 116,5536 163,9652( − = 0,6001 g/mL
Hausner Ratio = bjnyata
bjmampat = 1,27
% Carr’s Index = %100.
.1 x
mampatBj
nyataBj
− = 21%
Contoh perhitungan akurasi & presisi:
Absorbansi = 0,260 → y = 0,0283x + 0,0306
Konsentrasi sampel (x) = 8,10601 ppm ≈ 8,11 ppm
Berat domperidone = 70,5 mg
Berat matriks = 630,0 mg
Berat sampel = 100,7 mg
Kons.
(%)
Massa
(mg) Abs.
Kons.
(µg/ml)
Teoritis
(µg/ml)
Perolehan
Kembali
(%)
100 100,7 0,260 8,11 8,11 99,98
155
Konsentrasi teoritis =
=
= 8,10775 ppm ≈ 8,11 ppm
% Perolehan Kembali =
=
= 99,98%
% KV =
=
= 1,42%
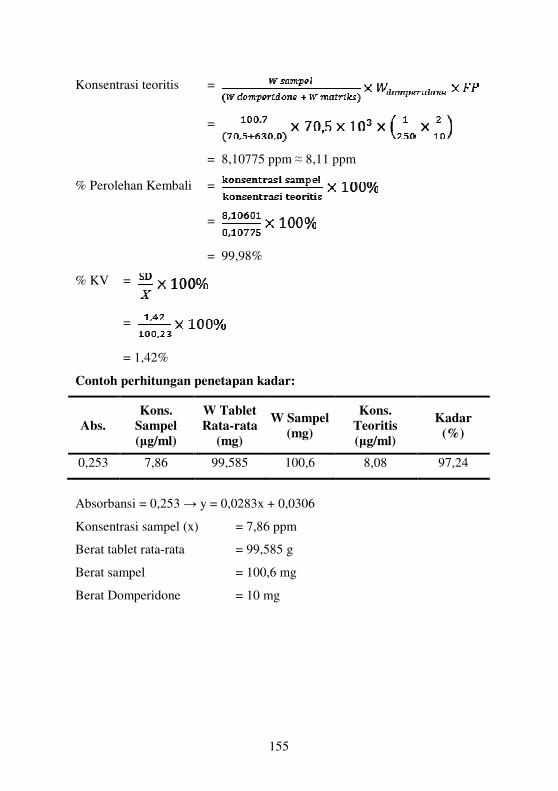
Contoh perhitungan penetapan kadar:
Abs.
Kons.
Sampel
(µg/ml)
W Tablet
Rata-rata
(mg)
W Sampel
(mg)
Kons.
Teoritis
(µg/ml)
Kadar
(%)
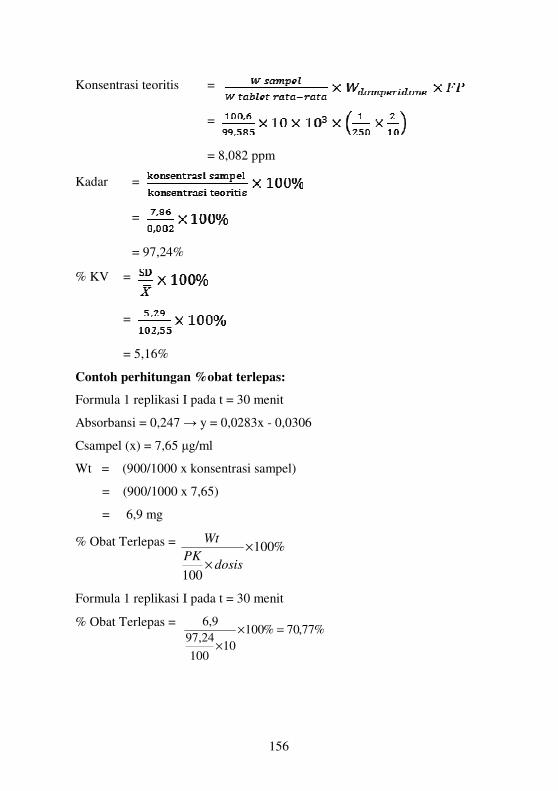
0,253 7,86 99,585 100,6 8,08 97,24
Absorbansi = 0,253 → y = 0,0283x + 0,0306
Konsentrasi sampel (x) = 7,86 ppm
Berat tablet rata-rata = 99,585 g
Berat sampel = 100,6 mg
Berat Domperidone = 10 mg
156
Konsentrasi teoritis =
=
= 8,082 ppm
Kadar =
=
= 97,24%
% KV =
=
= 5,16%
Contoh perhitungan %obat terlepas:
Formula 1 replikasi I pada t = 30 menit
Absorbansi = 0,247 → y = 0,0283x - 0,0306
Csampel (x) = 7,65 µg/ml
Wt = (900/1000 x konsentrasi sampel)
= (900/1000 x 7,65)
= 6,9 mg
% Obat Terlepas = %100
100
×
× dosisPK
Wt
Formula 1 replikasi I pada t = 30 menit
% Obat Terlepas = %77,70%100
10100
97,24
6,9=×
×

157
Contoh perhitungan AUC pada disolusi:
Rumus:
Formula 1 replikasi I
tn-1 = 25 menit Wtn-1 = 7,0 mg
tn = 30 menit Wtn = 6,9 mg
AUC = )2530(2
0,79,6−
+x = 34,73
Luas □ = 30 x penetapan kadar x dosis
= 30 x 0,9724 x 10 mg
= 291,72629
% ED Formula 1 replikasi I = (∑ AUC / luas□) x 100%
= (251,42/291,72629) x 100%
= 73,84%
158
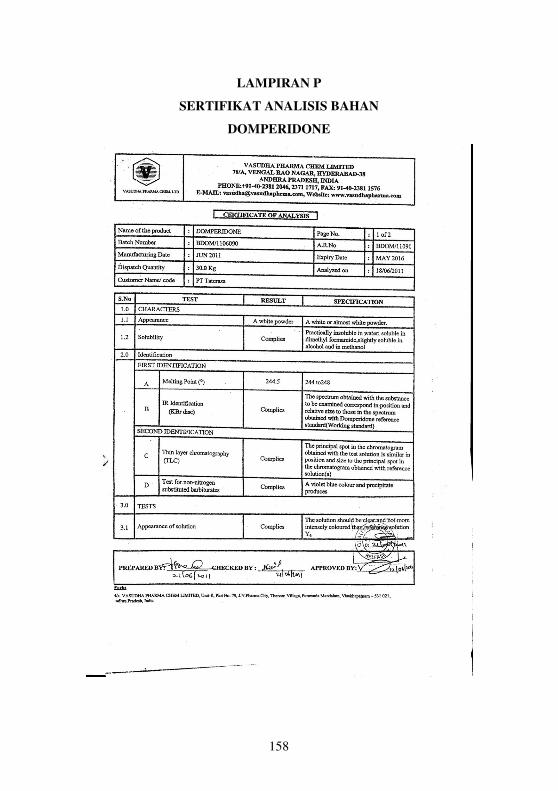
LAMPIRAN P
SERTIFIKAT ANALISIS BAHAN
DOMPERIDONE

159

160
MANITOL

161
AC-DI-SOL

162
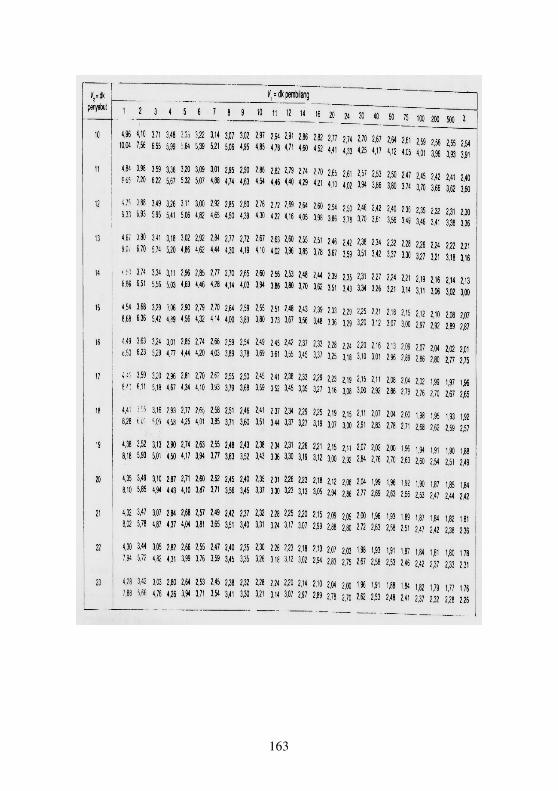
LAMPIRAN Q
TABEL UJI F
163

164
LAMPIRAN R
TABEL UJI R
Dikutip dari: Soedigdo & Soedigdo (1977)

165
LAMPIRAN S
TABEL UJI HSD (0,05)

166
LAMPIRAN T
TABEL UJI T

167
LAMPIRAN U
HASIL UJI STATISTIK KEKERASAN ODT DOMPERIDONE
Descriptives
kekerasan
N Mean
Std.
Devia
-tion
Std.
Error
95%
Confidence
Interval for
Mean Min Max
Lower
Bound
Upper
Bound
1 3 3.0133 .20817 .12019 2.4962 3.5304 2.78 3.18
2 3 2.8767 .42477 .24524 1.8215 3.9319 2.42 3.26
3 3 3.2167 .06351 .03667 3.0589 3.3744 3.18 3.29
4 3 2.7700 .35086 .20257 1.8984 3.6416 2.38 3.06
Total 12 2.9692 .30690 .08860 2.7742 3.1642 2.38 3.29
Test of Homogeneity of Variances
kekerasan
Levene Statistic df1 df2 Sig.
2.214 3 8 .164
ANOVA
kekerasan
Sum of Squares df Mean Square F Sig.
Between Groups .334 3 .111 1.270 .348
Within Groups .702 8 .088
Total 1.036 11
Keterangan:
Ho diterima jika Fhitung (1,270) < Ftabel 0,05 (3,8) (4,07), berarti rata-rata
kekerasan tablet dari keempat formula menunjukkan bahwa tidak ada
perbedaan yang signifikan antar formula.

168
LAMPIRAN V
HASIL UJI STATISTIK KERAPUHAN ODT DOMPERIDONE
Descriptives
kerapuhan
N Mean
Std.
Devia
-tion
Std.
Error
95%
Confidence
Interval for
Mean Min Max
Lower
Bound
Upper
Bound
1 3 .8300 .59758 .34501 -.6545 2.3145 .48 1.52
2 3 .8167 .58321 .33672 -.6321 2.2654 .47 1.49
3 3 .3367 .29195 .16856 -.3886 1.0619 .00 .52
4 3 .8100 .58924 .34020 -.6537 2.2737 .45 1.49
Total 12 .6983 .50301 .14521 .3787 1.0179 .00 1.52
Test of Homogeneity of Variances
kerapuhan
Levene Statistic df1 df2 Sig.
1.256 3 8 .353
ANOVA
kerapuhan
Sum of Squares df Mean Square F Sig.
Between Groups .524 3 .175 .618 .622
Within Groups 2.259 8 .282
Total 2.783 11
Keterangan:
Ho diterima jika Fhitung (0,618) < Ftabel 0,05 (3,8) (4,07), berarti rata-rata
kerapuhan tablet dari keempat formula menunjukkan bahwa tidak ada
perbedaan yang signifikan antar formula.
169
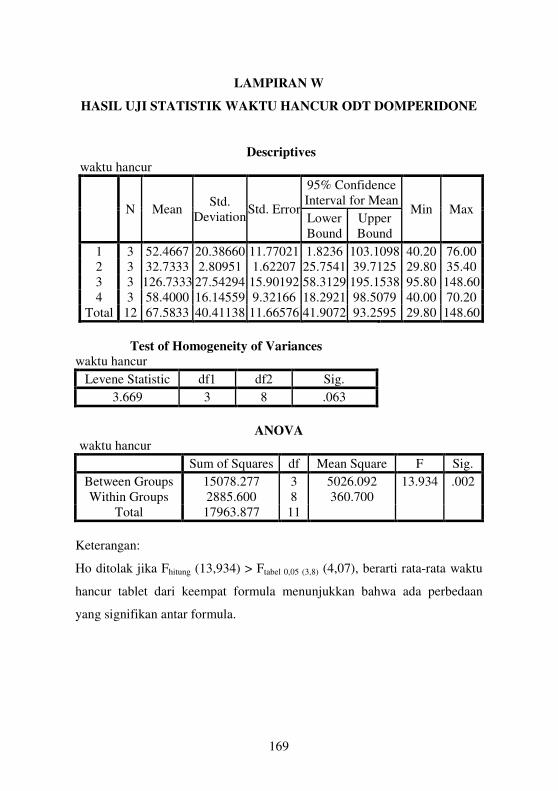
LAMPIRAN W
HASIL UJI STATISTIK WAKTU HANCUR ODT DOMPERIDONE
Descriptives
waktu hancur
N Mean Std.
Deviation Std. Error
95% Confidence
Interval for Mean Min Max
Lower
Bound
Upper
Bound
1 3 52.4667 20.38660 11.77021 1.8236 103.1098 40.20 76.00
2 3 32.7333 2.80951 1.62207 25.7541 39.7125 29.80 35.40
3 3 126.7333 27.54294 15.90192 58.3129 195.1538 95.80 148.60
4 3 58.4000 16.14559 9.32166 18.2921 98.5079 40.00 70.20
Total 12 67.5833 40.41138 11.66576 41.9072 93.2595 29.80 148.60
Test of Homogeneity of Variances
waktu hancur
Levene Statistic df1 df2 Sig.
3.669 3 8 .063
ANOVA
waktu hancur
Sum of Squares df Mean Square F Sig.
Between Groups 15078.277 3 5026.092 13.934 .002
Within Groups 2885.600 8 360.700
Total 17963.877 11
Keterangan:
Ho ditolak jika Fhitung (13,934) > Ftabel 0,05 (3,8) (4,07), berarti rata-rata waktu
hancur tablet dari keempat formula menunjukkan bahwa ada perbedaan
yang signifikan antar formula.

170
Multiple Comparisons waktu hancur
HSD
(I)
formula
(J)
formula
Mean
Difference
(I-J)
Std. Error Sig.
95% Confidence
Interval
Lower
Bound
Upper
Bound
1
2 19.73333 15.50699 .239 -16.0258 55.4925
3 -74.26667* 15.50699 .001 -110.0258 -38.5075
4 -5.93333 15.50699 .712 -41.6925 29.8258
2
1 -19.73333 15.50699 .239 -55.4925 16.0258
3 -94.00000* 15.50699 .000 -129.7592 -58.2408
4 -25.66667 15.50699 .136 -61.4258 10.0925
3
1 74.26667* 15.50699 .001 38.5075 110.0258
2 94.00000* 15.50699 .000 58.2408 129.7592
4 68.33333* 15.50699 .002 32.5742 104.0925
4
1 5.93333 15.50699 .712 -29.8258 41.6925
2 25.66667 15.50699 .136 -10.0925 61.4258
3 -68.33333* 15.50699 .002 -104.0925 -32.5742
*. The mean difference is significant at the 0.05 level.
Keterangan:
Hasil uji HSD dari keempat formula, diperoleh nilai sig. < α (0,05) sehingga
Ho ditolak (*), berarti rata-rata waktu hancur tablet dari keempat formula
menunjukkan bahwa ada perbedaan yang signifikan antar formula, yaitu
formula 1 menunjukkan perbedaan yang signifikan terhadap formula 3;
formula 2 menunjukkan perbedaan yang signifikan terhadap formula 3;
formula 3 menunjukkan perbedaan yang signifikan terhadap formula 4,
sedangkan formula 1 tidak menunjukkan perbedaan yang signifikan
terhadap formula 2 dan formula 4.

171
LAMPIRAN X
HASIL UJI STATISTIK WAKTU PEMBASAHAN ODT
DOMPERIDONE
Descriptives waktu pembasahan
N Mean Std.
Deviation Std. Error
95% Confidence
Interval for Mean Min Max
Lower
Bound
Upper
Bound
1 3 35.1133 4.00308 2.31118 25.1691 45.0575 30.50 37.67
2 3 73.2233 19.44578 11.22703 24.9173 121.5293 52.67 91.33
3 3 65.1100 7.62071 4.39982 46.1791 84.0409 56.83 71.83
4 3 116.0000 46.53986 26.86980 .3886 231.6114 75.83 167.00
Total 12 72.3617 37.26028 10.75612 48.6876 96.0357 30.50 167.00
Test of Homogeneity of Variances
waktu pembasahan
Levene Statistic df1 df2 Sig.
4.359 3 8 .043
ANOVA
waktu pembasahan
Sum of
Squares df Mean Square F Sig.
Between Groups 10035.215 3 3345.072 5.110 .029
Within Groups 5236.395 8 654.549
Total 15271.609 11
Keterangan:
Ho ditolak jika Fhitung (5,110) > Ftabel 0,05 (3,8) (4,07), berarti rata-rata waktu
pembasahan dari keempat formula menunjukkan bahwa ada perbedaan yang
signifikan antar formula.

172
Multiple Comparisons waktu pembasahan
HSD
(I)
formula
(J)
formula
Mean
Difference
(I-J)
Std. Error Sig.
95% Confidence
Interval
Lower
Bound
Upper
Bound
1
2 -38.11000 20.88938 .106 -86.2810 10.0610
3 -29.99667 20.88938 .189 -78.1677 18.1743
4 -80.88667* 20.88938 .005 -129.0577 -32.7157
2
1 38.11000 20.88938 .106 -10.0610 86.2810
3 8.11333 20.88938 .708 -40.0577 56.2843
4 -42.77667 20.88938 .075 -90.9477 5.3943
3
1 29.99667 20.88938 .189 -18.1743 78.1677
2 -8.11333 20.88938 .708 -56.2843 40.0577
4 -50.89000* 20.88938 .041 -99.0610 -2.7190
4
1 80.88667* 20.88938 .005 32.7157 129.0577
2 42.77667 20.88938 .075 -5.3943 90.9477
3 50.89000* 20.88938 .041 2.7190 99.0610
*. The mean difference is significant at the 0.05 level.
Keterangan:
Hasil uji HSD dari keempat formula, diperoleh nilai sig. < α (0,05) sehingga
Ho ditolak (*), berarti rata-rata waktu pembasahan dari keempat formula
menunjukkan bahwa ada perbedaan yang signifikan antar formula, yaitu
formula 1 menunjukkan perbedaan yang signifikan terhadap formula 4;
formula 3 menunjukkan perbedaan yang signifikan terhadap formula 4,
sedangkan formula 1 tidak menunjukkan perbedaan yang signifikan
terhadap formula 2 dan formula 3; dan formula 4 tidak menunjukkan
perbedaan yang signifikan terhadap formula 2.

173
LAMPIRAN Y
HASIL UJI STATISTIK RASIO ABSORBSI AIR ODT
DOMPERIDONE
Descriptives
rasio absorpsi air
N Mean Std.
Deviation
Std.
Error
95% Confidence
Interval for Mean Min Max
Lower
Bound
Upper
Bound
1 3 32.4933 5.39520 3.11492 19.0909 45.8957 27.24 38.02
2 3 56.6933 4.10919 2.37244 46.4855 66.9011 51.95 59.17
3 3 28.8500 7.76203 4.48141 9.5681 48.1319 23.96 37.80
4 3 50.7333 7.24165 4.18097 32.7441 68.7226 44.15 58.49
Total 12 42.1925 13.42764 3.87623 33.6610 50.7240 23.96 59.17
Test of Homogeneity of Variances
rasio absorpsi air
Levene Statistic df1 df2 Sig.
.678 3 8 .589
ANOVA
rasio absorpsi air
Sum of
Squares df Mean Square F Sig.
Between Groups 1665.948 3 555.316 13.998 .002
Within Groups 317.368 8 39.671
Total 1983.317 11
Keterangan:
Ho ditolak jika Fhitung (13,998) > Ftabel 0,05 (3,8) (4,07), berarti rata-rata rasio
absorpsi air dari keempat formula menunjukkan bahwa ada perbedaan yang
signifikan antar formula.

174
Multiple Comparisons
rasio absorpsi air
HSD
(I)
formula
(J)
formula
Mean
Difference
(I-J)
Std. Error Sig.
95% Confidence
Interval
Lower
Bound
Upper
Bound
1
2 -24.20000* 5.14270 .002 -36.0591 -12.3409
3 3.64333 5.14270 .499 -8.2158 15.5024
4 -18.24000* 5.14270 .008 -30.0991 -6.3809
2
1 24.20000* 5.14270 .002 12.3409 36.0591
3 27.84333* 5.14270 .001 15.9842 39.7024
4 5.96000 5.14270 .280 -5.8991 17.8191
3
1 -3.64333 5.14270 .499 -15.5024 8.2158
2 -27.84333* 5.14270 .001 -39.7024 -15.9842
4 -21.88333* 5.14270 .003 -33.7424 -10.0242
4
1 18.24000* 5.14270 .008 6.3809 30.0991
2 -5.96000 5.14270 .280 -17.8191 5.8991
3 21.88333* 5.14270 .003 10.0242 33.7424
*. The mean difference is significant at the 0.05 level.
Keterangan:
Hasil uji HSD dari keempat formula, diperoleh nilai sig. < α (0,05) sehingga
Ho ditolak (*), berarti rata-rata rasio absorpsi air dari keempat formula
menunjukkan bahwa ada perbedaan yang signifikan antar formula, yaitu
formula 1 menunjukkan perbedaan yang signifikan terhadap formula 2 dan
formula 4; formula 2 menunjukkan perbedaan yang signifikan terhadap
formula 3; dan formula 3 menunjukkan perbedaan yang signifikan terhadap
formula 4, sedangkan formula 1 tidak menunjukkan perbedaan yang
signifikan terhadap formula 3; formula 2 juga tidak menunjukkan perbedaan
yang signifikan terhadap formula 4.
175
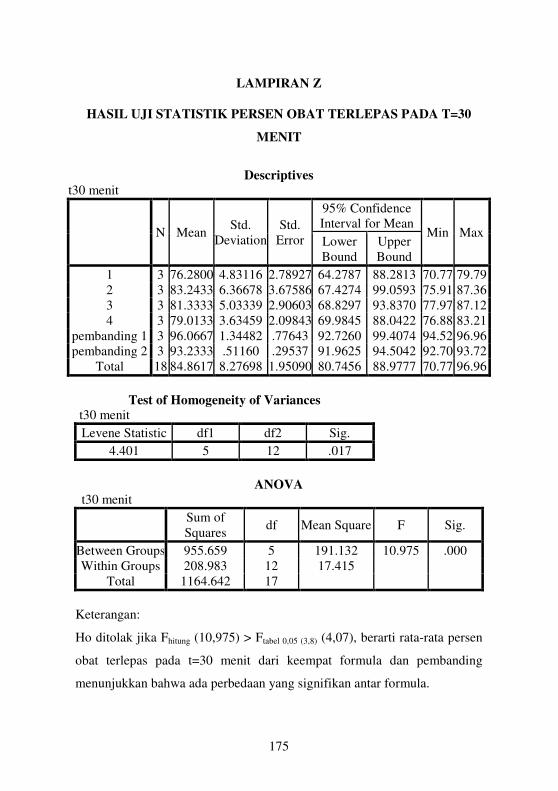
LAMPIRAN Z
HASIL UJI STATISTIK PERSEN OBAT TERLEPAS PADA T=30
MENIT
Descriptives
t30 menit
N Mean Std.
Deviation
Std.
Error
95% Confidence
Interval for Mean Min Max
Lower
Bound
Upper
Bound
1 3 76.2800 4.83116 2.78927 64.2787 88.2813 70.77 79.79
2 3 83.2433 6.36678 3.67586 67.4274 99.0593 75.91 87.36
3 3 81.3333 5.03339 2.90603 68.8297 93.8370 77.97 87.12
4 3 79.0133 3.63459 2.09843 69.9845 88.0422 76.88 83.21
pembanding 1 3 96.0667 1.34482 .77643 92.7260 99.4074 94.52 96.96
pembanding 2 3 93.2333 .51160 .29537 91.9625 94.5042 92.70 93.72
Total 18 84.8617 8.27698 1.95090 80.7456 88.9777 70.77 96.96
Test of Homogeneity of Variances t30 menit
Levene Statistic df1 df2 Sig.
4.401 5 12 .017
ANOVA
t30 menit
Sum of
Squares df Mean Square F Sig.
Between Groups 955.659 5 191.132 10.975 .000
Within Groups 208.983 12 17.415
Total 1164.642 17
Keterangan:
Ho ditolak jika Fhitung (10,975) > Ftabel 0,05 (3,8) (4,07), berarti rata-rata persen
obat terlepas pada t=30 menit dari keempat formula dan pembanding
menunjukkan bahwa ada perbedaan yang signifikan antar formula.

176
Multiple Comparisons t30 menit
HSD
(I)
formula
(J)
formula
Mean
Difference
(I-J)
Std. Error Sig.
95% Confidence Interval
Lower
Bound
Upper
Bound
1
2 -6.96333 3.40737 .064 -14.3874 .4607
3 -5.05333 3.40737 .164 -12.4774 2.3707
4 -2.73333 3.40737 .438 -10.1574 4.6907
pembanding 1 -19.78667* 3.40737 .000 -27.2107 -12.3626
pembanding 2 -16.95333* 3.40737 .000 -24.3774 -9.5293
2
1 6.96333 3.40737 .064 -.4607 14.3874
3 1.91000 3.40737 .585 -5.5140 9.3340
4 4.23000 3.40737 .238 -3.1940 11.6540
pembanding 1 -12.82333* 3.40737 .003 -20.2474 -5.3993
pembanding 2 -9.99000* 3.40737 .013 -17.4140 -2.5660
3
1 5.05333 3.40737 .164 -2.3707 12.4774
2 -1.91000 3.40737 .585 -9.3340 5.5140
4 2.32000 3.40737 .509 -5.1040 9.7440
pembanding 1 -14.73333* 3.40737 .001 -22.1574 -7.3093
pembanding 2 -11.90000* 3.40737 .004 -19.3240 -4.4760
4
1 2.73333 3.40737 .438 -4.6907 10.1574
2 -4.23000 3.40737 .238 -11.6540 3.1940
3 -2.32000 3.40737 .509 -9.7440 5.1040
pembanding 1 -17.05333* 3.40737 .000 -24.4774 -9.6293
pembanding 2 -14.22000* 3.40737 .001 -21.6440 -6.7960
Pemban
-ding 1
1 19.78667* 3.40737 .000 12.3626 27.2107
2 12.82333* 3.40737 .003 5.3993 20.2474
3 14.73333* 3.40737 .001 7.3093 22.1574
4 17.05333* 3.40737 .000 9.6293 24.4774
pembanding 2 2.83333 3.40737 .422 -4.5907 10.2574
Pemban
-ding 2
1 16.95333* 3.40737 .000 9.5293 24.3774
2 9.99000* 3.40737 .013 2.5660 17.4140
3 11.90000* 3.40737 .004 4.4760 19.3240
4 14.22000* 3.40737 .001 6.7960 21.6440
pembanding 1 -2.83333 3.40737 .422 -10.2574 4.5907
*. The mean difference is significant at the 0.05 level.

177
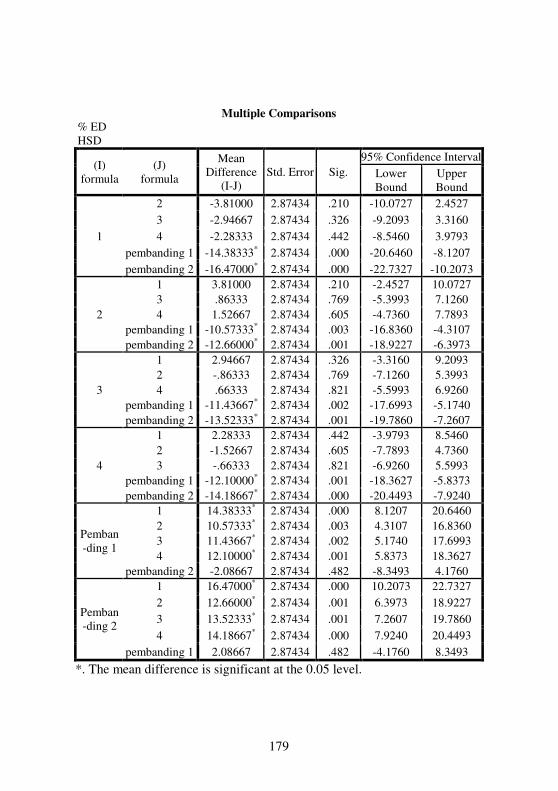
Keterangan:
Hasil uji HSD dari keempat formula, diperoleh nilai sig. < α (0,05) sehingga
Ho ditolak (*), berarti rata-rata persen obat terlepas pada t=30 menit dari
keempat formula dan kedua pembanding menunjukkan bahwa ada
perbedaan yang signifikan antar formula, yaitu formula 1 menunjukkan
perbedaan yang signifikan terhadap pembanding 1 dan pembanding 2;
formula 2 menunjukkan perbedaan yang signifikan terhadap pembanding 1
dan pembanding 2; formula 3 menunjukkan perbedaan yang signifikan
terhadap pembanding 1 dan pembanding 2; dan formula 4 menunjukkan
perbedaan yang signifikan terhadap pembanding 1 dan pembanding 2,
sedangkan formula 1 tidak menunjukkan perbedaan yang signifikan
terhadap formula 2, formula 3, dan formula 4; formula 2 juga tidak
menunjukkan perbedaan yang signifikan terhadap formula 3 dan formula 4;
formula 3 juga tidak menunjukkan perbedaan yang signifikan terhadap
formula 4.

178
LAMPIRAN AA
HASIL UJI STATISTIK PERSEN EFISIENSI DISOLUSI
Descriptives % ED
N Mean Std.
Deviation
Std.
Error
95% Confidence
Interval for Mean Min Max
Lower
Bound
Upper
Bound
1 3 77.0633 2.79160 1.61173 70.1286 83.9981 73.84 78.70
2 3 80.8733 4.70300 2.71528 69.1904 92.5562 76.02 85.41
3 3 80.0100 5.19962 3.00200 67.0934 92.9266 75.16 85.50
4 3 79.3467 3.49323 2.01682 70.6690 88.0243 76.99 83.36
pembanding 1 3 91.4467 2.11588 1.22160 86.1905 96.7028 90.04 93.88
pembanding 2 3 93.5333 .85424 .49320 91.4113 95.6554 92.82 94.48
Total 18 83.7122 7.16460 1.68871 80.1494 87.2751 73.84 94.48
Test of Homogeneity of Variances
% ED
Levene Statistic df1 df2 Sig.
1.349 5 12 .309
ANOVA
% ED
Sum of
Squares df Mean Square F Sig.
Between Groups 723.922 5 144.784 11.683 .000
Within Groups 148.713 12 12.393
Total 872.636 17
Keterangan:
Ho ditolak jika Fhitung (11,683) > Ftabel 0,05 (3,8) (4,07), berarti rata-rata % ED
dari keempat formula dan pembanding menunjukkan bahwa ada perbedaan
yang signifikan antar formula.
179
Multiple Comparisons % ED
HSD
(I)
formula
(J)
formula
Mean
Difference
(I-J)
Std. Error Sig.
95% Confidence Interval
Lower
Bound
Upper
Bound
1
2 -3.81000 2.87434 .210 -10.0727 2.4527
3 -2.94667 2.87434 .326 -9.2093 3.3160
4 -2.28333 2.87434 .442 -8.5460 3.9793
pembanding 1 -14.38333* 2.87434 .000 -20.6460 -8.1207
pembanding 2 -16.47000* 2.87434 .000 -22.7327 -10.2073
2
1 3.81000 2.87434 .210 -2.4527 10.0727
3 .86333 2.87434 .769 -5.3993 7.1260
4 1.52667 2.87434 .605 -4.7360 7.7893
pembanding 1 -10.57333* 2.87434 .003 -16.8360 -4.3107
pembanding 2 -12.66000* 2.87434 .001 -18.9227 -6.3973
3
1 2.94667 2.87434 .326 -3.3160 9.2093
2 -.86333 2.87434 .769 -7.1260 5.3993
4 .66333 2.87434 .821 -5.5993 6.9260
pembanding 1 -11.43667* 2.87434 .002 -17.6993 -5.1740
pembanding 2 -13.52333* 2.87434 .001 -19.7860 -7.2607
4
1 2.28333 2.87434 .442 -3.9793 8.5460
2 -1.52667 2.87434 .605 -7.7893 4.7360
3 -.66333 2.87434 .821 -6.9260 5.5993
pembanding 1 -12.10000* 2.87434 .001 -18.3627 -5.8373
pembanding 2 -14.18667* 2.87434 .000 -20.4493 -7.9240
Pemban
-ding 1
1 14.38333* 2.87434 .000 8.1207 20.6460
2 10.57333* 2.87434 .003 4.3107 16.8360
3 11.43667* 2.87434 .002 5.1740 17.6993
4 12.10000* 2.87434 .001 5.8373 18.3627
pembanding 2 -2.08667 2.87434 .482 -8.3493 4.1760
Pemban
-ding 2
1 16.47000* 2.87434 .000 10.2073 22.7327
2 12.66000* 2.87434 .001 6.3973 18.9227
3 13.52333* 2.87434 .001 7.2607 19.7860
4 14.18667* 2.87434 .000 7.9240 20.4493
pembanding 1 2.08667 2.87434 .482 -4.1760 8.3493
*. The mean difference is significant at the 0.05 level.

180
Keterangan:
Hasil uji HSD dari keempat formula, diperoleh nilai sig. < α (0,05) sehingga
Ho ditolak (*), berarti rata-rata % ED dari keempat formula dan kedua
pembanding menunjukkan bahwa ada perbedaan yang signifikan antar
formula, yaitu formula 1 menunjukkan perbedaan yang signifikan terhadap
pembanding 1 dan pembanding 2; formula 2 menunjukkan perbedaan yang
signifikan terhadap pembanding 1 dan pembanding 2; formula 3
menunjukkan perbedaan yang signifikan terhadap pembanding 1 dan
pembanding 2; dan formula 4 menunjukkan perbedaan yang signifikan
terhadap pembanding 1 dan pembanding 2, sedangkan formula 1 tidak
menunjukkan perbedaan yang signifikan terhadap formula 2, formula 3, dan
formula 4; formula 2 juga tidak menunjukkan perbedaan yang signifikan
terhadap formula 3 dan formula 4; formula 3 juga tidak menunjukkan
perbedaan yang signifikan terhadap formula 4.

181
LAMPIRAN AB
UJI F KURVA BAKU DENGAN HCl 0,1N UNTUK UJI
PENETAPAN KADAR ODT DOMPERIDONE
Rep. Konsentrasi
(ppm) (x)
Absorbansi
(y) x
2 y
2 xy
I
2,012 0,097 4,0481 0,0094 0,1952
4,024 0,140 16,1926 0,0196 0,5634
6,036 0,203 36,4333 0,0412 1,2253
8,048 0,253 64,7703 0,0640 2,0361
10,06 0,313 101,2036 0,0980 3,1488
12,072 0,372 145,7332 0,1384 4,4908
∑ 14,084 0,426 198,3591 0,1815 5,9998
Persamaan Regresi pada replikasi 1 → y = 0,0277x + 0,0347
rhitung/rtabel: 0,9993/0,754
Rep. Konsentrasi
(ppm) (x)
Absorbansi
(y) x
2 y
2 xy
II
2,012 0,090 4,0481 0,0081 0,1811
4,024 0,145 16,1926 0,0210 0,5835
6,036 0,195 36,4333 0,0380 1,1770
8,048 0,260 64,7703 0,0676 2,0925
10,06 0,319 101,2036 0,1018 3,2091
12,072 0,371 145,7332 0,1376 4,4787
∑ 14,084 0,426 198,3591 0,1815 5,9998
Persamaan Regresi pada replikasi 1 → y = 0,0283x + 0,0306
rhitung/rtabel: 0,9996/0,754
Rep. Konsentrasi
(ppm) (x)
Absorbansi
(y) x
2 y
2 xy
III
2,008 0,089 4,0321 0,0079 0,1787
4,016 0,139 16,1283 0,0193 0,5582
6,024 0,210 36,2886 0,0441 1,2650
8,032 0,264 64,5130 0,0697 2,1204
10,04 0,326 100,8016 0,1063 3,2730
12,048 0,373 145,1543 0,1391 4,4939
∑ 14,056 0,426 197,5711 0,1815 5,9879
Persamaan Regresi pada replikasi 1 → y = 0,0284x + 0,0306
rhitung/rtabel: 0,9988/0,754

182
∑ x2 ∑ xy ∑ y
2 n
Residual
SS RDF
Persamaan
regresi 1 566,7402 17,65932 0,552056 7 0,001801 5
Persamaan
regresi 2 566,7402 17,77803 0,559052 7 0,001374 5
Persamaan
regresi 3 564,489 17,87722 0,567919 7 0,001752 5
Pooled
regression 21 0,004927 15
Common
regression 1697,969 53,31458 1,679027 0,005001 15
Fhitung = 0,056636
F tabel 0,05 (4,15) = 3,06
Fhitung = 0,056636 < F tabel 0,05 (3,12) = 3,06; yang berarti tidak ada perbedaan
bermakna antar replikasi pada pembuatan kurva baku untuk uji penetapan
kadar ODT domperidone.

183
LAMPIRAN AC
HASIL UJI ANAVA KEKERASAN ODT DOMPERIDONE DENGAN
DESIGN EXPERT
Use your mouse to right click on individual cells for definitions.
Response 1 Kekerasan
ANOVA for selected factorial model
Analysis of variance table [Partial sum of squares - Type III]
Sum of Mean F p-value
Source Squares df Square Value Prob > F Model 0.33 3 0.11 1.27 0.3483 not significant
A-Ac-di-sol 0.26 1 0.26 2.91 0.1265
B-PVP 7.008E-003 1 7.008E-003 0.080 0.7846
AB 0.072 1 0.072 0.82 0.3912
Pure Error 0.70 8 0.088
Cor Total 1.04 11
The "Model F-value" of 1.27 implies the model is not significant relative to
the noise. There is a 34.83 % chance that a "Model F-value" this large
could occur due to noise.
Values of "Prob > F" less than 0.0500 indicate model terms are significant.
In this case there are no significant model terms.
Values greater than 0.1000 indicate the model terms are not significant.
If there are many insignificant model terms (not counting those required to
support hierarchy), model reduction may improve your model.
Std. Dev. 0.30 R-Squared 0.3226
Mean 2.97 Adj R-Squared 0.0686
C.V. % 9.98 Pred R-Squared -0.5240
PRESS 1.58 Adeq Precision 2.612
A negative "Pred R-Squared" implies that the overall mean is a better
predictor of your response than the current model.
"Adeq Precision" measures the signal to noise ratio. A ratio of 2.61
indicates an inadequate signal and we should not use this model to navigate
the design space.
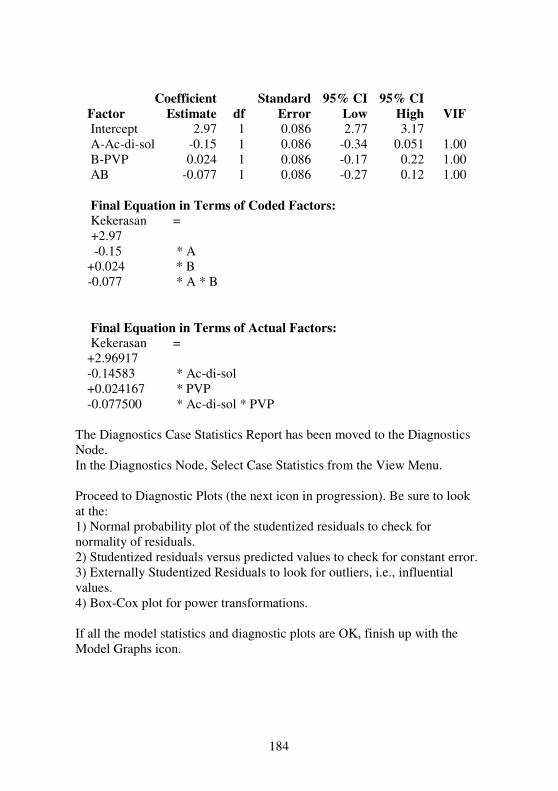
184
Coefficient Standard 95% CI 95% CI
Factor Estimate df Error Low High VIF
Intercept 2.97 1 0.086 2.77 3.17
A-Ac-di-sol -0.15 1 0.086 -0.34 0.051 1.00
B-PVP 0.024 1 0.086 -0.17 0.22 1.00
AB -0.077 1 0.086 -0.27 0.12 1.00
Final Equation in Terms of Coded Factors:
Kekerasan =
+2.97
-0.15 * A
+0.024 * B
-0.077 * A * B
Final Equation in Terms of Actual Factors:
Kekerasan =
+2.96917
-0.14583 * Ac-di-sol
+0.024167 * PVP
-0.077500 * Ac-di-sol * PVP
The Diagnostics Case Statistics Report has been moved to the Diagnostics
Node.
In the Diagnostics Node, Select Case Statistics from the View Menu.
Proceed to Diagnostic Plots (the next icon in progression). Be sure to look
at the:
1) Normal probability plot of the studentized residuals to check for
normality of residuals.
2) Studentized residuals versus predicted values to check for constant error.
3) Externally Studentized Residuals to look for outliers, i.e., influential
values.
4) Box-Cox plot for power transformations.
If all the model statistics and diagnostic plots are OK, finish up with the
Model Graphs icon.
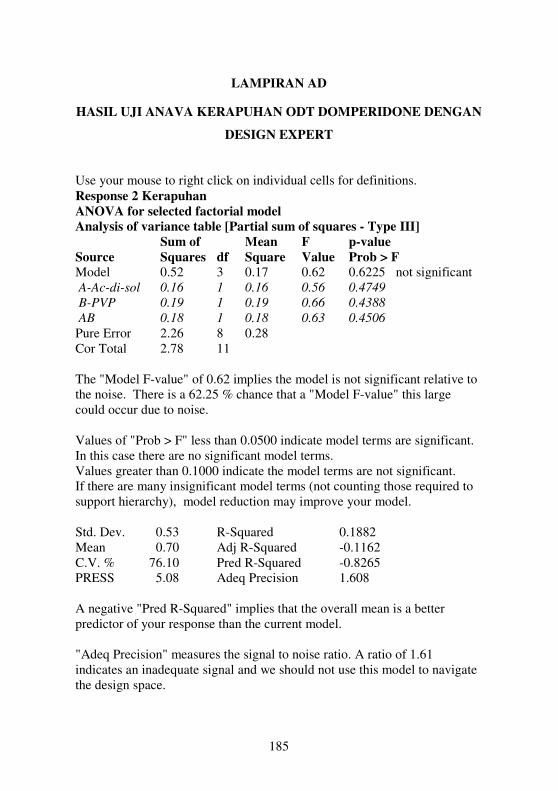
185
LAMPIRAN AD
HASIL UJI ANAVA KERAPUHAN ODT DOMPERIDONE DENGAN
DESIGN EXPERT
Use your mouse to right click on individual cells for definitions.
Response 2 Kerapuhan
ANOVA for selected factorial model
Analysis of variance table [Partial sum of squares - Type III]
Sum of Mean F p-value
Source Squares df Square Value Prob > F
Model 0.52 3 0.17 0.62 0.6225 not significant
A-Ac-di-sol 0.16 1 0.16 0.56 0.4749
B-PVP 0.19 1 0.19 0.66 0.4388
AB 0.18 1 0.18 0.63 0.4506
Pure Error 2.26 8 0.28
Cor Total 2.78 11
The "Model F-value" of 0.62 implies the model is not significant relative to
the noise. There is a 62.25 % chance that a "Model F-value" this large
could occur due to noise.
Values of "Prob > F" less than 0.0500 indicate model terms are significant.
In this case there are no significant model terms.
Values greater than 0.1000 indicate the model terms are not significant.
If there are many insignificant model terms (not counting those required to
support hierarchy), model reduction may improve your model.
Std. Dev. 0.53 R-Squared 0.1882
Mean 0.70 Adj R-Squared -0.1162
C.V. % 76.10 Pred R-Squared -0.8265
PRESS 5.08 Adeq Precision 1.608
A negative "Pred R-Squared" implies that the overall mean is a better
predictor of your response than the current model.
"Adeq Precision" measures the signal to noise ratio. A ratio of 1.61
indicates an inadequate signal and we should not use this model to navigate
the design space.

186
Coefficient Standard 95% CI 95% CI
Factor Estimate df Error Low High VIF
Intercept 0.70 1 0.15 0.34 1.05
A-Ac-di-sol 0.11 1 0.15 -0.24 0.47 1.00
B-PVP -0.13 1 0.15 -0.48 0.23 1.00
AB 0.12 1 0.15 -0.23 0.48 1.00
Final Equation in Terms of Coded Factors:
Kerapuhan =
+0.70
+0.11 * A
-0.13 * B
+0.12 * A * B
Final Equation in Terms of Actual Factors:
Kerapuhan =
+0.69833
+0.11500 * Ac-di-sol
-0.12500 * PVP
+0.12167 * Ac-di-sol * PVP
The Diagnostics Case Statistics Report has been moved to the Diagnostics
Node.
In the Diagnostics Node, Select Case Statistics from the View Menu.
Proceed to Diagnostic Plots (the next icon in progression). Be sure to look
at the:
1) Normal probability plot of the studentized residuals to check for
normality of residuals.
2) Studentized residuals versus predicted values to check for constant error.
3) Externally Studentized Residuals to look for outliers, i.e., influential
values.
4) Box-Cox plot for power transformations.
If all the model statistics and diagnostic plots are OK, finish up with the
Model Graphs icon.
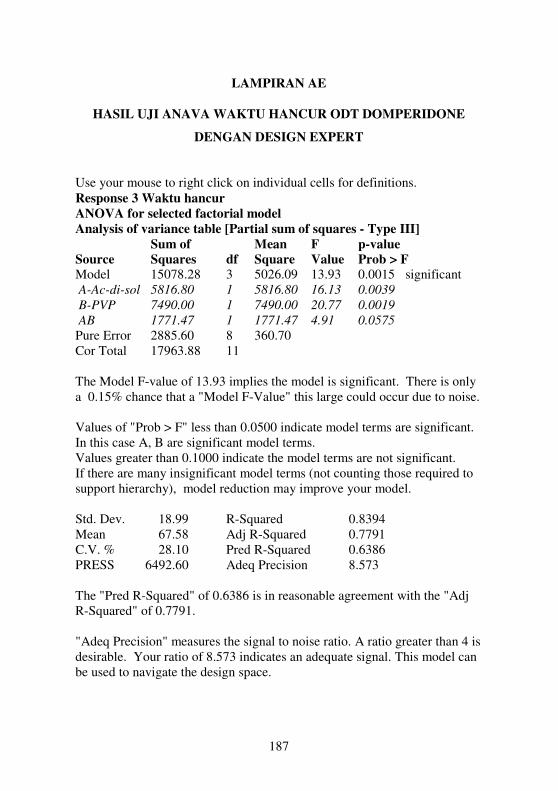
187
LAMPIRAN AE
HASIL UJI ANAVA WAKTU HANCUR ODT DOMPERIDONE
DENGAN DESIGN EXPERT
Use your mouse to right click on individual cells for definitions.
Response 3 Waktu hancur
ANOVA for selected factorial model
Analysis of variance table [Partial sum of squares - Type III]
Sum of Mean F p-value
Source Squares df Square Value Prob > F
Model 15078.28 3 5026.09 13.93 0.0015 significant
A-Ac-di-sol 5816.80 1 5816.80 16.13 0.0039
B-PVP 7490.00 1 7490.00 20.77 0.0019
AB 1771.47 1 1771.47 4.91 0.0575
Pure Error 2885.60 8 360.70
Cor Total 17963.88 11
The Model F-value of 13.93 implies the model is significant. There is only
a 0.15% chance that a "Model F-Value" this large could occur due to noise.
Values of "Prob > F" less than 0.0500 indicate model terms are significant.
In this case A, B are significant model terms.
Values greater than 0.1000 indicate the model terms are not significant.
If there are many insignificant model terms (not counting those required to
support hierarchy), model reduction may improve your model.
Std. Dev. 18.99 R-Squared 0.8394
Mean 67.58 Adj R-Squared 0.7791
C.V. % 28.10 Pred R-Squared 0.6386
PRESS 6492.60 Adeq Precision 8.573
The "Pred R-Squared" of 0.6386 is in reasonable agreement with the "Adj
R-Squared" of 0.7791.
"Adeq Precision" measures the signal to noise ratio. A ratio greater than 4 is
desirable. Your ratio of 8.573 indicates an adequate signal. This model can
be used to navigate the design space.
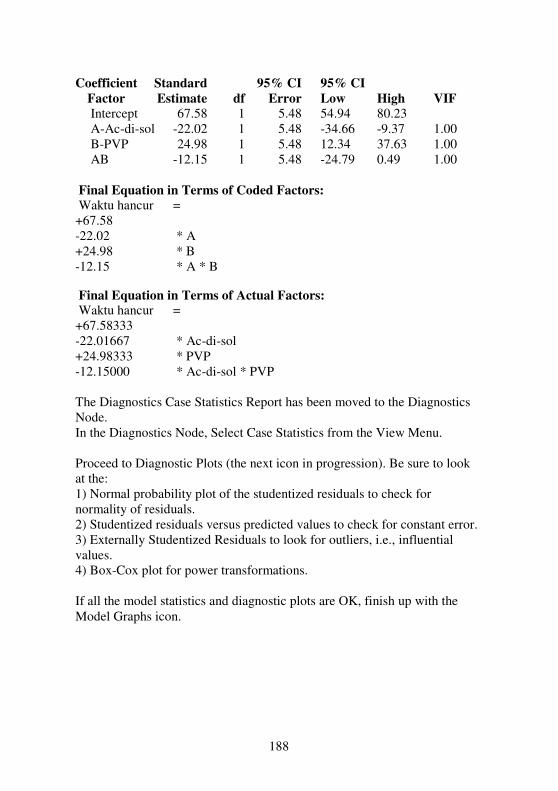
188
Coefficient Standard 95% CI 95% CI
Factor Estimate df Error Low High VIF
Intercept 67.58 1 5.48 54.94 80.23
A-Ac-di-sol -22.02 1 5.48 -34.66 -9.37 1.00
B-PVP 24.98 1 5.48 12.34 37.63 1.00
AB -12.15 1 5.48 -24.79 0.49 1.00
Final Equation in Terms of Coded Factors:
Waktu hancur =
+67.58
-22.02 * A
+24.98 * B
-12.15 * A * B
Final Equation in Terms of Actual Factors: Waktu hancur =
+67.58333
-22.01667 * Ac-di-sol
+24.98333 * PVP
-12.15000 * Ac-di-sol * PVP
The Diagnostics Case Statistics Report has been moved to the Diagnostics
Node.
In the Diagnostics Node, Select Case Statistics from the View Menu.
Proceed to Diagnostic Plots (the next icon in progression). Be sure to look
at the:
1) Normal probability plot of the studentized residuals to check for
normality of residuals.
2) Studentized residuals versus predicted values to check for constant error.
3) Externally Studentized Residuals to look for outliers, i.e., influential
values.
4) Box-Cox plot for power transformations.
If all the model statistics and diagnostic plots are OK, finish up with the
Model Graphs icon.

189
LAMPIRAN AF
HASIL UJI ANAVA WAKTU PEMBASAHAN ODT
DOMPERIDONE DENGAN DESIGN EXPERT
Use your mouse to right click on individual cells for definitions.
Response 4 Waktu pembasahan
ANOVA for selected factorial model
Analysis of variance table [Partial sum of squares - Type III]
Sum of Mean F p-value
Source Squares df Square Value Prob > F
Model 10035.21 3 3345.07 5.11 0.0290 significant
A-Ac-di-sol 5940.75 1 5940.75 9.08 0.0167
B-PVP 3971.97 1 3971.97 6.07 0.0391
AB 122.50 1 122.50 0.19 0.6767
Pure Error 5236.39 8 654.55
Cor Total 15271.61 11
The Model F-value of 5.11 implies the model is significant. There is only
a 2.90% chance that a "Model F-Value" this large could occur due to noise.
Values of "Prob > F" less than 0.0500 indicate model terms are significant.
In this case A, B are significant model terms.
Values greater than 0.1000 indicate the model terms are not significant.
If there are many insignificant model terms (not counting those required to
support hierarchy), model reduction may improve your model.
Std. Dev. 25.58 R-Squared 0.6571
Mean 72.36 Adj R-Squared 0.5285
C.V. % 35.36 Pred R-Squared 0.2285
PRESS 11781.89 Adeq Precision 5.476
The "Pred R-Squared" of 0.2285 is not as close to the "Adj R-Squared" of
0.5285 as one might normally expect. This may indicate a large block effect
or a possible problem with your model and/or data. Things to consider are
model reduction, response transformation, outliers, etc.
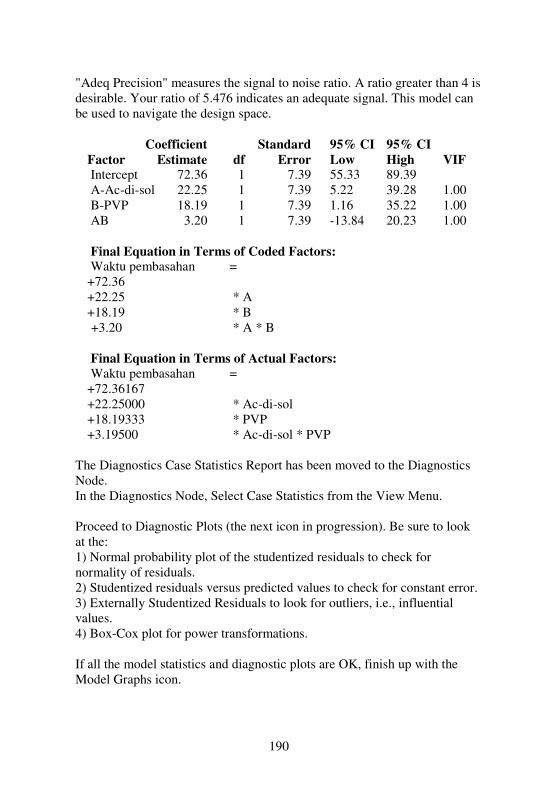
190
"Adeq Precision" measures the signal to noise ratio. A ratio greater than 4 is
desirable. Your ratio of 5.476 indicates an adequate signal. This model can
be used to navigate the design space.
Coefficient Standard 95% CI 95% CI
Factor Estimate df Error Low High VIF Intercept 72.36 1 7.39 55.33 89.39
A-Ac-di-sol 22.25 1 7.39 5.22 39.28 1.00
B-PVP 18.19 1 7.39 1.16 35.22 1.00
AB 3.20 1 7.39 -13.84 20.23 1.00
Final Equation in Terms of Coded Factors: Waktu pembasahan =
+72.36
+22.25 * A
+18.19 * B
+3.20 * A * B
Final Equation in Terms of Actual Factors:
Waktu pembasahan =
+72.36167
+22.25000 * Ac-di-sol
+18.19333 * PVP
+3.19500 * Ac-di-sol * PVP
The Diagnostics Case Statistics Report has been moved to the Diagnostics
Node.
In the Diagnostics Node, Select Case Statistics from the View Menu.
Proceed to Diagnostic Plots (the next icon in progression). Be sure to look
at the:
1) Normal probability plot of the studentized residuals to check for
normality of residuals.
2) Studentized residuals versus predicted values to check for constant error.
3) Externally Studentized Residuals to look for outliers, i.e., influential
values.
4) Box-Cox plot for power transformations.
If all the model statistics and diagnostic plots are OK, finish up with the
Model Graphs icon.

191
LAMPIRAN AG
HASIL UJI ANAVA RASIO ABSORPSI AIR ODT DOMPERIDONE
DENGAN DESIGN EXPERT
Use your mouse to right click on individual cells for definitions.
Response 5 Rasio absorpsi air
ANOVA for selected factorial model
Analysis of variance table [Partial sum of squares - Type III]
Sum of Mean F p-value
Source Squares df Square Value Prob > F
Model 1665.95 3 555.32 14.00 0.0015 significant
A-Ac-di-sol 1592.76 1 1592.76 40.15 0.0002
B-PVP 69.17 1 69.17 1.74 0.2232
AB 4.03 1 4.03 0.10 0.7582
Pure Error 317.37 8 39.67
Cor Total 1983.32 11
The Model F-value of 14.00 implies the model is significant. There is only
a 0.15% chance that a "Model F-Value" this large could occur due to noise.
Values of "Prob > F" less than 0.0500 indicate model terms are significant.
In this case A are significant model terms.
Values greater than 0.1000 indicate the model terms are not significant.
If there are many insignificant model terms (not counting those required to
support hierarchy), model reduction may improve your model.
Std. Dev. 6.30 R-Squared 0.8400
Mean 42.19 Adj R-Squared 0.7800
C.V. % 14.93 Pred R-Squared 0.6400
PRESS 714.08 Adeq Precision 7.657
The "Pred R-Squared" of 0.6400 is in reasonable agreement with the "Adj
R-Squared" of 0.7800.
"Adeq Precision" measures the signal to noise ratio. A ratio greater than 4 is
desirable. Your ratio of 7.657 indicates an adequate signal. This model can
be used to navigate the design space.

192
Coefficient Standard 95% CI 95% CI
Factor Estimate df Error Low High VIF
Intercept 42.19 1 1.82 38.00 46.39
A-Ac-di-sol 11.52 1 1.82 7.33 15.71 1.00
B-PVP -2.40 1 1.82 -6.59 1.79 1.00
AB -0.58 1 1.82 -4.77 3.61 1.00
Final Equation in Terms of Coded Factors:
Rasio absorpsi air =
+42.19
+11.52 * A
-2.40 * B
-0.58 * A * B
Final Equation in Terms of Actual Factors:
Rasio absorpsi air =
+42.19250
+11.52083 * Ac-di-sol
-2.40083 * PVP
-0.57917 * Ac-di-sol * PVP
The Diagnostics Case Statistics Report has been moved to the Diagnostics
Node.
In the Diagnostics Node, Select Case Statistics from the View Menu.
Proceed to Diagnostic Plots (the next icon in progression). Be sure to look
at the:
1) Normal probability plot of the studentized residuals to check for
normality of residuals.
2) Studentized residuals versus predicted values to check for constant error.
3) Externally Studentized Residuals to look for outliers, i.e., influential
values.
4) Box-Cox plot for power transformations.
If all the model statistics and diagnostic plots are OK, finish up with the
Model Graphs icon.
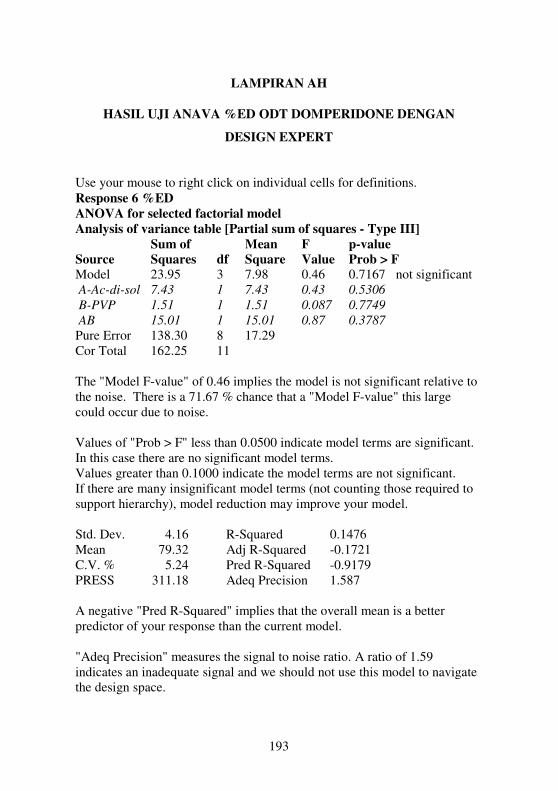
193
LAMPIRAN AH
HASIL UJI ANAVA %ED ODT DOMPERIDONE DENGAN
DESIGN EXPERT
Use your mouse to right click on individual cells for definitions.
Response 6 %ED
ANOVA for selected factorial model
Analysis of variance table [Partial sum of squares - Type III]
Sum of Mean F p-value
Source Squares df Square Value Prob > F
Model 23.95 3 7.98 0.46 0.7167 not significant
A-Ac-di-sol 7.43 1 7.43 0.43 0.5306
B-PVP 1.51 1 1.51 0.087 0.7749
AB 15.01 1 15.01 0.87 0.3787
Pure Error 138.30 8 17.29
Cor Total 162.25 11
The "Model F-value" of 0.46 implies the model is not significant relative to
the noise. There is a 71.67 % chance that a "Model F-value" this large
could occur due to noise.
Values of "Prob > F" less than 0.0500 indicate model terms are significant.
In this case there are no significant model terms.
Values greater than 0.1000 indicate the model terms are not significant.
If there are many insignificant model terms (not counting those required to
support hierarchy), model reduction may improve your model.
Std. Dev. 4.16 R-Squared 0.1476
Mean 79.32 Adj R-Squared -0.1721
C.V. % 5.24 Pred R-Squared -0.9179
PRESS 311.18 Adeq Precision 1.587
A negative "Pred R-Squared" implies that the overall mean is a better
predictor of your response than the current model.
"Adeq Precision" measures the signal to noise ratio. A ratio of 1.59
indicates an inadequate signal and we should not use this model to navigate
the design space.
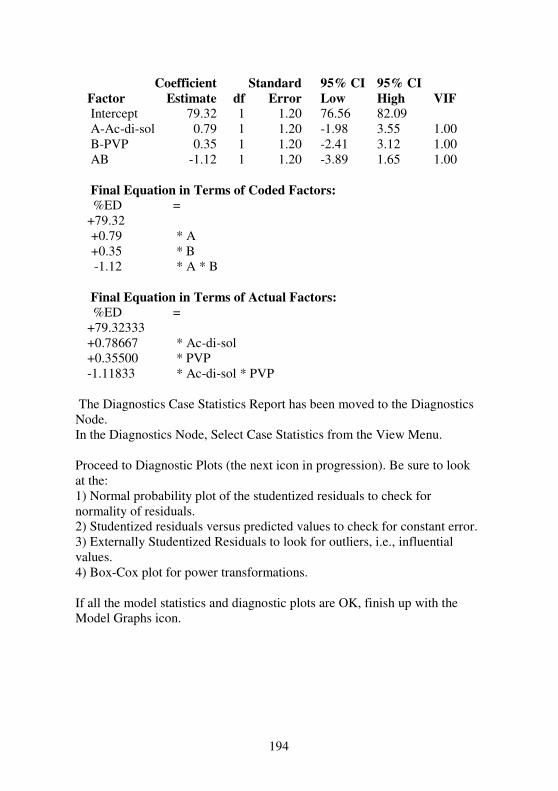
194
Coefficient Standard 95% CI 95% CI
Factor Estimate df Error Low High VIF
Intercept 79.32 1 1.20 76.56 82.09
A-Ac-di-sol 0.79 1 1.20 -1.98 3.55 1.00
B-PVP 0.35 1 1.20 -2.41 3.12 1.00
AB -1.12 1 1.20 -3.89 1.65 1.00
Final Equation in Terms of Coded Factors:
%ED =
+79.32
+0.79 * A
+0.35 * B
-1.12 * A * B
Final Equation in Terms of Actual Factors:
%ED =
+79.32333
+0.78667 * Ac-di-sol
+0.35500 * PVP
-1.11833 * Ac-di-sol * PVP
The Diagnostics Case Statistics Report has been moved to the Diagnostics
Node.
In the Diagnostics Node, Select Case Statistics from the View Menu.
Proceed to Diagnostic Plots (the next icon in progression). Be sure to look
at the:
1) Normal probability plot of the studentized residuals to check for
normality of residuals.
2) Studentized residuals versus predicted values to check for constant error.
3) Externally Studentized Residuals to look for outliers, i.e., influential
values.
4) Box-Cox plot for power transformations.
If all the model statistics and diagnostic plots are OK, finish up with the
Model Graphs icon.

195
LAMPIRAN AI
HASIL UJI STATISTIK HASIL PERCOBAAN DAN HASIL
TEORITIS PADA UJI KEKERASAN ODT DOMPERIDONE
Paired Samples Statistics
Mean N Std.
Deviation
Std. Error
Mean
Pair 1
Hasil Percobaan
Kekerasan 2.9700 4 .19339 .09670
Hasil Teoritis
Kekerasan 2.9700 4 .19579 .09789
Paired Samples Correlations
N Correlation Sig.
Pair 1 Hasil Percobaan Kekerasan
& Hasil Teoritis Kekerasan 4 .999 .001
Paired Samples Test
Paired Differences
t df
Sig.
(2-
tailed) Mean
Std.
Deviation
Std.
Error
Mean
95%
Confidence
Interval of the
Difference
Lower Upper
Pair
1
Hasil
Percobaan
Kekerasan
- Hasil
Teoritis
Kekerasan
.00000 .00816 .00408 -.01299 .01299 .000 3 1.000
Hipotesa Pengujian :
Ho diterima jika Thitung (0,000) < T 0,025 (3) (3,182), berarti hasil percobaan
dan hasil teoritis pada uji kekerasan tidak berbeda bermakna antar formula.

196
LAMPIRAN AJ
HASIL UJI STATISTIK HASIL PERCOBAAN DAN HASIL
TEORITIS PADA UJI KERAPUHAN ODT DOMPERIDONE
Paired Samples Statistics
Mean N Std.
Deviation
Std. Error
Mean
Pair
1
Hasil Percobaan
Kerapuhan .7000 4 .24014 .12007
Hasil Teoritis
Kerapuhan .7000 4 .24055 .12028
Paired Samples Correlations
N Correlation Sig.
Pair 1
Hasil Percobaan
Kerapuhan & Hasil
Teoritis Kerapuhan
4 .999 .001
Paired Samples Test
Paired Differences
t df
Sig.
(2-
tailed) Mean
Std.
Deviation
Std.
Error
Mean
95%
Confidence
Interval of the
Difference
Lower Upper
Pair
1
Hasil
Percobaan
Kerapuhan
- Hasil
Teoritis
Kerapuhan
.00000 .00816 .00408 -.01299 .01299 .000 3 1.000
Hipotesa Pengujian :
Ho diterima jika Thitung (0,000) < T 0,025 (3) (3,182), berarti hasil percobaan
dan hasil teoritis pada uji kerapuhan tidak berbeda bermakna antar formula.

197
LAMPIRAN AK
HASIL UJI STATISTIK HASIL PERCOBAAN DAN HASIL
TEORITIS PADA UJI WAKTU HANCUR ODT DOMPERIDONE
Paired Samples Statistics
Mean N Std.
Deviation
Std. Error
Mean
Pair
1
Hasil Percobaan
Waktu Hancur 67.5825 4 40.93014 20.46507
Hasil Teoritis Waktu
Hancur 67.5800 4 40.92372 20.46186
Paired Samples Correlations
N Correlation Sig.
Pair 1
Hasil Percobaan Waktu
Hancur & Hasil Teoritis
Waktu Hancur
4 1.000 .000
Paired Samples Test
Paired Differences
t df
Sig.
(2-
tailed) Mean
Std.
Deviation
Std.
Error
Mean
95% Confidence
Interval of the
Difference
Lower Upper
Pair
1
Hasil
Percobaan
Waktu
Hancur -
Hasil
Teoritis
Waktu
Hancur
.00250 .00957 .00479 -.01273 .01773 .522 3 .638

198
Hipotesa Pengujian :
Ho diterima jika Thitung (0,522) < T 0,025 (3) (3,182), berarti hasil percobaan
dan hasil teoritis pada uji waktu hancur tidak berbeda bermakna antar
formula.

199
LAMPIRAN AL
HASIL UJI STATISTIK HASIL PERCOBAAN DAN HASIL
TEORITIS PADA UJI WAKTU PEMBASAHAN ODT
DOMPERIDONE
Paired Samples Statistics
Mean N Std.
Deviation
Std. Error
Mean
Pair
1
Hasil Percobaan
Waktu Pembasahan 72.3600 4 33.39318 16.69659
Hasil Teoritis
Waktu Pembasahan 72.3600 4 33.39019 16.69510
Paired Samples Correlations
N Correlation Sig.
Pair 1
Hasil Percobaan Waktu
Pembasahan & Hasil
Teoritis Waktu
Pembasahan
4 1.000 .000
Paired Samples Test
Paired Differences
t df
Sig.
(2-
tailed) Mean
Std.
Deviation
Std.
Error
Mean
95%
Confidence
Interval of the
Difference
Lower Upper
Pair
1
Hasil
Percobaan
Waktu
Pembasahan
- Hasil
Teoritis
Waktu
Pembasahan
.00000 .00816 .00408 -.01299 .01299 .000 3 1.000

200
Hipotesa Pengujian :
Ho diterima jika Thitung (0,000) < T 0,025 (3) (3,182), berarti hasil percobaan
dan hasil teoritis pada uji waktu pembasahan tidak berbeda bermakna antar
formula.

201
LAMPIRAN AM
HASIL UJI STATISTIK HASIL PERCOBAAN DAN HASIL
TEORITIS PADA UJI RASIO ABSORPSI AIR ODT
DOMPERIDONE
Paired Samples Statistics
Mean N Std.
Deviation
Std. Error
Mean
Pair
1
Hasil Percobaan
Rasio Absorpsi Air 42.1900
a 4 13.60425 6.80213
Hasil Teoritis Rasio
Absorpsi Air 42.1900
a 4 13.60425 6.80213
a. The correlation and t cannot be computed because the standard error of
the difference is 0.
Hipotesa Pengujian :
Ho diterima jika Thitung (0,000) < T 0,025 (3) (3,182), berarti hasil percobaan
dan hasil teoritis pada uji rasio absorpsi air tidak berbeda bermakna antar
formula.

202
LAMPIRAN AN
HASIL UJI STATISTIK HASIL PERCOBAAN DAN HASIL
TEORITIS PADA UJI %ED ODT DOMPERIDONE
Paired Samples Statistics
Mean N Std.
Deviation
Std. Error
Mean
Pair
1
Hasil Percobaan
%ED 79.7200 4 .95202 .47601
Hasil teoritis %ED 79.3200 4 1.63340 .81670
Paired Samples Correlations
N Correlation Sig.
Pair 1 Hasil Percobaan %ED &
Hasil teoritis %ED 4 .947 .053
Paired Samples Test
Paired Differences
t df
Sig.
(2-
tailed) Mean
Std.
Deviation
Std.
Error
Mean
95%
Confidence
Interval of the
Difference
Lower Upper
Pair
1
Hasil
Percobaan
%ED -
Hasil
teoritis
%ED
.4000 .79335 .39667 -.8624 1.662391.008 3 .388
Hipotesa Pengujian :
Ho diterima jika Thitung (0,000) < T 0,025 (3) (3,182), berarti hasil percobaan
dan hasil teoritis pada uji %ED tidak berbeda bermakna antar formula.

203
LAMPIRAN AO
HASIL UJI STATISTIK SEBELUM DAN SETELAH 1 BULAN
PADA UJI STABILITAS WAKTU HANCUR ODT DOMPERIDONE
Paired Samples Statistics
Mean N Std.
Deviation Std. Error
Mean
Pair 1
Waktu Hancur 67.5825 4 40.93014 20.46507
Waktu Hancur Uji Stabilitas
53.2000 4 30.68621 15.34310
Paired Samples Correlations
N Correlation Sig.
Pair 1 Waktu Hancur & Waktu
Hancur Uji Stabilitas 4 .983 .017
Paired Samples Test
Paired Differences
t dfSig. (2-
tailed) Mean Std.
Deviation
Std. Error Mean
95% Confidence Interval of the
Difference
Lower Upper
Pair 1
Waktu Hancur - Waktu Hancur
Uji Stabilitas
14.3825012.101766.05088 -4.87409 33.63909 2.377 3 .098
Hipotesa Pengujian :
Ho diterima jika Thitung (2,377) < T 0,025 (3) (3,182), berarti hasil uji statistik
sebelum dan setelah 1 bulan pada uji waktu hancur tidak berbeda bermakna
antar formula.

204
LAMPIRAN AP
HASIL UJI STATISTIK SEBELUM DAN SETELAH 1 BULAN
PADA UJI STABILITAS WAKTU PEMBASAHAN ODT
DOMPERIDONE
Paired Samples Statistics
Mean N Std.
Deviation Std. Error
Mean
Pair 1
Waktu_Pembasahan 72.3600 4 33.39318 16.69659
Waktu_Pembasahan _Uji_Stabilitas
68.3600 4 33.41716 16.70858
Paired Samples Correlations
N Correlation Sig.
Pair 1
Waktu_Pembasahan & Waktu_Pembasahan_Uji_Stabilitas
4 .927 .073
Paired Samples Test
Paired Differences
t df Sig. (2-
tailed) Mean Std.
Deviation
Std. Error Mean
95% Confidence Interval of the
Difference
Lower Upper
Pair 1
Waktu_ Pembasah
-an _ Waktu_
Pembasah -an_ Uji_
Stabilitas
4.0000012.749386.37469 -16.2871 24.28710 .627 3 .575
Hipotesa Pengujian :
Ho diterima jika Thitung (0,627) < T 0,025 (3) (3,182), berarti hasil uji statistik
sebelum dan setelah 1 bulan pada uji waktu pembasahan tidak berbeda
bermakna antar formula.