artikel siam eng
TRANSCRIPT
8/12/2019 Artikel SIAM Eng
http://slidepdf.com/reader/full/artikel-siam-eng 1/8
IntroductionFor several years now, within the EU and
the US trade markets there has been
intense discussion concerning the retail
trade in furs of domestic dog, raccoondog and cat. Depending on the point of
view, and because of a lack of area-wide
investigations, quite different numbers are
quoted in respect of this non-transparent
trade. Animal protection organisations
assume that millions of furs of domestic
dogs, raccoon dogs and cats are being
imported, mainly from Asian countries
into the US and the EU markets, where
they are sold as made-up garment arti-
cles. However, on the other hand, some
national governments do not see any
need for action because there is no reli-able data supporting such an assumed
trade. Some countries already have regu-
lations, including USA, Italy, France and
Belgium. Trading of such furs is difficult
to monitor because of the lack of relia-
ble methods for the unambiguous iden-
tification of furs from domestic dogs,
raccoon dogs and cats, especially if they
are chemically defatted, bleached and/
or dyed. So far, although most experts
don’t doubt the significant existence of
such a trade, too little is known aboutits volume. It is also without doubt that,
at least as far as the domestic dog and
cat fur trade is concerned, consumers
do not wish to purchase such garments
under any circumstances; in addition, the
raccoon dog fur trade increasingly angers
more and more consumers.
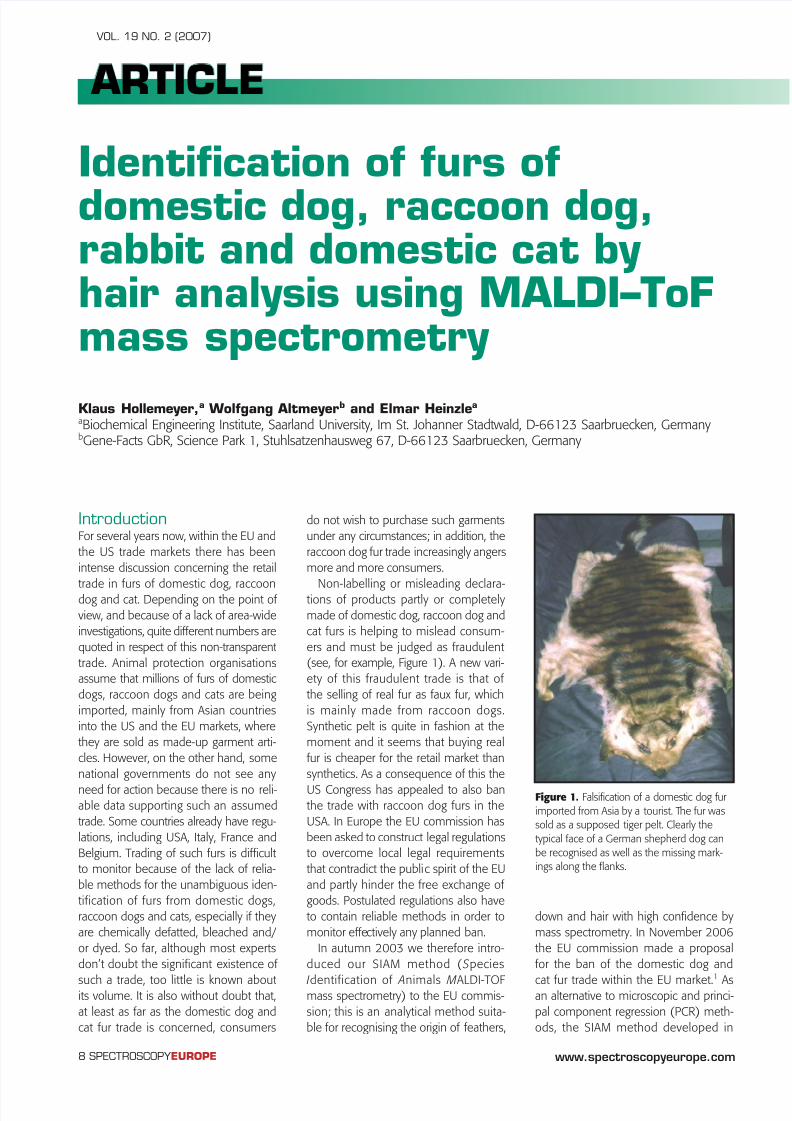
Non-labelling or misleading declara-tions of products partly or completely
made of domestic dog, raccoon dog and
cat furs is helping to mislead consum-
ers and must be judged as fraudulent
(see, for example, Figure 1). A new vari-
ety of this fraudulent trade is that of
the selling of real fur as faux fur, which
is mainly made from raccoon dogs.
Synthetic pelt is quite in fashion at the
moment and it seems that buying real
fur is cheaper for the retail market than
synthetics. As a consequence of this the
US Congress has appealed to also banthe trade with raccoon dog furs in the
USA. In Europe the EU commission has
been asked to construct legal regulations
to overcome local legal requirements
that contradict the public spirit of the EU
and partly hinder the free exchange of
goods. Postulated regulations also have
to contain reliable methods in order to
monitor effectively any planned ban.
In autumn 2003 we therefore intro-
duced our SIAM method ( Species
Identification of Animals MALDI-TOFmass spectrometry) to the EU commis-
sion; this is an analytical method suita-
ble for recognising the origin of feathers,
down and hair with high confidence by
mass spectrometry. In November 2006
the EU commission made a proposal
for the ban of the domestic dog and
cat fur trade within the EU market.1
Asan alternative to microscopic and princi-
pal component regression (PCR) meth-
ods, the SIAM method developed in
8 SPECTROSCOPY EUROPE
RTI LE ARTICLE
www.spectroscopyeurope.com
VOL. 19 NO. 2 (2007)
Identification of furs of
domestic dog, raccoon dog,rabbit and domestic cat byhair analysis using MALDI–ToFmass spectrometry
Klaus Hollemeyer,a Wolfgang Altmeyerb and Elmar Heinzlea
aBiochemical Engineering Institute, Saarland University, Im St. Johanner Stadtwald, D-66123 Saarbruecken, GermanybGene-Facts GbR, Science Park 1, Stuhlsatzenhausweg 67, D-66123 Saarbruecken, Germany
Figure 1. Falsification of a domestic dog fur
imported from Asia by a tourist. The fur wassold as a supposed tiger pelt. Clearly the
typical face of a German shepherd dog can
be recognised as well as the missing mark-ings along the flanks.
8/12/2019 Artikel SIAM Eng
http://slidepdf.com/reader/full/artikel-siam-eng 2/8
Congratulations. You’ve arrived at the ultimate
intersection of speed and simplicity.
Now the world’s most sensitive ICP-MS is optimized for the most difficult applications. With a new, elegantly
designed Collision Reaction Interface (CRI), the Varian 820-MS provides faster, more flexible, interference-free analysis
using helium and hydrogen instead of corrosive or expensive gases. You can even auto-optimize instrument parametersfor easier setup, so throughput is faster than ever. That’s Varian innovation at work—delivering integrated, cost-effective,
Information Rich Detection solutions that help you overcome the challenges you face every day.
Learn more about Varian’s complete ICP-MS solutions
and request a demonstration at www.varianinc.com/820MSwebinar/
Sample Prep
Consumables
Instrumentation
Data SystemsSupport & Training
GC • LC • MS • AA • ICP • UV-Vis-NIR • FT-IR • Raman • Fluorescence • Dissolution • NMR • MRI • Consumables • Data Systems
©
2 0 0 6 V ar i an ,I n c .A l l r i gh t s r e s e
r v e d .
The new ICP-MS from Varian. The fast, accurate,elegant solution to complex interference issues.
SPECTROSCOPY EUROPE 9www.spectroscopyeurope.com
FASTLINK / CIRCLE 005 FOR FURTHER INFORMATION
8/12/2019 Artikel SIAM Eng
http://slidepdf.com/reader/full/artikel-siam-eng 3/8
our Institute in collaboration with the
Gene-Facts company, was mentioned as
outstandingly dependable.2 This proposal,
which will be enacted in January 2008,
provides compliant regulations together
with analytical protocols for the objective
monitoring of any domestic dog and cat
fur trade.
SIAM method descriptionThe SIAM method is routinely used for
the identification of avian and mamma-
lian species. The reliability of the method,
using unknown mammalian test samples,
was confirmed by LGC laboratories3
on behalf of the British government in2005. Compared to PCR methods, the
SIAM method is also able to correctly
identify feathers, down and mammalian
furs, even after chemical treatment such
as degreasing, bleaching and/or dyeing.
In the method, a small piece of about
1 mg of a sing le feather, down or hair
sample is sufficient to perform an analy-
sis, which is undertaken without any prior
or subsequent separation or enrichment
steps. The sample is chemically reduced
as a whole in a boiling water bath todestroy the intra- and inter-molecular
disulfide bridges of the protein chains and
to break three-dimensional structures.
After cooling down, the sample is mixed
together and incubated with trypsin, an
endoproteolytic enzyme, which cleaves
the protein chains into their lysine and
arginine residues. Incubation takes
place at 37°C for two hours. This digest
procedure results in a pool of cleaved
peptides stemming from a variety of
keratins and other structural proteins of
hair or feathers and down, respectively.The formed peptides are mixed together
with CCA-matrix, (alpha cyano-4- hydrox-
ycinnamic acid in 50% acetonitrile and
diluted trifluoro acetic acid), and 0.8 µL
of this solution is dropped onto a steel
target plate and air dried. Analysis by
matrix-assisted laser desorption/ionisa-
tion-time of flight (MALDI-ToF) mass
spectrometry (MS) sorts the cleaved
peptides according to their molecu-
lar weight-to-charge ratio ( m/z ), form-
ing a peptide pattern specific for themammalian species investigated. The
method exclusively measures peptides,
but does not detect nucleotides or other
biopolymers. Comparisons of unknown
peptide patterns are performed with
those of known species stored in data
libraries as reference entries. The higher
the conformity is between two spectra,
which means the smaller the mathemati-
cal correlation distance, the closer is the
zoological relationship between the two
species. This results in reliable identifica-
tion of an unknown sample. Additional
uses of species-specific peaks exclusively
occurring in single species and used as
diagnostic peaks enhance the confirma-
tion of the findings.
InstrumentationThe SIAM analysis was performed on a
4800 ToF/ToF analyser mass spectrom-
eter (Applied Biosystems, Darmstadt,
Germany) in positive reflector mode. The
system uses a pulsed 200 Hz solid-state
laser at a wavelength of 355 nm. Source
1 voltage was set to 20 kV with a grid
voltage of 16 kV. 2.19 V was applied to the
reflectron detector. Peptide masses of a
mix of standard peptides were used for
a wide range calibration from 0.8 kDa to
4 kDa with a delay time of 600 ns. (Thestandards were: des-arg1-bradykinin,
angiotensin I, glu1-fibrinopeptide, ACTH
1–17 clip, ACTH 18–39 clip and ACTH
7–38 clip.) One single standard peptide
mass spectrum was formed out of 20
sub-spectra per spot; each with 25 laser
shots kept below the saturation threshold
of the detector. Exclusively monoisotopic
peaks were taken into account and calcu-
lated from the six standard peptides with
a minimum signal-to-noise ratio of 20,
and a resolution better than 10,000.
Mass tolerance was set to ±0.3 Da withmaximum outlie r of 5 ppm. Accepted
internal calibration settings were used
as default parameters to measure real-
sample spectra in the range of 1–3 kDa
with a minimum signal-to-noise range of
10, and a resolution better than 6000.
The MALDI-ToF mass spectromet-
ric measurement arranges the cleaved
peptides according to their molecular
masses ( m/z ) forming a single mass
spectrum of peptide pattern with their
particular intensities. Several singlemass spectra from one sample, each
from a distinct spot are combined into
one recalculated average spectrum,
thus eliminating trypsin autoproteolytic
peptides as well as slight intensity varia-
tions between the single measurements.
A corrected mammal average spectrum
always contains perseverative peptide
masses that occur in almost all investi-
gated mammalian orders. Besides these
there are other peptide masses, which
are selectively representative for zoologi-
cal families and/or genera within the
mammalians. Species-specific peptides,
however, occur exclusively in single
species and can be used as diagnostic
masses.
The average spectra originating from
known species are stored as referenceentries in data libraries. The average
spectra from unknown species are iden-
tified by binary mathematical compari-
sons with the stored data using the
“Correlation distances” (d r,s):
d x x x x
x x x x r s
r r s s
r r s s
,
( ) ( )
( ) ( )= −
− × − ′
− × − ′1
2 2
where x x r rj j n
= ×∑1
and x s sj j n
x = ×
∑
1
The relationship computes the
Euclidean distance between pairs of
objects in a n × p data matrix X. Rows of
X correspond to observations; columns
correspond to variables. d r,s is a row
vector of length ( n – 1) × n /2, correspond-
ing to the ( n – 1) × n /2 pairs of observa-
tions in X. The distances are arranged in
the order (1,2), (1,3), …, (1, n), (2,3), …,
(2, n), …, …, ( n – 1, n). d r,s is commonly
used as a dissimilarity matrix in clustering
or multidimensional scaling. The variousdistances between the vector x r and x s are defined as Correlation distances.
The vector d r,s is converted into a
square matrix so that element i, j in
the matrix corresponds to the distance
between objects i and j in the original
data.
This is a special form of the Euclidean
match factor calculations4 ranging from
0 to 1.0. Results are presented as a list
of distance values, whereby the smallest
distance value indicates the highest simi-larity between two spectra and gives the
best fit. Generalising, one can say that
within a zoological genus or family the
10 SPECTROSCOPY EUROPE
RTI LE ARTICLE
www.spectroscopyeurope.com
VOL. 19 NO. 2 (2007)
8/12/2019 Artikel SIAM Eng
http://slidepdf.com/reader/full/artikel-siam-eng 4/8
FASTLINK / CIRCLE 006 FOR FURTHER INFORMATION
8/12/2019 Artikel SIAM Eng
http://slidepdf.com/reader/full/artikel-siam-eng 5/8
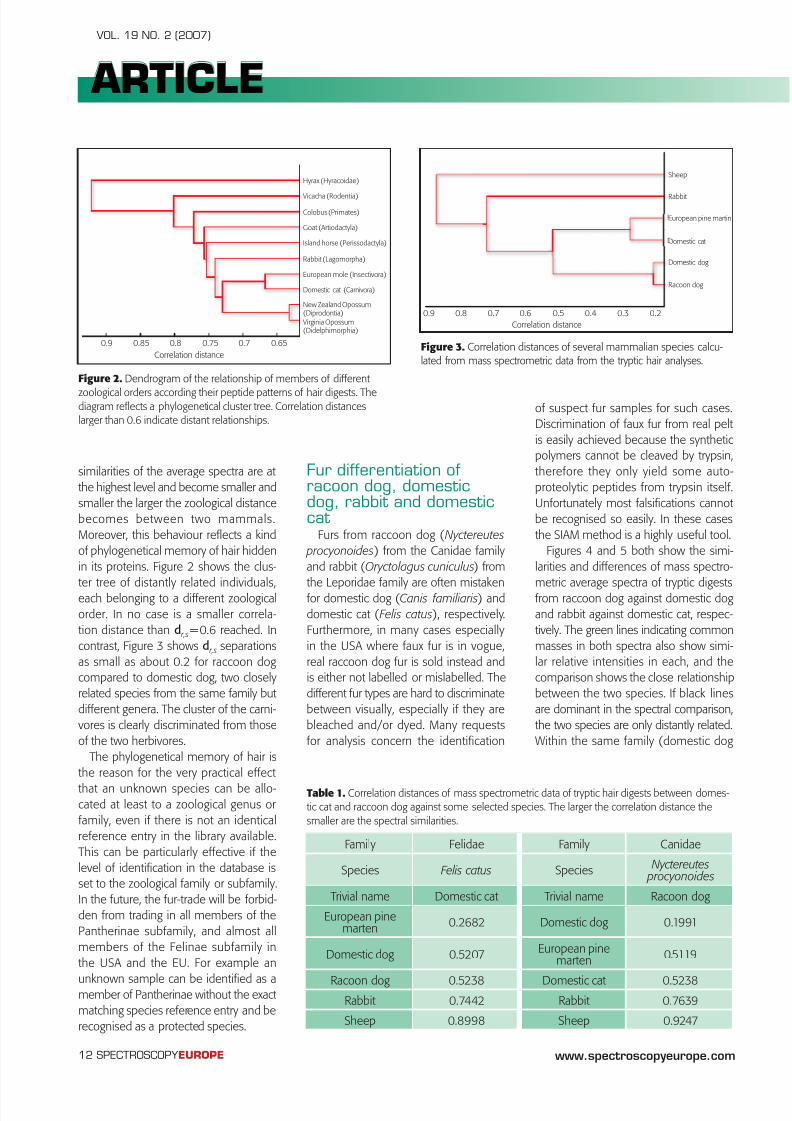
similarities of the average spectra are at
the highest level and become smaller and
smaller the larger the zoological distance
becomes between two mammals.
Moreover, this behaviour reflects a kind
of phylogenetical memory of hair hidden
in its proteins. Figure 2 shows the clus-
ter tree of distantly related individuals,each belonging to a different zoological
order. In no case is a smaller correla-
tion distance than d r,s = 0.6 reached. In
contrast, Figure 3 shows d r,s separations
as small as about 0.2 for raccoon dog
compared to domestic dog, two closely
related species from the same family but
different genera. The cluster of the carni-
vores is clearly discriminated from those
of the two herbivores.
The phylogenetical memory of hair is
the reason for the very practical effect
that an unknown species can be allo-cated at least to a zoological genus or
family, even if there is not an identical
reference entry in the library available.
This can be particularly effective if the
level of identification in the database is
set to the zoological family or subfamily.
In the future, the fur-trade will be forbid-
den from trading in all members of the
Pantherinae subfamily, and almost all
members of the Felinae subfamily in
the USA and the EU. For example an
unknown sample can be identified as amember of Pantherinae without the exact
matching species reference entry and be
recognised as a protected species.
Fur differentiation ofracoon dog, domesticdog, rabbit and domesticcat
Furs from raccoon dog (Nyctereutes procyonoides) from the Canidae family
and rabbit (Oryctolagus cuniculus) from
the Leporidae family are often mistakenfor domestic dog (Canis familiaris) and
domestic cat (Felis catus), respectively.
Furthermore, in many cases especially
in the USA where faux fur is in vogue,
real raccoon dog fur is sold instead and
is either not labelled or mislabelled. The
different fur types are hard to discriminate
between visually, especially if they are
bleached and/or dyed. Many requests
for analysis concern the identification
of suspect fur samples for such cases.
Discrimination of faux fur from real pelt
is easily achieved because the synthetic
polymers cannot be cleaved by trypsin,
therefore they only yield some auto-
proteolytic peptides from trypsin itself.
Unfortunately most falsifications cannot
be recognised so easily. In these cases
the SIAM method is a highly useful tool.
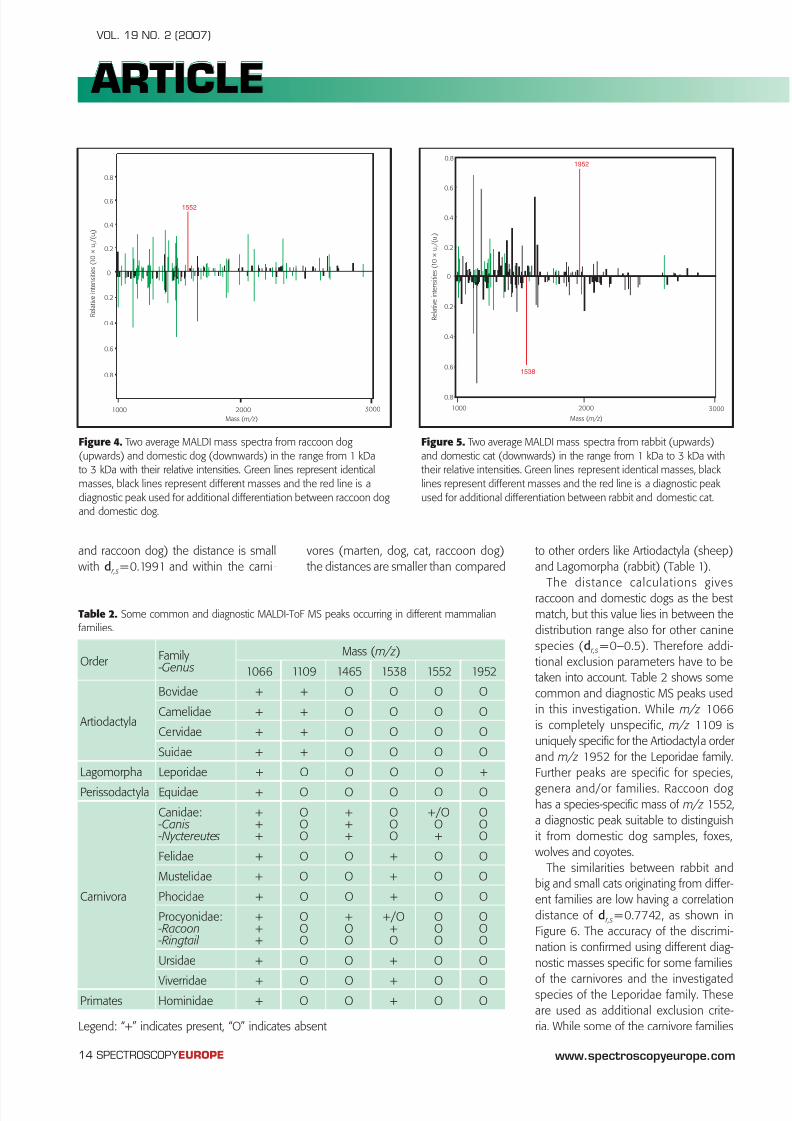
Figures 4 and 5 both show the simi-
larities and differences of mass spectro-
metric average spectra of tryptic digestsfrom raccoon dog against domestic dog
and rabbit against domestic cat, respec-
tively. The green lines indicating common
masses in both spectra also show simi-
lar relative intensities in each, and the
comparison shows the close relationship
between the two species. If black lines
are dominant in the spectral comparison,
the two species are only distantly related.
Within the same family (domestic dog
12 SPECTROSCOPY EUROPE
RTI LE ARTICLE
www.spectroscopyeurope.com
VOL. 19 NO. 2 (2007)
Family Felidae Family Canidae
Species Felis catus Species Nyctereutes procyonoides
Trivial name Domestic cat Trivial name Racoon dog
European pinemarten 0.2682 Domestic dog 0.1991
Domestic dog 0.5207 European pinemarten 0.5119
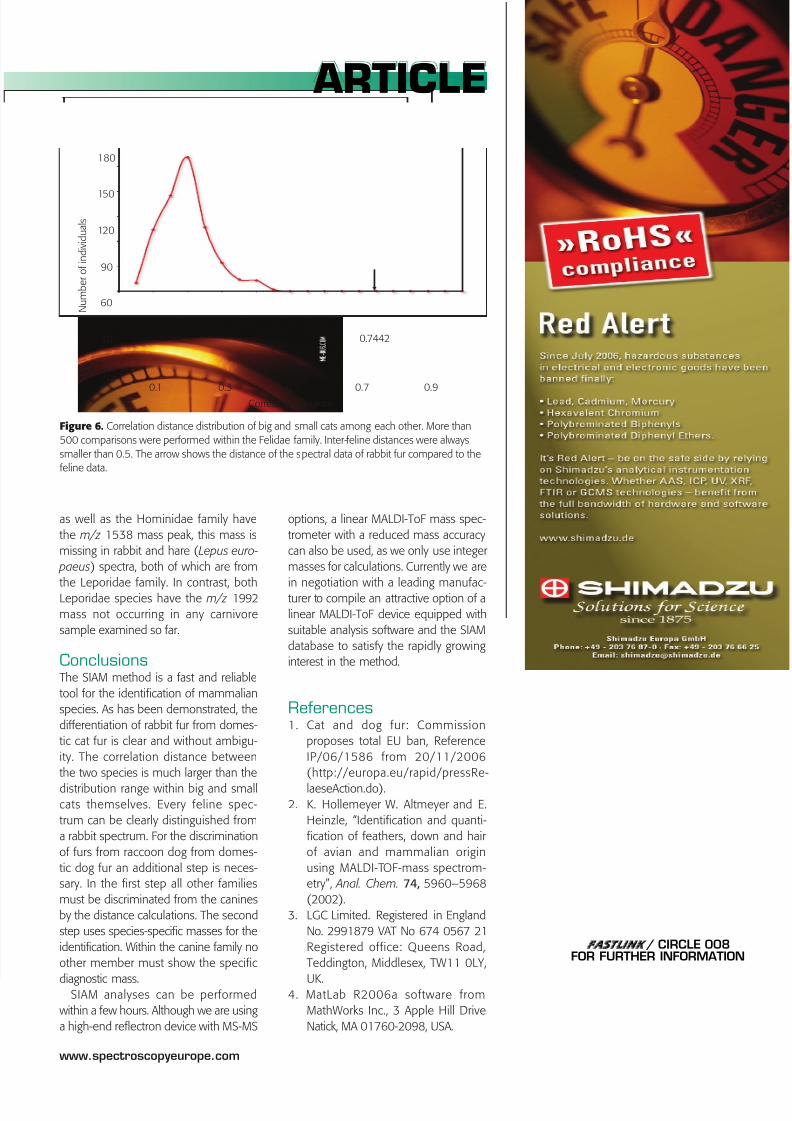
Racoon dog 0.5238 Domestic cat 0.5238Rabbit 0.7442 Rabbit 0.7639
Sheep 0.8998 Sheep 0.9247
Table 1. Correlation distances of mass spectrometric data of tryptic hair digests between domes-tic cat and raccoon dog against some selected species. The larger the correlation distance the
smaller are the spectral similarities.
Figure 2. Dendrogram of the relationship of members of different
zoological orders according their peptide patterns of hair digests. Thediagram reflects a phylogenetical cluster tree. Correlation distanceslarger than 0.6 indicate distant relationships.
Figure 3. Correlation distances of several mammalian species calcu-lated from mass spectrometric data from the tryptic hair analyses.

8/12/2019 Artikel SIAM Eng
http://slidepdf.com/reader/full/artikel-siam-eng 6/8
Upgrade headaches?
Ocean Optics makes it easy!Upgrading is not something you want to spend too much
time on, that’s why we make it easy! Trade-in your
old spectrometers now and upgrade to an
Ocean Optics HR4000CG preconfigured
spectrometer with our SpectraSuite
software at a spectacular price of
€2999.
This spectrometer is based on the
unique Ocean Optics High Resolution
optical bench design, and brings flexibility into your
lab. The built-in compositive-grating allows
for a wide spectral range from 200-
1100nm, and the HR-Bench provides
0.75 nm FWHM resolution. This
makes the HR4000CG the ultimate
general purpose spectrometer for any
application. Especially in combination with
one of our broadband lightsources.
What to do next:
1. Order the HR4000CG & SpectraSuite
2. Send back your old spectrometer
3. Get this package for only €2999
Detector range: 200-1100nm
Resolution: 0.75nm (FWHM)
S/N ratio: 300:1
12 RMS counts dark noise
10μs to 65s integration time
USB2.0 connection
3648 pixels CCD detector
Windows, Mac and Linux com-
patible user interface software
SMA 905 optical connector
+31 26 319 0500
www.oceanoptics.eu
H i g h r e s o l u t i o n
s p e c t r o
m e t e r f o r
o n l y € 2 9 9 9 *
* P r i c e o n
l y v a
l i d a
f t e r a c c e p t e
d t r a d e - i n .
O f f e r o n
l y a p p
l i e s
t o t h e
H R 4 0 0 0 C G s p e c
t r o m e
t e r a n
d i s v a
l i d u n
t i l A p r i l
3 0 s
t , 2 0 0 7
.
FASTLINK / CIRCLE 007 FOR FURTHER INFORMATION
8/12/2019 Artikel SIAM Eng
http://slidepdf.com/reader/full/artikel-siam-eng 7/8
8/12/2019 Artikel SIAM Eng
http://slidepdf.com/reader/full/artikel-siam-eng 8/8