64 lampiran ethical...
TRANSCRIPT

64
Lampiran Ethical Clearance

65
Lampiran Surat Izin Penelitian

66
Lampiran data penelitian Derajat'luka'bakar'kategori'ABA Sepsis Usia Jenis'Kelamin Hemoglobin'(gr%) Leukosit'(sel/mm3) Albumin'(gr/dl)
Berat Ya 35 Laki'C'laki 12,5 7400 1,3
Sedang Ya 78 Laki'C'laki
Berat Ya 37 Laki'C'laki 13,38 7170 1,1
Berat Ya 32 Laki'C'laki 9,1 11500 1,8
Berat Ya 40 Perempuan 6,6 13400 1,4
Berat Ya 26 Laki'C'laki 6,1 17500
Berat Ya 30 Laki'C'laki 9,7 9900 2,0
Berat Ya 29 Perempuan 14,72 16600 4,1
Berat Ya 27 Perempuan 5,9 18500 1,3
Sedang Ya 40 Perempuan 8,2 6500 1,9
Berat Ya 33 Laki'C'laki 13,7 8700 1,4
Berat Tidak 21 Laki'C'laki 17 25100 5
Sedang Tidak 24 Laki'C'laki 10,6 10200 3,1
Sedang Tidak 35 Laki'C'laki 17 8500 2,6
Berat Tidak 44 Laki'C'laki 17 8500 2,6
Berat Tidak 41 Laki'C'laki 9,8 6500 3,9
Sedang Tidak 25 Laki'C'laki 9,6 14200 1,5
Sedang Tidak 40 Perempuan 9,92 9860 2,7
Sedang Tidak 27 Laki'C'laki 17,3 14100
Sedang Tidak 31 Laki'C'laki 13,4 16600
Sedang Tidak 43 Laki'C'laki 11,3 17800
Berat Tidak 32 Laki'C'laki 10,4 12000
Berat Tidak 41 Laki'C'laki 10,96 12800 1,9
Berat Tidak 23 Laki'C'laki 10,7 15600 3,1
Berat Tidak 28 Laki'C'laki
Sedang Tidak 28 Laki'C'laki 10,9 11000
Berat Tidak 36 Perempuan 13,5 10600 2,0
Berat Tidak 37 Laki'C'laki 16,9 9200
Berat Tidak 17 Laki'C'laki 9,88 13500 2,8
Sedang Tidak 21 Laki'C'laki 15,1 19010
Berat Tidak 23 Laki'C'laki 12,9 13900 2,3
Sedang Tidak 21 Perempuan 13,7 16600 1,3
Berat Tidak 40 Laki'C'laki 14,1 21900 1,4
Berat Tidak 21 Laki'C'laki 17,13 43090 4,1
Berat Tidak 18 Laki'C'laki 17 12100
Berat Tidak 28 Laki'C'laki 8,8 5600 3,0
BErat Tidak 36 Laki'C'laki 14,9 8400
Berat Tidak 18 Laki'C'laki 13,07 16630
Berat Tidak 57 Perempuan 9,7 8800 1,6
Berat Tidak 40 Laki'C'laki 11,36 18600 1,9
Sedang Tidak 33 Perempuan 11,2 14200 2,3
Berat Tidak 20 Laki'C'laki
Berat Tidak 22 Laki'C'laki 6,4 13300 2,6
Sedang Tidak 32 Laki'C'laki 13,5 11200 3,1
Sedang Tidak 38 Perempuan 12,6 12970
Berat Tidak 37 Laki'C'laki 3,1
Berat Tidak 23 Laki'C'laki 14 18600
Berat Tidak 30 Laki'C'laki 12,1 11000 1,3
Berat Tidak 29 Perempuan 9,8 8300 3,1
berat tidak 50 laki'C'laki 13,7 5600
Berat Tidak 24 LAki'C'laki 13 6100 1,8
berat tidak 22 laki'C'laki 8,22 12700
berat tidak 45 laki'C'laki 17,5 12600 2,0
berat tidak 41 laki'C'laki
berat tidak 43 perempuan 6,8 4900
berat Tidak 63 perempuan 2,5
Berat Tidak 51 laki'C'laki 11700 2,8
Berat Tidak 24 Perempuan 11,4 18500

67

68
Lampiran Hasil analisis SPSS
Frequencies
Frequency Table
Derajat luka Bakar Kategori ABA
15 25.9 25.9 25.9
43 74.1 74.1 100.0
58 100.0 100.0
Sedang
Berat
Total
Valid
Frequency Percent Valid Percent
Cumulat iv e
Percent
Sepsis
11 19.0 19.0 19.0
47 81.0 81.0 100.0
58 100.0 100.0
Ya
Tidak
Total
Valid
Frequency Percent Valid Percent
Cumulativ e
Percent
Jenis Kelamin
44 75.9 75.9 75.9
14 24.1 24.1 100.0
58 100.0 100.0
Laki-laki
Perempuan
Total
Valid
Frequency Percent Valid Percent
Cumulat iv e
Percent
Komorbid
8 13.8 13.8 13.8
50 86.2 86.2 100.0
58 100.0 100.0
Ada
Tidak ada
Total
Valid
Frequency Percent Valid Percent
Cumulativ e
Percent
Perawatan
11 19.0 19.0 19.0
47 81.0 81.0 100.0
58 100.0 100.0
ICU
Non-ICU
Total
Valid
Frequency Percent Valid Percent
Cumulat iv e
Percent
69
Crosstabs
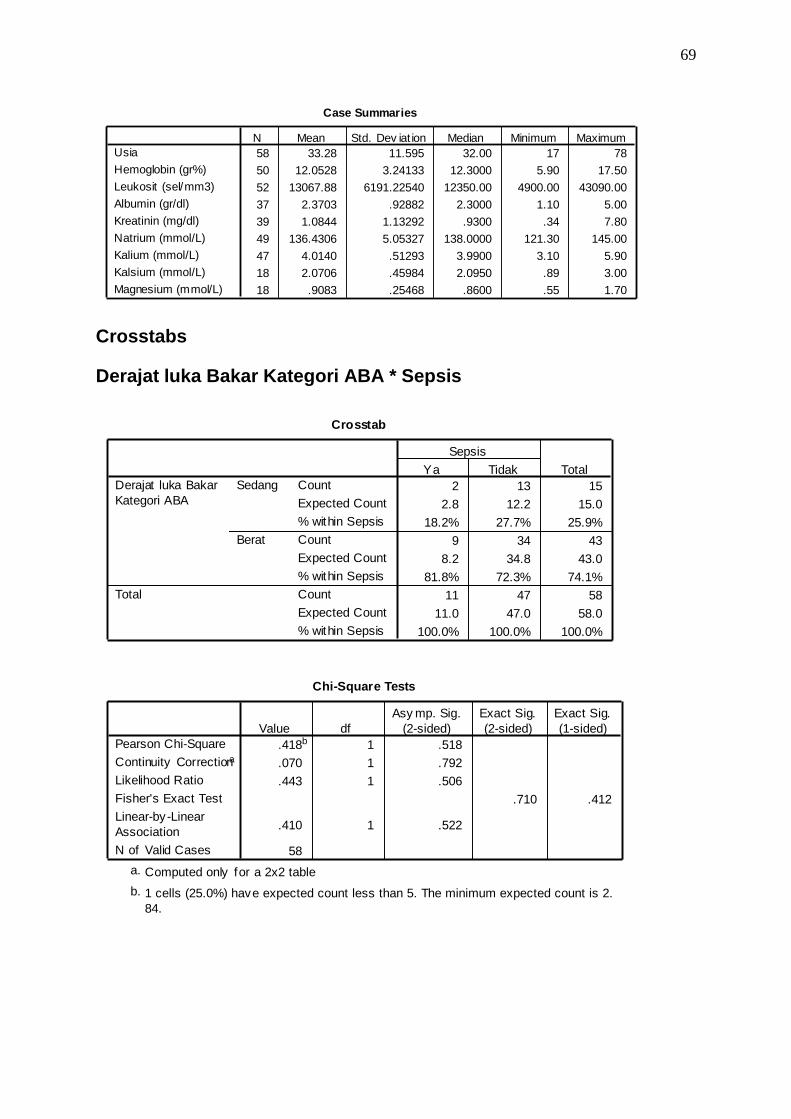
Derajat luka Bakar Kategori ABA * Sepsis
Case Summaries
58 33.28 11.595 32.00 17 78
50 12.0528 3.24133 12.3000 5.90 17.50
52 13067.88 6191.22540 12350.00 4900.00 43090.00
37 2.3703 .92882 2.3000 1.10 5.00
39 1.0844 1.13292 .9300 .34 7.80
49 136.4306 5.05327 138.0000 121.30 145.00
47 4.0140 .51293 3.9900 3.10 5.90
18 2.0706 .45984 2.0950 .89 3.00
18 .9083 .25468 .8600 .55 1.70
Usia
Hemoglobin (gr%)
Leukosit (sel/mm3)
Albumin (gr/dl)
Kreatinin (mg/dl)
Natrium (mmol/L)
Kalium (mmol/L)
Kalsium (mmol/L)
Magnesium (mmol/L)
N Mean Std. Dev iat ion Median Minimum Maximum
Crosstab
2 13 15
2.8 12.2 15.0
18.2% 27.7% 25.9%
9 34 43
8.2 34.8 43.0
81.8% 72.3% 74.1%
11 47 58
11.0 47.0 58.0
100.0% 100.0% 100.0%
Count
Expected Count
% within Sepsis
Count
Expected Count
% within Sepsis
Count
Expected Count
% within Sepsis
Sedang
Berat
Derajat luka Bakar
Kategori ABA
Total
Ya Tidak
Sepsis
Total
Chi-Square Tests
.418b 1 .518
.070 1 .792
.443 1 .506
.710 .412
.410 1 .522
58
Pearson Chi-Square
Continuity Correctiona
Likelihood Ratio
Fisher's Exact Test
Linear-by-Linear
Association
N of Valid Cases
Value df
Asy mp. Sig.
(2-sided)
Exact Sig.
(2-sided)
Exact Sig.
(1-sided)
Computed only for a 2x2 tablea.
1 cells (25.0%) have expected count less than 5. The minimum expected count is 2.
84.
b.

70
Jenis Kelamin * Sepsis
Crosstab
7 37 44
8.3 35.7 44.0
63.6% 78.7% 75.9%
4 10 14
2.7 11.3 14.0
36.4% 21.3% 24.1%
11 47 58
11.0 47.0 58.0
100.0% 100.0% 100.0%
Count
Expected Count
% within Sepsis
Count
Expected Count
% within Sepsis
Count
Expected Count
% within Sepsis
Laki-laki
Perempuan
Jenis Kelamin
Total
Ya Tidak
Sepsis
Total
Chi-Square Tests
1.108b 1 .293
.437 1 .508
1.034 1 .309
.433 .247
1.089 1 .297
58
Pearson Chi-Square
Continuity Correctiona
Likelihood Ratio
Fisher's Exact Test
Linear-by-Linear
Association
N of Valid Cases
Value df
Asy mp. Sig.
(2-sided)
Exact Sig.
(2-sided)
Exact Sig.
(1-sided)
Computed only for a 2x2 tablea.
1 cells (25.0%) have expected count less than 5. The minimum expected count is 2.
66.
b.

71
Komorbid * Sepsis
Crosstab
4 4 8
1.5 6.5 8.0
36.4% 8.5% 13.8%
7 43 50
9.5 40.5 50.0
63.6% 91.5% 86.2%
11 47 58
11.0 47.0 58.0
100.0% 100.0% 100.0%
Count
Expected Count
% within Sepsis
Count
Expected Count
% within Sepsis
Count
Expected Count
% within Sepsis
Ada
Tidak ada
Komorbid
Total
Ya Tidak
Sepsis
Total
Chi-Square Tests
5.816b 1 .016
3.709 1 .054
4.757 1 .029
.035 .035
5.715 1 .017
58
Pearson Chi-Square
Continuity Correctiona
Likelihood Ratio
Fisher's Exact Test
Linear-by-Linear
Association
N of Valid Cases
Value df
Asy mp. Sig.
(2-sided)
Exact Sig.
(2-sided)
Exact Sig.
(1-sided)
Computed only for a 2x2 tablea.
1 cells (25.0%) have expected count less than 5. The minimum expected count is 1.
52.
b.
72
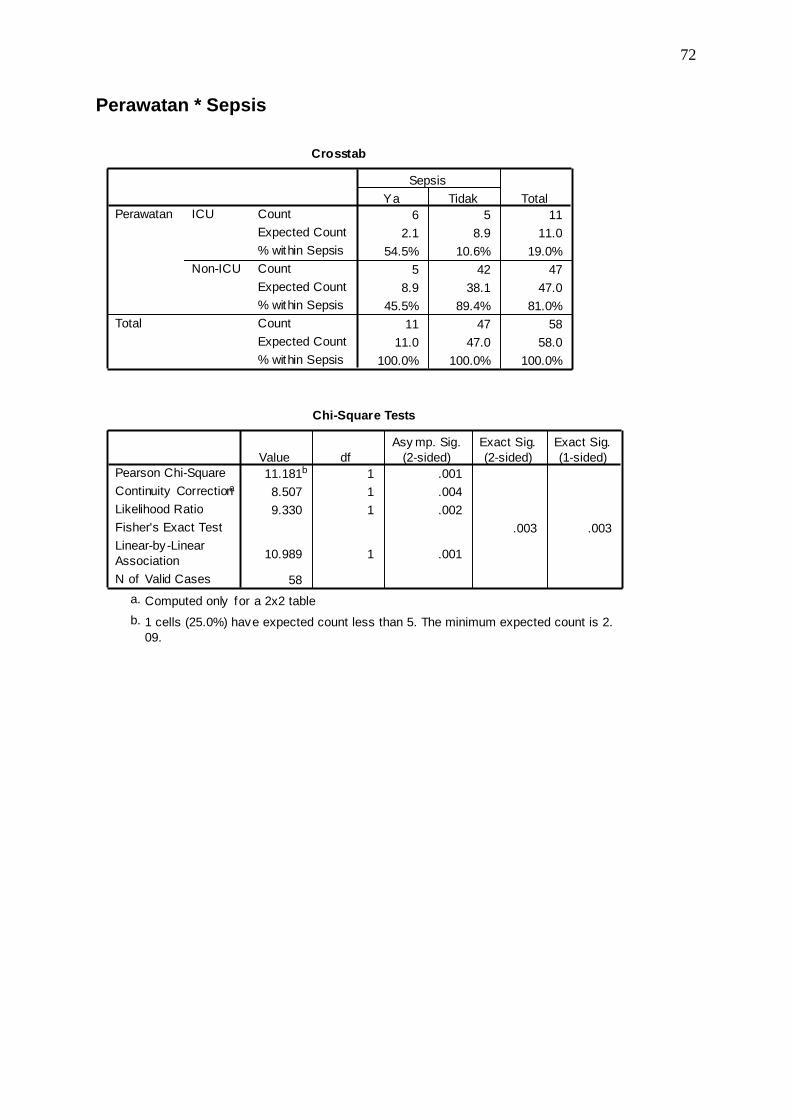
Perawatan * Sepsis
Crosstab
6 5 11
2.1 8.9 11.0
54.5% 10.6% 19.0%
5 42 47
8.9 38.1 47.0
45.5% 89.4% 81.0%
11 47 58
11.0 47.0 58.0
100.0% 100.0% 100.0%
Count
Expected Count
% within Sepsis
Count
Expected Count
% within Sepsis
Count
Expected Count
% within Sepsis
ICU
Non-ICU
Perawatan
Total
Ya Tidak
Sepsis
Total
Chi-Square Tests
11.181b 1 .001
8.507 1 .004
9.330 1 .002
.003 .003
10.989 1 .001
58
Pearson Chi-Square
Continuity Correctiona
Likelihood Ratio
Fisher's Exact Test
Linear-by-Linear
Association
N of Valid Cases
Value df
Asy mp. Sig.
(2-sided)
Exact Sig.
(2-sided)
Exact Sig.
(1-sided)
Computed only for a 2x2 tablea.
1 cells (25.0%) have expected count less than 5. The minimum expected count is 2.
09.
b.

73
Case Summaries
11 10 10 9
37.00 9.9900 11717.0000 1.8111
14.415 3.35595 4535.14682 .91165
33.00 9.4000 10700.0000 1.4000
26 5.90 6500.00 1.10
78 14.72 18500.00 4.10
47 40 42 28
32.40 12.5685 13389.5238 2.5500
10.832 3.03929 6527.97543 .87538
31.00 12.7500 12650.0000 2.6000
17 6.40 4900.00 1.30
63 17.50 43090.00 5.00
58 50 52 37
33.28 12.0528 13067.8846 2.3703
11.595 3.24133 6191.22540 .92882
32.00 12.3000 12350.0000 2.3000
17 5.90 4900.00 1.10
78 17.50 43090.00 5.00
N
Mean
Std. Dev iat ion
Median
Minimum
Maximum
N
Mean
Std. Dev iat ion
Median
Minimum
Maximum
N
Mean
Std. Dev iat ion
Median
Minimum
Maximum
Sepsis
Ya
Tidak
Total
Usia
Hemoglobin
(gr%)
Leukosit
(sel/mm3)
Albumin
(gr/dl)
Case Summaries
7 10 10 4 4
1.9600 136.2200 4.2390 1.9275 .7575
2.60578 5.55794 .85693 .19822 .17765
1.2000 138.0000 4.0450 1.9300 .7650
.34 121.30 3.10 1.72 .55
7.80 140.00 5.90 2.13 .95
32 39 37 14 14
.8928 136.4846 3.9532 2.1114 .9514
.21936 4.99244 .36708 .50927 .26179
.9150 137.0000 3.9300 2.1400 .8750
.51 124.00 3.19 .89 .71
1.24 145.00 5.00 3.00 1.70
39 49 47 18 18
1.0844 136.4306 4.0140 2.0706 .9083
1.13292 5.05327 .51293 .45984 .25468
.9300 138.0000 3.9900 2.0950 .8600
.34 121.30 3.10 .89 .55
7.80 145.00 5.90 3.00 1.70
N
Mean
Std. Dev iat ion
Median
Minimum
Maximum
N
Mean
Std. Dev iat ion
Median
Minimum
Maximum
N
Mean
Std. Dev iat ion
Median
Minimum
Maximum
Sepsis
Ya
Tidak
Total
Kreat inin
(mg/dl)
Natrium
(mmol/L)
Kalium
(mmol/L)
Kalsium
(mmol/L)
Magnesium
(mmol/L)
74
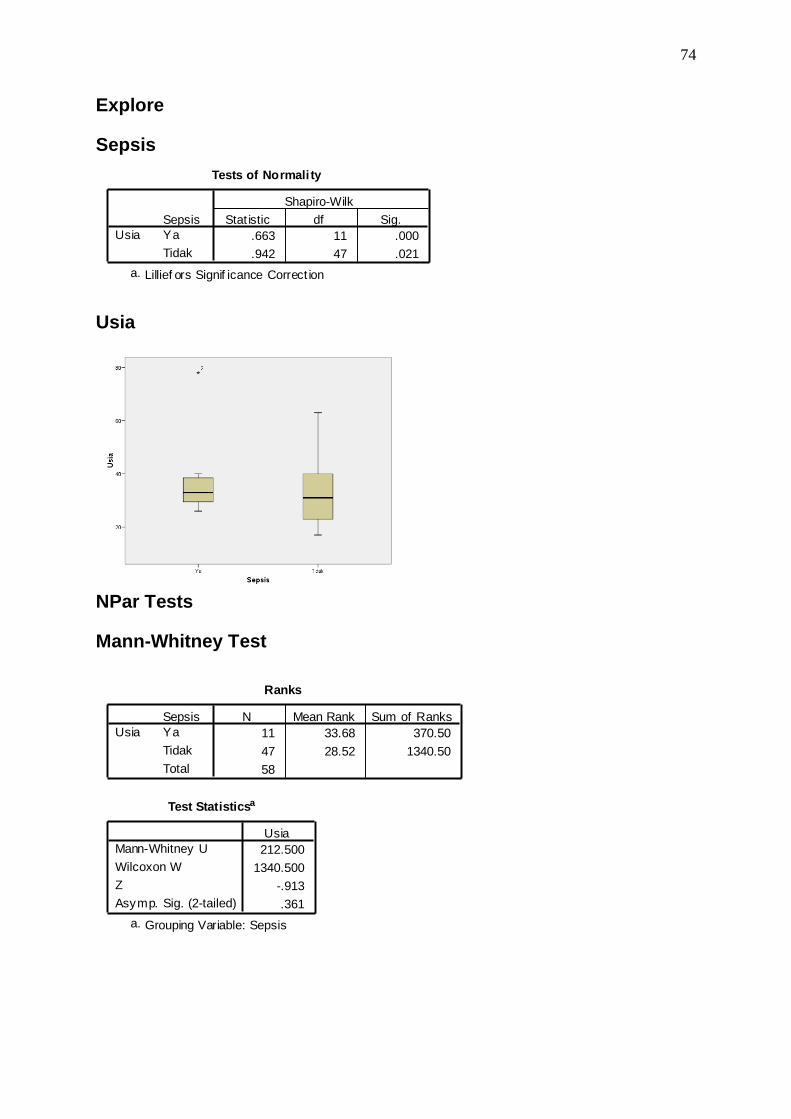
Explore
Sepsis
Usia
NPar Tests
Mann-Whitney Test
Tests of Normali ty
.663 11 .000
.942 47 .021
Sepsis
Ya
Tidak
Usia
Stat istic df Sig.
Shapiro-Wilk
Lillief ors Signif icance Correct iona.
Ranks
11 33.68 370.50
47 28.52 1340.50
58
Sepsis
Ya
Tidak
Total
Usia
N Mean Rank Sum of Ranks
Test Statisticsa
212.500
1340.500
-.913
.361
Mann-Whitney U
Wilcoxon W
Z
Asymp. Sig. (2-tailed)
Usia
Grouping Variable: Sepsisa.
75
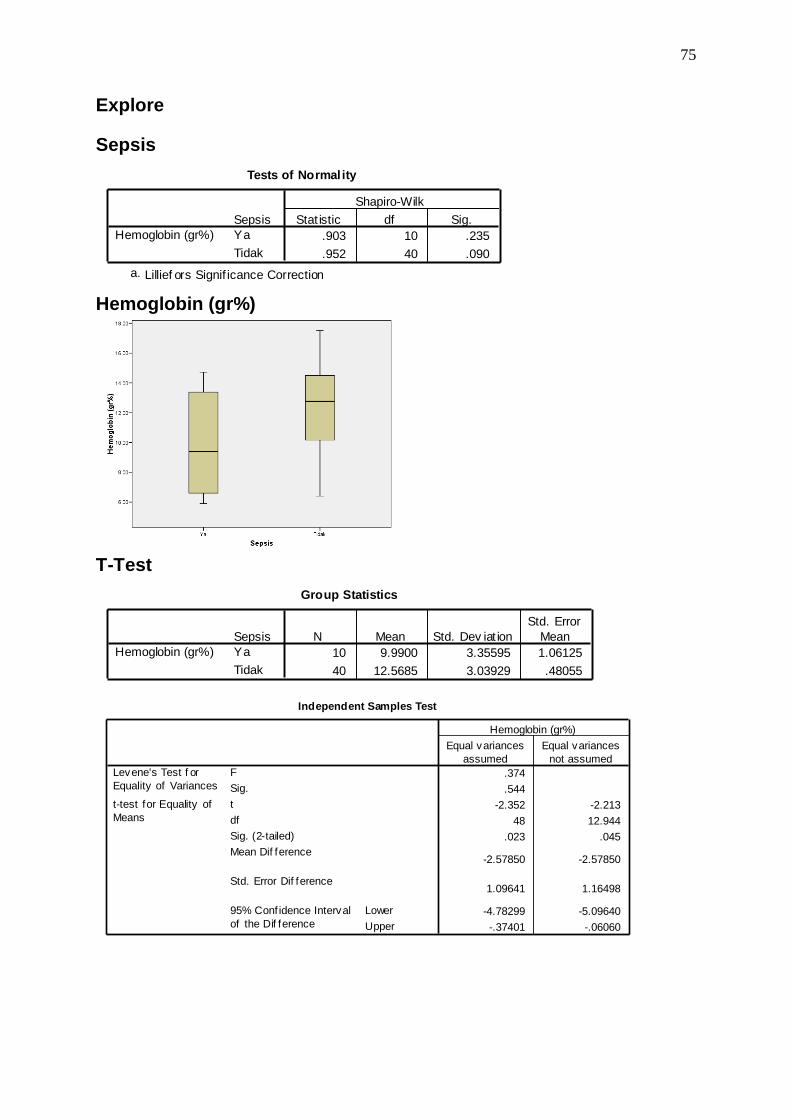
Explore
Sepsis
Hemoglobin (gr%)
T-Test
Tests of Normality
.903 10 .235
.952 40 .090
Sepsis
Ya
Tidak
Hemoglobin (gr%)
Stat istic df Sig.
Shapiro-Wilk
Lillief ors Signif icance Correctiona.
Group Statistics
10 9.9900 3.35595 1.06125
40 12.5685 3.03929 .48055
Sepsis
Ya
Tidak
Hemoglobin (gr%)
N Mean Std. Dev iat ion
Std. Error
Mean
Independent Samples Test
.374
.544
-2.352 -2.213
48 12.944
.023 .045
-2.57850 -2.57850
1.09641 1.16498
-4.78299 -5.09640
-.37401 -.06060
F
Sig.
Levene's Test f or
Equality of Variances
t
df
Sig. (2-tailed)
Mean Dif ference
Std. Error Dif ference
Lower
Upper
95% Conf idence Interval
of the Dif ference
t-test for Equality of
Means
Equal variances
assumed
Equal variances
not assumed
Hemoglobin (gr%)
76
Explore
Sepsis
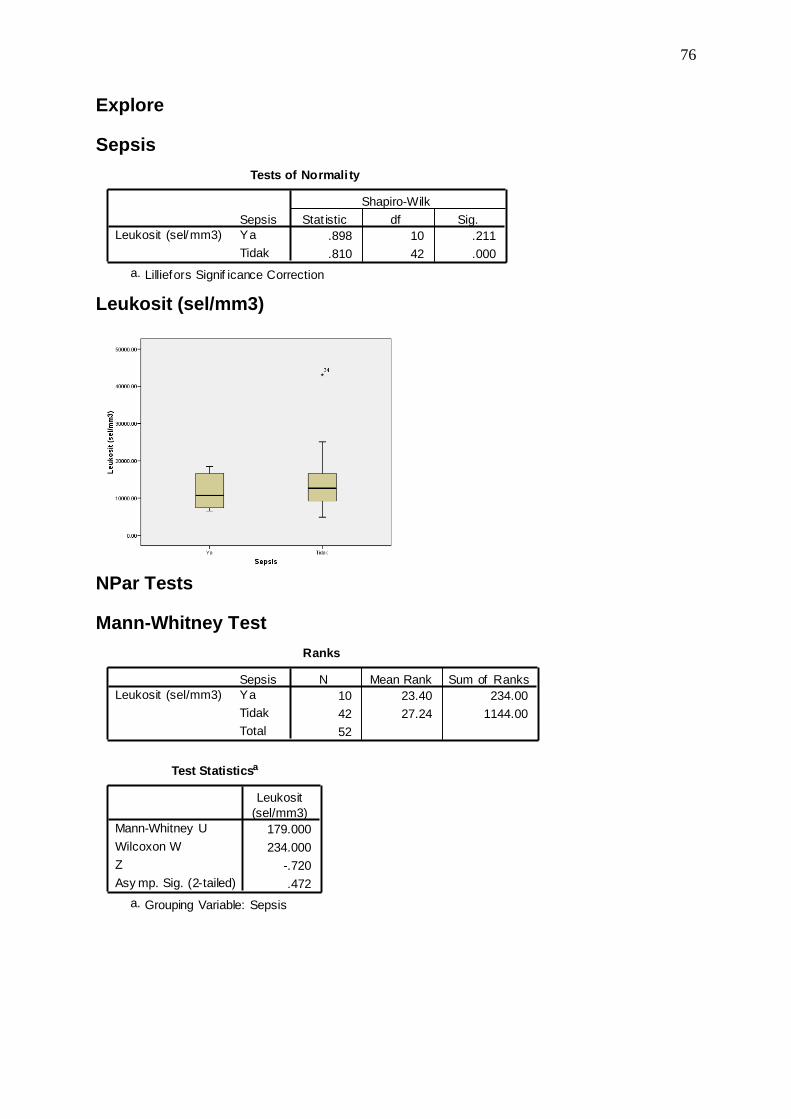
Leukosit (sel/mm3)
NPar Tests
Mann-Whitney Test
Tests of Normali ty
.898 10 .211
.810 42 .000
Sepsis
Ya
Tidak
Leukosit (sel/mm3)
Stat istic df Sig.
Shapiro-Wilk
Lilliefors Signif icance Correctiona.
Ranks
10 23.40 234.00
42 27.24 1144.00
52
Sepsis
Ya
Tidak
Total
Leukosit (sel/mm3)
N Mean Rank Sum of Ranks
Test Statisticsa
179.000
234.000
-.720
.472
Mann-Whitney U
Wilcoxon W
Z
Asy mp. Sig. (2-tailed)
Leukosit
(sel/mm3)
Grouping Variable: Sepsisa.

77
Explore
Sepsis
Albumin (gr/dl)
NPar Tests
Mann-Whitney Test
Tests of Normality
.695 9 .001
.940 28 .113
Sepsis
Ya
Tidak
Albumin (gr/dl)
Stat ist ic df Sig.
Shapiro-Wilk
Lillief ors Signif icance Correctiona.
Ranks
9 11.11 100.00
28 21.54 603.00
37
Sepsis
Ya
Tidak
Total
Albumin (gr/dl)
N Mean Rank Sum of Ranks
Test Statisticsb
55.000
100.000
-2.521
.012
.011a
Mann-Whitney U
Wilcoxon W
Z
Asy mp. Sig. (2-tailed)
Exact Sig. [2*(1-tailed
Sig.)]
Albumin
(gr/dl)
Not corrected f or ties.a.
Grouping Variable: Sepsisb.

78
Explore
Sepsis
Kreatinin (mg/dl)
NPar Tests
Mann-Whitney Test
Tests of Normality
.604 7 .000
.930 32 .039
Sepsis
Ya
Tidak
Kreat inin (mg/dl)
Stat istic df Sig.
Shapiro-Wilk
Lillief ors Signif icance Correct iona.
Ranks
7 24.86 174.00
32 18.94 606.00
39
Sepsis
Ya
Tidak
Total
Kreat inin (mg/dl)
N Mean Rank Sum of Ranks
Test Statisticsb
78.000
606.000
-1.245
.213
.226a
Mann-Whitney U
Wilcoxon W
Z
Asy mp. Sig. (2-tailed)
Exact Sig. [2*(1-tailed
Sig.)]
Kreat inin
(mg/dl)
Not corrected f or ties.a.
Grouping Variable: Sepsisb.
79
Explore
Sepsis
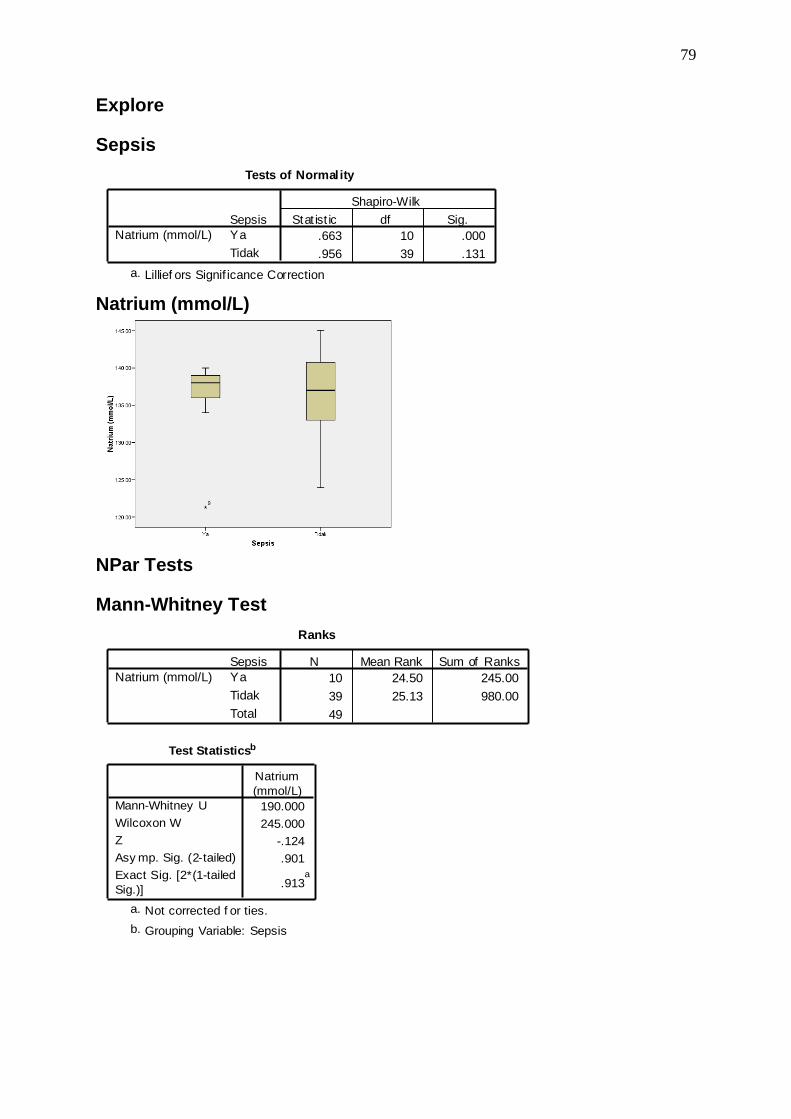
Natrium (mmol/L)
NPar Tests
Mann-Whitney Test
Tests of Normality
.663 10 .000
.956 39 .131
Sepsis
Ya
Tidak
Natrium (mmol/L)
Stat ist ic df Sig.
Shapiro-Wilk
Lillief ors Signif icance Correctiona.
Ranks
10 24.50 245.00
39 25.13 980.00
49
Sepsis
Ya
Tidak
Total
Natrium (mmol/L)
N Mean Rank Sum of Ranks
Test Statisticsb
190.000
245.000
-.124
.901
.913a
Mann-Whitney U
Wilcoxon W
Z
Asy mp. Sig. (2-tailed)
Exact Sig. [2*(1-tailed
Sig.)]
Natrium
(mmol/L)
Not corrected f or ties.a.
Grouping Variable: Sepsisb.
80
Explore
Sepsis
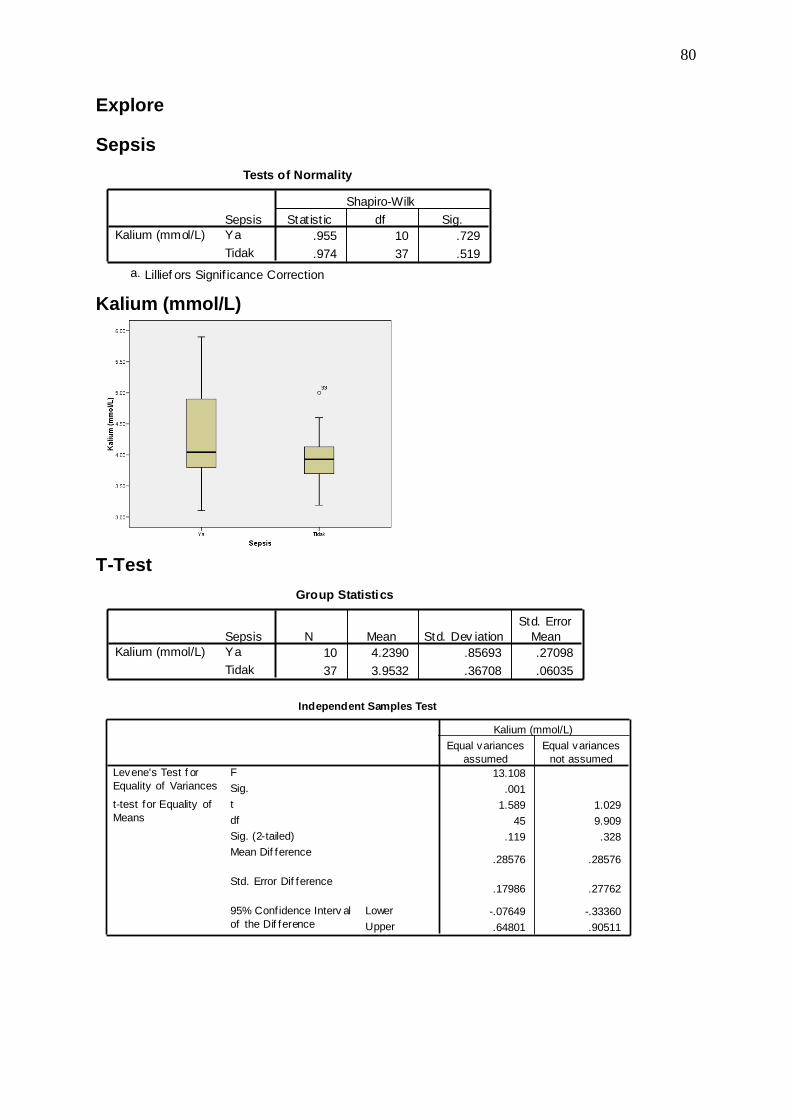
Kalium (mmol/L)
T-Test
Tests of Normality
.955 10 .729
.974 37 .519
Sepsis
Ya
Tidak
Kalium (mmol/L)
Stat ist ic df Sig.
Shapiro-Wilk
Lillief ors Signif icance Correctiona.
Group Statistics
10 4.2390 .85693 .27098
37 3.9532 .36708 .06035
Sepsis
Ya
Tidak
Kalium (mmol/L)
N Mean Std. Dev iation
Std. Error
Mean
Independent Samples Test
13.108
.001
1.589 1.029
45 9.909
.119 .328
.28576 .28576
.17986 .27762
-.07649 -.33360
.64801 .90511
F
Sig.
Levene's Test f or
Equality of Variances
t
df
Sig. (2-tailed)
Mean Dif ference
Std. Error Dif ference
Lower
Upper
95% Conf idence Interv al
of the Dif ference
t-test for Equality of
Means
Equal variances
assumed
Equal variances
not assumed
Kalium (mmol/L)
81
Explore
Sepsis
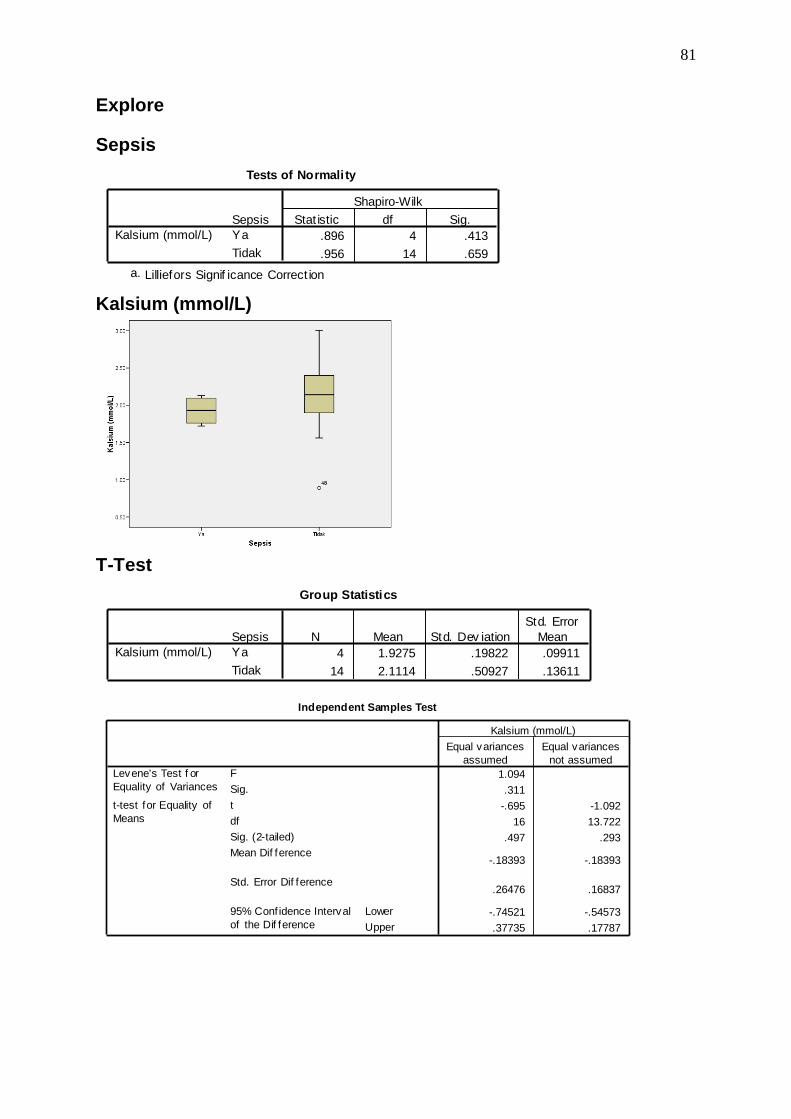
Kalsium (mmol/L)
T-Test
Tests of Normali ty
.896 4 .413
.956 14 .659
Sepsis
Ya
Tidak
Kalsium (mmol/L)
Stat istic df Sig.
Shapiro-Wilk
Lilliefors Signif icance Correct iona.
Group Statistics
4 1.9275 .19822 .09911
14 2.1114 .50927 .13611
Sepsis
Ya
Tidak
Kalsium (mmol/L)
N Mean Std. Dev iation
Std. Error
Mean
Independent Samples Test
1.094
.311
-.695 -1.092
16 13.722
.497 .293
-.18393 -.18393
.26476 .16837
-.74521 -.54573
.37735 .17787
F
Sig.
Levene's Test f or
Equality of Variances
t
df
Sig. (2-tailed)
Mean Dif ference
Std. Error Dif ference
Lower
Upper
95% Conf idence Interval
of the Dif ference
t-test for Equality of
Means
Equal variances
assumed
Equal variances
not assumed
Kalsium (mmol/L)

82
Explore
Sepsis
Magnesium (mmol/L)
NPar Tests
Mann-Whitney Test
Tests of Normality
.971 4 .847
.792 14 .004
Sepsis
Ya
Tidak
Magnesium (mmol/L)
Stat istic df Sig.
Shapiro-Wilk
Lillief ors Signif icance Correctiona.
Ranks
4 6.50 26.00
14 10.36 145.00
18
Sepsis
Ya
Tidak
Total
Magnesium (mmol/L)
N Mean Rank Sum of Ranks
Test Statisticsb
16.000
26.000
-1.276
.202
.233a
Mann-Whitney U
Wilcoxon W
Z
Asy mp. Sig. (2-tailed)
Exact Sig. [2*(1-tailed
Sig.)]
Magnesium
(mmol/L)
Not corrected f or ties.a.
Grouping Variable: Sepsisb.
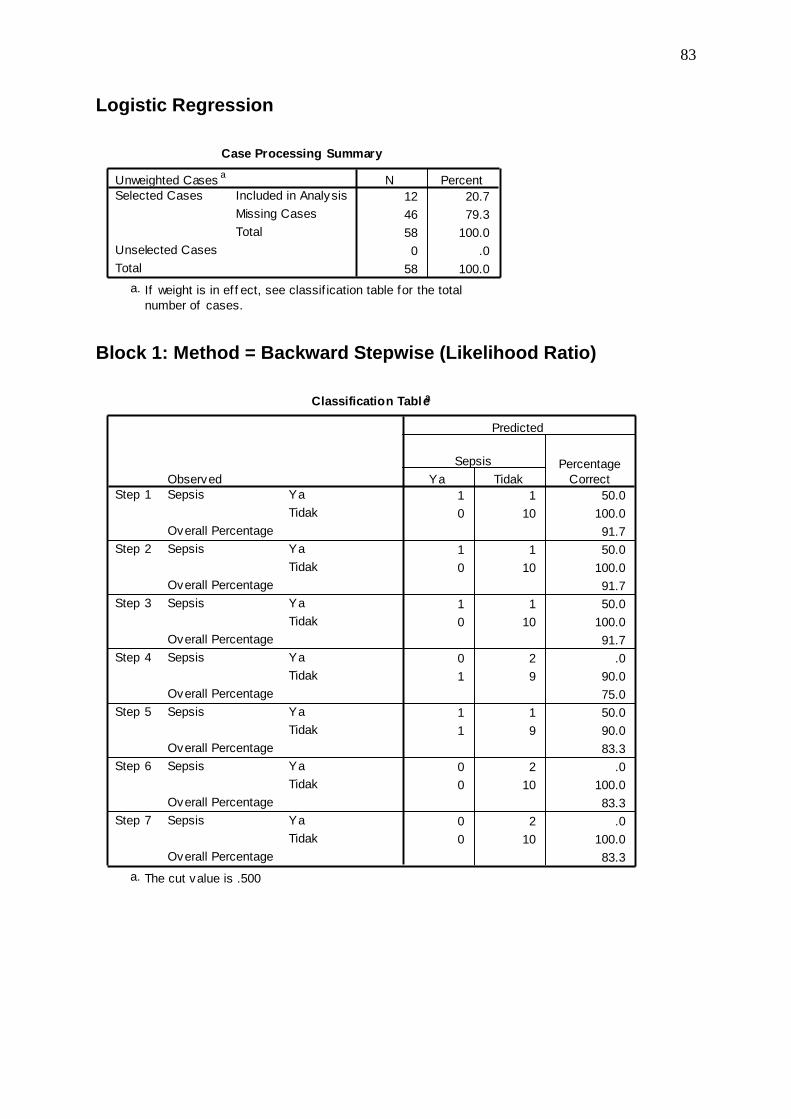
83
Logistic Regression
Block 1: Method = Backward Stepwise (Likelihood Ratio)
Case Processing Summary
12 20.7
46 79.3
58 100.0
0 .0
58 100.0
Unweighted Casesa
Included in Analysis
Missing Cases
Total
Selected Cases
Unselected Cases
Total
N Percent
If weight is in ef f ect, see classif ication table for the total
number of cases.
a.
Classification Tablea
1 1 50.0
0 10 100.0
91.7
1 1 50.0
0 10 100.0
91.7
1 1 50.0
0 10 100.0
91.7
0 2 .0
1 9 90.0
75.0
1 1 50.0
1 9 90.0
83.3
0 2 .0
0 10 100.0
83.3
0 2 .0
0 10 100.0
83.3
Observed
Ya
Tidak
Sepsis
Overall Percentage
Ya
Tidak
Sepsis
Overall Percentage
Ya
Tidak
Sepsis
Overall Percentage
Ya
Tidak
Sepsis
Overall Percentage
Ya
Tidak
Sepsis
Overall Percentage
Ya
Tidak
Sepsis
Overall Percentage
Ya
Tidak
Sepsis
Overall Percentage
Step 1
Step 2
Step 3
Step 4
Step 5
Step 6
Step 7
Ya Tidak
Sepsis Percentage
Correct
Predicted
The cut value is .500a.

84
Variables in the Equation
.733 1.435 .261 1 .609 2.082 .125 34.696
-3.575 6.339 .318 1 .573 .028 .000 6973.437
1.634 8.600 .036 1 .849 5.122 .000 1E+008
-8.056 19.164 .177 1 .674 .000 .000 7E+012
-28.861 40192.909 .000 1 .999 .000 .000 .
10.849 18.374 .349 1 .555 51495.731 .000 2E+020
47.029 80385.811 .000 1 1.000 3E+020
.529 .777 .463 1 .496 1.697 .370 7.787
-2.683 3.369 .634 1 .426 .068 .000 50.388
-5.356 10.665 .252 1 .616 .005 .000 5649093
-25.752 40192.934 .000 1 .999 .000 .000 .
8.097 8.691 .868 1 .352 3284.344 .000 8E+010
44.797 80385.868 .000 1 1.000 3E+019
.363 .624 .338 1 .561 1.437 .423 4.880
-1.952 2.795 .488 1 .485 .142 .001 33.997
-23.157 40192.934 .000 1 1.000 .000 .000 .
6.469 7.570 .730 1 .393 645.112 .000 2E+009
37.623 80385.867 .000 1 1.000 2E+016
-.778 .970 .643 1 .423 .459 .069 3.076
-21.397 40192.962 .000 1 1.000 .000 .000 .
3.305 2.581 1.640 1 .200 27.252 .173 4287.660
40.773 80385.924 .000 1 1.000 5E+017
-21.203 40192.962 .000 1 1.000 .000 .000 .
2.079 1.768 1.384 1 .239 8.000 .250 255.750
40.326 80385.924 .000 1 1.000 3E+017
1.386 1.620 .732 1 .392 4.000 .167 95.756
-.693 2.669 .067 1 .795 .500
1.609 .775 4.317 1 .038 5.000
Hb
Alb
Kreat
Mg
Komorbid
Perawatan
Constant
Step 1a
Hb
Alb
Mg
Komorbid
Perawatan
Constant
Step 2a
Hb
Alb
Komorbid
Perawatan
Constant
Step 3a
Alb
Komorbid
Perawatan
Constant
Step 4a
Komorbid
Perawatan
Constant
Step 5a
Perawatan
Constant
Step 6a
ConstantStep 7a
B S.E. Wald df Sig. Exp(B) Lower Upper
95.0% C.I.f or EXP(B)
Variable(s) entered on step 1: Hb, Alb, Kreat, Mg, Komorbid, Perawatan.a.