1 pertemuan kesembilan sampling and data collection matakuliah: mn j0412/ riset pemasaran tahun:...
Post on 21-Dec-2015
225 views
TRANSCRIPT
1
Pertemuan KesembilanSampling and Data Collection
Matakuliah : MN J0412/ Riset Pemasaran
Tahun : 2007
Versi :
2
Learning Outcomes
Pada akhir pertemuan ini, diharapkan mahasiswa
akan mampu :
• Mahasiswa dapat menyisihkan sampel dan populasi tanpa menghilangkan unsur
3
Outline Materi
• Materi 1: Required Steps in Sampling
• Materi 2: Types of Sampling Plans
• Materi 3: Non Probability Samples
• Materi 4:Probability Samples
• Materi 5: Sample Size
4
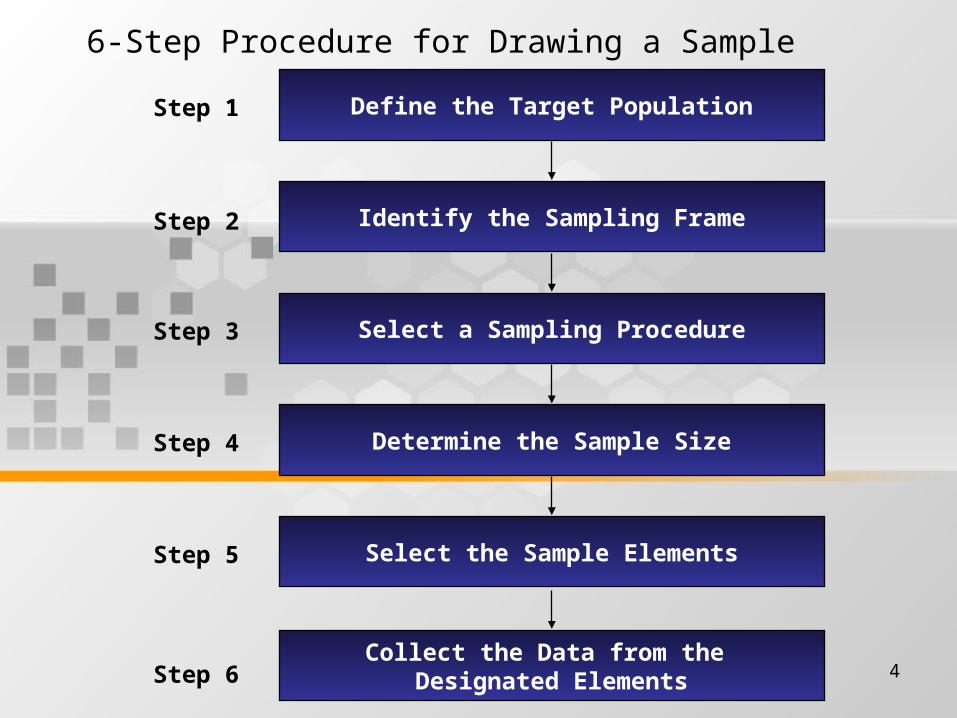
6-Step Procedure for Drawing a Sample
Define the Target Population
Identify the Sampling Frame
Select a Sampling Procedure
Determine the Sample Size
Select the Sample Elements
Collect the Data from the Designated Elements
Step 1
Step 2
Step 4
Step 3
Step 5
Step 6
5
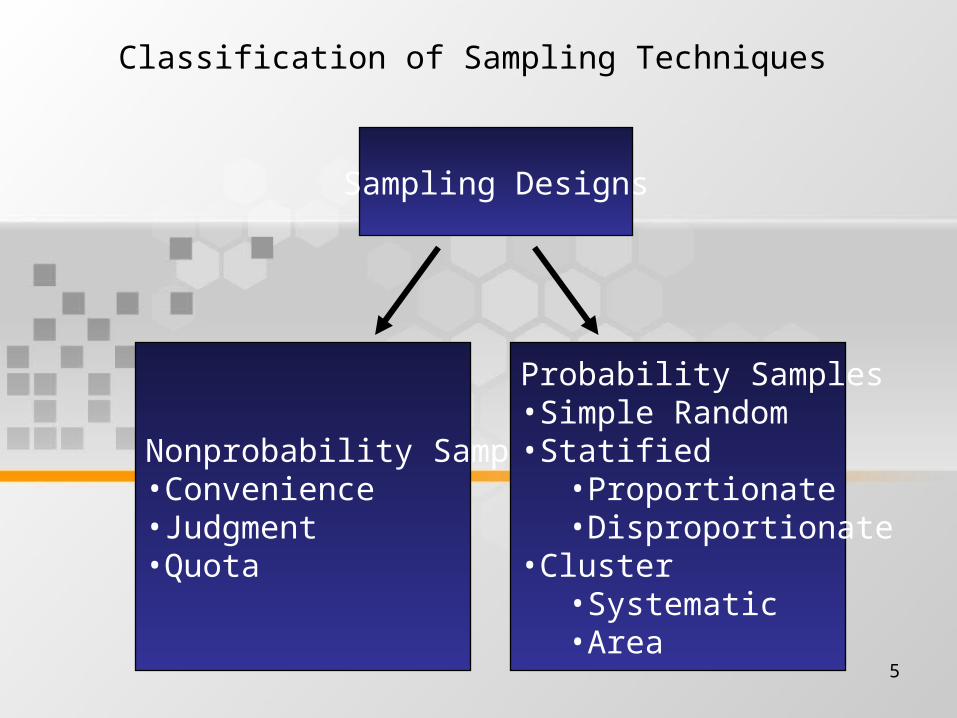
Classification of Sampling Techniques
Sampling Designs
Nonprobability Samples•Convenience•Judgment•Quota
Probability Samples•Simple Random•Statified
•Proportionate•Disproportionate
•Cluster•Systematic•Area
6
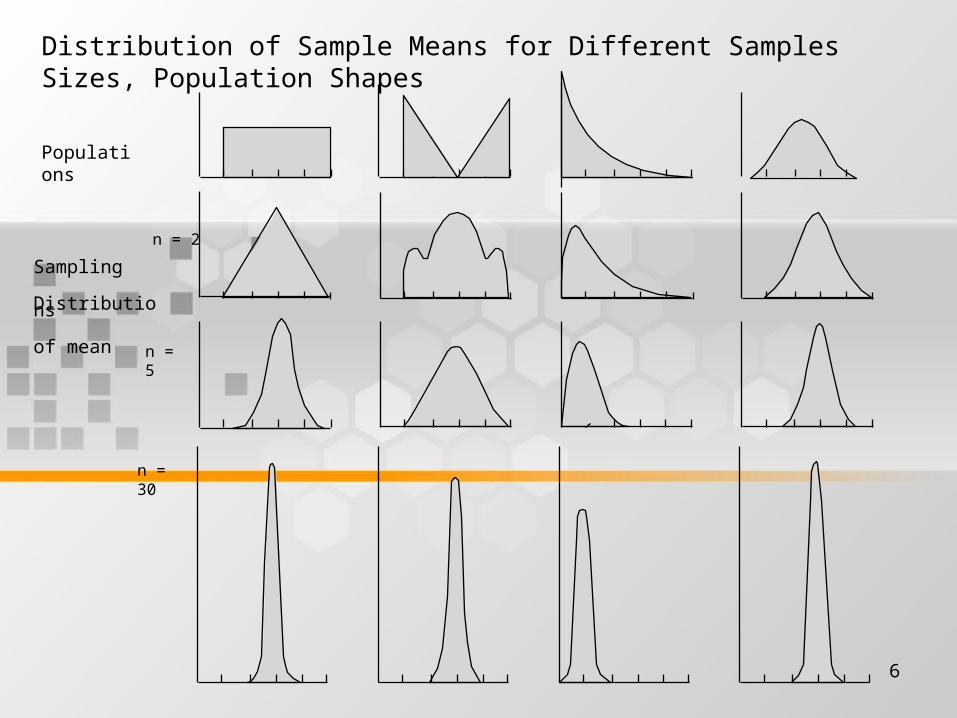
Distribution of Sample Means for Different Samples Sizes, Population Shapes
n = 2
Populations
n = 5
Sampling
Distributions
of mean
n = 30
7
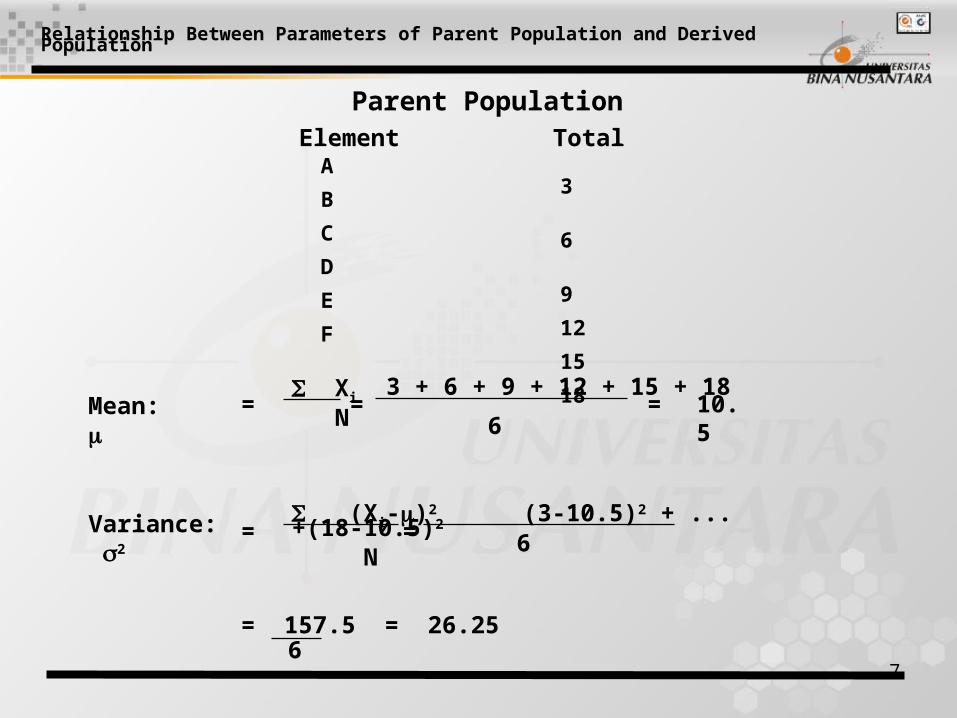
Relationship Between Parameters of Parent Population and Derived Population
A
B
C
D
E
F
Element
Total
Parent Population
3
6
9
12
15
18
Mean:
3 + 6 + 9 + 12 + 15 + 18
6
Xi
N
Variance: 2
(Xi-)2 (3-10.5)2 + ... +(18-10.5)2
N6
= 157.5 = 26.256
=
=
=
=
= 10.5
8
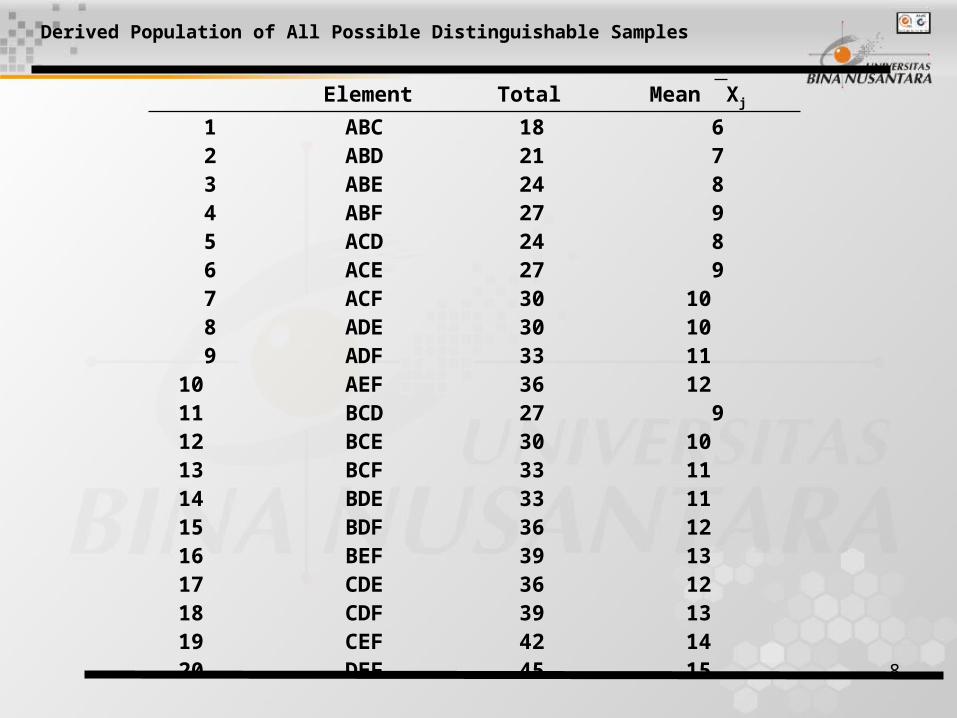
Derived Population of All Possible Distinguishable Samples
1 2 3 4 5 6 7 8 91011121314151617181920
ABCABDABEABFACDACEACFADEADFAEFBCDBCEBCFBDEBDFBEFCDECDFCEFDEF
1821242724273030333627303333363936394245
6 7 8 9 8 910101112 9101111121312131415
Element Total Mean Xj
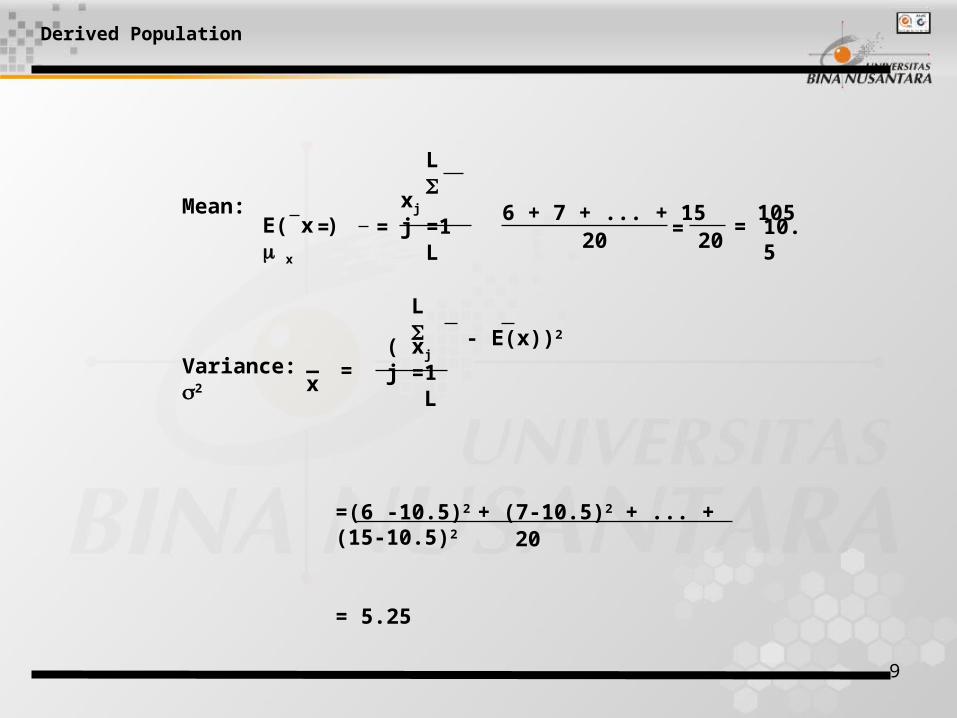
9
Derived Population
Mean:
=(6 -10.5)2 + (7-10.5)2 + ... + (15-10.5)2 2
0
Variance: 2
= 5.25
E( x ) x
L xj
j =1 L
6 + 7 + ... + 15 105
L ( xj
j =1 L
- E(x))2
20 20== = = 10.
5
=_x
10
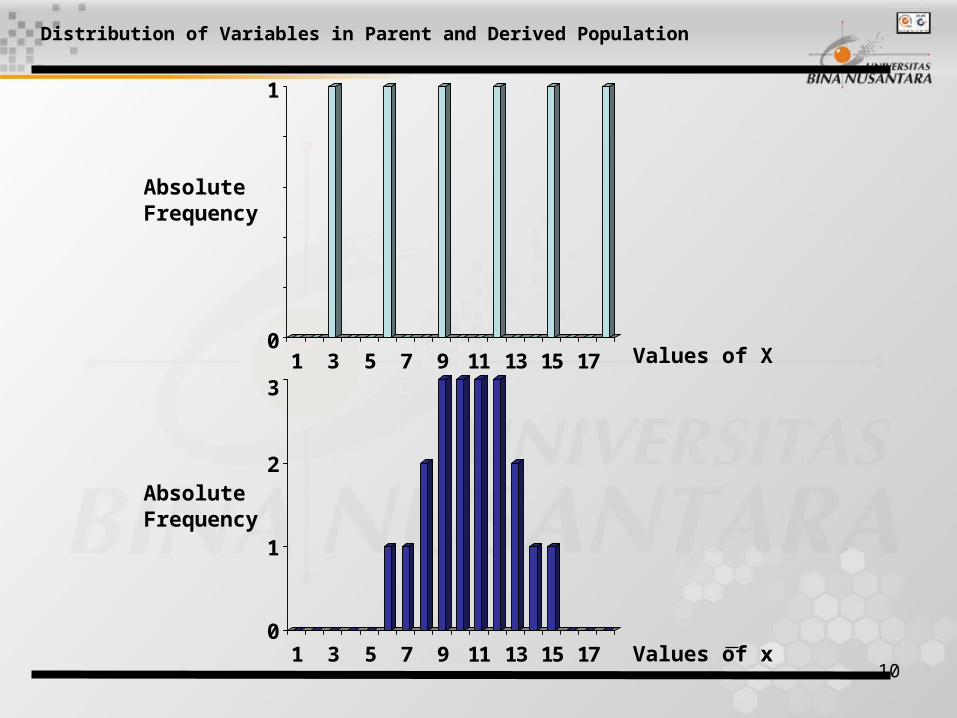
Distribution of Variables in Parent and Derived Population
1 3 5 7 9 11 13 15 17
1 3 5 7 9 11 13 15 17
1
0
1
0
2
3
Values of x
Values of X
AbsoluteFrequency
AbsoluteFrequency
11
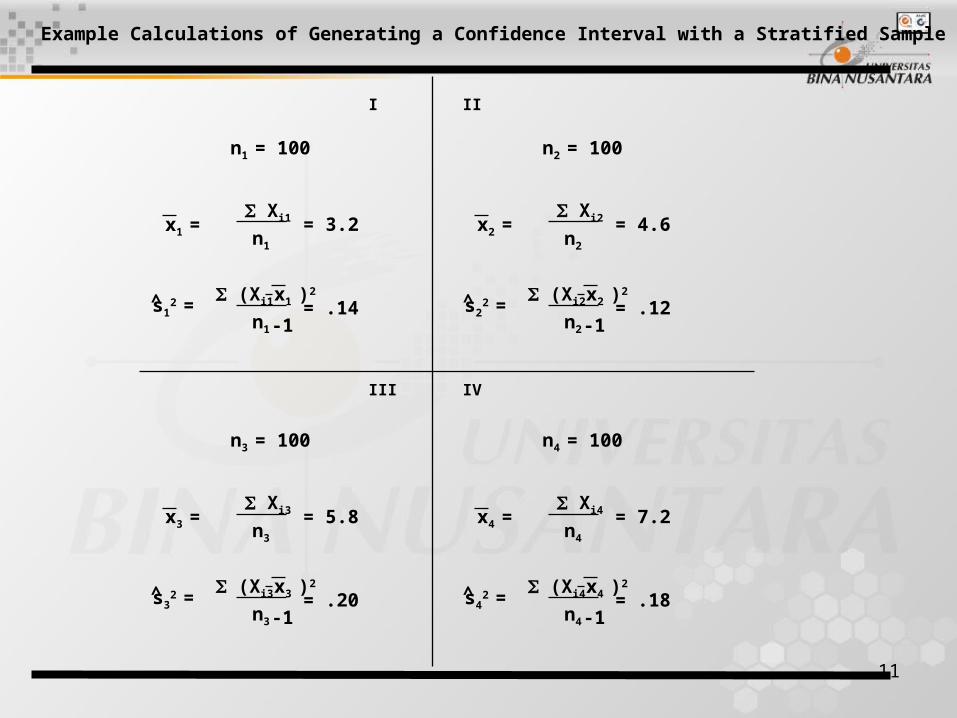
Example Calculations of Generating a Confidence Interval with a Stratified Sample
I II
III IV
n1 = 100
x1 = Xi1 = 3.2n1
x1 )2 (Xi1 = .14n1 -1
s12 = ^
n3 = 100
x3 = Xi3 = 5.8n3
x3 )2 (Xi3 = .20n3 -1
s32 = ^
n4 = 100
x4 = Xi4 = 7.2n4
x4 )2 (Xi4 = .18n4 -1
s42 = ^
n2 = 100
x2 = Xi2 = 4.6n2
x2 )2 (Xi2 = .12n2-1
s22 = ^
12
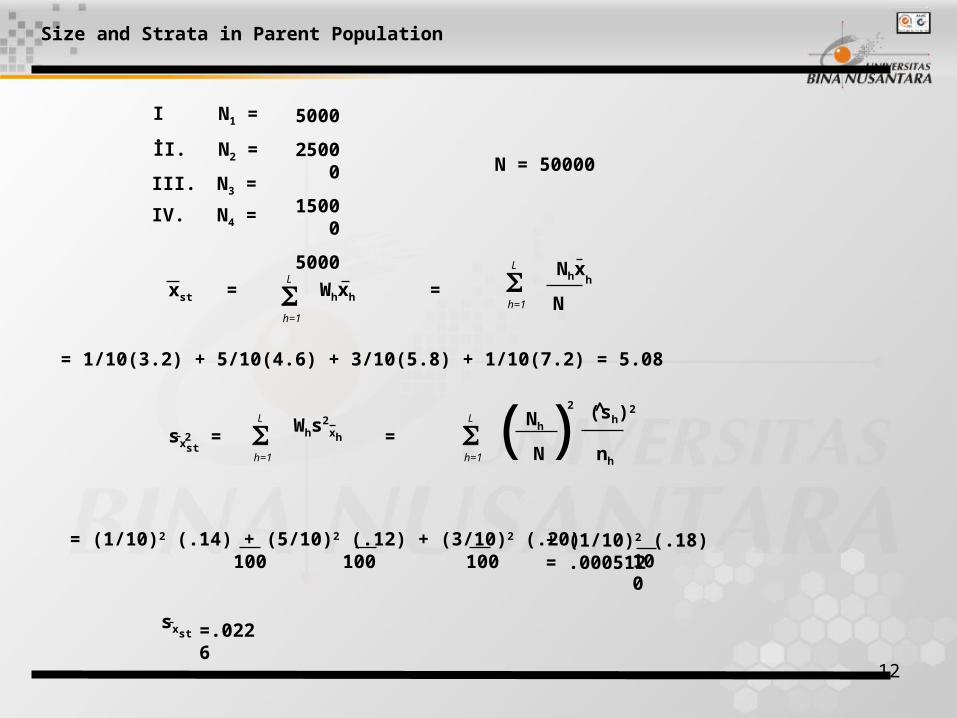
Size and Strata in Parent Population
N1 =
N2 =N3 =N4 =
N = 50000
xst =
= 1/10(3.2) + 5/10(4.6) + 3/10(5.8) + 1/10(7.2) = 5.08
= (1/10)2 (.14) + (5/10)2 (.12) + (3/10)2 (.20)100 100 100
+ (1/10)2 (.18) = .00051210
0
=.0226
Nhxh
NL
h=1Whxh
L
h=1
sxst
= L
h=1
Whs2xh =
Nh
N
2 (sh)2
nh
^
L
h=1
2sxst
=
I.
II.
III.
IV.
5000
25000
15000
5000
( )