tesis – mm2341 sintesis wo menggunakan metode...
TRANSCRIPT
TESIS – MM2341
Sintesis WO3 menggunakan Metode Hidrotermal sebagai Material Anoda Baterai Ion Lithium dengan Kapasitas Balik dan Stabilitas Siklus yang Tinggi AUGUS TINO TRI WIDYANTORO NRP. 2712 201 905 Dosen Pembimbing: Diah Susanti, ST., MT., Ph.D Prof. Chen-Hao Wang PROGRAM MAGISTER BIDANG KEAHLIAN MATERIAL INOVATIF TEKNIK MATERIAL DAN METALURGI Fakultas Teknologi Industri Institut Teknologi Sepuluh Nopember Surabaya 2014

(This page is empty deliberately)
THESIS – MM2341
Synthesis of WO3 via Hydrothermal Method with Improved Reversible Capacity and Cyclic Stability as Anode Material for Lithium-Ion Batteries AUGUS TINO TRI WIDYANTORO NRP. 2712 201 905 Advisor: Diah Susanti, ST., MT., Ph.D Prof. Chen-Hao Wang MASTER DEGREE PROGRAM EXPERTISE AREA OF INNOVATIVE MATERIALS DEPARTMENT OF MATERIALS AND METALLURGICAL ENGINEERING Faculty of Industrial Technology Sepuluh Nopember Institute of Technology Surabaya Indonesia 2014

(This page is empty deliberately)

I00IZ0066IS0
eu?ftes?cs?d ur
z0z90616I'dIN
' C'r{d''Eug' c 9'1,.11'' J' S'urlqcoJooN rft}rqn'I' Z
t00I I 0s00x[02I 0861'dINrS'ntr ''1'g 'ulueuefrDrV ?lsoH 'rC'I
gfn8ue4 uasog
: m [n1e,{uour7mqu1s8uo141
SJI-IJd frnp1e61u€p [€lro1?l l {lu{eJ u€snmf g}E "IJI I Sueng : leduro;
'I0Z InI gI . 1e38ue1
l€.uml: FeH:eped uelSueplsp qeloJ
90 6IOZ ZI'Z : dUNoroluefpr;16 rrJ ourJ sn8ny
:I{elo
SJI-IJC€m1u1e1z11 u€p l?rretr€I I {lu{eJ ro1sr3e61 pnlg urerSot4
Jr1eAouI I€lrotrBIA[ rpnlg 8uep1g eped ('f 'ni) {1uIoI ro1sde141r€lo9qoloredueur lereds nles q€l€s n{nuowaru {n}un uu>lnferg
SISAJ NVTIOdV'I
tEEultFuBd snllls selgtqpls upp lllpg ss4spdpy upFusp
unlqltl uol lprstpg ppouv lEpalpw lsFpqas
t00T7,lt00z9I I 0116I'dIN'cl'qd''I'I^[''J'S'lluusns g8lcl
ulqwlqtued usso(I
lPuralorplH apotsw uplEunE6usut so/v\ slssluts
Sintesis WO3 menggunakan Metode Hidrotermal sebagai Material Anoda Baterai Ion Lithium dengan Kapasitas Balik dan Stabilitas
Siklus yang Tinggi
Nama Mahasiswa : Augus Tino Tri Widyantoro NRP : 2712 201 905 Dosen Pembimbing : (a) Diah Susanti, ST., MT., Ph.D (b) Prof. Chen-Hao Wang
ABSTRAK
Tungsten trioksida memiliki prospek yang bagus untuk dijadikan material anoda baterai ion lithium karena temperatur leleh yang tinggi, stabilitas mekanik yang tinggi, biaya rendah, kapasitas teoritis dan volumetrik yang besar. Tujuan penelitian ini adalah untuk memperkenalkan material anoda baru dengan performa yang tinggi sebagai pengganti grafit pada baterai ion lithium. Heksagonal WO3 telah disintesis menggunakan metode hidrotermal dan kemudian material tersebut dievaluasi sebagai material anoda untuk baterai ion lithium. Rasio molar Na2WO4.2H2O/Na-EDTA dan temperatur reaksi diketahui mempunyai peranan penting terhadap morfologi dan sifat elektrokimia dari produk WO3.
Morfologi WO3 tanpa penambahan NaCl atau Na-EDTA (WO_H180T20) adalah nanopartikel, sedangkan morfologi WO3 dengan penambahan NaCl dan Na-EDTA yang disintesis pada temperatur 210oC (WO_H210T20_CE0.8) adalah rod like structure. WO_H180T20 mempunyai kapasitas discharge awal sebesar 814.3 mAh/g dengan efisiensi pertama sebesar 53.7%. Di sisi lain, WO_H210T20_CE0.8 mempunyai performa elektrokimia yang bagus dengan kapasitas discharge awal 558.9 mAh/g dan effisiensi pertama sebesar 86.9%.
Hal ini membuktikan bahwa h-WO3 adalah salah satu kandidat material yang potensial untuk anoda baterai ion lithium. Peningkatan performa elektrokimia WO3 dapat disebabkan oleh struktur morfologi yang teratur. Na-EDTA tidak hanya diketahui berpengaruh pada keseragaman dan kekristalan yang tinggi pada produk, tetapi juga berperan penting dalam perilaku pertumbuhan WO3 selama proses sintesis.
Nanokomposit tungsten trioksida/reduced grafena oksida (WO3/rGO) juga telah disintesis dengan menggunakan metode hidrotermal dan dievaluasi sebagai material anoda untuk baterai ion lithium. Pada siklus yang pertama, elektroda nanokomposit (WO_H180T20_GO8%) mengasilkan kapasitas discharge sebesar 987.4 mAh/g dengan efisiensi sebesar 64.6%. Selain itu, pada densitas arus 700 mA/g, elektroda ini mampu menghasilkan kapasitas sebesar 219.5 mAh/g setelah 100 siklus. Peningkatan performa elektrokimia pada material ini dapat disebabkan oleh kombinasi struktur yang unik antara WO3 dan rGO.
Kata kunci: Tungsten trioksida, material anoda, baterai ion lithium, efisiensi.
i

(This page is empty deliberately)
ii
Synthesis of WO3 via Hydrothermal Method with Improved Reversible Capacity and Cyclic Stability as Anode Material for
Lithium-Ion Batteries
Student Name : Augus Tino Tri Widyantoro NRP : 2712 201 905 Advisors : (a) Diah Susanti, ST., MT., Ph.D (b) Prof. Chen-Hao Wang
ABSTRACT Tungsten trioxide (WO3) is expected to be profitable in improving of LIBs due
to enhanced safety because of high melting temperature and mechanical stability, low cost, large theoretical capacity (693 mAh/g) and high volumetric capacity. The objective of the contribution is to introduce a high performance anode alternative to graphite for lithium-ion batteries. Hexagonal WO3 was synthesized via hydrothermal route using NaCl and/or Na-EDTA as structure directing templates and then these materials were evaluated as an anode material for lithium ion batteries. The Na2WO4.2H2O/Na-EDTA molar ratio and the reaction temperature are found to play important roles in determining the morphologies and electrochemical properties of the WO3 product.
The morphology of WO3 product without adding either NaCl or Na-EDTA (WO_H180T20) is nanoparticle whereas that of WO3 product with adding NaCl and Na-EDTA synthesized at 210oC (WO_H210T20_CE0.8) is rod like structure. WO_H180T20 has initial discharge capacity of 814.3 mAh/g with a first coulombic efficiency of 53.7%. On the other hand, WO_H210T20_CE0.8 has a g ood electrochemical performance with initial discharge capacity of 558.9 mAh/g and a high first coulombic efficiency of 86.9 %. These proved that h-WO3 is one of good candidate materials for lithium ion battery anode. The improved electrochemical performance of WO3 could be ascribed to the highly ordered self-assemble structures. Na-EDTA is not only found to be responsible for the especially good uniformity and high crystallinity of the products, but also play important role in restricting the natural growing habit of WO3 due to the possible selective interaction between EDTA and certain crystal facets, thus having a great impact over its final morphology.
Tungsten trioxide/reduced graphene oxide (WO3/rGO) nanocomposites also were synthesized via hydrothermal method and evaluated as an anode material for lithium batteries. At first cycle the nanocomposite electrode (WO_H180T20_GO8%) exhibits a discharge capacity of 987.4 mAh/g with a coloumbic efficiency of 64.6%. And at a current density of 700 mA/g it can delivers as high as 219.5 mAh/g after 100 cycles. The improved electrochemical performance could be attributed to the incorporation of rGO and the unique structure of the nanocomposite.
Keywords: Tungsten trioxide, anode materials, lithium ion batteries, coulombic efficiency
iii

(This page is empty deliberately)
iv
PREFACE
Segala puji bagi Allah yang maha pengasih lagi penyayang, Rabb yang
maha menguasai segala ilmu dan kalam. Shalawat dan salam semoga selalu tercurah
kepada Rasulullah Muhammad yang telah menuntun kita kepada jalan kebenaran
dan menjadi suri tauladan yang baik.
Saya ingin mengucapkan terimakasih yang sedalam dalamnya untuk Ibu dan
Bapak saya atas kasih sayang dan do’a yang selalu di panjatkan untuk saya, tanpa
ridho mereka saya tidak akan bisa sampai seperti sekarang ini. Terimakasih juga
kepada kakak-kakak saya, mb Yanti dan mas Anto sekeluarga, yang selalu
mendukung saya.
Special thanks to my supervisor, Prof. Chen-Hao Wang for his support during
these a year, and my co-advisor, Dr. Ming-Yao Cheng (Dr. Matt) and Prof. Bing-Joe
Hwang, who always teach me patiently how to conduct experiment and write a report
in a very good way. I got a lot of experience from them.
I would like to acknowledge bu Diah Susanti, Ph.D, for making possible I got
studied at ITS Surabaya and NTUST, Taiwan.
Last but not least I would like to thank to Hanif and Erik (terimakasih atas
bantuannya selama saya di ITS), mb Nikmah (terimakasih atas nasehatnya), Vuri
(ayo pulang kampung!), Melissa (thanks for your kindly cooperation and
assistances), my roommates at Padepokan 212 yang selalu asyik dan rame (Alvin,
Kevin, Peter and Tri), LiBs group members (Sunny, Wayne, Kurt, Nathen, david,
Bill, Jill, Ase, Ate), E2-518 lab members (Hogie, Hoa, Kha, Thanh, Steven, Hakun,
Benjen, Kha, Mark, Ryker, Sui, Mawan, Demi, Belete, Amare, Andy, Cindy, Doris,
Ethan, Anny), E1-133 lab members (Wei-Ting Tsao, Kai-Chin Wang, Bing-Yuan
Yao, Yu-Chen Shih, Y u-Chuan Lin, Chang-Hui Lin, Nguyenanh Thu, Sun-Tang
Chang, Hsin-Cheng Hsu, Hsin-Chih Huang, Kuan-Cheng Chen, Yu-Chung Chang,
Chung-Ta Chang) and all of my friends from Indonesia that I can not mention one by
one. Thank you for all of your help and kindness. You all guys teach me about life,
not only explicit but also implicit.
v

(This page is empty deliberately)
vi
TABLE OF CONTENTS
ABSTRAK ................................................................................................................ i
ABSTRACT ............................................................................................................ iii
PREFACE ................................................................................................................ v
TABLE OF CONTENTS ...................................................................................... viii
ILUSTRATION ..................................................................................................... xii
LIST OF TABLES ............................................................................................... xvv
1. CHAPTER 1 INTRODUCTION ......................................................................... 1
1.1 Research Background ............................................................................. 1
1.2 Research Objectives ............................................................................... 3
1.3 Research Advantages ............................................................................. 3
2. CHAPTER 2 LITERATURE REVIEW .............................................................. 5
2.1 Lithium Ion Battery Anode..................................................................... 5
2.1.1 Li-ion cell design and components ................................................ 5
2.1.2 Carbon based anodes ..................................................................... 7
2.1.3 Metal and Alloy based Anodes ...................................................... 8
2.1.4 Conversion based Anodes ............................................................. 8
2.2 Tungsten Trioxide (WO3) ...................................................................... 9
2.2 Graphene, Graphene Oxide and reduced Graphene Oxide .................... 12
2.3 Hydrothermal Method .......................................................................... 17
2.3.1 NaCl assisted Hydrothermal ........................................................ 19
2.3.2 Na-EDTA assisted Hydrothermal ................................................ 22
3. CHAPTER 3 EXPERIMENTAL ....................................................................... 27
3.1 Materials .............................................................................................. 27
3.2 Instruments .......................................................................................... 27
vii
3.3 Experiment Procedures .........................................................................28
3.4 Material Characterization ......................................................................33
3.5 Electrochemical Measurement ..............................................................37
4. CHAPTER 4 RESULTS AND DISCUSSION ....................................................39
4.1 WO3 via hydrothermal method using different sodium salts ..................39
4.1.1 Material Characterization of WO3 via a hydrothermal method using
different sodium salts ...................................................................................39
4.1.2 Electrochemical characterization of WO3 via a hydrothermal method
using different sodium salts .........................................................................42
4.2 WO3 via a NaCl & Na-EDTA-assisted hydrothermal with different
reaction temperature.......................................................................................46
4.2.1 Material characterization of WO3 via a NaCl & Na-EDTA-assisted
hydrothermal with different reaction temperatures .......................................46
4.2.2 Electrochemical characterization of WO3 via a NaCl & Na-EDTA-
assisted hydrothermal with different reaction temperatures ..........................49
4.3 WO3 via a NaCl & Na-EDTA-assisted hydrothermal with different Na-
EDTA molar ratio ..........................................................................................52
4.3.1 Material characterization of WO3 via a NaCl & Na-EDTA-assisted
hydrothermal with different Na-EDTA molar ratio ......................................52
4.3.2 Electrochemical characterization of WO3 via a NaCl & Na-EDTA-
assisted hydrothermal with different Na-EDTA molar ratio .........................56
4.4 WO3/rGO via a hydrothermal method with different amount of graphene
oxide 59
4.4.1 Material characterization of WO3/rGO via a hydrothermal method with
different amount of graphene oxide .............................................................59
4.4.2 Electrochemical characterization of WO3/rGO via a hydrothermal
method with different amount of graphene oxide .........................................63
5. CHAPTER 5 CONCLUSIONS AND SUGGESTIONS ......................................69
viii

5.1 Conclusions.......................................................................................... 69
5.2 Suggestions .......................................................................................... 70
REFERENCES....................................................................................................... 73
ENCLOSURE ........................................................................................................ 81
BIOGRAPHY ........................................................................................................ 85
ix

(This page is empty deliberately)
x
ILUSTRATION Figure 2.1 Schematic of lithium ion cell(de las Casas and Li, 2012) ......................... 5
Figure 2.2 Schematic of lithium intercalation in graphite. (a) Lithium is inserted in
every 2nd carbon hexagon and (b) between the graphite layer(de las Casas
and Li, 2012) .......................................................................................... 8
Figure 2.3 Arrangement of [W-O6] octahedral in the structure of hexagonal WO3(Gu
et al., 2007) .......................................................................................... 10
Figure 2.4 The structural model of graphene and GO with carboxyl groups at the
sides(Lerf et al., 1998) .......................................................................... 13
Figure 2.5 Schematic diagram of hydrothermal synthesis of 1D and 2D nanoarrays.
(a) NiO nanorod; (b) Ni(OH)2 nanowall; (c) Co3O4 nanosheet and (d)
Co3O4 nanowire(Yang et al., 2013b) .................................................... 18
Figure 2.6 Schematic illustration of formation of hierarchical WO3 structure in
presence of disodium salt of EDTA under microwave hydrothermal
condition(Adhikari et al., 2014) ............................................................ 25
Figure 3.1 Flow chart of synthesis of WO3 by using NaCl and/or Na-EDTA ......... 29
Figure 3.2 Flow chart of synthesis of graphite oxide ............................................... 30
Figure 3.3 Flow chart of synthesis of WO3/rGO .................................................... 32
Figure 3.4 Bruker D2 Phaser XRD ......................................................................... 33
Figure 3.5 SEM- JEOL JSM-5800 .......................................................................... 34
Figure 3.6 TA Instruments Q500 TGA ................................................................... 35
Figure 3.7 Protrustech ProMaker Raman ................................................................ 36
Figure 3.8 Schematic arrangement of coin cell assembly(Felix, 2012) .................... 37
Figure 4.1 XRD pattern of WO3 synthesized at 180oC for 20 h with different sodium
salts: WO_H180T20 (without NaCl/Na-EDTA), WO_H180T20_C (NaCl
only), WO_H180T20_E (Na-EDTA only) and WO_H180T20_CE (NaCl
&Na-EDTA) ........................................................................................ 40
Figure 4.2 SEM Images of the synthesized WO3 with diferrent sodium salts: (a)
WO_H180T20, (b) WO_H180T20_C, (c) WO_H180T20_E and (d)
WO_H180T20_CE ............................................................................... 41
xi
Figure 4.3 Charge/discharge curves of (a) WO_H180T20, (b) WO_H180T20_C, (c)
WO_H180T20_E, (d) WO_H180T20_CE at 0.1C between 3. 0V and
0.01V (vs. Li/Li+). ...............................................................................42
Figure 4.4 Cyclic voltammogram of (a) WO_H180T20 and (b) WO_H180T20_C for
the 1st three cycles at scan rate 1 mV/s .................................................43
Figure 4.5 (a) Rate cycling performance with increasing current density of the
synthesized WO3 with diferrent sodium salts; (b) Cyclability and (c)
coulombic efficiency at current density = 700 mA/g o f WO_H180T20,
WO_H180T20_C, WO_H180T20_E and WO_H180T20_CE ...............44
Figure 4.6 XRD pattern of WO3 synthesized at different temperatures:
WO_H150T20_CE (150oC), WO_H180T20_CE (180oC) and
WO_H210T20_CE (210oC) ..................................................................46
Figure 4.7 Images of WO3 synthesized at different temperatures: (a)
WO_H150T20_CE (150oC), (b) WO_H180T20_CE (180oC) and
(c)WO_H210T20_CE (210oC) ..............................................................48
Figure 4.8 Charge/discharge curves of (a) WO_H150T20 and (b) WO_H210T20_C
at a current rate of 0.1C at 1st five cycles ..............................................49
Figure 4.9 (a) Rate cycling performance with increasing current density of WO3
synthesized at different reaction temperatures, (b) Cyclability and (c)
Coulombic efficiency at current density = 700 m A/g o f
WO_H150T20_CE, WO_H180T20_CE and WO_H210T20_CE ..........50
Figure 4.10 XRD pattern of WO3 synthesized at different molar ratio of Na-EDTA to
NaCl: 0.4, 0.8, 1 and 1.6 .......................................................................52
Figure 4.11 SEM Images of WO3 synthesized at different molar ratio of Na-EDTA
to NaCl: ( a) WO_H210T20_CE0.4, (b) WO_H210T20_CE0.8, (c)
WO_H210T20_CE, (d) WO_H210T20_CE1.6 and
(e) WO_H210T20_CE0.8 ( high magnification)....................................54
Figure 4.12 Charge/discharge curves of (a) WO_H210T20_CE0.4, (b)
WO_H210T20_CE0.8, and (c) WO_H210T20_CE1.6 at a current rate of
0.1C. (d) Cyclic voltammetry of WO_H210T20_CE0.8 ........................56
Figure 4.13 (a) Rate cycling performance of WO3 synthesized at different Na-EDTA
molar ratio with increasing current density, (b) Cyclability and (c)
coulombic efficiency at current density = 700 mA/g of
WO_H210T20_CE0.4, WO_H210T20_CE0.8, WO_H210T20_CE and
WO_H210T20_CE1.6.......................................................................... 58
Figure 4.14 XRD pattern of WO3/graphene synthesized at different amount of
graphene oxide ..................................................................................... 59
Figure 4.15 Raman Spectra of as-synthesized WO3 with different amount of
graphene oxide ..................................................................................... 60
Figure 4.16 TGA curves of (a) WO_H180T20_GO4%, (b) WO_H180T20_GO6%
and (c) WO_H180T20_GO8% ............................................................. 61
Figure 4.17 SEM images of (a) WO_H180T20_GO4%, (b) WO_H180T20_GO6%
and (c) WO_H180T20_GO8% ............................................................. 62
Figure 4.18 Charge/discharge curves of (a) WO_H180T20_GO4%, (b)
WO_H180T20_GO6% and (c) WO_H210T20_GO8% at a current rate
of 0.1C. (d) Cyclic voltammetry of WO_H210T20_GO4%. ................ 63
Figure 4.19 (a) Rate cycling performance with increasing current density of
WO3/graphene synthesized at different amount of graphene oxide, (b)
Cyclability and (c) coulombic efficiency at current density = 700 mA/g
of WO_H180T20, WO_H180T20_GO4%, WO_H180T20_GO6% and
WO_H210T20_GO8% ......................................................................... 65
Figure 4.20 Cycle life performance of WO3 based anode materials with different
composition and heat treatment at current rate of 0.2 C for 50 cycles.... 67
xiii

(This page is empty deliberately)
xiv
LIST OF TABLES Table 2.1 Most common anode materials used for lithium ion batteries(Goriparti et
al., 2014) ................................................................................................ 6
Table 2.2 The properties of NaCl(John M. Hills, 2014) .......................................... 20
Table 4.1 The crytalline size of WO3 synthesized at different sodium salts ............. 40
Table 4.2 First discharge capacity and coulombic efficiency of WO3 with different
Na salts ................................................................................................ 42
Table 4.3 The crytalline size of WO3 synthesized at different reaction temperatures
............................................................................................................. 47
Table 4.4 First discharge capacity and coulombic efficiency of WO3 with different
reaction temperatures ........................................................................... 49
Table 4.5 The crytalline size of WO3 synthesized at different amount of Na-EDTA 53
Table 4.6 First discharge capacity and coulombic efficiency of WO3 with different
Na-EDTA molar ratio .......................................................................... 57
Table 4.7 The crystalline size of WO3/rGO synthesized at different amount of GO 60
Table 4.8 First discharge capacity and coulombic efficiency of WO3 with different
amount of graphene oxide .................................................................... 64
xv

(This page is empty deliberately)
xvi
1. CHAPTER 1
INTRODUCTION
1.1 Research Background
Lithium-ion batteries play a significant role as energy storage devices in the
communications, transportation and renewable-energy sectors. Graphite is current
choice of anode materials for lithium-ion batteries due to its relatively low cost,
abundant material supply and long cycle life. However, the low energy density
(375mAh/g) and safety issues related to lithium deposition become disadvantages
of graphite(Shukla and Prem Kumar, 2013). Thus, there has been a great
challenge in developing alternative anode materials with high energy density, long
cycle life, enhanced safety, and low cost (Larcher et al., 2007).
Tungsten oxide (WO3) has received wide attention owing to its promising
application for gas sensors, electrochromic and photochromic devices, secondary
batteries, photocatalysts, heterogeneous catalysts, solar energy devices, field
electron emission and electrocatalyst (Ham et al., 2010). Hexagonal form of
tungsten trioxide (h-WO3) is of great interest owing to its well-known tunnel
structure and a promising material for negative electrodes of rechargeable lithium
batteries(Gu et al., 2007).
WO3 is expected to be profitable in improving of LIBs due to enhanced
safety because of high melting temperature and mechanical stability, low cost and
large theoretical capacity (∼700 mAh/g). More importantly, a very high
volumetric capacity can be expected considering its high theoretical density of
7.61 g cm−3 (Yoon et al., 2011). However, the low 1st coulumbic efficiency and
the poor cyclability of this material during the continuous charge/discharge
cycling are the main disadvantages that restrained the application of WO3 as
anode material for lithium-ion batteries. This problem is mainly attributed to the
formation of solid electrolyte interface layer (Wang et al., 2014).
Although substantial progress has been made in different material system,
there is less reports for WO3 in the field of energy conversion/storage such us Li-
Ion battery(Sasidharan et al., 2012). Gu et al., 2007 have prepared hexagonal
tungsten trioxide nanowires in a large scale by a simple hydrothermal method
1
without any templates and catalysts. However it only delivers a low discharge
capacity of 218 mAh/ with a coulombic efficiency of 75.6% for the first cycle.
Meanwhile an ordered mesoporous WO3-x with high electrical conductivity (m-
WO3-x) was prepared by Yoon et al., 2011 as an anode material for lithium ion
batteries (LIBs). It exhibits a reversible capacity of 748 mAh/g with 1st coulombic
efficiency is only 53%.
Furthermore, Yin et al., 2012 had synthesized γ-WO3 hierarchical
nanostructures by using a biomolecule-assisted hydrothermal approach between
Na2WO4·2H2O and glycine acid. However it has only discharge capacity of 515.1
mAh/g and coulombic efficiency of 62.4% for the first cycle.
To understand the effect of nanostructure to the elecrochemical performance
of WO3, we investigate the preparation of WO3 via hydrothermal synthesis under
various structure directing agents. Hydrothermal process offers significant
advantages in controlling over the product shape and size at low processing
temperature, extreme homogeneity, and low cost. NaCl was used as a crystal
modifier to control the growth rate of the product and Na-EDTA was used as a
chelating ligand and structure-directing agent to produce h-WO3 nanocrystal. In
the last part, rGO was added into WO3 to improve its electrochemical
performance. rGO could not only induce formation of fine particles with uniform
dispersion and control its morphology through high chemical functionality, but
also shorten lithium ion transporting distance and increase electronic conductivity,
then the metal oxides could display longer cycle life and better rate performance.
Subsequently, the structures and morphologies of WO3 were analyzed by
using X-ray Difraction (XRD), Scanning Electron Microscopy (SEM), Thermo
gravimetric analysis (TGA) and Raman Spectroscopy. Meanwhile,
electrochemical properties were analyzed by using galvanostatic charge-discharge
and cyclic voltammetry.
2
1.2 Research Objectives
The objectives of this work are to:
a. Study the effect of sodium salts as structure directing agents on the
morphologies and electrochemical performances of WO3.
b. Study the effect of reaction temperature on the morphologies and
electrochemical performances of WO3.
c. Study the effect of Na-EDTA molar ratio on the morphologies and
electrochemical performances of WO3.
d. Study the effect of GO weight ratio on the morphologies and electrochemical
performances of WO3.
1.3 Research Advantages
This work is expected to produce WO3 that can be applied as anode
material for lithium ion battery which has a high capacity, high reversible
capacity, high capacity retention and long cycle life.
3

(This page is empty deliberately)
4
2. CHAPTER 2
LITERATURE REVIEW
2.1 Lithium Ion Battery Anode
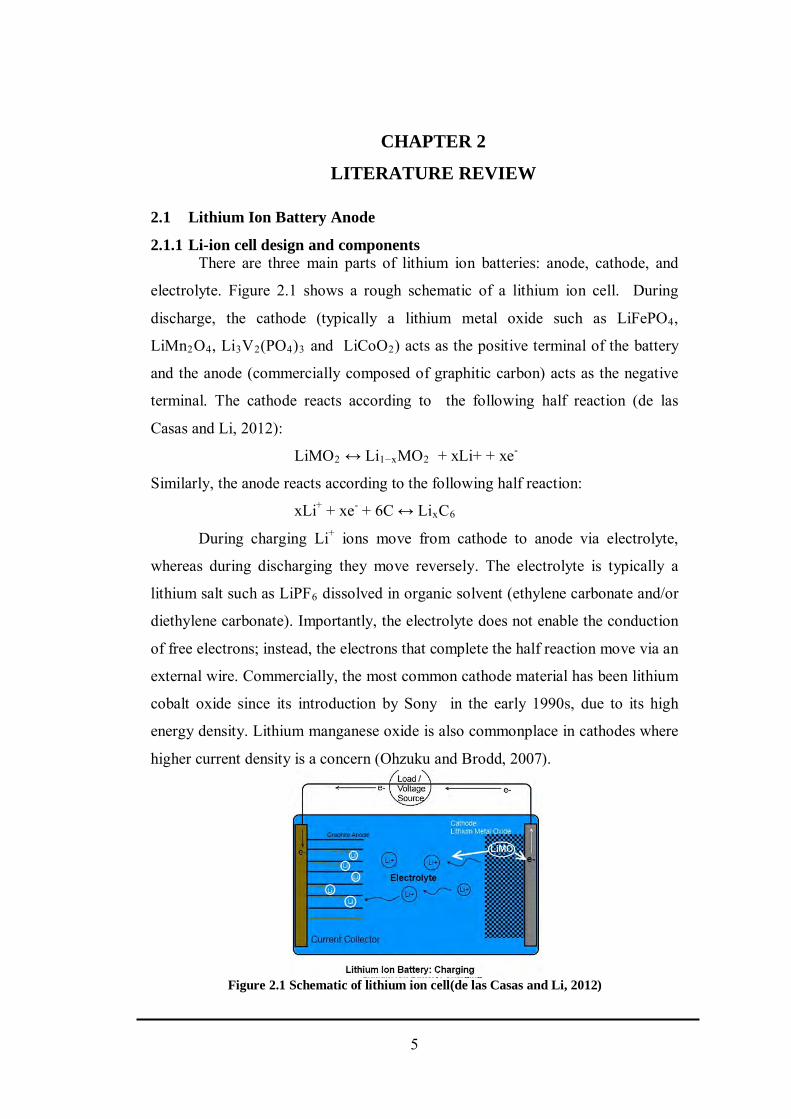
2.1.1 Li-ion cell design and components There are three main parts of lithium ion batteries: anode, cathode, and
electrolyte. Figure 2.1 shows a rough schematic of a lithium ion cell. During
discharge, the cathode (typically a lithium metal oxide such as LiFePO4,
LiMn2O4, Li3V2(PO4)3 and LiCoO2) acts as the positive terminal of the battery
and the anode (commercially composed of graphitic carbon) acts as the negative
terminal. The cathode reacts according to the following half reaction (de las
Casas and Li, 2012):
LiMO2 ↔ Li1−xMO2 + xLi+ + xe-
Similarly, the anode reacts according to the following half reaction:
xLi+ + xe- + 6C ↔ LixC6
During charging Li+ ions move from cathode to anode via electrolyte,
whereas during discharging they move reversely. The electrolyte is typically a
lithium salt such as LiPF6 dissolved in organic solvent (ethylene carbonate and/or
diethylene carbonate). Importantly, the electrolyte does not enable the conduction
of free electrons; instead, the electrons that complete the half reaction move via an
external wire. Commercially, the most common cathode material has been lithium
cobalt oxide since its introduction by Sony in the early 1990s, due to its high
energy density. Lithium manganese oxide is also commonplace in cathodes where
higher current density is a concern (Ohzuku and Brodd, 2007).
Figure 2.1 Schematic of lithium ion cell(de las Casas and Li, 2012)
5
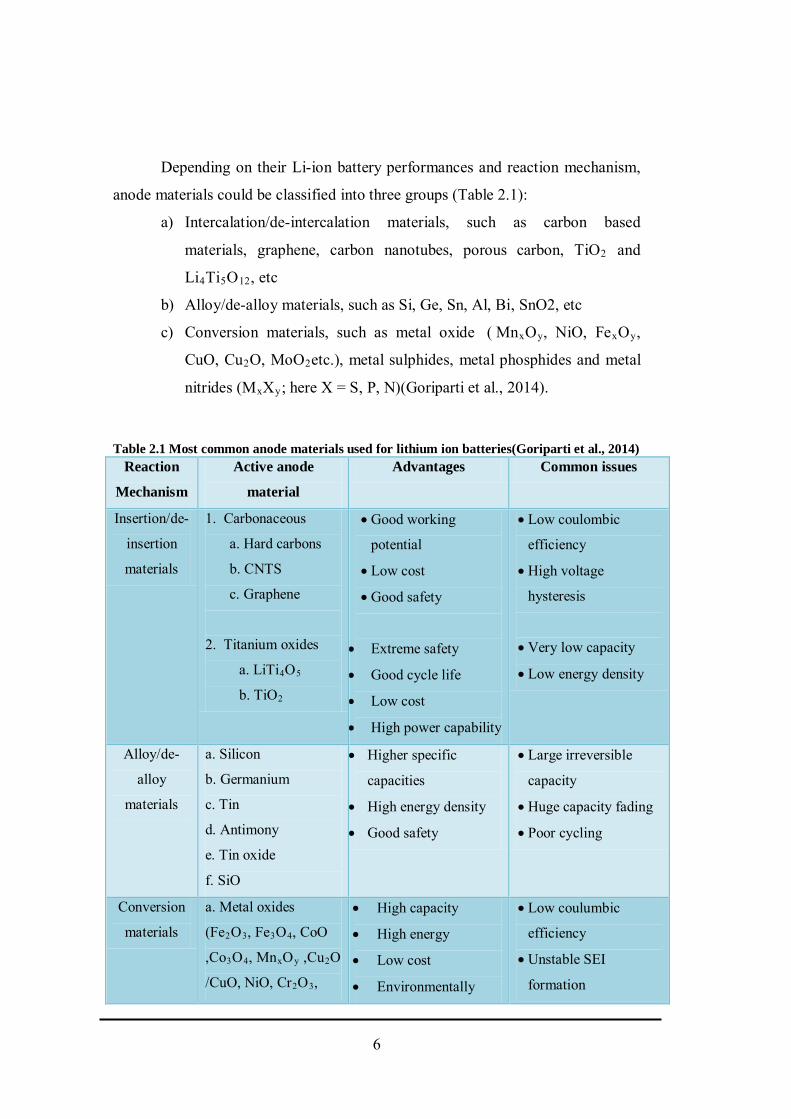
Depending on their Li-ion battery performances and reaction mechanism,
anode materials could be classified into three groups (Table 2.1):
a) Intercalation/de-intercalation materials, such as carbon based
materials, graphene, carbon nanotubes, porous carbon, TiO2 and
Li4Ti5O12, etc
b) Alloy/de-alloy materials, such as Si, Ge, Sn, Al, Bi, SnO2, etc
c) Conversion materials, such as metal oxide ( MnxOy, NiO, FexOy,
CuO, Cu2O, MoO2etc.), metal sulphides, metal phosphides and metal
nitrides (MxXy; here X = S, P, N)(Goriparti et al., 2014).
Table 2.1 Most common anode materials used for lithium ion batteries(Goriparti et al., 2014) Reaction
Mechanism
Active anode
material
Advantages Common issues
Insertion/de-
insertion
materials
1. Carbonaceous
a. Hard carbons
b. CNTS
c. Graphene
2. Titanium oxides
a. LiTi4O5
b. TiO2
• Good working
potential
• Low cost
• Good safety
• Extreme safety
• Good cycle life
• Low cost
• High power capability
• Low coulombic
efficiency
• High voltage
hysteresis
• Very low capacity
• Low energy density
Alloy/de-
alloy
materials
a. Silicon
b. Germanium
c. Tin
d. Antimony
e. Tin oxide
f. SiO
• Higher specific
capacities
• High energy density
• Good safety
• Large irreversible
capacity
• Huge capacity fading
• Poor cycling
Conversion
materials
a. Metal oxides
(Fe2O3, Fe3O4, CoO
,Co3O4, MnxOy ,Cu2O
/CuO, NiO, Cr2O3,
• High capacity
• High energy
• Low cost
• Environmentally
• Low coulumbic
efficiency
• Unstable SEI
formation
6
RuO2, MoO2/MoO3,
etc.)
b. Metal phoshides/
sulfides/ nitrides
(MXy; M = Fe, Mn,
Ni, Cu, Co etc. and
X=P, S, N)
compatibility
• High specific
capacity
• Low operation
potential and Low
• polarization than
counter oxide
• Large potential
hysteresis
• Poor cycle life
• Poor capacity
retention
• Short cycle life
• High cost of
production
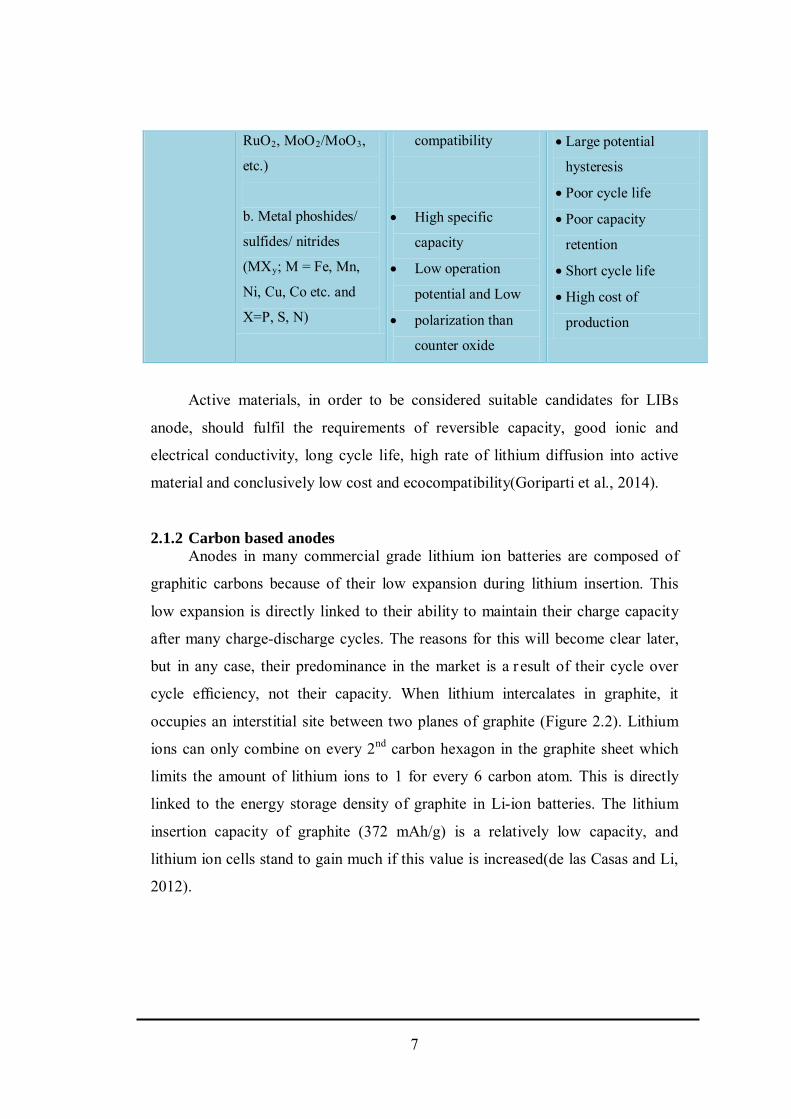
Active materials, in order to be considered suitable candidates for LIBs
anode, should fulfil the requirements of reversible capacity, good ionic and
electrical conductivity, long cycle life, high rate of lithium diffusion into active
material and conclusively low cost and ecocompatibility(Goriparti et al., 2014).
2.1.2 Carbon based anodes Anodes in many commercial grade lithium ion batteries are composed of
graphitic carbons because of their low expansion during lithium insertion. This
low expansion is directly linked to their ability to maintain their charge capacity
after many charge-discharge cycles. The reasons for this will become clear later,
but in any case, their predominance in the market is a r esult of their cycle over
cycle efficiency, not their capacity. When lithium intercalates in graphite, it
occupies an interstitial site between two planes of graphite (Figure 2.2). Lithium
ions can only combine on every 2nd carbon hexagon in the graphite sheet which
limits the amount of lithium ions to 1 for every 6 carbon atom. This is directly
linked to the energy storage density of graphite in Li-ion batteries. The lithium
insertion capacity of graphite (372 mAh/g) is a relatively low capacity, and
lithium ion cells stand to gain much if this value is increased(de las Casas and Li,
2012).
7
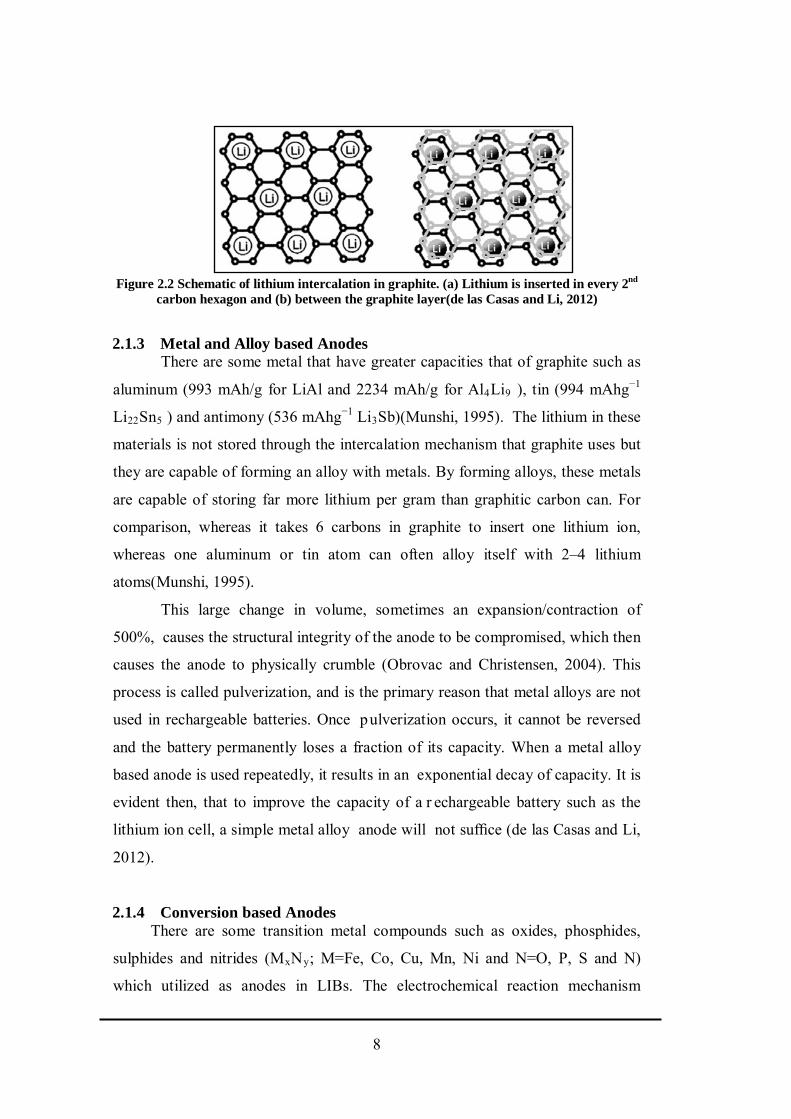
Figure 2.2 Schematic of lithium intercalation in graphite. (a) Lithium is inserted in every 2nd carbon hexagon and (b) between the graphite layer(de las Casas and Li, 2012)
2.1.3 Metal and Alloy based Anodes There are some metal that have greater capacities that of graphite such as
aluminum (993 mAh/g for LiAl and 2234 mAh/g for Al4Li9 ), tin (994 mAhg−1
Li22Sn5 ) and antimony (536 mAhg−1 Li3Sb)(Munshi, 1995). The lithium in these
materials is not stored through the intercalation mechanism that graphite uses but
they are capable of forming an alloy with metals. By forming alloys, these metals
are capable of storing far more lithium per gram than graphitic carbon can. For
comparison, whereas it takes 6 carbons in graphite to insert one lithium ion,
whereas one aluminum or tin atom can often alloy itself with 2–4 lithium
atoms(Munshi, 1995).
This large change in volume, sometimes an expansion/contraction of
500%, causes the structural integrity of the anode to be compromised, which then
causes the anode to physically crumble (Obrovac and Christensen, 2004). This
process is called pulverization, and is the primary reason that metal alloys are not
used in rechargeable batteries. Once pulverization occurs, it cannot be reversed
and the battery permanently loses a fraction of its capacity. When a metal alloy
based anode is used repeatedly, it results in an exponential decay of capacity. It is
evident then, that to improve the capacity of a r echargeable battery such as the
lithium ion cell, a simple metal alloy anode will not suffice (de las Casas and Li,
2012).
2.1.4 Conversion based Anodes There are some transition metal compounds such as oxides, phosphides,
sulphides and nitrides (MxNy; M=Fe, Co, Cu, Mn, Ni and N=O, P, S and N)
which utilized as anodes in LIBs. The electrochemical reaction mechanism
8
involving these compounds together with lithium, implies the reduction/oxidation
of the transition metal along with the composition/decomposition of lithium
compounds (LixNy; here N=O, P, S and N). Anodes based on these compounds
(included WO3) exhibit high reversible capacities (500-1000 mAh/g) owing to the
participation of a high number of electrons in the conversion reactions. The
electrochemical conversions reactions can be described as follows(Goriparti et al.,
2014):
MxNy+zLi++ze- ⇿ LizNy + xM (here M= Fe, Co, Cu, Mn or Ni & N= O, P or N)
2.2 Tungsten Trioxide (WO3)
Tungsten oxide (WOx) has received wide attention because it has many
application such as gas sensors, electrochromic and photochromic devices,
secondary batteries, photocatalysts, heterogeneous catalysts, solar energy devices,
field electron emission and electrocatalyst in electrolysis of water for hydrogen
production (Ham et al., 2010). Tungsten has many oxidation states, i.e., 2, 3, 4, 5
and 6, thereofore the tungsten compound can exist in many forms. For instance,
the typical forms of tungsten oxides are tungsten (VI) oxide: WO3 (lemon yellow
appearance) and tungsten (IV) oxide: WO2 (brown and blue appearance)
(Supothina et al., 2007).
WO3 with different morphologies such as nanowires, nanorods, nanoplates
and nanoparticles were successfully synthesized by various methods, including
hydrothermal reaction (Li et al., 2006), thermal oxidization (Siciliano et al., 2008),
inorganic–organic hybrid method (Chen et al., 2008), pulsed spray pyrolysis
deposition technique (Bathe and Patil, 2009), and wet chemical precipitation
(Wolcott et al., 2006). Among them, hydrothermal process offers significant
advantages in controlling over the product shape and size at high homogeneity,
low cost and low processing temperature by combining with soft templates as
chelating ligands and capping reagents, such as ethylene diamine tetraacetate acid
(EDTA), polyethylene glycol (PEG) and polyvinyl alcohol (PVA) to produce 1D
nanostructure (Ham et al., 2010).
9
There are some kinds of precursors for large-scale production of WO3.
These can use a variety of different precursors, for example: sodium tungstate
hydrate, tungsten oxychloride, tungsten alkoxide, dissolved tungsten metal,
tungsten hexachloride, tungsten oxide and hydrated ammonium metatungstate
(Baker et al., 2002).
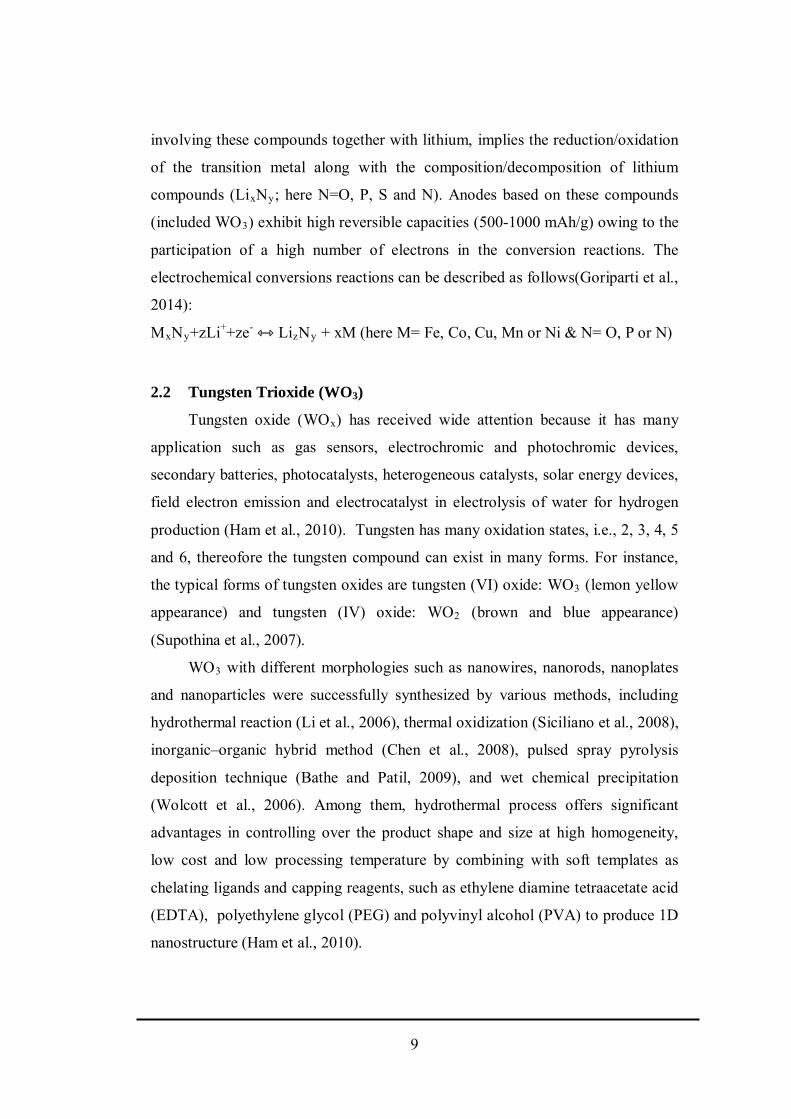
Hexagonal form of tungsten trioxide (Figure 2.3) is of great interest owing
to its well-known structural tunnel cavities in which WO6 octahedrons shared
their corners with each other thus forming hexagonal tunnel cavities along c-axis.
Among various crystal structures of WO3, hexagonal tungsten oxide (h-WO3) was
widely investigated, especially as an intercalation host to obtain hexagonal
tungsten bronzes MxWO3 (M= K+, Li+, etc.) and as a promising material as anode
material for lithium ion battery (Gu et al., 2007).
Figure 2.3 Arrangement of [W-O6] octahedral in the structure of hexagonal WO3(Gu et al., 2007)
WO3 has been examined as an anode material for lithium ion batteries due
to enhanced safety because of high melting temperature and mechanical stability,
low cost and large theoretical capacity (∼700 mAh g−1) (Yoon et al., 2011). More
importantly, a very high volumetric capacity can be expected considering its high
theoretical density of 7.61 g/cm3 (Yoon et al., 2011).
Like transition metal oxides (MnxOy, NiO, FexOy, CuO, MoO2, etc), the
anode charging–discharging mechanism of WO3 is based on conversion reaction,
which requires formation of a metal and lithium oxide (Poizot et al., 2000). When
WO3 was applied as an anode material for lithium ion battery, a d ischarge
10
capacity of 200–600 mAh/g was obtained according to the following conversion
reaction mechanism:
WO3 + 6Li+ + 6e- W + 3Li2O …… (2.1)
W + 3Li2O WO3 + 6Li+ + 6e- ……. (2.2)
Based on this reaction, the calculated theoretical capacity of WO3 is 693 mAh/g,
and a very high volumetric capacity can be expected considering its high
theoretical density of WO3(Gu et al., 2007). Furthermore, a WO3 anode material
is expected to be profitable in improving the safety of an LIB because of the
strong mechanical stability and its intrinsic high melting temperature (Lide, 2004).
Nevertheless, WO3 as an anode material has disadvantage, due to suffers
from large structural and volume variation during the charge/discharge processes,
and the induced structure change breaks the stability of electrode material, leading
to mechanical disintegration and the loss of electrical connection between the
active material and current collector. It can decrease the cycling ability and rate
capability of electrodes. Moreover, after only several tens of cycles even at low
current rates the capacities faded rapidly to lower than 75% of the initial values
(Yu et al., 2013). Therefore, it is desirable to find suitable WO3 properties which
could improve its performance as anode material for lithium ion battery.
Gu et al., 2007 have prepared single-crystal nanowires of hexagonal
tungsten trioxide in a large scale by a simple hydrothermal method without any
templates and catalysts. However the electrode only delivered a low discharge
capacity of 218 mAh/ with coulombic efficiency of 75.6% for the first cycle.
Meanwhile An ordered mesoporous WO3-x with high electrical conductivity (m-
WO3-x) was prepared and evaluated by Yoon et al., 2011 as an anode material for
lithium ion batteries (LIBs). It exhibited a reversible capacity of 748 mAh/g and
the coulombic efficiency of 53% at 1st cycle.
Yin et al., 2012 had synthesized γ-WO3 hierarchical nanostructures by using a
biomolecule-assisted hydrothermal approach between Na2WO4·2H2O and glycine
acid. This electrode has discharge capacity of 515.1 mAh/g and coulombic
efficiency of 62.4% for the first cycle.
Nanostructured WO3 thin film has been successfully fabricated by radio-
frequency magnetron sputtering method. The reversible discharge capacity of
11
WO3/Li cells cycled between 0.01 V and 4.0 V was found above 626 mAh/g
during the first 60 cycles at the current density 0.02 mA/cm2 (Li and Fu, 2010).
However, this electrode has a high cost of the deposition process and low active
material loading.
WO3 hollow nanosphere is reported by Sasidharan et al., 2012 using
polymeric micelle with core shell corona architecture. The nanostructured
electrode delivers high initial discharge capacity of 1054 mAh/g at a
charge/discharge 0.2 C. unfortunately, the capacity retention is only 28.4% after
50 cycles.
2.2 Graphene, Graphene Oxide and reduced Graphene Oxide
Graphene is a two dimensional of carbon, consisting of sp2 hybridized
carbon atoms arranged in a honeycomb crystal lattice which has a highly unique
electronic structure because of the charge carriers behaving like relativistic
particles(Novoselov et al., 2004). Graphene forms a basic structure of other
carbon materials like graphite, fullerenes and carbon nanotubes. The ballistic
charge transport at room temperature and at high charge carrier concentrations
make graphene interesting for applications such as energy strorage device where
electronic conductivity is of high importance(Geim and Novoselov, 2007).
Graphene can be prepared in various ways: reduction of graphene oxide
(GO) (Li et al., 2008), epitaxial growth (Berger et al., 2006), micromechanical
exfoliation of highly oriented pyrolytic graphite (Novoselov et al., 2004) and
chemical vapor deposition (CVD) (Wintterlin and Bocquet, 2009). From the
aforementioned methods, the reduction of GO is the most suitable for large-scale
graphene production. It must also be noted that the vast majority of graphene
composite lithium ion battery cathode materials use g raphene obtained by
reducing GO(Kucinskis et al., 2013).
Currently one of the most popular to produce graphite oxide is the method
first reported by Hummers and Offerman (Hummers and Offeman, 1958).
Oxidized graphite has been prepared by treating graphite with a mixture of three
oxidizing agents: sulfuric acid (H2SO4), sodium nitrate (NaNO3) and potassium
permanganate (KMnO4). It is then rinsed with water and hydrogen peroxide and
12
filtered afterward. After that resinous anion and cation exchangers are used to
remove the remaining impurities.
Although graphite oxide retains the stacked layer structure of graphite, it
incorporates oxygen and hydrogen containing groups. These groups increase the
interlayer distance and due to weakening of the platelete-platelete interactions
make the atom-thick graphite oxide layers hydrophilic (Pei and Cheng, 2012).
One or few monolayers of graphite oxide are called graphene oxide (GO).
Sonicating and/or stirring GO in water are the most common method to exfoliate
graphite oxide to graphene oxide (Dreyer et al., 2010).
D.C. Marcano et al. have been proposed improvement of the original
Hummers method (Marcano et al., 2010). They found that excluding NaNO3,
increasing the amount of KMnO4 and performing the reaction in a mixture of
H2SO4/H3PO4 (9:1) improves the efficiency of the graphite oxidation process.
Some less altered modifications of Hummers method have also been used; in most
of these the main difference lies in the graphene to oxidants mass ratio used or
oxidation times(Ding et al., 2010).
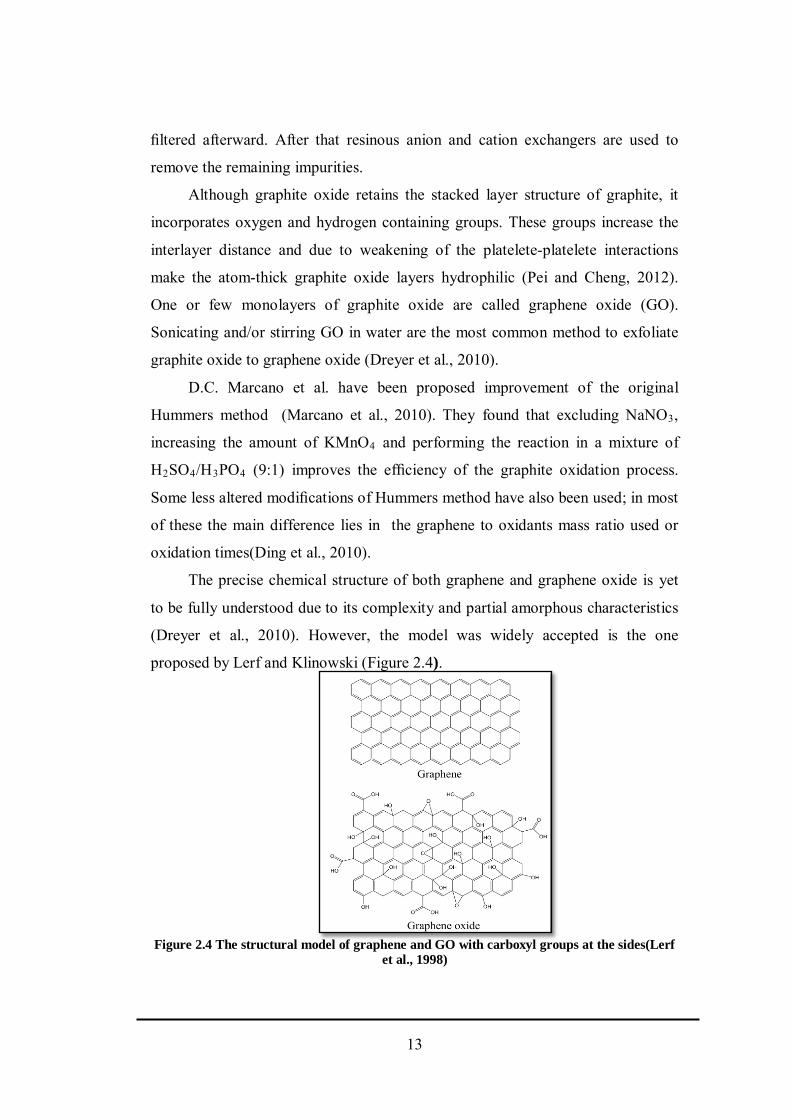
The precise chemical structure of both graphene and graphene oxide is yet
to be fully understood due to its complexity and partial amorphous characteristics
(Dreyer et al., 2010). However, the model was widely accepted is the one
proposed by Lerf and Klinowski (Figure 2.4).
Figure 2.4 The structural model of graphene and GO with carboxyl groups at the sides(Lerf et al., 1998)
13
Graphene has a high ionic and electronic conductivity. In other hand, both
graphite oxide and graphene oxide (GO) are electrically insulating materials due
to their disrupted sp2 bonding networks(Becerril et al., 2008). Functionalization
present in GO breaks the conjugated structure and localizes p-electrons, resulting
in a decrease of both carrier mobility and carrier concentration (Lerf et al., 1998).
Reduction of GO results in a partial restoration of the electrical conductivity by
restoring the p-network. The material obtained by reducing GO is generally
referred to as reduced graphene oxide (rGO) or simply graphene(Kucinskis et al.,
2013).
GO can be reduced chemically, thermally, electrochemically or by using
combinations of several aforementioned methods. The most common method is
chemically (Dreyer et al., 2010). In chemical reduction, the oxide functionality
from the surface is stripped by using reducing compounds such as hydrazine and
its derivatives (hydrazine monohydrate, dimethylhydrazine), NaBH4 (Shin et al.,
2009), ascorbic acid (Vitamin C) (Fernandez-Merino et al., 2010) hydroiodic acid
(Pei and Cheng, 2012) and oxalic acid(Song et al., 2012).
Thermal treatment has been used for graphite oxide exfoliation and GO
reduction and can be carried out in vacuum, inert or reducing atmospheres. When
graphite oxide is subjected to high temperature heating, the oxygen-containing
functional groups attached to the carbon plane are decomposed into gas phase
(mostly CO2) that create huge pressure between the stacked layers(Schniepp et
al., 2006).
The thermal treatment can not only exfoliate graphite oxide, but also strip
away some oxide functionalities from the surface of GO(McAllister et al., 2007),
efficiently meaning that graphene can be obtained directly by thermal exfoliation
of graphite oxide. Aside from the reduction of GO, thermal treatment is also found
to remove chemical contaminants that can adhere to the graphene during
processing and degrade its electronic properties(Schultz et al., 2011).
There are some research about graphene based anode material for lithium-
ion batteries. A facile hydrothermal method was employed to prepare
Fe2O3/graphene composites with different contents of graphene by Xiao et al.,
2013. After performed as anode for lithium ion battery, Fe2O3/graphene
14
composite with graphene mass content of 30% exhibits outstanding cyclability
with highly reversible charge capacity of 1069 mAh /g after 50 cycles, at current
density of 50 mA/g. And when the current density is increased to 1000 mA/g, it
could still retain charge capacity of 534 mAh/g.
Chen et al., 2012 used a facile ultrasonic method to synthesize
CoO/graphene nanohybrids by employing Co4(CO)12 as a cobalt precursor. The
CoO/graphene nanohybrids display high performance as an anode material for
lithium-ion battery, such as high reversible lithium storage capacity (650 mA·h/g
after 50 cycles, almost twice that of commercial graphite anode), high coulombic
efficiency (over 95%) and excellent cycling stability.
TiO2–graphene nanosheets (GNS) composites are prepared via an in situ
chemical synthesis method, which enables a homogenous dispersion of TiO2
nanoparticles on the graphene nanosheets. The TiO2–GNS composites can deliver
60 mAh/g at a current rate as high as 5000 mA/g and demonstrate negligible fade
even after 400 cycles. The superior electrochemical performances of the TiO2–
GNS composites can be attributed to their unique structures, which intimately
combine the conductive graphene nanosheets network with uniformly dispersed
TiO2 nanoparticles(Tao et al., 2012).
MoO2–graphene composite was synthesized via a t wo-step of
hydrothermal-calcination method. When used as anode material for lithium ion
batteries, the MoO2–graphene composite shows an enhanced cyclic performance
and lithium storage property. The first discharge capacity of the composite can
reach 674.4 mAh/g with a reversible capacity of 429.9 mAh/g. Significantly, the
composite can also deliver a reversible capacity of as high as 1009.9 mAh/g after
60 charge/discharge cycles(Yang et al., 2013b).
A new facile approach was proposed to synthesize nitrogen-doped
graphene sheets with the nitrogen doping level as high as 7.04 weight % by
thermal annealing pristine graphene sheets and low-cost industrial material
melamine. The high-level nitrogen-doped graphene sheets exhibit a superhigh
initial reversible capacity of 1123 mAh/g at a current density of 50 mA/g. More
significantly, even at an extremely high current density of 20000 mA/g, highly
stable capacity of about 241 mAh/g could still be obtained (Cai et al., 2013).
15
Three types of graphene papers, with thickness of 1.5, 3 a nd 10µm,
respectively, were fabricated by vacuum-assisted filtration of reduced graphene
nanosheets suspended in water. These papers deliver evidently different lithium
storage capacities, with thinner papers always outperform thicker ones. The
1.5µm paper gives rise to initial reversible specific capacities (the first 10 cycles)
of 200 mAh/g at a cu rrent density of ~100 mA/g, while the 10µm paper only
presents ~80 mAh/g at a current density of 50 mA/g. After 100 cycles, a specific
capacity of ~180 mAh/g is retained for the 1.5µm paper; in contrast, only ~65
mAh/g remains for the 10µm paper(Hu et al., 2013).
A simple urea-assisted, auto-combustion synthesis was used to fabricate
pure Co3O4 nanoparticles and their nanocomposite with 10 w t% reduced
graphene nanosheets. Using the Co3O4/CoO/graphene nanocomposite as an anode
in lithium ion battery led to a higher lithium storage capacity than using pure
Co3O4 nanoparticles electrode. The Co3O4/CoO/graphene nanocomposite
electrode delivers an initial charge capacity of 890.44 mAh g−1 and exhibits 90%
of good capacity retention (801.31 mAh.g−1) after 30 cycles. While pure Co3O4
nanoparticles electrode (877.98 mAh g−1) fades quickly, retains only 60% (523.94
mAh g−1) after 30 cycles (Rai et al., 2013a).
A ternary nanocomposite based on tin indium oxide (SnO2–In2O3) and
graphene nanosheet (GNS) was synthesized via a facile solvothermal method as
an anode for lithium ion batteries. The SnO2–In2O3/GNS nanocomposite exhibits
a remarkably improved electrochemical performance in terms of lithium storage
capacity (962 mAh/g at 60 mA/g rate), initial coulombic efficiency (57.2%),
cycling stability (60.8% capacity retention after 50 cycles), and rate capability
(393.25 mAh/g at 600 mA/g rate after 25 cycles) compared to SnO2/GNS and
pure SnO2–In2O3 electrode(Yang et al., 2013a).
16
2.3 Hydrothermal Method
The controllable synthesis of highly ordered nanostructure has been widely
studied by using kinds of methods, such as low temperature solution based
chemical strategies including electrochemical synthesis method, hydrothermal
method and the sol gel method (Liu et al., 2009); and high-temperature vapor-
phase approaches including chemical vapor deposition and physical vapor
deposition(Saron and Hashim, 2013). Among them, hydrothermal synthetic
strategies on a water system are considered as simple and powerful routes and
become more popular in fabricating ordered nanoarray structures(Yang et al.,
2013b).
The main advantages that hydothermal method offers are: (1) simple and
economical, (2) limited equipment corrosion problems, (3) operation the process
does not require the addition and recovery of chemicals different from water and
(4) the processing can be considered an environmentally friendly fractionation
process(Romaní et al., 2010).
Hydrothermal technologies are broadly defined as chemical and physical
transformations in high-temperature, high-pressure liquid or supercritical water
(SCW) (Peterson et al., 2008). Hydrothermal degradation is an effective
technology to decompose polymer derived from plants (Bobleter, 1994) and it is
environment-friendly technologies that can be conceived as a first step for the
chemical utilization of lignocellulose (Garrote et al., 1999).
As a low temperature technology, hydrothermal synthesis is
environmentally friendly in that the reaction takes place in aqueous solutions
within a closed system and using water as the reaction medium (Sayılkan et al.,
2006). This technique is usually carried out in an autoclave (a steel pressure
vessel) under controlled temperature and/or pressure. The operating temperature is
held above the water boiling point to self-generate saturated vapor pressure (Chen
and Mao, 2007). The internal pressure generated in the autoclave is governed by
the operating temperature and the presence of aqueous solutions in the autoclave.
The hydrothermal method is widely applied in metal oxide production
because of its many advantages, such as low energy requirement, simple control
of the aqueous solution, high reactivity and relatively non-polluting set-up (Lee et
17
al., 2007). The reaction pathway is very sensitive to the experimental conditions,
such as pH, temperature and hydrothermal treatment time.
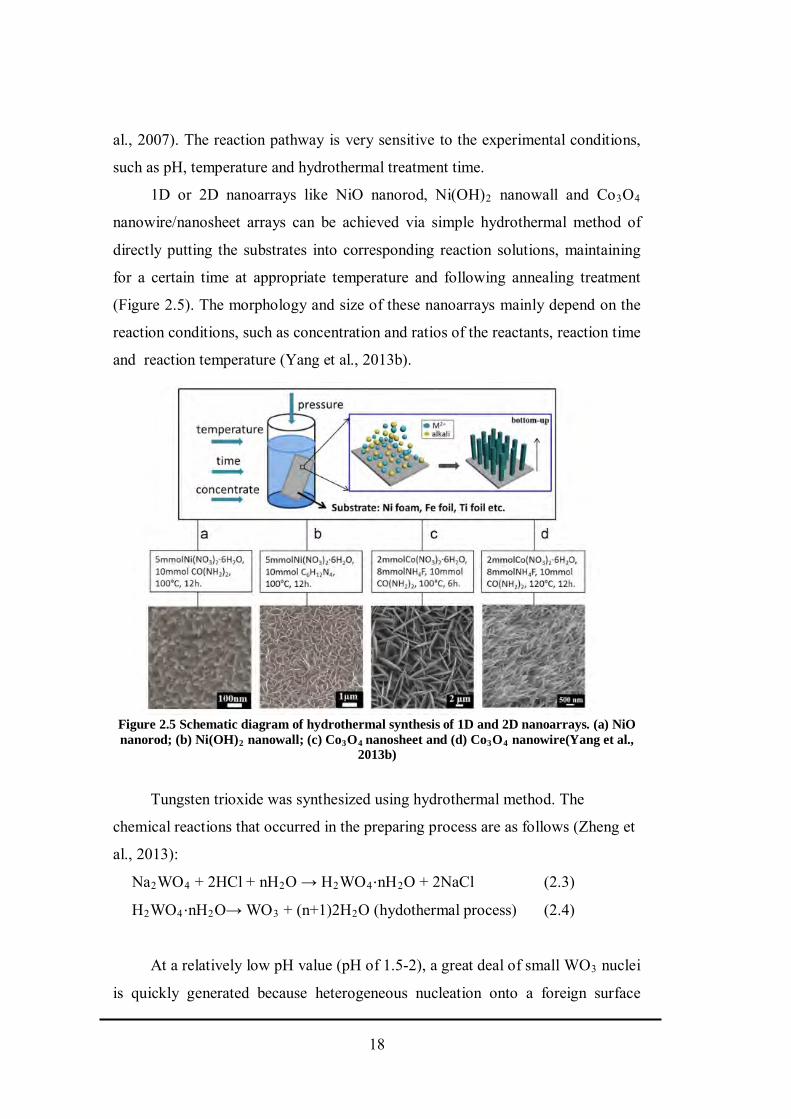
1D or 2D nanoarrays like NiO nanorod, Ni(OH)2 nanowall and Co3O4
nanowire/nanosheet arrays can be achieved via simple hydrothermal method of
directly putting the substrates into corresponding reaction solutions, maintaining
for a certain time at appropriate temperature and following annealing treatment
(Figure 2.5). The morphology and size of these nanoarrays mainly depend on the
reaction conditions, such as concentration and ratios of the reactants, reaction time
and reaction temperature (Yang et al., 2013b).
Figure 2.5 Schematic diagram of hydrothermal synthesis of 1D and 2D nanoarrays. (a) NiO nanorod; (b) Ni(OH)2 nanowall; (c) Co3O4 nanosheet and (d) Co3O4 nanowire(Yang et al.,
2013b)
Tungsten trioxide was synthesized using hydrothermal method. The
chemical reactions that occurred in the preparing process are as follows (Zheng et
al., 2013):
Na2WO4 + 2HCl + nH2O → H2WO4⋅nH2O + 2NaCl (2.3)
H2WO4⋅nH2O→ WO3 + (n+1)2H2O (hydothermal process) (2.4)
At a relatively low pH value (pH of 1.5-2), a great deal of small WO3 nuclei
is quickly generated because heterogeneous nucleation onto a foreign surface
18
occurs readily compared to homogeneous nucleation in solution. The nuclei
randomly distribute and scatter in all directions. Small WO3 nuclei spontaneously
aggregate into large spheres owing to the high concentration of H+. The numbers
of nuclei which make up large particles are different. And for each particles, the
sizes of nuclei vary on a large scale. The nucleus begins to grow only when its
size is larger than the critical size. When a large number of nuclei are generated,
the supersaturation of H2WO4 reaches a low level, which creates the conditions
for WO3 growth(Zheng et al., 2013).
2.3.1 NaCl assisted Hydrothermal Sodium chloride is an ionic compound with the formula NaCl,
representing equal proportions of sodium and chlorine. Large quantities of sodium
chloride are used in many industrial processes, and it is a major source of sodium
and chlorine compounds used as feedstocks for further chemical
synthesis(Kostick, 2014).
In solid sodium chloride, each ion is surrounded by six ions of the opposite
charge as expected on electrostatic grounds. The surrounding ions are located at
the vertices of a regular octahedron. In the language of close-packing, the larger
chloride ions are arranged in a cubic array whereas the smaller sodium ions fill all
the cubic gaps between them. This same basic structure is found in many
other compounds and is commonly known as the halite or rock-salt crystal
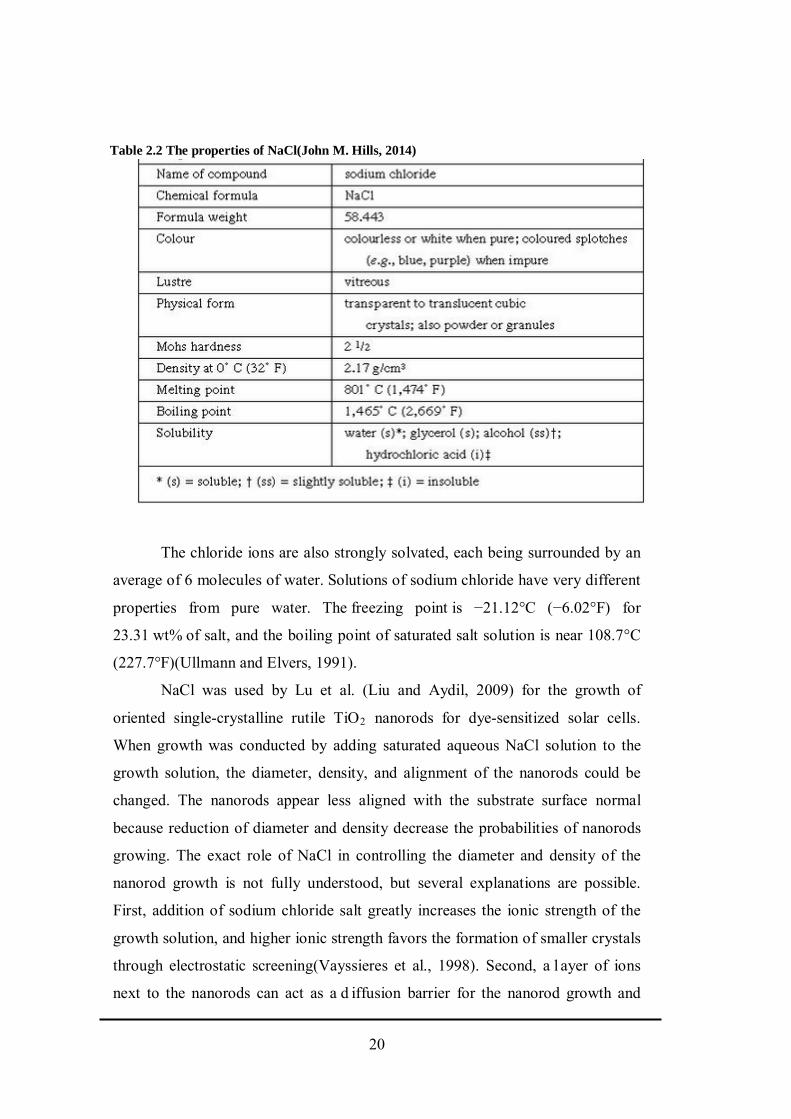
structure(Kostick, 2014). The properties of common NaCl are shown in the Table
2.2(John M. Hills, 2014):
Sodium chloride is readily soluble in water and insoluble or only slightly
soluble in most other liquids. It forms small, transparent, colorless to white cubic
crystals. Sodium chloride is odorless but has a characteristic taste. It is an ionic
compound, being made up of equal numbers of positively charged sodium and
negatively charged chloride ions. When it is melted or dissolved in water the ions
can move about freely, so that dissolved or molten sodium chloride is a conductor
of electricity; it can be decomposed into sodium and chlorine by passing an
electrical current through it(Infoplease, 2014).
19
The chloride ions are also strongly solvated, each being surrounded by an
average of 6 molecules of water. Solutions of sodium chloride have very different
properties from pure water. The freezing point is −21.12°C (−6.02°F) for
23.31 wt% of salt, and the boiling point of saturated salt solution is near 108.7°C
(227.7°F)(Ullmann and Elvers, 1991).
NaCl was used by Lu et al. (Liu and Aydil, 2009) for the growth of
oriented single-crystalline rutile TiO2 nanorods for dye-sensitized solar cells.
When growth was conducted by adding saturated aqueous NaCl solution to the
growth solution, the diameter, density, and alignment of the nanorods could be
changed. The nanorods appear less aligned with the substrate surface normal
because reduction of diameter and density decrease the probabilities of nanorods
growing. The exact role of NaCl in controlling the diameter and density of the
nanorod growth is not fully understood, but several explanations are possible.
First, addition of sodium chloride salt greatly increases the ionic strength of the
growth solution, and higher ionic strength favors the formation of smaller crystals
through electrostatic screening(Vayssieres et al., 1998). Second, a l ayer of ions
next to the nanorods can act as a d iffusion barrier for the nanorod growth and
Table 2.2 The properties of NaCl(John M. Hills, 2014)
20
retard the precursors from diffusing to the surface(Xu and Zeng, 2003). Finally,
Cl- could preferentially adsorb and retard the growth rate of (110) surfaces.
The ability to retard the diameter growth rate through NaCl addition helps
grow longer TiO2 nanorods while avoiding the side surfaces from coalescing to
form a continuous film. In control experiments, when no NaCl is added to the
solution in the second step of the growth, the nanorods grow taller and wider,
ultimately touching each other to form a continuous film with large grains at the
bottom(Liu and Aydil, 2009).
Mesoporous Zr-incorporated MCM-41 can be synthesized in the acid
conditions self-generated by the hydrolysis of ZrOCl2 with the addition of NaCl.
In this method, both NaCl and ZrOCl2 are necessary for the self-assembly of
surfactant micelle and inorganic species to ordered mesoporous materials(Yang et
al., 2010). The ordering of Zr-MCM-41 could be greatly improved by the addition
of NaCl in the synthesis gel. The optimal molar ratio of NaCl/Si was 1.0. The
ordering decreased when the ratio was greater or smaller than this value. It
revealed that NaCl played an important role in the self-assembly process of
surfactant micelle and inorganic species. With the addition of NaCl, the large
amount of Cl- strengthened the electrostatic interaction between the surfactant
micelle and inorganic species, and thus facilitated the formation of ordered
mesostructure. However, too much NaCl seemed to hinder the self-assembly of
the micelle and the inorganic precursors(Yang et al., 2010).
NaCl was also used for synthesis of radially aligned single-walled carbon
nanotubes on a SiO2/Si substrate(Rao et al., 2009). They showed that by using
ferritin in NaCl solution as catalyst precursor, cristobalite could be identified on
the SiO2/Si substrate after the growth of SWCNTs. The addition of NaCl
concentration in the solution could increases the signal intensity of cristobalite.
The cristobalite peak is not observed if only a ferritin aqueous solution was used.
Cristobalite is believed to be formed from the crystallization of amorphous SiO2.
Lee et al. (Lee et al., 2009) had synthesized gold icosahedra and
nanoplates using Pluronic P123 block copolymer and NaCl. They observed that
the shape of the gold crystals could be changed from icosahedra to plates by
introducing NaCl. NaCl promoted the growth perpendicular to the [111] direction
21
required for producing gold nanoplates. The concentration of NaCl could control
the ratio of gold icosahedra to nanoplates. As the molar ratio of NaCl to the gold
salt increases from 0 to 10, the size and shape of the gold icosahedra become
smaller and more irregular, respectively, and their content in the product
decreases, while that of the gold nanoplates increases(Lee et al., 2009).
2.3.2 Na-EDTA assisted Hydrothermal
Ethylenediamine tetraacetic acid (EDTA) and its salts are substituted
diamines. These ingredients function as chelating agents by combining with
polyvalent metal cations in solution to form soluble ring structures. EDTA and its
salts have uses in pharmaceutical products, foods, and manufacturing and treat
heavy metal poisoning(Lanigan et al., 2002).
EDTA is a white, odorless, nonhygroscopic crystalline powder. It
decomposes over a melting range of 234 to 250oC. The molecular weight of this
compound is 292.24 gr/mol. EDTA is slightly soluble in water and solutions of
alkali hydroxides, but it is insoluble in common organic solvents (Longer et al.,
1990).
EDTA and its salts are chelating agents. They are neutralized by alkali-
metal hydroxides to form water-soluble salts, or chelates, that contain metal
cations(Budavari et al., 1989). Chelating agents such as EDTA are anionic. EDTA
forms a t etranegative anion, and is strongly attracted to alkaline earth and
transition metal ions. The metal ion is converted to an anionic form as part of a
metal-EDTA complex during a reaction with EDTA; thus, the oxidation-reduction
potential of the metal ion is altered and the partitioning of the metal to the aqueous
phase is enhanced. The chelating action of EDTA occurs at alkaline pH as long as
metallic ions are available, until all the EDTA molecules are utilized. One mole of
EDTA chelates one mole of metallic ions(Saquy et al., 1994).
Generally, EDTA is stable as a solid and in aqueous solution. Only strong
oxidizing agents can attack it chemically. The stability of EDTA-metal chelates
increases according to the order(Heindorff et al., 1983) :
22
Disodium EDTA is a w ater-soluble, almost odorless, white crystal or
crystalline powder with a molecular weight of 336.21 to 372.24 gr/mol. Disodium
EDTA decomposes at 252oC. The melting point of disodium EDTA is 240oC, the
ash point is >100oC, and it is soluble in water (~100 g/l) at 20oC (Longer et al.,
1990).
Disodium EDTA has some characteristics of weak acids; it displaces carbon
dioxide from carbonates and reacts with metals to form hydrogen(Budavari et al.,
1989). Disodium EDTA was prepared by dissolving EDTA into a hot solution that
contained two equivalents of sodium hydroxide. The solution then was allowed to
crystallize(Longer et al., 1990).
EDTA and its salts have been effectively employed in the hydrothermal
process as a structure-directing agent and chelating ligand to produce nano
crystals with different morphologies (Ha et al., 2009). Among the complexing
agents, EDTA and Na2-EDTA are known to be particularly efficient due to the
presence of amine groups in these molecules. Such molecules can effectively
complex metal ions of different sizes, and help in achieving chemical
homogeneity in the end products. However the high chelating abilities of EDTA
and Na2-EDTA has not been widely used as a fuel in solution combustion
reactions(Hari Krishna et al., 2014).
Krishna et al. (Hari Krishna et al., 2014) used EDTA and Na2EDTA for
synthesis of Y2O3 as photo- and thermo-luminescent applications. They show that
lowest crystallite size is observed for sample prepared using EDTA fuel due to
amorphous nature of the product. Whereas, crystallinity and crystallite size
increases for sample prepared using Na2EDTA.
Wang et al. (Wang et al., 2009) used Na2EDTA mediated hydrothermal to
synthesis of YVO4:Eu3+. They show that the addition of additive agents can affect
the nucleation and growth of particles, which consequently can modify particle
morphology and size. The different pH value can induce different modality of
Na2EDTA. When the pH value of synthesis solution ranged from 1 to 4, the
EDTA2− ions are few, the process of formation YVO4:Eu3+ structures are mainly
the homogeneous precipitation process. When the pH value was increased to 7
and 14, the Na2EDTA leads to the anisotropic growth of nano-particles. Because
23
it is clear that a strong ligand (Na2EDTA) is not only needed to form a stable
complex with Y3+, but also the ligand binds to the surface of the crystal, which
directly affects the growth direction and crystal structure of the nano-
crystals(Wang et al., 2009).
LaPO4 had been synthesized by Dong et al. (Dong et al., 2010) using
EDTA assisted hydrothermal method. They show that the as-prepared sample
prepared with 1 mmol EDTA consist of rod-like particles with the size range of
500-1000 nm in width and about 1 mm in length. Moreover, the aspect ratio of the
phosphors increases with the increase of EDTA concentration. Finally, the rod-
like shape of the sample is changed to the wirelike morphology when the EDTA
amount was increased from 1 mmol to 3 mmol(Dong et al., 2010).
Hariharan et al. (Hariharan et al., 2011) reported that the use of EDTA
during the microwave hydrothermal synthesis of W18O49 nanoplate resulted
oxygen vacancy. This is due to the fact that Na+ ion of disodium salt of EDTA has
a strong tendency to react with oxygen and forms intermediate Na2O during the
anneling process. This phenomenon decreases the concentration of oxygen in the
WO3 lattice and creates oxygen vacancy (Adhikari et al., 2014).
WO3 hierarchical structure was synthesiszed by Rajesh et al. (Adhikari et
al., 2014) using EDTA mediated microwave hydrothermal. The result revealed
that the addition of EDTA leads to the controlled aggregation of WO3
nanoparticles having high crystallinity with monoclinic structure and creates
oxygen vacancy in the WO3 lattice. Moreover, at high concentration of EDTA,
cauliflower like hierarchical structure was formed when the optimum
concentration of EDTA reaches to 0.5 mol (Adhikari et al., 2014).
EDTA has a significant effect on the size, morphology and aggregation of
the product. EDTA also play an important to control the degree of crystalinnity
(Ha et al., 2009). As the concentration of EDTA increases, the effect of chelation
increases that controls the aggregation of WO3 nanoparticles and forms the
hierarchical structure(Adhikari et al., 2014). Furthermore, the surface area of
WO3 prepared in presence of EDTA is lesser than that of WO3 preapared in
absence of EDTA which is attributed to the formation of hieracrchical
24
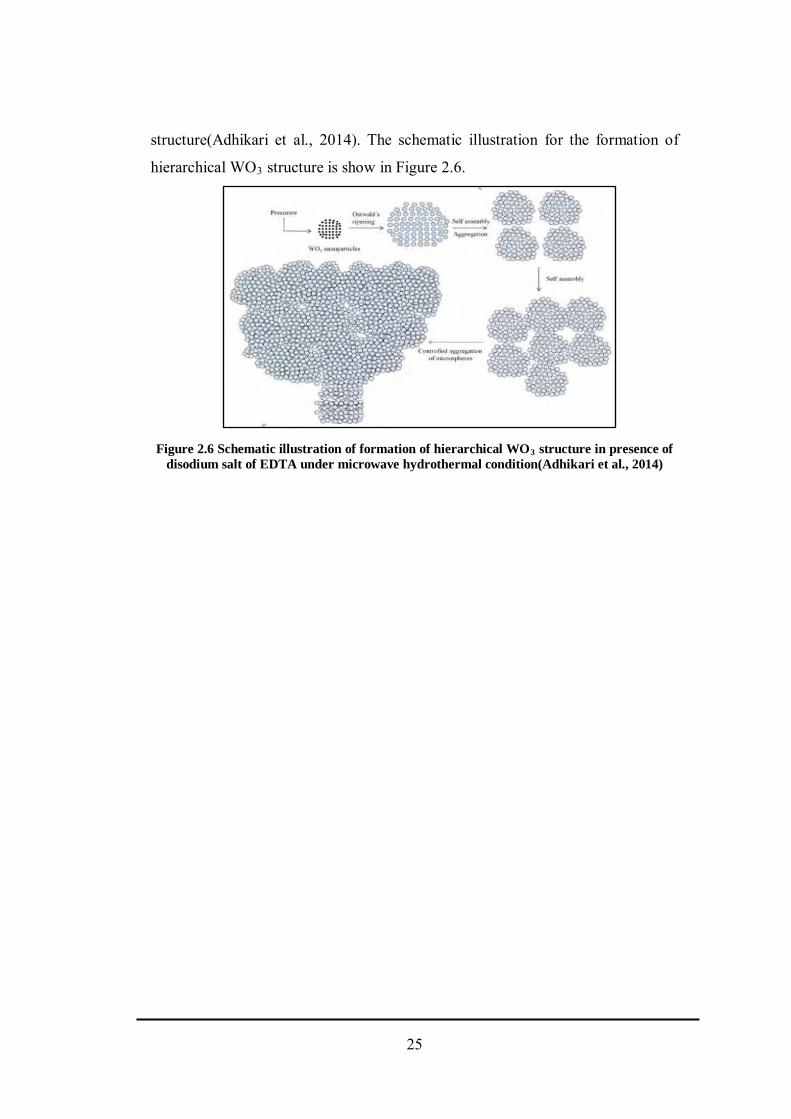
structure(Adhikari et al., 2014). The schematic illustration for the formation of
hierarchical WO3 structure is show in Figure 2.6.
Figure 2.6 Schematic illustration of formation of hierarchical WO3 structure in presence of disodium salt of EDTA under microwave hydrothermal condition(Adhikari et al., 2014)
25

(This page is empty deliberately)
26
3. CHAPTER 3
EXPERIMENTAL
3.1 Materials
Materials which be used in this work are:
a. Na2WO4.2H2O
b. NaCl
c. Na EDTA
d. HCl
e. Distilled water
f. Graphite powder KS-4 (Timcal)
g. H3PO4 (>95%)
h. H2SO4 85%
i. KMnO4
j. H2O2
k. PVDF
l. NMP
m. Carbon black (Super P)
n. Cu foil
o. Coin cell part
3.2 Instruments
Instrument which be used in this work are :
a. Analitic balance
b. Beaker Glass
c. Measuring tube
d. Dropper
e. spatula
f. stirrer
g. two neck bottle
h. ultrasonicator
i. Centrifuge machine and centrifuge tube
27
j. Autoclave
k. Oven
l. Glove box
m. Material characterization and electrochemical measurement:
a) X-Ray Difraction (XRD) : Bruker D2 phaser
b) Scanning Electron Microscope (SEM) : JEOL JSM 5800
c) Thermal gravimetric Analysis : TA Instruments Q500 TGA
d) Raman Measurement : Protrustech ProMaker Raman
e) Cyclic Voltammetry (CV) : EC Lab V10.34
f) Charge discharge : Acutech system Bat-750B (Ubiq machine)
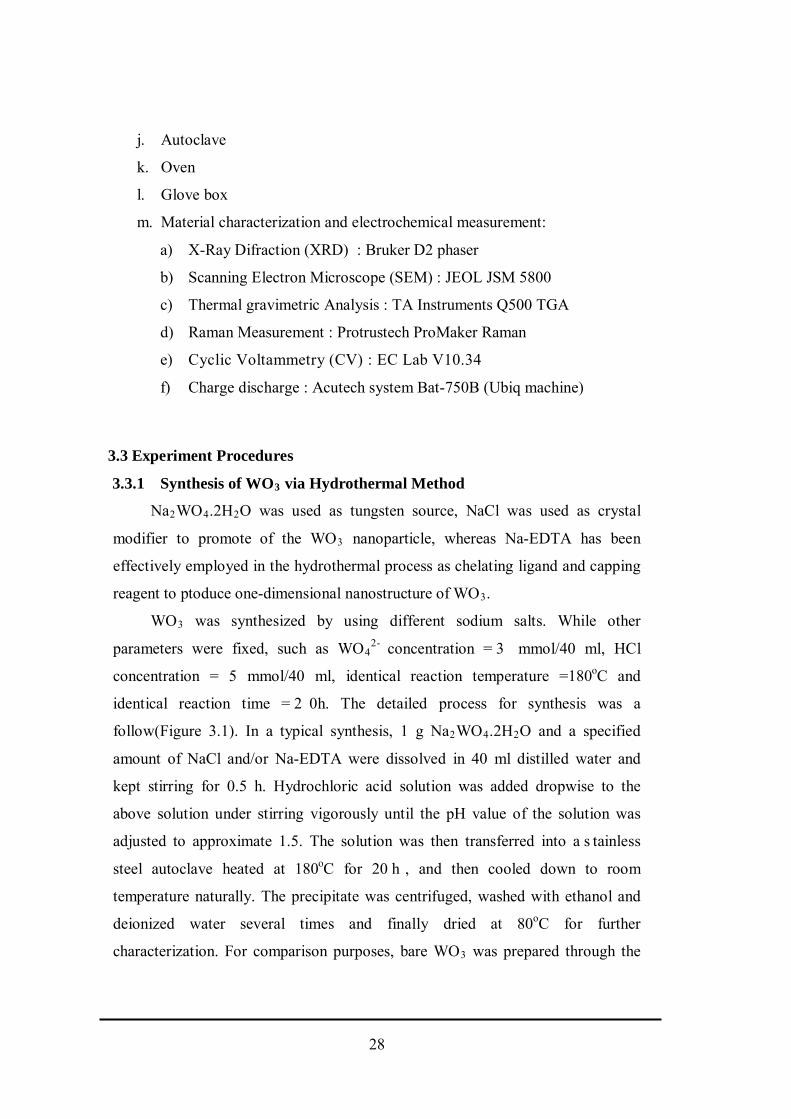
3.3 Experiment Procedures
3.3.1 Synthesis of WO3 via Hydrothermal Method
Na2WO4.2H2O was used as tungsten source, NaCl was used as crystal
modifier to promote of the WO3 nanoparticle, whereas Na-EDTA has been
effectively employed in the hydrothermal process as chelating ligand and capping
reagent to ptoduce one-dimensional nanostructure of WO3.
WO3 was synthesized by using different sodium salts. While other
parameters were fixed, such as WO42- concentration = 3 mmol/40 ml, HCl
concentration = 5 mmol/40 ml, identical reaction temperature =180oC and
identical reaction time = 2 0h. The detailed process for synthesis was a
follow(Figure 3.1). In a typical synthesis, 1 g Na2WO4.2H2O and a specified
amount of NaCl and/or Na-EDTA were dissolved in 40 ml distilled water and
kept stirring for 0.5 h. Hydrochloric acid solution was added dropwise to the
above solution under stirring vigorously until the pH value of the solution was
adjusted to approximate 1.5. The solution was then transferred into a s tainless
steel autoclave heated at 180oC for 20 h , and then cooled down to room
temperature naturally. The precipitate was centrifuged, washed with ethanol and
deionized water several times and finally dried at 80oC for further
characterization. For comparison purposes, bare WO3 was prepared through the
28
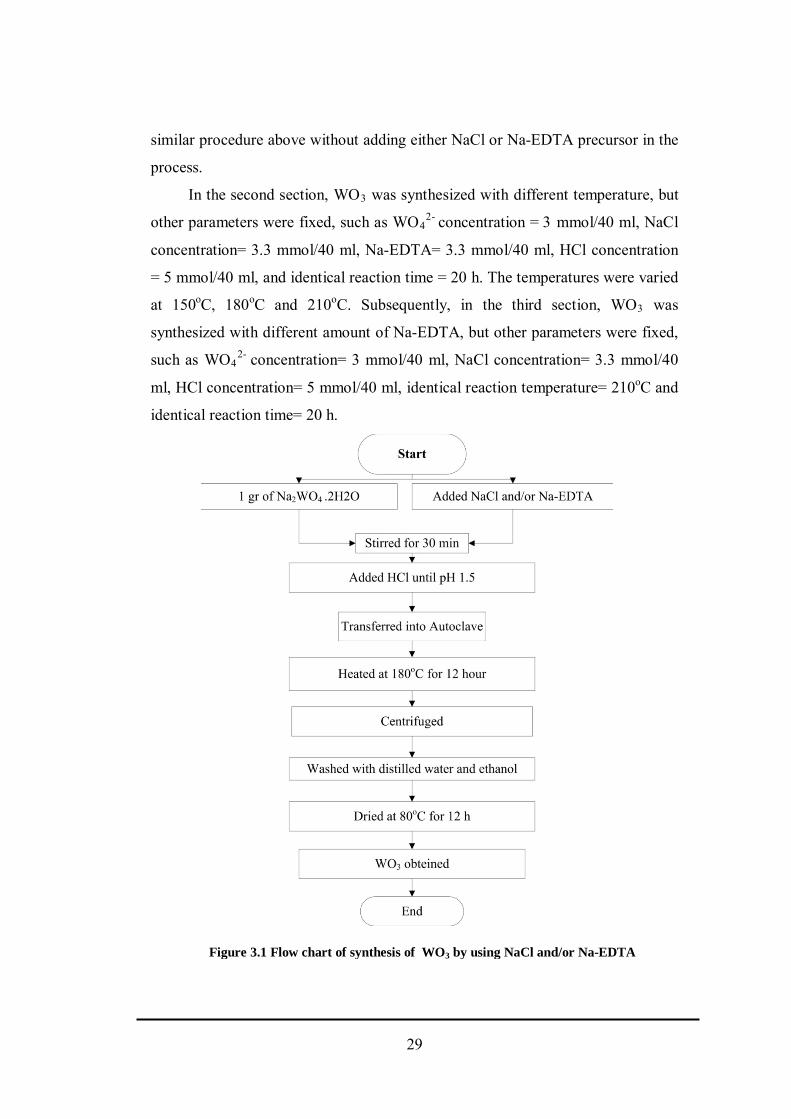
similar procedure above without adding either NaCl or Na-EDTA precursor in the
process.
In the second section, WO3 was synthesized with different temperature, but
other parameters were fixed, such as WO42- concentration = 3 mmol/40 ml, NaCl
concentration= 3.3 mmol/40 ml, Na-EDTA= 3.3 mmol/40 ml, HCl concentration
= 5 mmol/40 ml, and identical reaction time = 20 h. The temperatures were varied
at 150oC, 180oC and 210oC. Subsequently, in the third section, WO3 was
synthesized with different amount of Na-EDTA, but other parameters were fixed,
such as WO42- concentration= 3 mmol/40 ml, NaCl concentration= 3.3 mmol/40
ml, HCl concentration= 5 mmol/40 ml, identical reaction temperature= 210oC and
identical reaction time= 20 h.
Figure 3.1 Flow chart of synthesis of WO3 by using NaCl and/or Na-EDTA
29
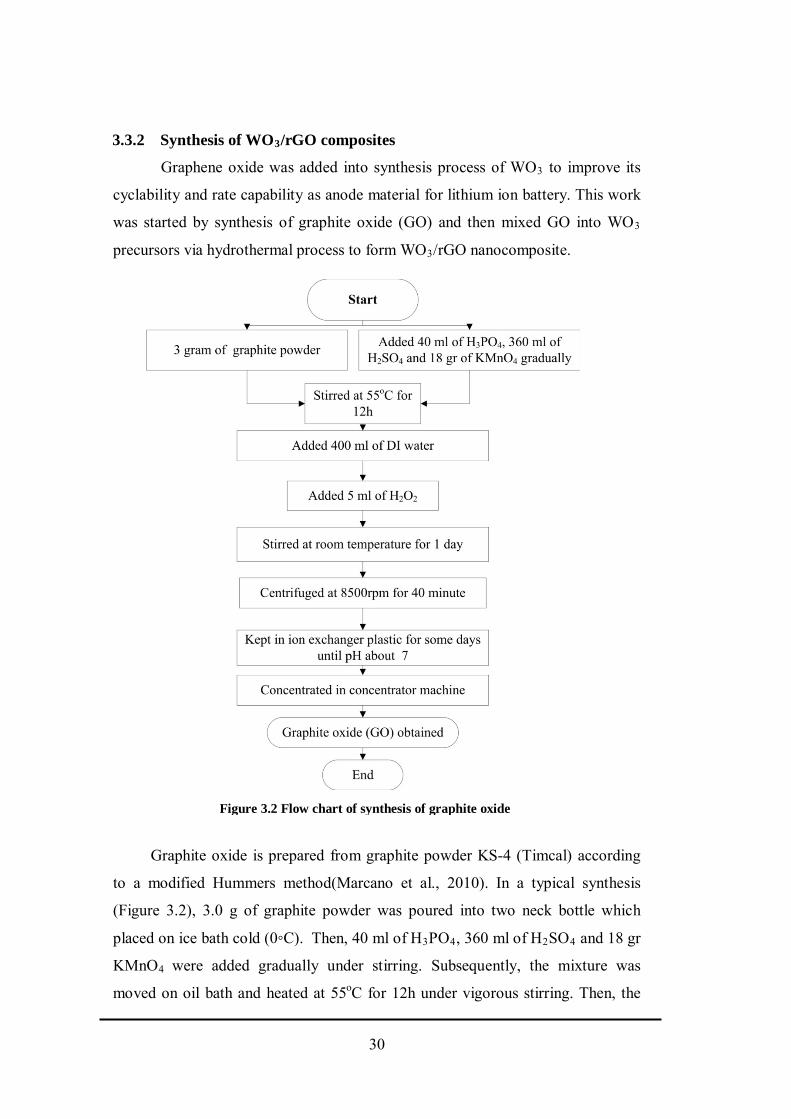
3.3.2 Synthesis of WO3/rGO composites
Graphene oxide was added into synthesis process of WO3 to improve its
cyclability and rate capability as anode material for lithium ion battery. This work
was started by synthesis of graphite oxide (GO) and then mixed GO into WO3
precursors via hydrothermal process to form WO3/rGO nanocomposite.
Graphite oxide is prepared from graphite powder KS-4 (Timcal) according
to a modified Hummers method(Marcano et al., 2010). In a typical synthesis
(Figure 3.2), 3.0 g of graphite powder was poured into two neck bottle which
placed on ice bath cold (0◦C). Then, 40 ml of H3PO4, 360 ml of H2SO4 and 18 gr
KMnO4 were added gradually under stirring. Subsequently, the mixture was
moved on oil bath and heated at 55oC for 12h under vigorous stirring. Then, the
Figure 3.2 Flow chart of synthesis of graphite oxide
30
mixture was diluted with 400 mL of deionized water. Because of the addition of
water in concentrated sulfuric acid medium released a large amount of heat, the
addition of water was performed in an ice bath to keep the temperature below
100oC. The reaction was terminated by adding 5 mL of H2O2 solution and stirred
for 1 day. The solid product was separated by centrifugation at 8500 rpm for 40
minute. For further purification, the resulting solid was kept in ion exchanger
plastic which submerged in DI water until pH about 7. The suspension was
concentrated by using concentrator machine to get x weight% graphite oxide
(GO). Finally, GO suspension was dispersed in deionized water to create a
homogeneous dispersion through ultrasonication for half an hour.
WO3/rGO nanocomposite was synthesized through an in situ
hydrothermal process. In a t ypical process (Figure 3.3), 1 g N a2WO4.2H2O and
0.2 g N aCl were dissolved in 40 ml GO solution and kept stirring for 0.5 h.
Hydrochloric acid solution was added dropwise to the above solution under
stirring vigorously until the pH value of the solution was adjusted to approximate
1.5. The solution was then transferred into a s tainless steel autoclave heated at
180oC for 20 h, and then cooled down to room temperature naturally. The
precipitate was centrifuged, washed with ethanol and deionized water several
times and finally dried at 80oC for further characterization.
31
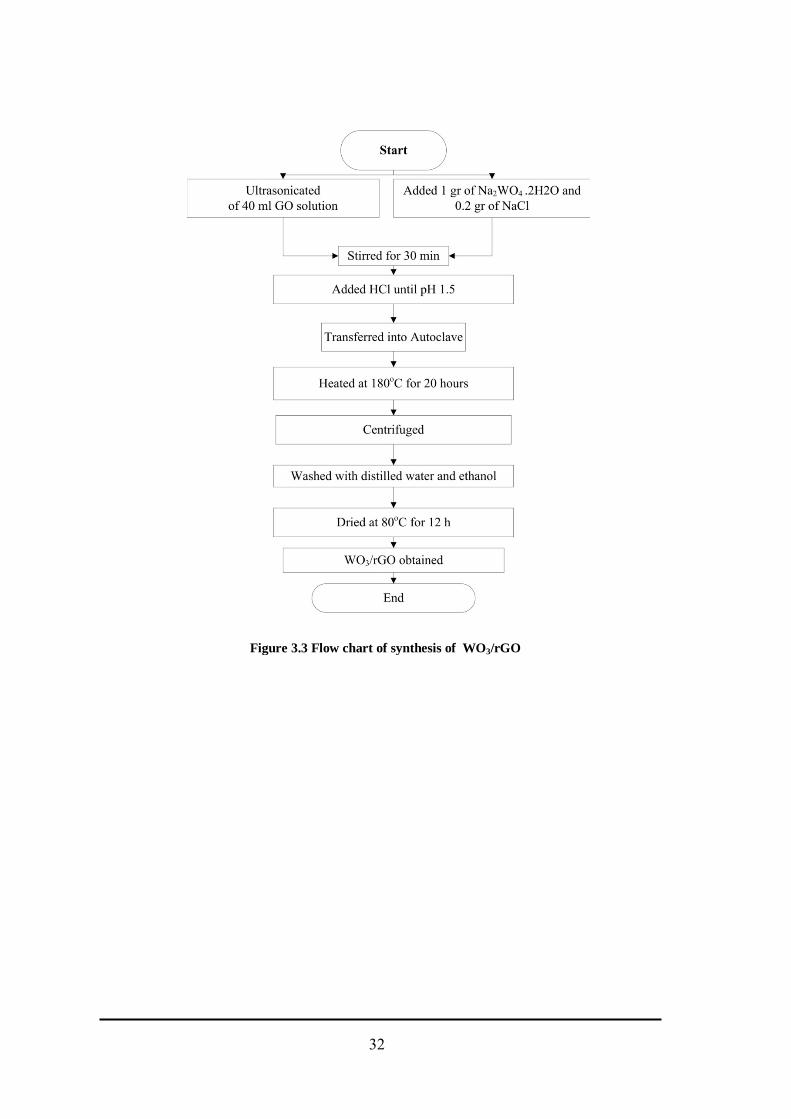
Figure 3.3 Flow chart of synthesis of WO3/rGO
32
3.4 Material Characterization
Material characterizations of WO3 were investigated using several common
techniques such as X-Ray Diffraction (XRD), Field Emission Scanning electron
Microscopy (FE-SEM), Thermal Gravimetric Analysis (TGA) and Raman
spectroscopy.
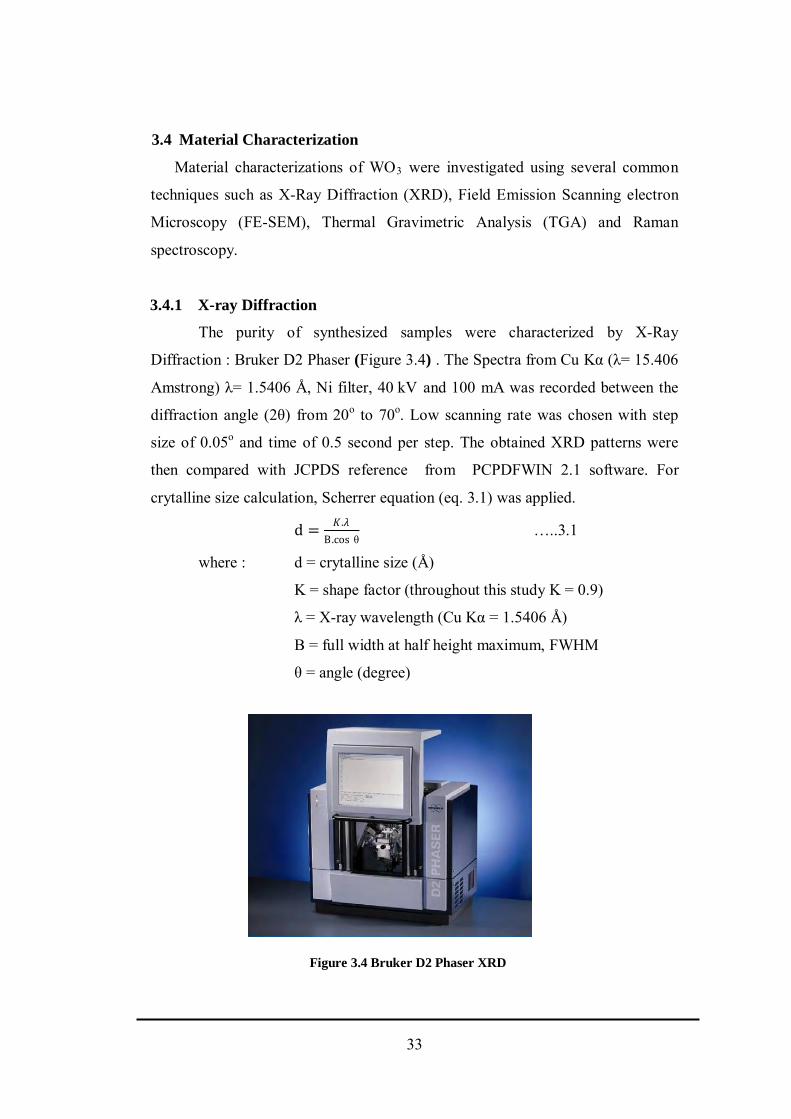
3.4.1 X-ray Diffraction
The purity of synthesized samples were characterized by X-Ray
Diffraction : Bruker D2 Phaser (Figure 3.4) . The Spectra from Cu Kα (λ= 15.406
Amstrong) λ= 1.5406 Å, Ni filter, 40 kV and 100 mA was recorded between the
diffraction angle (2θ) from 20o to 70o. Low scanning rate was chosen with step
size of 0.05o and time of 0.5 second per step. The obtained XRD patterns were
then compared with JCPDS reference from PCPDFWIN 2.1 software. For
crytalline size calculation, Scherrer equation (eq. 3.1) was applied.
d = 𝐾𝐾.𝜆𝜆B.cos θ
…..3.1
where : d = crytalline size (Å)
K = shape factor (throughout this study K = 0.9)
λ = X-ray wavelength (Cu Kα = 1.5406 Å)
B = full width at half height maximum, FWHM
θ = angle (degree)
Figure 3.4 Bruker D2 Phaser XRD
33
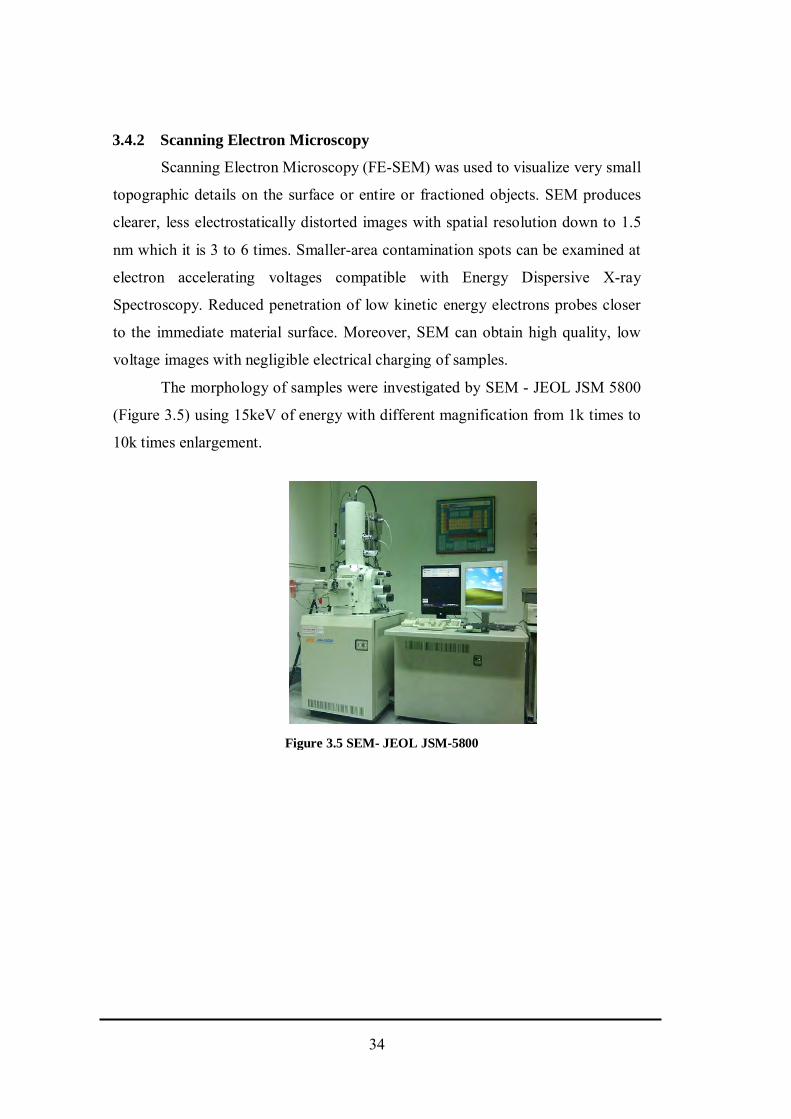
3.4.2 Scanning Electron Microscopy
Scanning Electron Microscopy (FE-SEM) was used to visualize very small
topographic details on the surface or entire or fractioned objects. SEM produces
clearer, less electrostatically distorted images with spatial resolution down to 1.5
nm which it is 3 to 6 times. Smaller-area contamination spots can be examined at
electron accelerating voltages compatible with Energy Dispersive X-ray
Spectroscopy. Reduced penetration of low kinetic energy electrons probes closer
to the immediate material surface. Moreover, SEM can obtain high quality, low
voltage images with negligible electrical charging of samples.
The morphology of samples were investigated by SEM - JEOL JSM 5800
(Figure 3.5) using 15keV of energy with different magnification from 1k times to
10k times enlargement.
Figure 3.5 SEM- JEOL JSM-5800
34
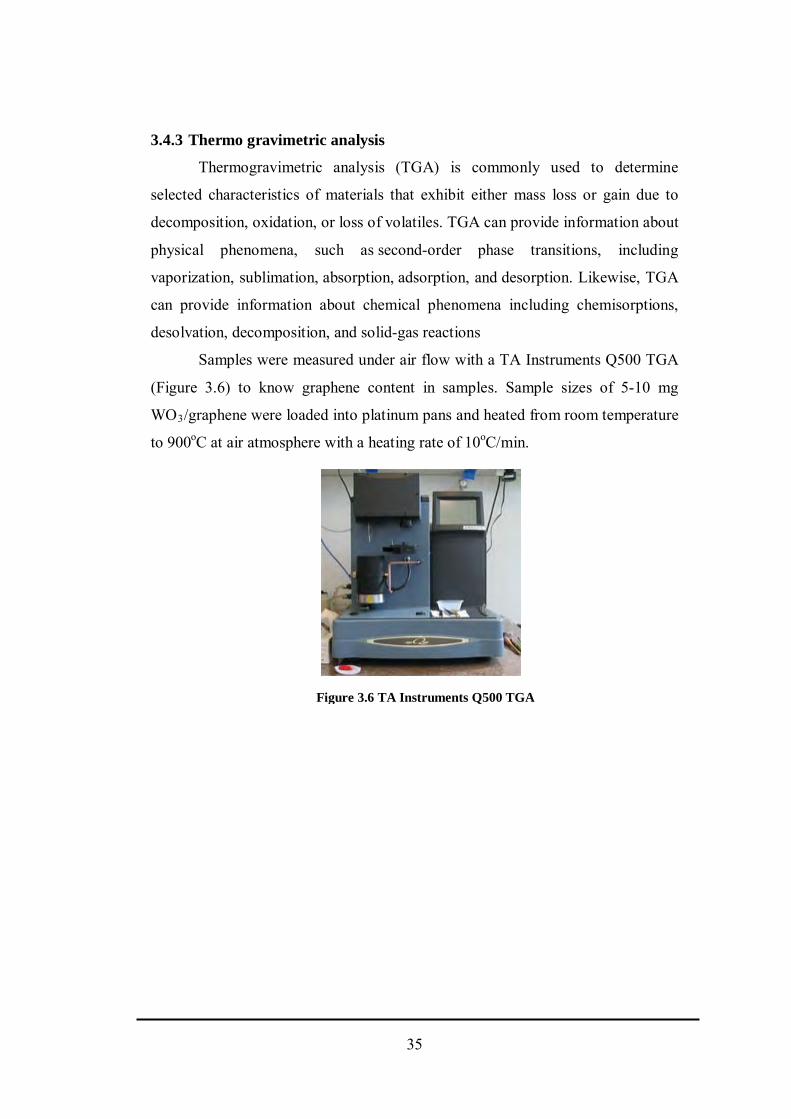
3.4.3 Thermo gravimetric analysis
Thermogravimetric analysis (TGA) is commonly used to determine
selected characteristics of materials that exhibit either mass loss or gain due to
decomposition, oxidation, or loss of volatiles. TGA can provide information about
physical phenomena, such as second-order phase transitions, including
vaporization, sublimation, absorption, adsorption, and desorption. Likewise, TGA
can provide information about chemical phenomena including chemisorptions,
desolvation, decomposition, and solid-gas reactions
Samples were measured under air flow with a TA Instruments Q500 TGA
(Figure 3.6) to know graphene content in samples. Sample sizes of 5-10 mg
WO3/graphene were loaded into platinum pans and heated from room temperature
to 900oC at air atmosphere with a heating rate of 10oC/min.
Figure 3.6 TA Instruments Q500 TGA
35
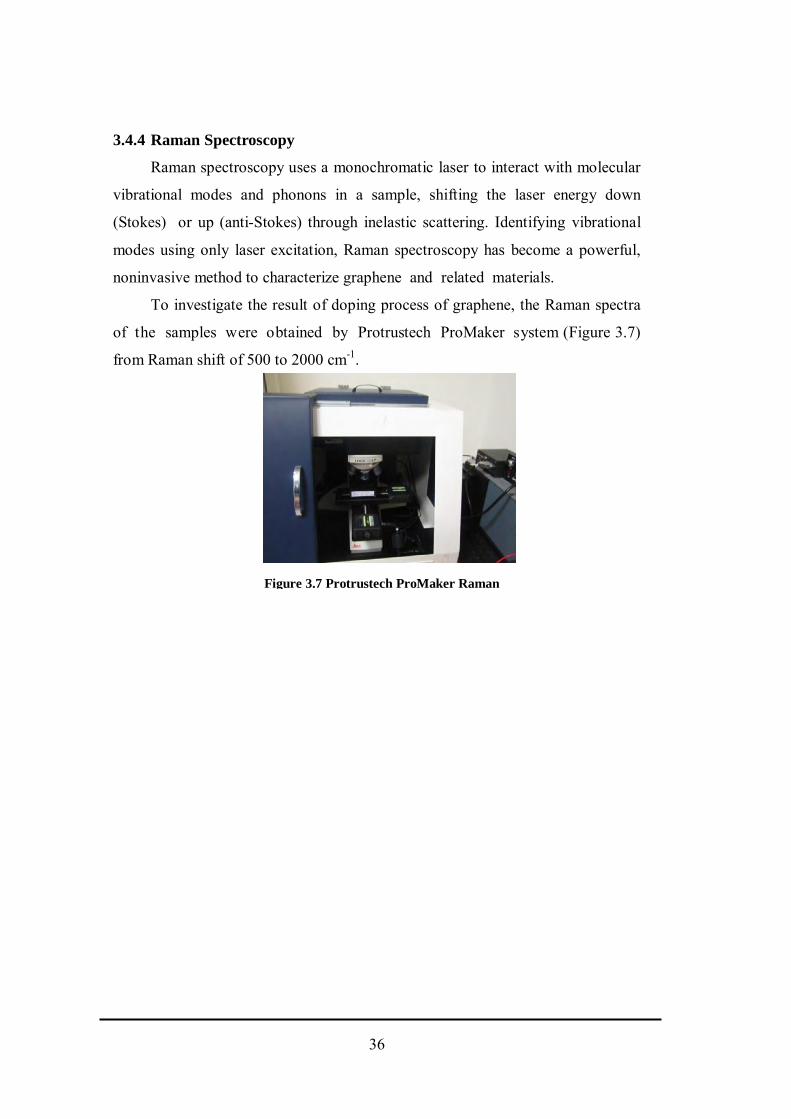
3.4.4 Raman Spectroscopy
Raman spectroscopy uses a monochromatic laser to interact with molecular
vibrational modes and phonons in a sample, shifting the laser energy down
(Stokes) or up (anti-Stokes) through inelastic scattering. Identifying vibrational
modes using only laser excitation, Raman spectroscopy has become a powerful,
noninvasive method to characterize graphene and related materials.
To investigate the result of doping process of graphene, the Raman spectra
of the samples were obtained by Protrustech ProMaker system (Figure 3.7)
from Raman shift of 500 to 2000 cm-1.
Figure 3.7 Protrustech ProMaker Raman
36
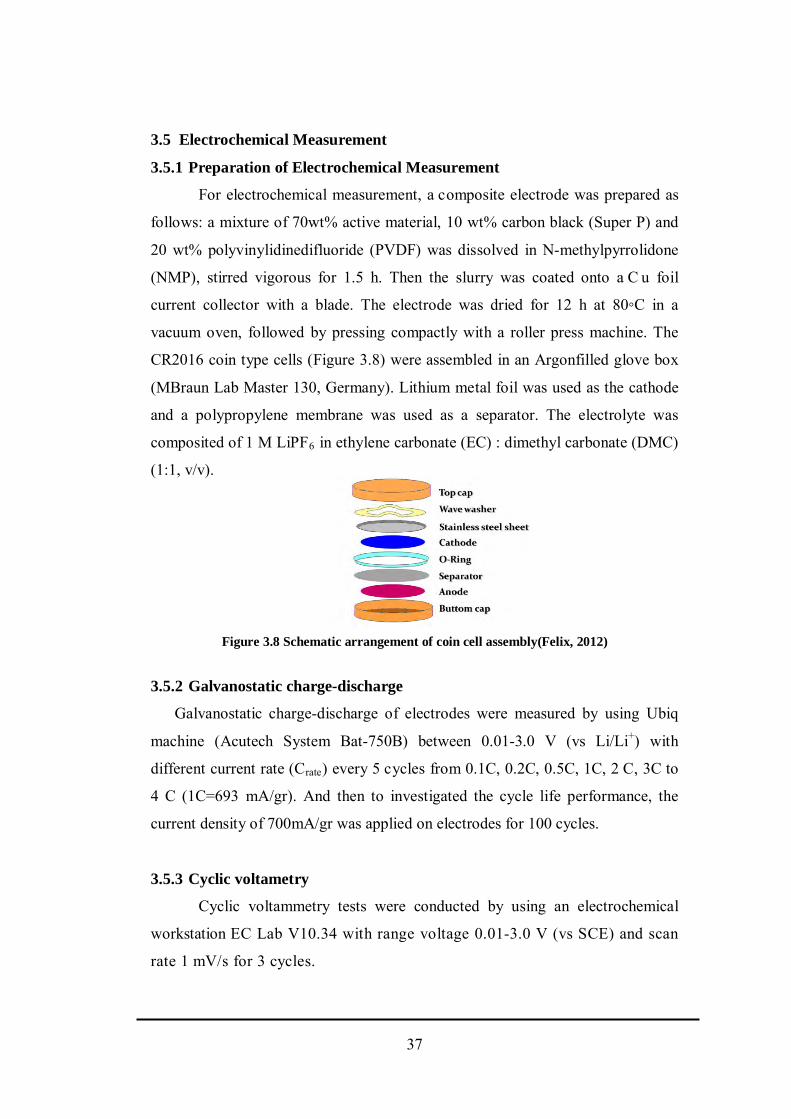
3.5 Electrochemical Measurement
3.5.1 Preparation of Electrochemical Measurement
For electrochemical measurement, a composite electrode was prepared as
follows: a mixture of 70wt% active material, 10 wt% carbon black (Super P) and
20 wt% polyvinylidinedifluoride (PVDF) was dissolved in N-methylpyrrolidone
(NMP), stirred vigorous for 1.5 h. Then the slurry was coated onto a C u foil
current collector with a blade. The electrode was dried for 12 h at 80◦C in a
vacuum oven, followed by pressing compactly with a roller press machine. The
CR2016 coin type cells (Figure 3.8) were assembled in an Argonfilled glove box
(MBraun Lab Master 130, Germany). Lithium metal foil was used as the cathode
and a polypropylene membrane was used as a separator. The electrolyte was
composited of 1 M LiPF6 in ethylene carbonate (EC) : dimethyl carbonate (DMC)
(1:1, v/v).
Figure 3.8 Schematic arrangement of coin cell assembly(Felix, 2012)
3.5.2 Galvanostatic charge-discharge
Galvanostatic charge-discharge of electrodes were measured by using Ubiq
machine (Acutech System Bat-750B) between 0.01-3.0 V (vs Li/Li+) with
different current rate (Crate) every 5 cycles from 0.1C, 0.2C, 0.5C, 1C, 2 C, 3C to
4 C (1C=693 mA/gr). And then to investigated the cycle life performance, the
current density of 700mA/gr was applied on electrodes for 100 cycles.
3.5.3 Cyclic voltametry
Cyclic voltammetry tests were conducted by using an electrochemical
workstation EC Lab V10.34 with range voltage 0.01-3.0 V (vs SCE) and scan
rate 1 mV/s for 3 cycles.
37

(This page is empty deliberately)
38
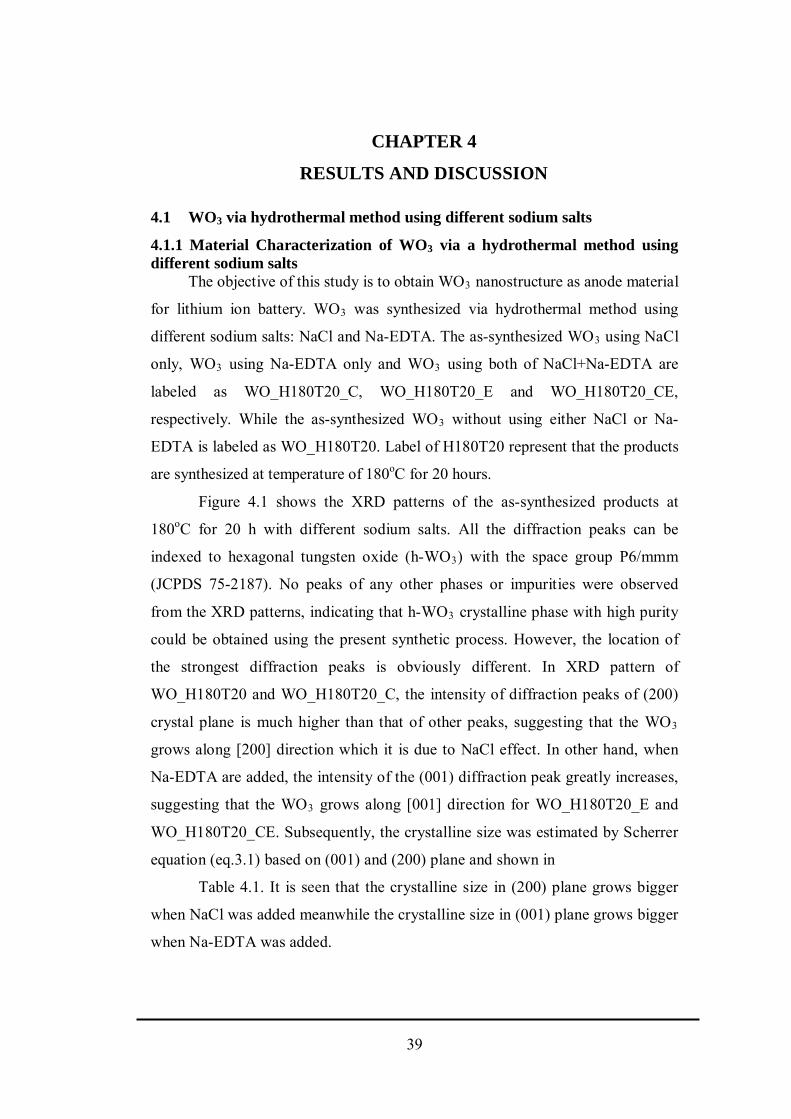
4. CHAPTER 4
RESULTS AND DISCUSSION
4.1 WO3 via hydrothermal method using different sodium salts
4.1.1 Material Characterization of WO3 via a hydrothermal method using different sodium salts
The objective of this study is to obtain WO3 nanostructure as anode material
for lithium ion battery. WO3 was synthesized via hydrothermal method using
different sodium salts: NaCl and Na-EDTA. The as-synthesized WO3 using NaCl
only, WO3 using Na-EDTA only and WO3 using both of NaCl+Na-EDTA are
labeled as WO_H180T20_C, WO_H180T20_E and WO_H180T20_CE,
respectively. While the as-synthesized WO3 without using either NaCl or Na-
EDTA is labeled as WO_H180T20. Label of H180T20 represent that the products
are synthesized at temperature of 180oC for 20 hours.
Figure 4.1 shows the XRD patterns of the as-synthesized products at
180oC for 20 h with different sodium salts. All the diffraction peaks can be
indexed to hexagonal tungsten oxide (h-WO3) with the space group P6/mmm
(JCPDS 75-2187). No peaks of any other phases or impurities were observed
from the XRD patterns, indicating that h-WO3 crystalline phase with high purity
could be obtained using the present synthetic process. However, the location of
the strongest diffraction peaks is obviously different. In XRD pattern of
WO_H180T20 and WO_H180T20_C, the intensity of diffraction peaks of (200)
crystal plane is much higher than that of other peaks, suggesting that the WO3
grows along [200] direction which it is due to NaCl effect. In other hand, when
Na-EDTA are added, the intensity of the (001) diffraction peak greatly increases,
suggesting that the WO3 grows along [001] direction for WO_H180T20_E and
WO_H180T20_CE. Subsequently, the crystalline size was estimated by Scherrer
equation (eq.3.1) based on (001) and (200) plane and shown in
Table 4.1. It is seen that the crystalline size in (200) plane grows bigger
when NaCl was added meanwhile the crystalline size in (001) plane grows bigger
when Na-EDTA was added.
39
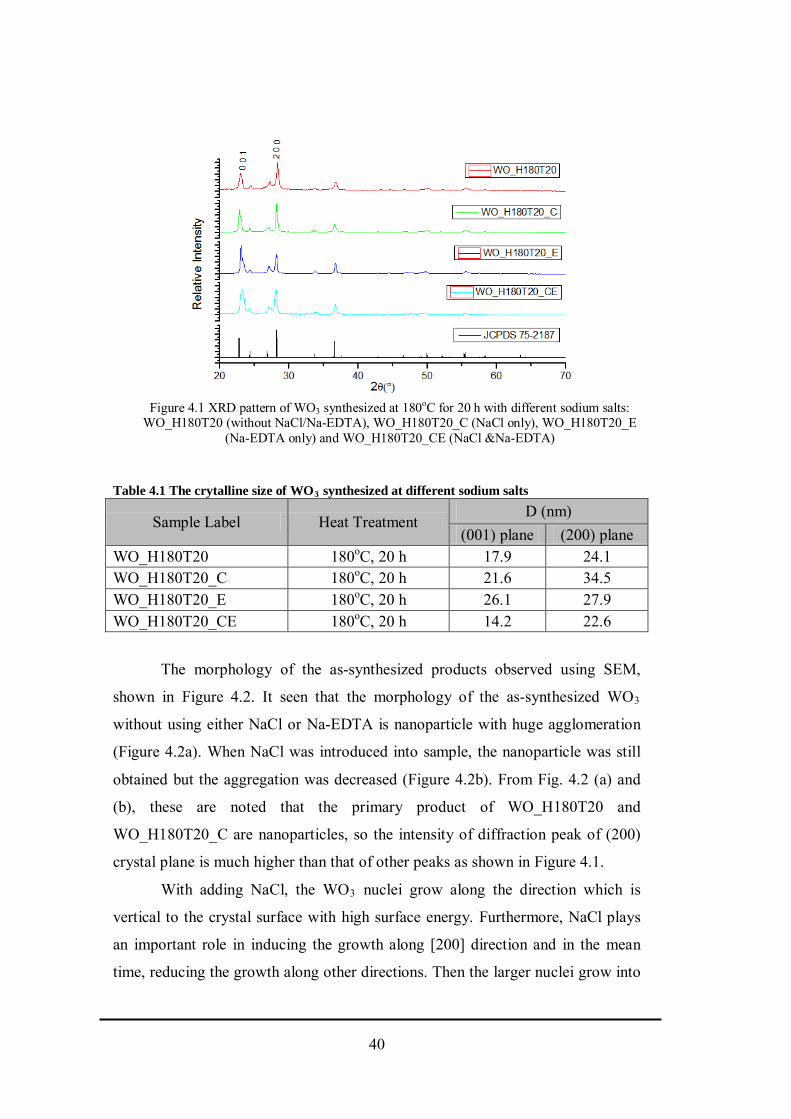
Table 4.1 The crytalline size of WO3 synthesized at different sodium salts
Sample Label Heat Treatment D (nm)
(001) plane (200) plane WO_H180T20 180oC, 20 h 17.9 24.1 WO_H180T20_C 180oC, 20 h 21.6 34.5 WO_H180T20_E 180oC, 20 h 26.1 27.9 WO_H180T20_CE 180oC, 20 h 14.2 22.6
The morphology of the as-synthesized products observed using SEM,
shown in Figure 4.2. It seen that the morphology of the as-synthesized WO3
without using either NaCl or Na-EDTA is nanoparticle with huge agglomeration
(Figure 4.2a). When NaCl was introduced into sample, the nanoparticle was still
obtained but the aggregation was decreased (Figure 4.2b). From Fig. 4.2 (a) and
(b), these are noted that the primary product of WO_H180T20 and
WO_H180T20_C are nanoparticles, so the intensity of diffraction peak of (200)
crystal plane is much higher than that of other peaks as shown in Figure 4.1.
With adding NaCl, the WO3 nuclei grow along the direction which is
vertical to the crystal surface with high surface energy. Furthermore, NaCl plays
an important role in inducing the growth along [200] direction and in the mean
time, reducing the growth along other directions. Then the larger nuclei grow into
Figure 4.1 XRD pattern of WO3 synthesized at 180oC for 20 h with different sodium salts: WO_H180T20 (without NaCl/Na-EDTA), WO_H180T20_C (NaCl only), WO_H180T20_E
(Na-EDTA only) and WO_H180T20_CE (NaCl &Na-EDTA)
40
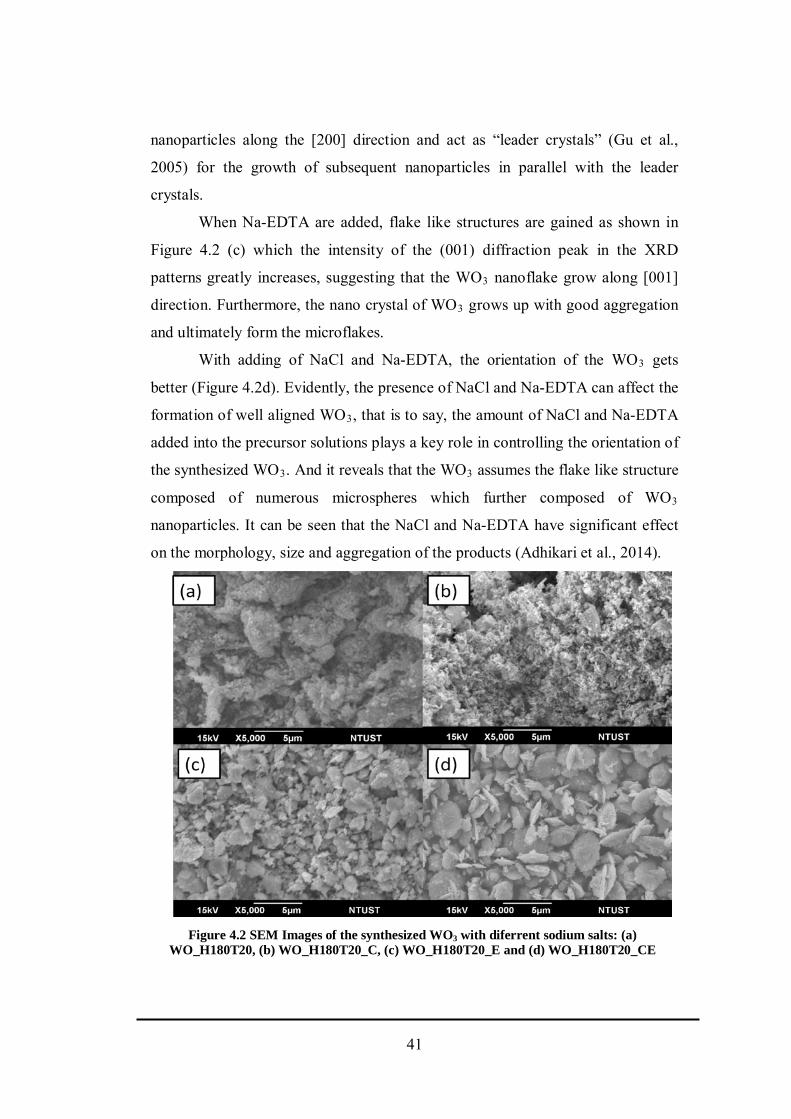
nanoparticles along the [200] direction and act as “leader crystals” (Gu et al.,
2005) for the growth of subsequent nanoparticles in parallel with the leader
crystals.
When Na-EDTA are added, flake like structures are gained as shown in
Figure 4.2 (c) which the intensity of the (001) diffraction peak in the XRD
patterns greatly increases, suggesting that the WO3 nanoflake grow along [001]
direction. Furthermore, the nano crystal of WO3 grows up with good aggregation
and ultimately form the microflakes.
With adding of NaCl and Na-EDTA, the orientation of the WO3 gets
better (Figure 4.2d). Evidently, the presence of NaCl and Na-EDTA can affect the
formation of well aligned WO3, that is to say, the amount of NaCl and Na-EDTA
added into the precursor solutions plays a key role in controlling the orientation of
the synthesized WO3. And it reveals that the WO3 assumes the flake like structure
composed of numerous microspheres which further composed of WO3
nanoparticles. It can be seen that the NaCl and Na-EDTA have significant effect
on the morphology, size and aggregation of the products (Adhikari et al., 2014).
Figure 4.2 SEM Images of the synthesized WO3 with diferrent sodium salts: (a) WO_H180T20, (b) WO_H180T20_C, (c) WO_H180T20_E and (d) WO_H180T20_CE
41
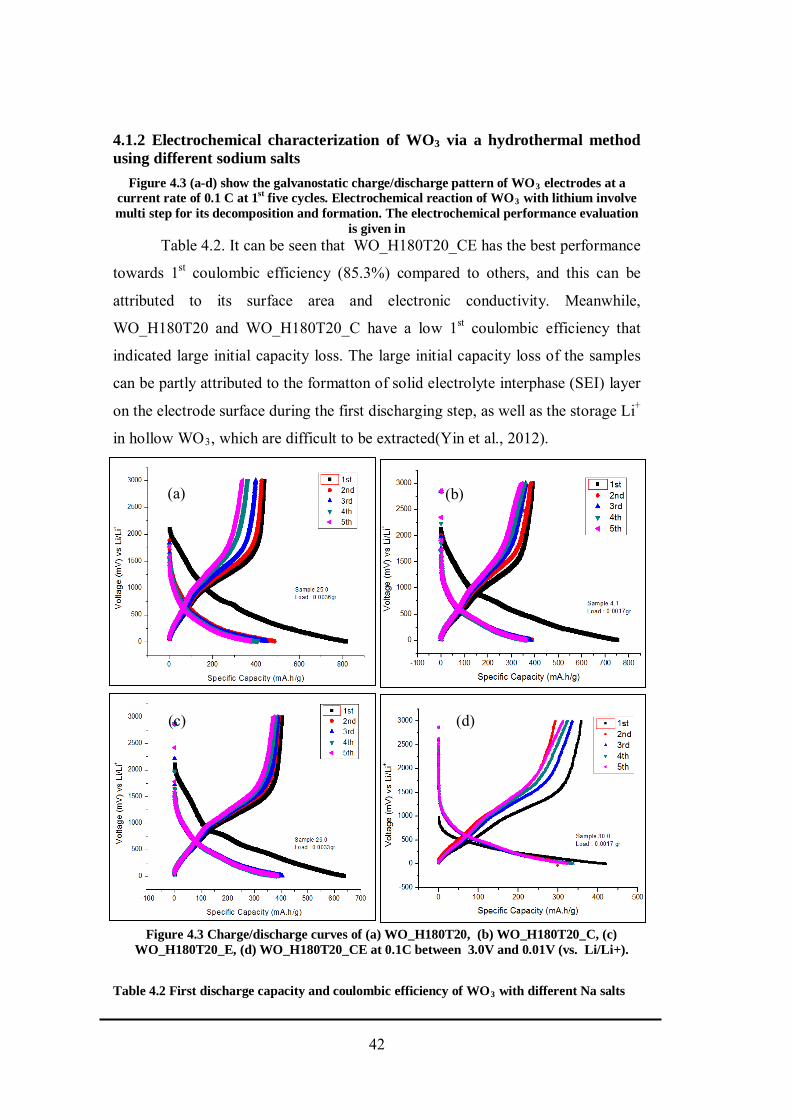
4.1.2 Electrochemical characterization of WO3 via a hydrothermal method using different sodium salts
Figure 4.3 (a-d) show the galvanostatic charge/discharge pattern of WO3 electrodes at a current rate of 0.1 C at 1st five cycles. Electrochemical reaction of WO3 with lithium involve multi step for its decomposition and formation. The electrochemical performance evaluation
is given in Table 4.2. It can be seen that WO_H180T20_CE has the best performance
towards 1st coulombic efficiency (85.3%) compared to others, and this can be
attributed to its surface area and electronic conductivity. Meanwhile,
WO_H180T20 and WO_H180T20_C have a low 1st coulombic efficiency that
indicated large initial capacity loss. The large initial capacity loss of the samples
can be partly attributed to the formatton of solid electrolyte interphase (SEI) layer
on the electrode surface during the first discharging step, as well as the storage Li+
in hollow WO3, which are difficult to be extracted(Yin et al., 2012).
Table 4.2 First discharge capacity and coulombic efficiency of WO3 with different Na salts
Figure 4.3 Charge/discharge curves of (a) WO_H180T20, (b) WO_H180T20_C, (c) WO_H180T20_E, (d) WO_H180T20_CE at 0.1C between 3.0V and 0.01V (vs. Li/Li+).
(a) (b)
(c) (d)
42
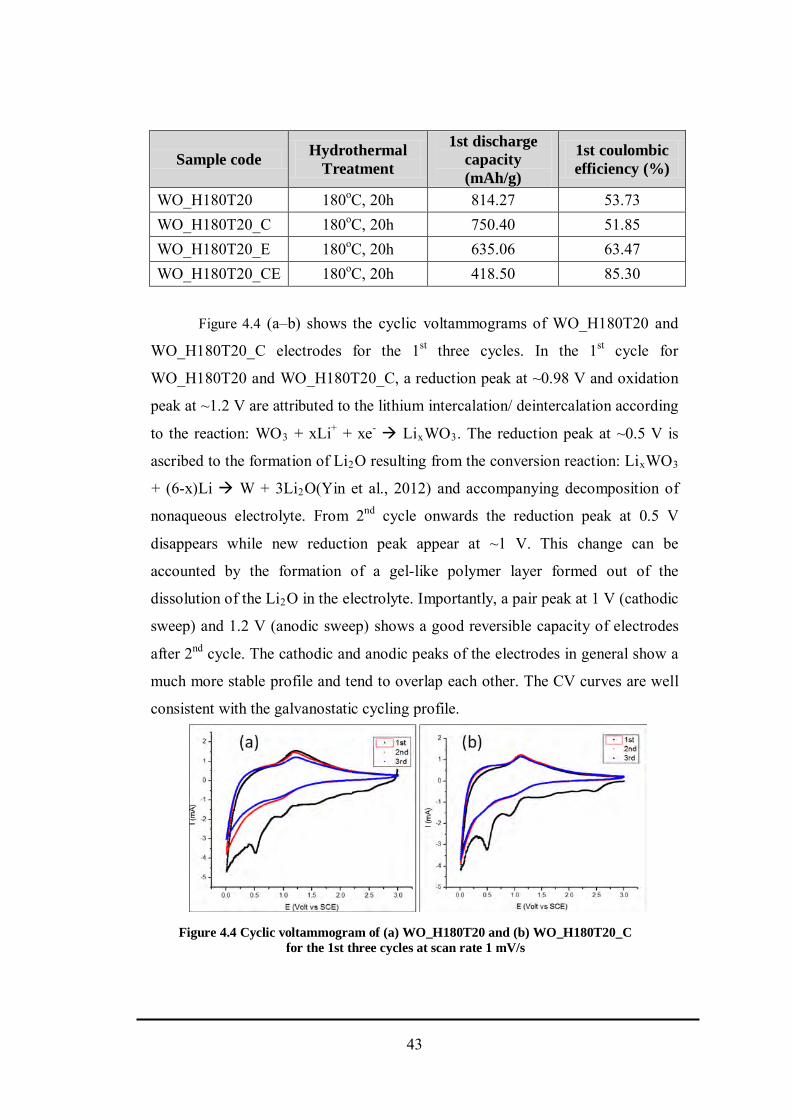
Sample code Hydrothermal Treatment
1st discharge capacity (mAh/g)
1st coulombic efficiency (%)
WO_H180T20 180oC, 20h 814.27 53.73 WO_H180T20_C 180oC, 20h 750.40 51.85 WO_H180T20_E 180oC, 20h 635.06 63.47 WO_H180T20_CE 180oC, 20h 418.50 85.30
Figure 4.4 (a–b) shows the cyclic voltammograms of WO_H180T20 and
WO_H180T20_C electrodes for the 1st three cycles. In the 1st cycle for
WO_H180T20 and WO_H180T20_C, a reduction peak at ~0.98 V and oxidation
peak at ~1.2 V are attributed to the lithium intercalation/ deintercalation according
to the reaction: WO3 + xLi+ + xe- LixWO3. The reduction peak at ~0.5 V is
ascribed to the formation of Li2O resulting from the conversion reaction: LixWO3
+ (6-x)Li W + 3Li2O(Yin et al., 2012) and accompanying decomposition of
nonaqueous electrolyte. From 2nd cycle onwards the reduction peak at 0.5 V
disappears while new reduction peak appear at ~1 V. This change can be
accounted by the formation of a gel-like polymer layer formed out of the
dissolution of the Li2O in the electrolyte. Importantly, a pair peak at 1 V (cathodic
sweep) and 1.2 V (anodic sweep) shows a good reversible capacity of electrodes
after 2nd cycle. The cathodic and anodic peaks of the electrodes in general show a
much more stable profile and tend to overlap each other. The CV curves are well
consistent with the galvanostatic cycling profile.
Figure 4.4 Cyclic voltammogram of (a) WO_H180T20 and (b) WO_H180T20_C for the 1st three cycles at scan rate 1 mV/s
43
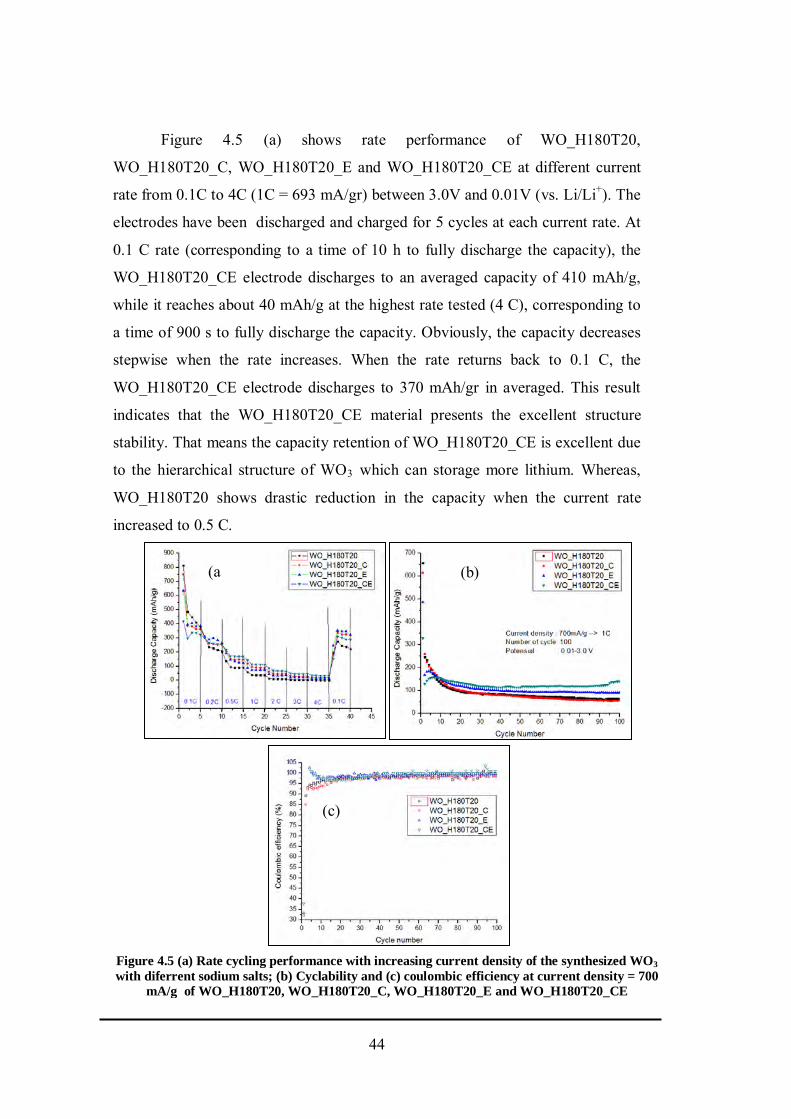
Figure 4.5 (a) shows rate performance of WO_H180T20,
WO_H180T20_C, WO_H180T20_E and WO_H180T20_CE at different current
rate from 0.1C to 4C (1C = 693 mA/gr) between 3.0V and 0.01V (vs. Li/Li+). The
electrodes have been discharged and charged for 5 cycles at each current rate. At
0.1 C rate (corresponding to a time of 10 h to fully discharge the capacity), the
WO_H180T20_CE electrode discharges to an averaged capacity of 410 mAh/g,
while it reaches about 40 mAh/g at the highest rate tested (4 C), corresponding to
a time of 900 s to fully discharge the capacity. Obviously, the capacity decreases
stepwise when the rate increases. When the rate returns back to 0.1 C, the
WO_H180T20_CE electrode discharges to 370 mAh/gr in averaged. This result
indicates that the WO_H180T20_CE material presents the excellent structure
stability. That means the capacity retention of WO_H180T20_CE is excellent due
to the hierarchical structure of WO3 which can storage more lithium. Whereas,
WO_H180T20 shows drastic reduction in the capacity when the current rate
increased to 0.5 C.
Figure 4.5 (a) Rate cycling performance with increasing current density of the synthesized WO3 with diferrent sodium salts; (b) Cyclability and (c) coulombic efficiency at current density = 700
mA/g of WO_H180T20, WO_H180T20_C, WO_H180T20_E and WO_H180T20_CE
(a
(b)
(c)
44
The cycling and stability testing of products were tested by measuring the
cycle-life performance of electrodes up to 100 cycles at a current density of 700
mA/g (Figure 4.5 (b)). The specific capacity of WO_H180T20_CE material
reaches 160 mAh/g for the tenth cycle while it remains 150 mAh/g for the 100th
cycles. It show that WO_H180T20_CE also has a good stability and cyclability.
In contrary, WO_H180T20 electrode shows extremely worse cycle performance
which may be due to collapse of partial structure after 100 cycles. This result
indicates that the WO3 nanoparticles electrode (WO_H180T20) is unstable during
electrochemical test compared to the WO3 hierarchical structure electrode
(WO_H180T20_CE). It can be concluded that WO_H180T20_CE has better
electrochemical performance compared to WO3 nanoparticles.
45
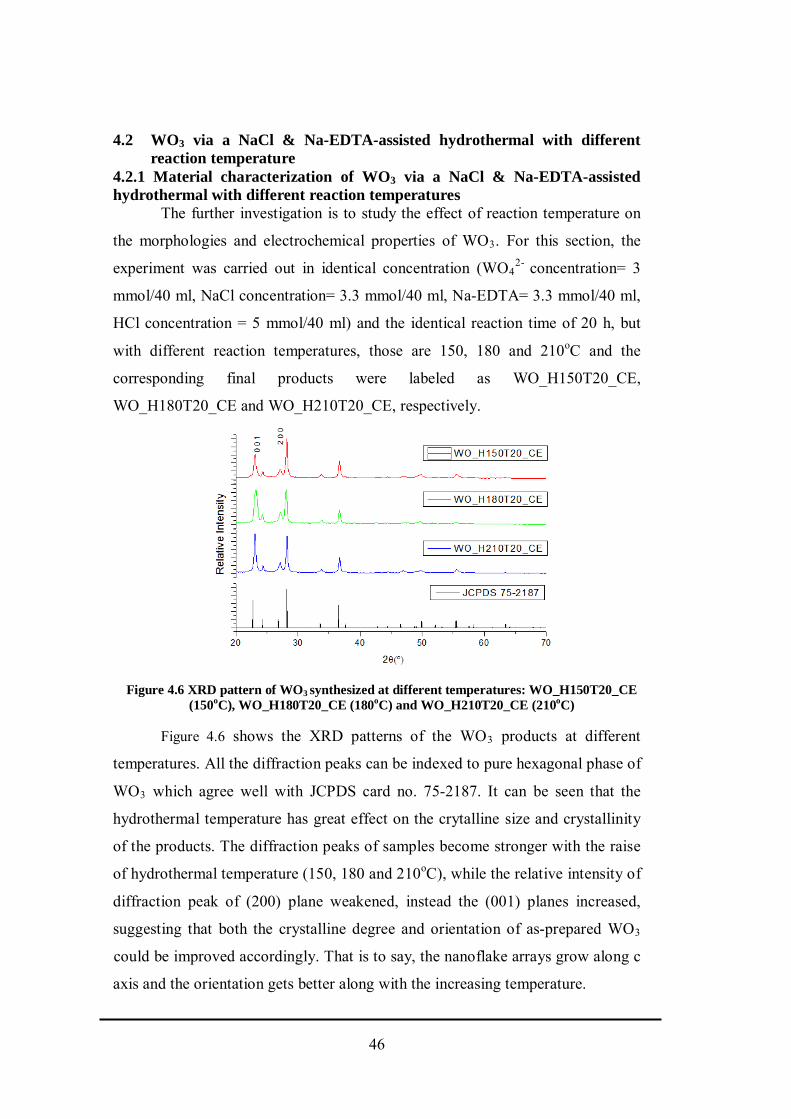
4.2 WO3 via a NaCl & Na-EDTA-assisted hydrothermal with different reaction temperature
4.2.1 Material characterization of WO3 via a NaCl & Na-EDTA-assisted hydrothermal with different reaction temperatures
The further investigation is to study the effect of reaction temperature on
the morphologies and electrochemical properties of WO3. For this section, the
experiment was carried out in identical concentration (WO42- concentration= 3
mmol/40 ml, NaCl concentration= 3.3 mmol/40 ml, Na-EDTA= 3.3 mmol/40 ml,
HCl concentration = 5 mmol/40 ml) and the identical reaction time of 20 h, but
with different reaction temperatures, those are 150, 180 and 210oC and the
corresponding final products were labeled as WO_H150T20_CE,
WO_H180T20_CE and WO_H210T20_CE, respectively.
Figure 4.6 shows the XRD patterns of the WO3 products at different
temperatures. All the diffraction peaks can be indexed to pure hexagonal phase of
WO3 which agree well with JCPDS card no. 75-2187. It can be seen that the
hydrothermal temperature has great effect on the crytalline size and crystallinity
of the products. The diffraction peaks of samples become stronger with the raise
of hydrothermal temperature (150, 180 and 210oC), while the relative intensity of
diffraction peak of (200) plane weakened, instead the (001) planes increased,
suggesting that both the crystalline degree and orientation of as-prepared WO3
could be improved accordingly. That is to say, the nanoflake arrays grow along c
axis and the orientation gets better along with the increasing temperature.
Figure 4.6 XRD pattern of WO3 synthesized at different temperatures: WO_H150T20_CE (150oC), WO_H180T20_CE (180oC) and WO_H210T20_CE (210oC)
46
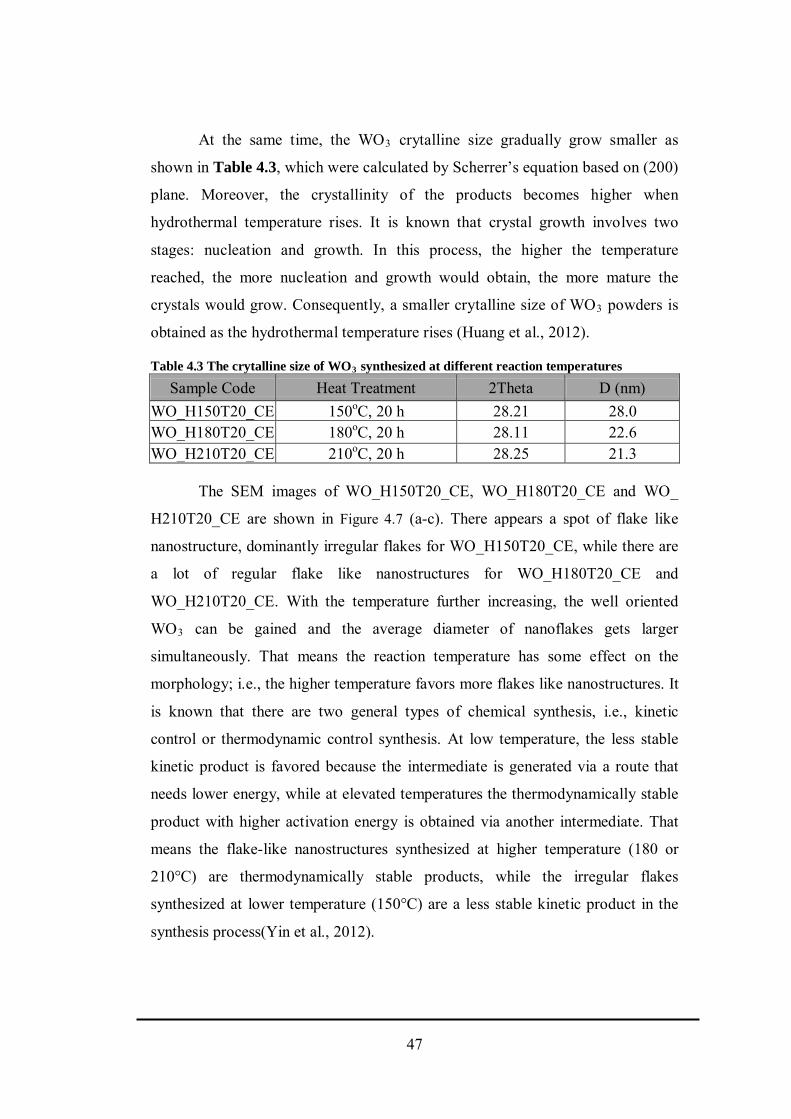
At the same time, the WO3 crytalline size gradually grow smaller as
shown in Table 4.3, which were calculated by Scherrer’s equation based on (200)
plane. Moreover, the crystallinity of the products becomes higher when
hydrothermal temperature rises. It is known that crystal growth involves two
stages: nucleation and growth. In this process, the higher the temperature
reached, the more nucleation and growth would obtain, the more mature the
crystals would grow. Consequently, a smaller crytalline size of WO3 powders is
obtained as the hydrothermal temperature rises (Huang et al., 2012).
Table 4.3 The crytalline size of WO3 synthesized at different reaction temperatures
Sample Code Heat Treatment 2Theta D (nm) WO_H150T20_CE 150oC, 20 h 28.21 28.0 WO_H180T20_CE 180oC, 20 h 28.11 22.6 WO_H210T20_CE 210oC, 20 h 28.25 21.3
The SEM images of WO_H150T20_CE, WO_H180T20_CE and WO_
H210T20_CE are shown in Figure 4.7 (a-c). There appears a spot of flake like
nanostructure, dominantly irregular flakes for WO_H150T20_CE, while there are
a lot of regular flake like nanostructures for WO_H180T20_CE and
WO_H210T20_CE. With the temperature further increasing, the well oriented
WO3 can be gained and the average diameter of nanoflakes gets larger
simultaneously. That means the reaction temperature has some effect on the
morphology; i.e., the higher temperature favors more flakes like nanostructures. It
is known that there are two general types of chemical synthesis, i.e., kinetic
control or thermodynamic control synthesis. At low temperature, the less stable
kinetic product is favored because the intermediate is generated via a route that
needs lower energy, while at elevated temperatures the thermodynamically stable
product with higher activation energy is obtained via another intermediate. That
means the flake-like nanostructures synthesized at higher temperature (180 or
210°C) are thermodynamically stable products, while the irregular flakes
synthesized at lower temperature (150°C) are a less stable kinetic product in the
synthesis process(Yin et al., 2012).
47
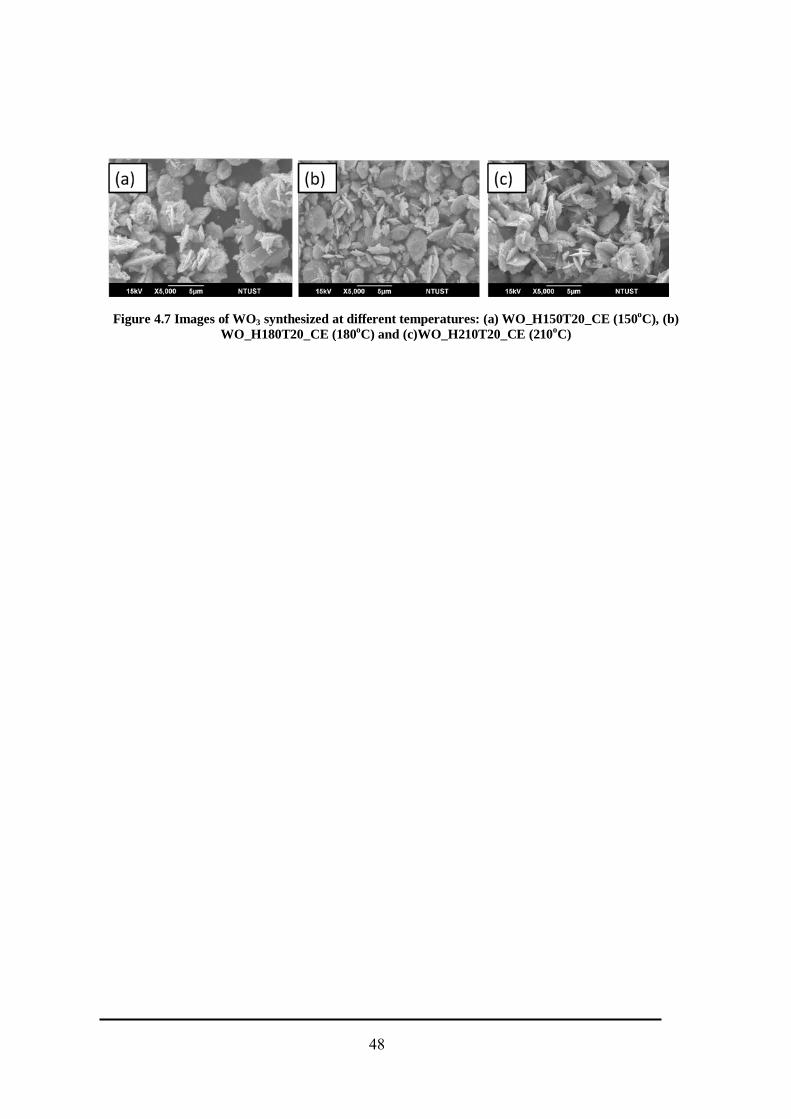
Figure 4.7 Images of WO3 synthesized at different temperatures: (a) WO_H150T20_CE (150oC), (b)
WO_H180T20_CE (180oC) and (c)WO_H210T20_CE (210oC)
48
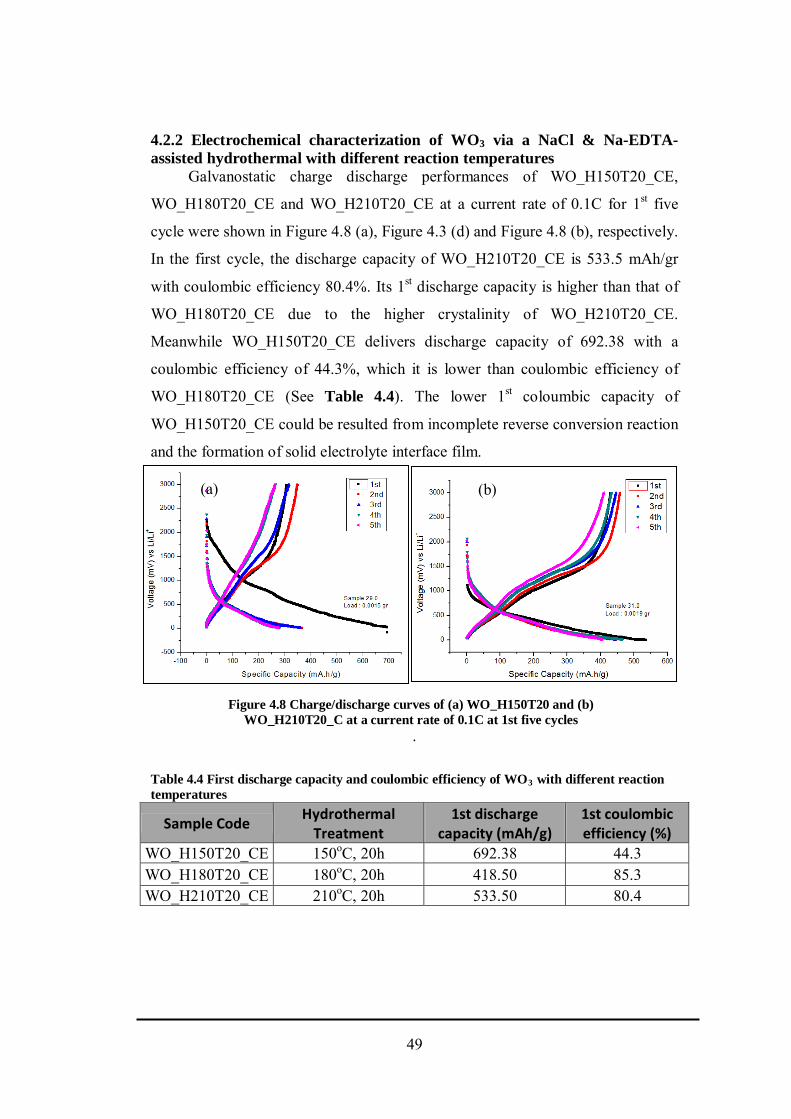
4.2.2 Electrochemical characterization of WO3 via a NaCl & Na-EDTA-assisted hydrothermal with different reaction temperatures
Galvanostatic charge discharge performances of WO_H150T20_CE,
WO_H180T20_CE and WO_H210T20_CE at a current rate of 0.1C for 1st five
cycle were shown in Figure 4.8 (a), Figure 4.3 (d) and Figure 4.8 (b), respectively.
In the first cycle, the discharge capacity of WO_H210T20_CE is 533.5 mAh/gr
with coulombic efficiency 80.4%. Its 1st discharge capacity is higher than that of
WO_H180T20_CE due to the higher crystalinity of WO_H210T20_CE.
Meanwhile WO_H150T20_CE delivers discharge capacity of 692.38 with a
coulombic efficiency of 44.3%, which it is lower than coulombic efficiency of
WO_H180T20_CE (See Table 4.4). The lower 1st coloumbic capacity of
WO_H150T20_CE could be resulted from incomplete reverse conversion reaction
and the formation of solid electrolyte interface film.
.
Table 4.4 First discharge capacity and coulombic efficiency of WO3 with different reaction temperatures
Sample Code Hydrothermal Treatment
1st discharge capacity (mAh/g)
1st coulombic efficiency (%)
WO_H150T20_CE 150oC, 20h 692.38 44.3 WO_H180T20_CE 180oC, 20h 418.50 85.3 WO_H210T20_CE 210oC, 20h 533.50 80.4
Figure 4.8 Charge/discharge curves of (a) WO_H150T20 and (b) WO_H210T20_C at a current rate of 0.1C at 1st five cycles
(a) (b)
49
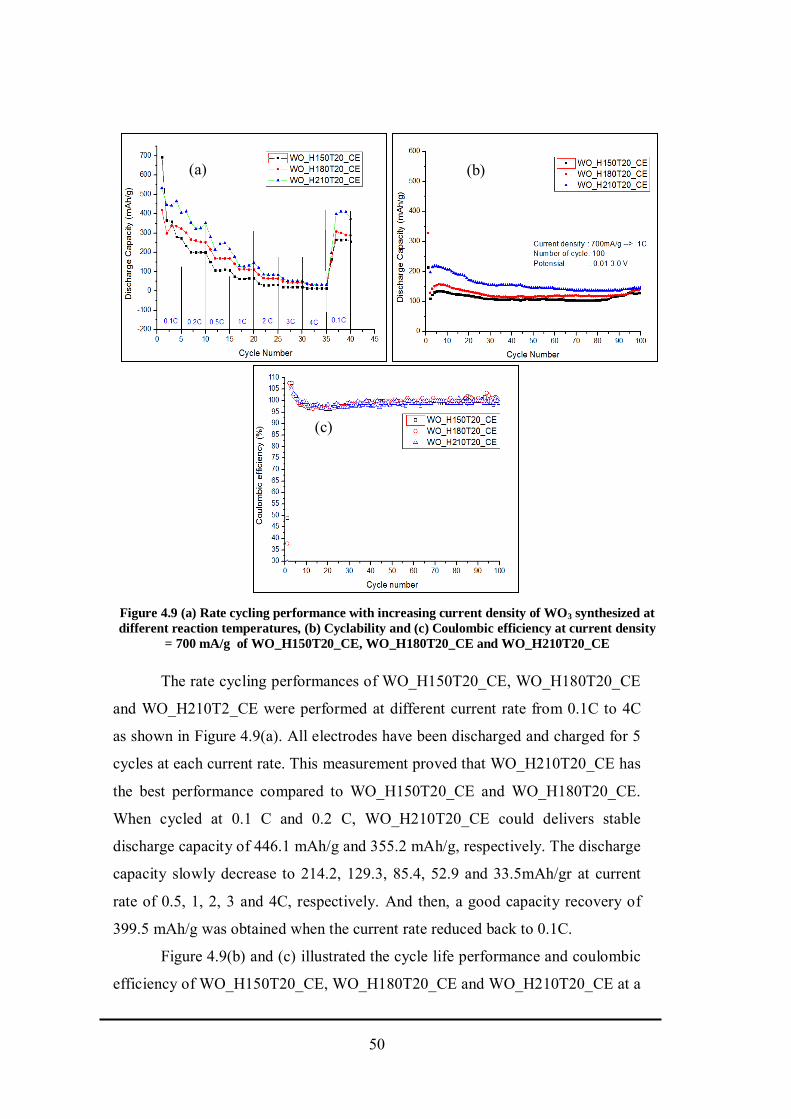
The rate cycling performances of WO_H150T20_CE, WO_H180T20_CE
and WO_H210T2_CE were performed at different current rate from 0.1C to 4C
as shown in Figure 4.9(a). All electrodes have been discharged and charged for 5
cycles at each current rate. This measurement proved that WO_H210T20_CE has
the best performance compared to WO_H150T20_CE and WO_H180T20_CE.
When cycled at 0.1 C and 0.2 C, WO_H210T20_CE could delivers stable
discharge capacity of 446.1 mAh/g and 355.2 mAh/g, respectively. The discharge
capacity slowly decrease to 214.2, 129.3, 85.4, 52.9 and 33.5mAh/gr at current
rate of 0.5, 1, 2, 3 and 4C, respectively. And then, a good capacity recovery of
399.5 mAh/g was obtained when the current rate reduced back to 0.1C.
Figure 4.9(b) and (c) illustrated the cycle life performance and coulombic
efficiency of WO_H150T20_CE, WO_H180T20_CE and WO_H210T20_CE at a
Figure 4.9 (a) Rate cycling performance with increasing current density of WO3 synthesized at different reaction temperatures, (b) Cyclability and (c) Coulombic efficiency at current density
= 700 mA/g of WO_H150T20_CE, WO_H180T20_CE and WO_H210T20_CE
(a) (b)
(c)
50
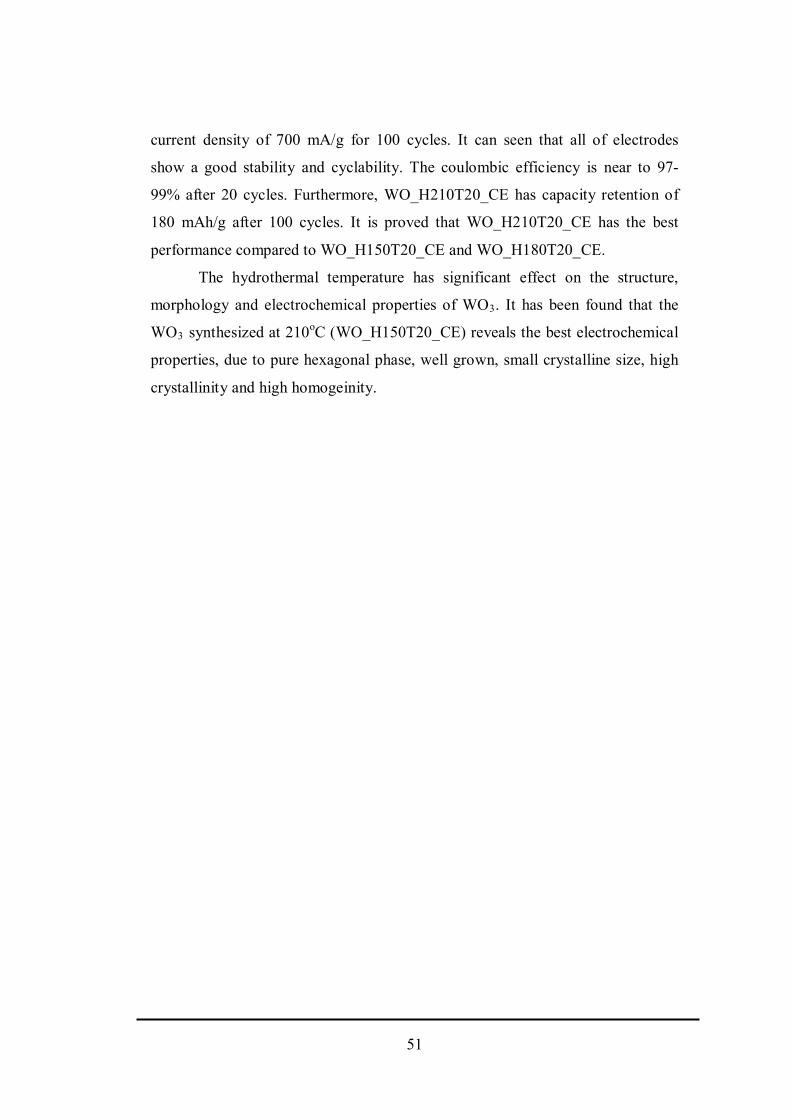
current density of 700 mA/g for 100 cycles. It can seen that all of electrodes
show a good stability and cyclability. The coulombic efficiency is near to 97-
99% after 20 cycles. Furthermore, WO_H210T20_CE has capacity retention of
180 mAh/g after 100 cycles. It is proved that WO_H210T20_CE has the best
performance compared to WO_H150T20_CE and WO_H180T20_CE.
The hydrothermal temperature has significant effect on the structure,
morphology and electrochemical properties of WO3. It has been found that the
WO3 synthesized at 210oC (WO_H150T20_CE) reveals the best electrochemical
properties, due to pure hexagonal phase, well grown, small crystalline size, high
crystallinity and high homogeinity.
51
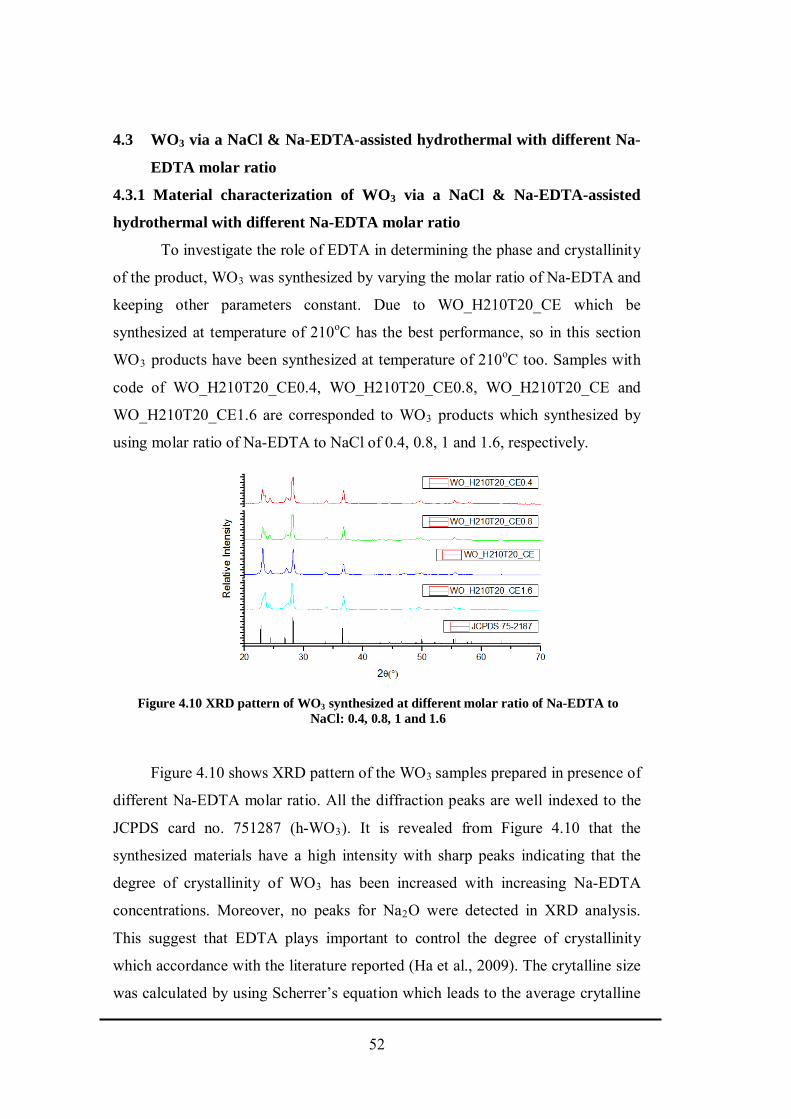
4.3 WO3 via a NaCl & Na-EDTA-assisted hydrothermal with different Na-
EDTA molar ratio
4.3.1 Material characterization of WO3 via a NaCl & Na-EDTA-assisted
hydrothermal with different Na-EDTA molar ratio
To investigate the role of EDTA in determining the phase and crystallinity
of the product, WO3 was synthesized by varying the molar ratio of Na-EDTA and
keeping other parameters constant. Due to WO_H210T20_CE which be
synthesized at temperature of 210oC has the best performance, so in this section
WO3 products have been synthesized at temperature of 210oC too. Samples with
code of WO_H210T20_CE0.4, WO_H210T20_CE0.8, WO_H210T20_CE and
WO_H210T20_CE1.6 are corresponded to WO3 products which synthesized by
using molar ratio of Na-EDTA to NaCl of 0.4, 0.8, 1 and 1.6, respectively.
Figure 4.10 shows XRD pattern of the WO3 samples prepared in presence of
different Na-EDTA molar ratio. All the diffraction peaks are well indexed to the
JCPDS card no. 751287 (h-WO3). It is revealed from Figure 4.10 that the
synthesized materials have a high intensity with sharp peaks indicating that the
degree of crystallinity of WO3 has been increased with increasing Na-EDTA
concentrations. Moreover, no peaks for Na2O were detected in XRD analysis.
This suggest that EDTA plays important to control the degree of crystallinity
which accordance with the literature reported (Ha et al., 2009). The crytalline size
was calculated by using Scherrer’s equation which leads to the average crytalline
Figure 4.10 XRD pattern of WO3 synthesized at different molar ratio of Na-EDTA to NaCl: 0.4, 0.8, 1 and 1.6
52
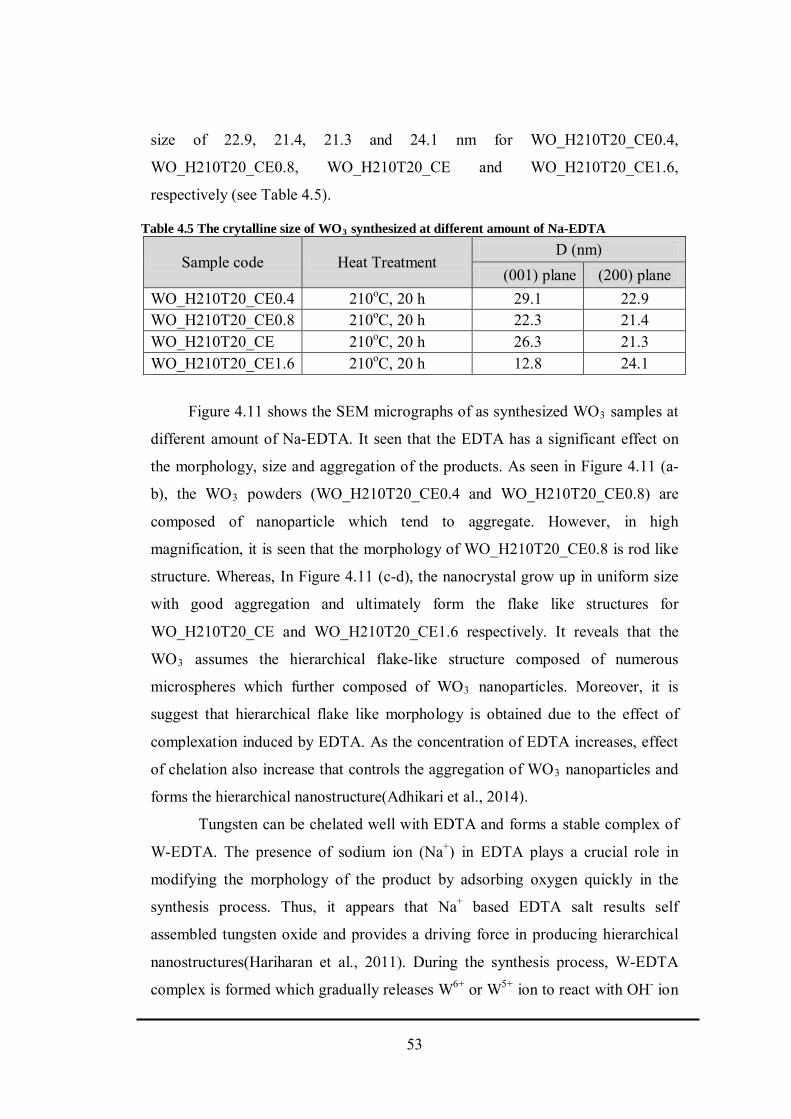
size of 22.9, 21.4, 21.3 and 24.1 nm for WO_H210T20_CE0.4,
WO_H210T20_CE0.8, WO_H210T20_CE and WO_H210T20_CE1.6,
respectively (see Table 4.5).
Table 4.5 The crytalline size of WO3 synthesized at different amount of Na-EDTA
Sample code Heat Treatment D (nm)
(001) plane (200) plane WO_H210T20_CE0.4 210oC, 20 h 29.1 22.9 WO_H210T20_CE0.8 210oC, 20 h 22.3 21.4 WO_H210T20_CE 210oC, 20 h 26.3 21.3 WO_H210T20_CE1.6 210oC, 20 h 12.8 24.1
Figure 4.11 shows the SEM micrographs of as synthesized WO3 samples at
different amount of Na-EDTA. It seen that the EDTA has a significant effect on
the morphology, size and aggregation of the products. As seen in Figure 4.11 (a-
b), the WO3 powders (WO_H210T20_CE0.4 and WO_H210T20_CE0.8) are
composed of nanoparticle which tend to aggregate. However, in high
magnification, it is seen that the morphology of WO_H210T20_CE0.8 is rod like
structure. Whereas, In Figure 4.11 (c-d), the nanocrystal grow up in uniform size
with good aggregation and ultimately form the flake like structures for
WO_H210T20_CE and WO_H210T20_CE1.6 respectively. It reveals that the
WO3 assumes the hierarchical flake-like structure composed of numerous
microspheres which further composed of WO3 nanoparticles. Moreover, it is
suggest that hierarchical flake like morphology is obtained due to the effect of
complexation induced by EDTA. As the concentration of EDTA increases, effect
of chelation also increase that controls the aggregation of WO3 nanoparticles and
forms the hierarchical nanostructure(Adhikari et al., 2014).
Tungsten can be chelated well with EDTA and forms a stable complex of
W-EDTA. The presence of sodium ion (Na+) in EDTA plays a crucial role in
modifying the morphology of the product by adsorbing oxygen quickly in the
synthesis process. Thus, it appears that Na+ based EDTA salt results self
assembled tungsten oxide and provides a driving force in producing hierarchical
nanostructures(Hariharan et al., 2011). During the synthesis process, W-EDTA
complex is formed which gradually releases W6+ or W5+ ion to react with OH- ion
53
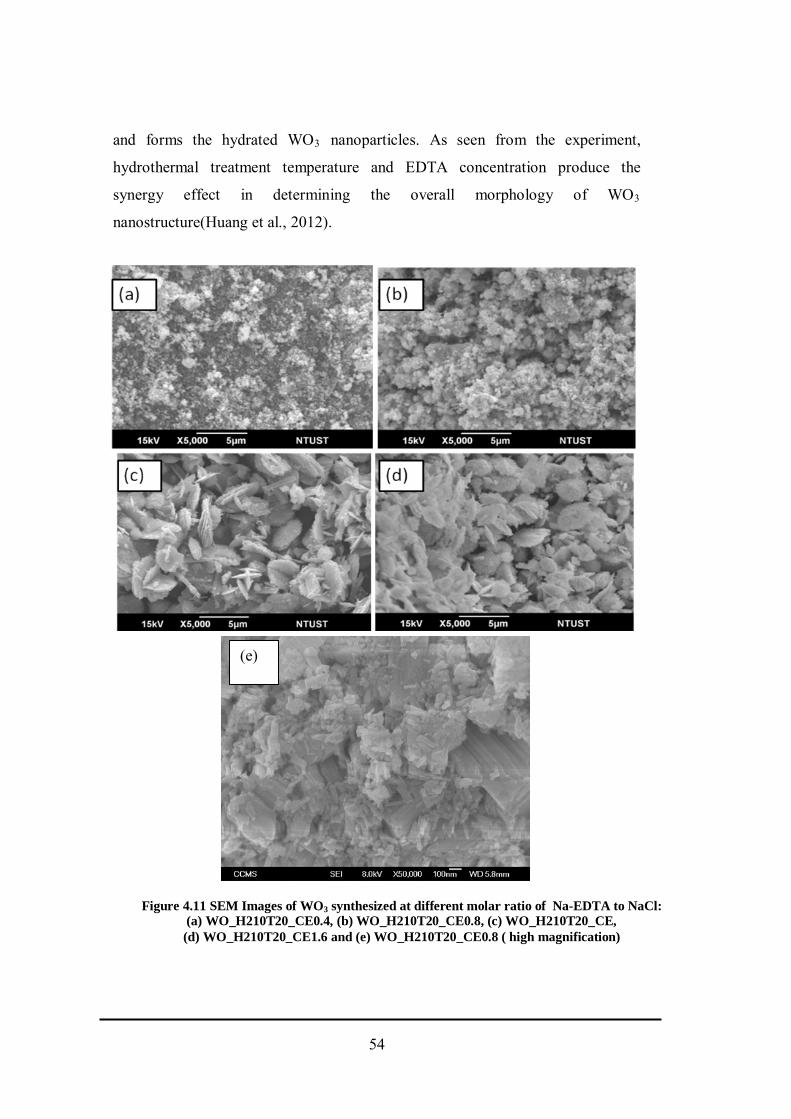
and forms the hydrated WO3 nanoparticles. As seen from the experiment,
hydrothermal treatment temperature and EDTA concentration produce the
synergy effect in determining the overall morphology of WO3
nanostructure(Huang et al., 2012).
Figure 4.11 SEM Images of WO3 synthesized at different molar ratio of Na-EDTA to NaCl: (a) WO_H210T20_CE0.4, (b) WO_H210T20_CE0.8, (c) WO_H210T20_CE, (d) WO_H210T20_CE1.6 and (e) WO_H210T20_CE0.8 ( high magnification)
(e)
54
During the hydrothermal process, EDTA plays a vital role for the
formation of hierarchical structure and the formation of hierarchical structure may
be ascribed to the dissolution-recrystalization process through Ostwald
ripening(Luo et al., 2005). In this process, at the expense of small crystallites,
large crystallites grow by means of dissolution, diffusion and recrytalization.
During the continuous hydrothermal process, these tiny particle in the presence of
EDTA could dissolve and re-grow to large self assembled microspheres through
Oswald ripening process (Xu et al., 2010). In the presence of higher concentration
of EDTA, the microspheres thus formed further assembled to hierarchical
structure through controlled aggregation(Adhikari et al., 2014).
55
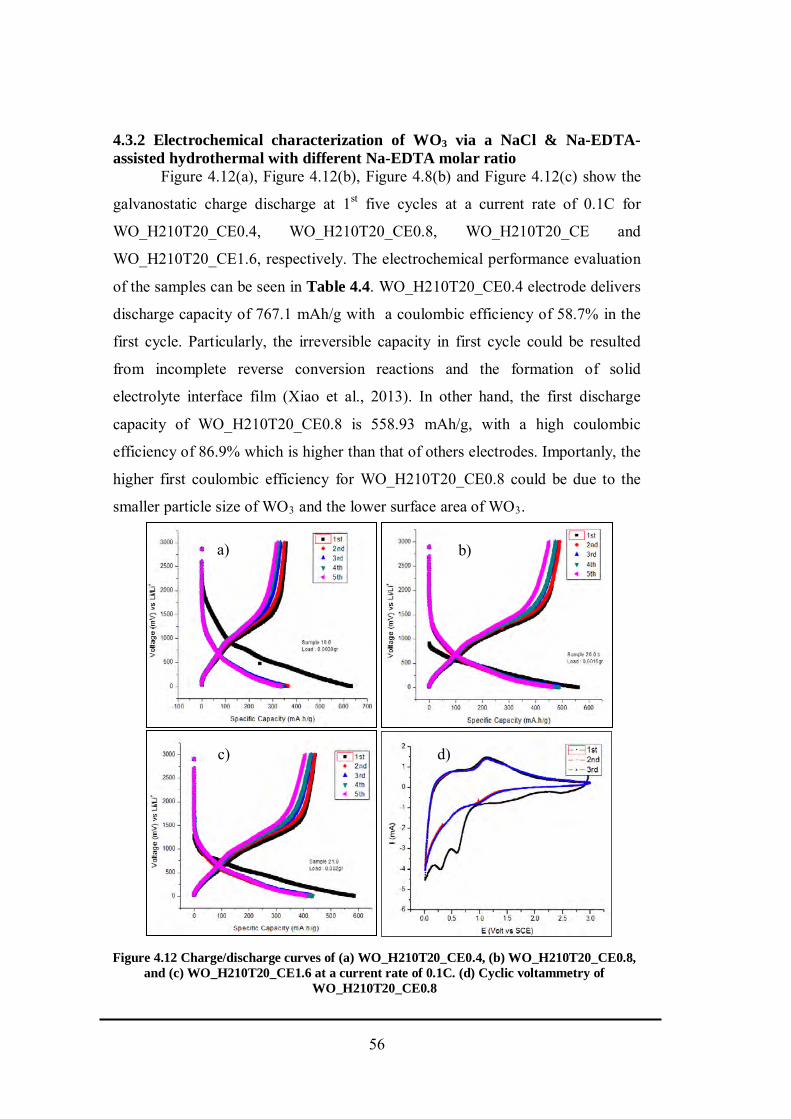
4.3.2 Electrochemical characterization of WO3 via a NaCl & Na-EDTA-assisted hydrothermal with different Na-EDTA molar ratio Figure 4.12(a), Figure 4.12(b), Figure 4.8(b) and Figure 4.12(c) show the
galvanostatic charge discharge at 1st five cycles at a current rate of 0.1C for
WO_H210T20_CE0.4, WO_H210T20_CE0.8, WO_H210T20_CE and
WO_H210T20_CE1.6, respectively. The electrochemical performance evaluation
of the samples can be seen in Table 4.4. WO_H210T20_CE0.4 electrode delivers
discharge capacity of 767.1 mAh/g with a coulombic efficiency of 58.7% in the
first cycle. Particularly, the irreversible capacity in first cycle could be resulted
from incomplete reverse conversion reactions and the formation of solid
electrolyte interface film (Xiao et al., 2013). In other hand, the first discharge
capacity of WO_H210T20_CE0.8 is 558.93 mAh/g, with a high coulombic
efficiency of 86.9% which is higher than that of others electrodes. Importanly, the
higher first coulombic efficiency for WO_H210T20_CE0.8 could be due to the
smaller particle size of WO3 and the lower surface area of WO3.
.
Figure 4.12 Charge/discharge curves of (a) WO_H210T20_CE0.4, (b) WO_H210T20_CE0.8, and (c) WO_H210T20_CE1.6 at a current rate of 0.1C. (d) Cyclic voltammetry of
WO_H210T20_CE0.8
a) b)
c) d)
56
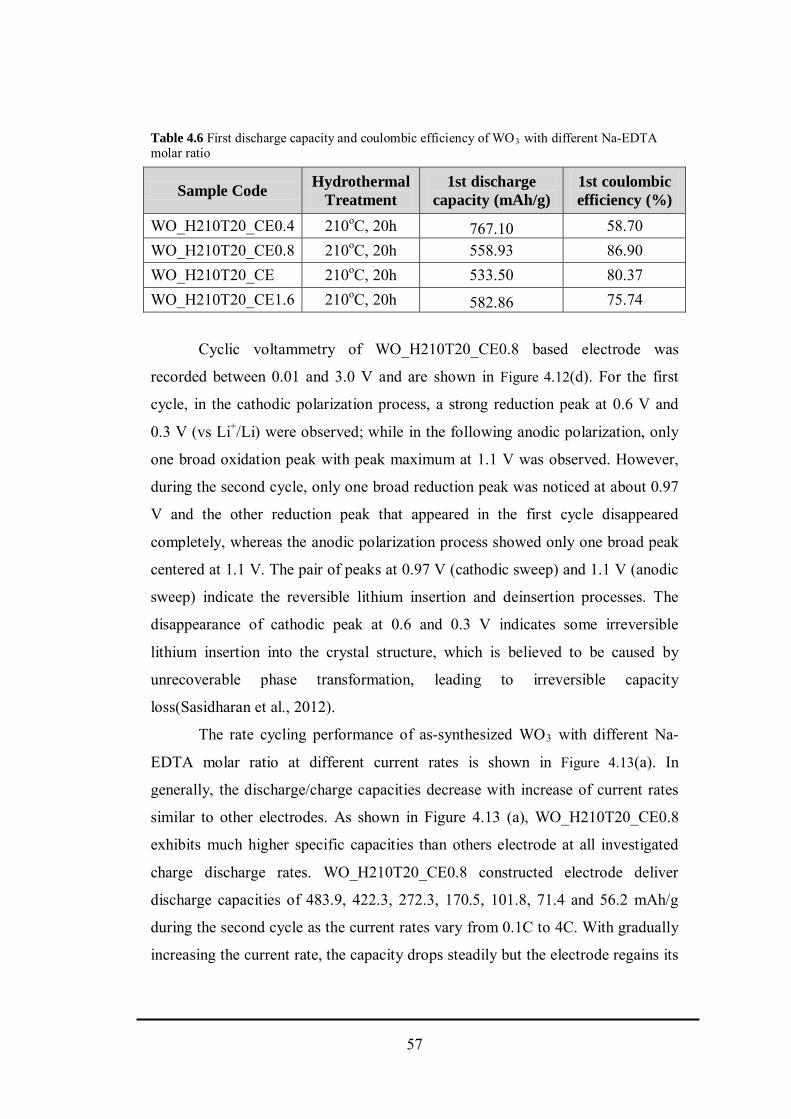
Table 4.6 First discharge capacity and coulombic efficiency of WO3 with different Na-EDTA molar ratio
Cyclic voltammetry of WO_H210T20_CE0.8 based electrode was
recorded between 0.01 and 3.0 V and are shown in Figure 4.12(d). For the first
cycle, in the cathodic polarization process, a strong reduction peak at 0.6 V and
0.3 V (vs Li+/Li) were observed; while in the following anodic polarization, only
one broad oxidation peak with peak maximum at 1.1 V was observed. However,
during the second cycle, only one broad reduction peak was noticed at about 0.97
V and the other reduction peak that appeared in the first cycle disappeared
completely, whereas the anodic polarization process showed only one broad peak
centered at 1.1 V. The pair of peaks at 0.97 V (cathodic sweep) and 1.1 V (anodic
sweep) indicate the reversible lithium insertion and deinsertion processes. The
disappearance of cathodic peak at 0.6 and 0.3 V indicates some irreversible
lithium insertion into the crystal structure, which is believed to be caused by
unrecoverable phase transformation, leading to irreversible capacity
loss(Sasidharan et al., 2012).
The rate cycling performance of as-synthesized WO3 with different Na-
EDTA molar ratio at different current rates is shown in Figure 4.13(a). In
generally, the discharge/charge capacities decrease with increase of current rates
similar to other electrodes. As shown in Figure 4.13 (a), WO_H210T20_CE0.8
exhibits much higher specific capacities than others electrode at all investigated
charge discharge rates. WO_H210T20_CE0.8 constructed electrode deliver
discharge capacities of 483.9, 422.3, 272.3, 170.5, 101.8, 71.4 and 56.2 mAh/g
during the second cycle as the current rates vary from 0.1C to 4C. With gradually
increasing the current rate, the capacity drops steadily but the electrode regains its
Sample Code Hydrothermal Treatment
1st discharge capacity (mAh/g)
1st coulombic efficiency (%)
WO_H210T20_CE0.4 210oC, 20h 767.10 58.70 WO_H210T20_CE0.8 210oC, 20h 558.93 86.90 WO_H210T20_CE 210oC, 20h 533.50 80.37 WO_H210T20_CE1.6 210oC, 20h 582.86 75.74
57
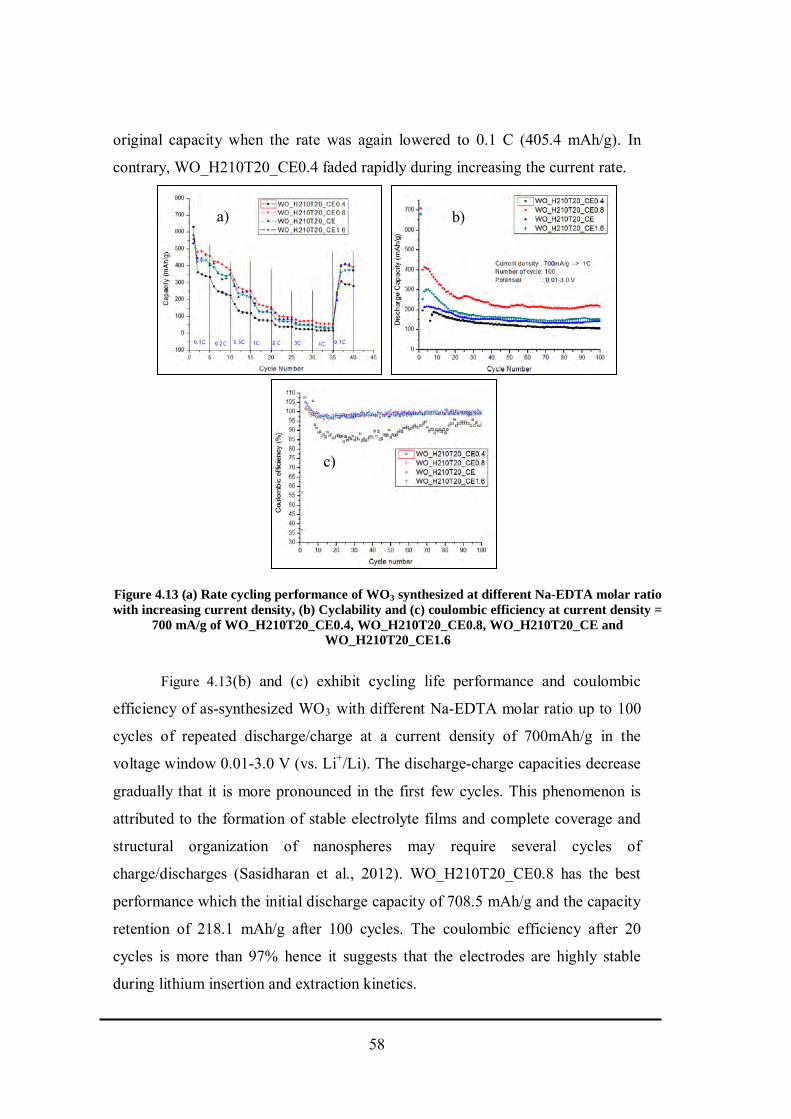
original capacity when the rate was again lowered to 0.1 C (405.4 mAh/g). In
contrary, WO_H210T20_CE0.4 faded rapidly during increasing the current rate.
Figure 4.13(b) and (c) exhibit cycling life performance and coulombic
efficiency of as-synthesized WO3 with different Na-EDTA molar ratio up to 100
cycles of repeated discharge/charge at a current density of 700mAh/g in the
voltage window 0.01-3.0 V (vs. Li+/Li). The discharge-charge capacities decrease
gradually that it is more pronounced in the first few cycles. This phenomenon is
attributed to the formation of stable electrolyte films and complete coverage and
structural organization of nanospheres may require several cycles of
charge/discharges (Sasidharan et al., 2012). WO_H210T20_CE0.8 has the best
performance which the initial discharge capacity of 708.5 mAh/g and the capacity
retention of 218.1 mAh/g after 100 cycles. The coulombic efficiency after 20
cycles is more than 97% hence it suggests that the electrodes are highly stable
during lithium insertion and extraction kinetics.
Figure 4.13 (a) Rate cycling performance of WO3 synthesized at different Na-EDTA molar ratio with increasing current density, (b) Cyclability and (c) coulombic efficiency at current density =
700 mA/g of WO_H210T20_CE0.4, WO_H210T20_CE0.8, WO_H210T20_CE and WO_H210T20_CE1.6
a) b)
c)
58
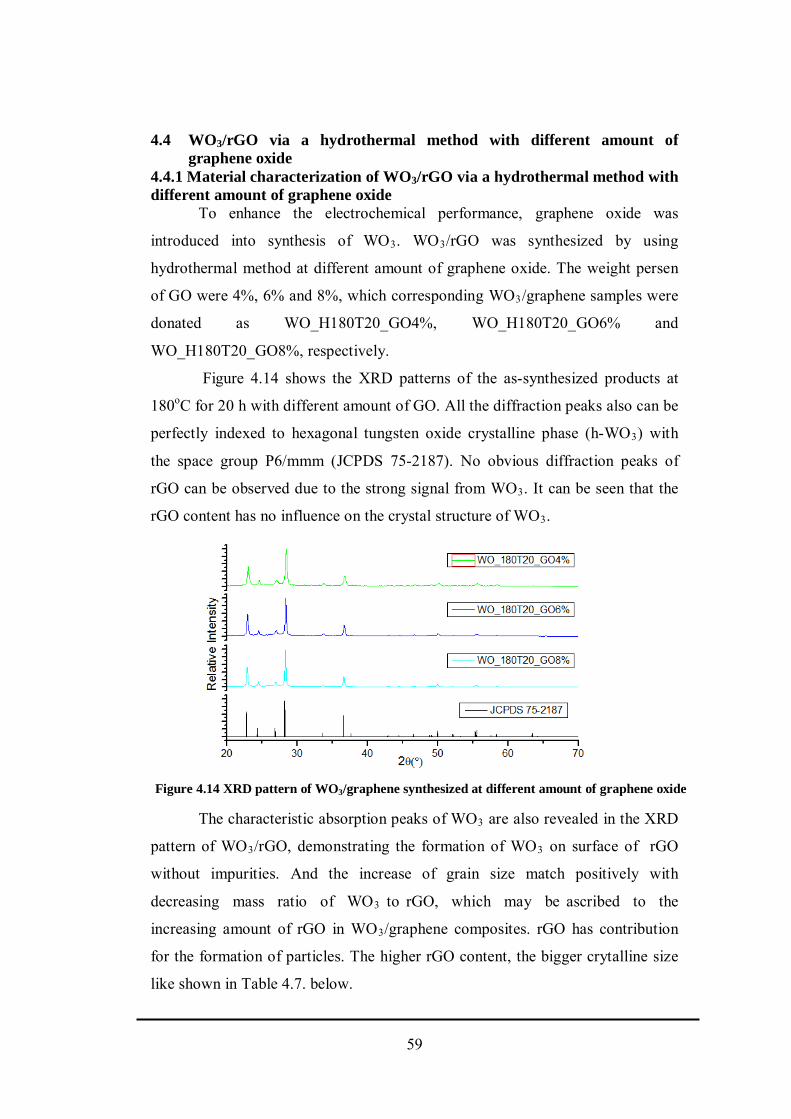
4.4 WO3/rGO via a hydrothermal method with different amount of graphene oxide
4.4.1 Material characterization of WO3/rGO via a hydrothermal method with different amount of graphene oxide
To enhance the electrochemical performance, graphene oxide was
introduced into synthesis of WO3. WO3/rGO was synthesized by using
hydrothermal method at different amount of graphene oxide. The weight persen
of GO were 4%, 6% and 8%, which corresponding WO3/graphene samples were
donated as WO_H180T20_GO4%, WO_H180T20_GO6% and
WO_H180T20_GO8%, respectively.
Figure 4.14 shows the XRD patterns of the as-synthesized products at
180oC for 20 h with different amount of GO. All the diffraction peaks also can be
perfectly indexed to hexagonal tungsten oxide crystalline phase (h-WO3) with
the space group P6/mmm (JCPDS 75-2187). No obvious diffraction peaks of
rGO can be observed due to the strong signal from WO3. It can be seen that the
rGO content has no influence on the crystal structure of WO3.
The characteristic absorption peaks of WO3 are also revealed in the XRD
pattern of WO3/rGO, demonstrating the formation of WO3 on surface of rGO
without impurities. And the increase of grain size match positively with
decreasing mass ratio of WO3 to rGO, which may be ascribed to the
increasing amount of rGO in WO3/graphene composites. rGO has contribution
for the formation of particles. The higher rGO content, the bigger crytalline size
like shown in Table 4.7. below.
Figure 4.14 XRD pattern of WO3/graphene synthesized at different amount of graphene oxide
59
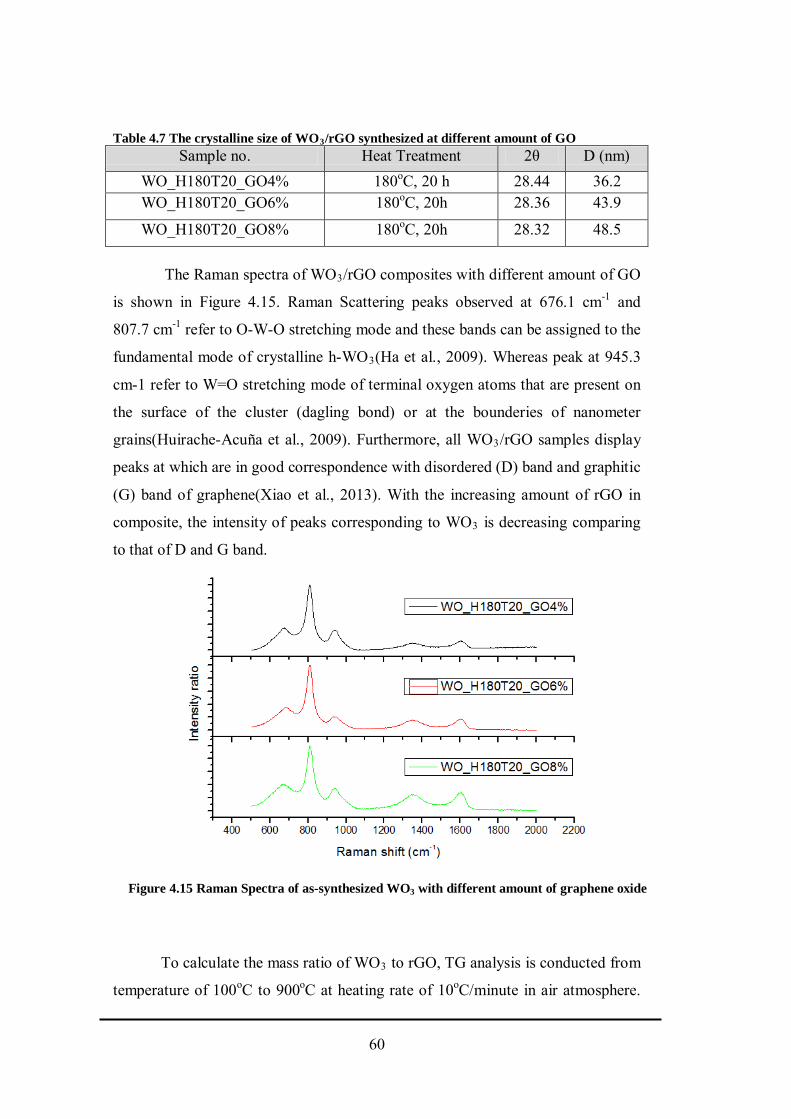
Table 4.7 The crystalline size of WO3/rGO synthesized at different amount of GO Sample no. Heat Treatment 2θ D (nm)
WO_H180T20_GO4% 180oC, 20 h 28.44 36.2 WO_H180T20_GO6% 180oC, 20h 28.36 43.9
WO_H180T20_GO8% 180oC, 20h 28.32 48.5
The Raman spectra of WO3/rGO composites with different amount of GO
is shown in Figure 4.15. Raman Scattering peaks observed at 676.1 cm-1 and
807.7 cm-1 refer to O-W-O stretching mode and these bands can be assigned to the
fundamental mode of crystalline h-WO3(Ha et al., 2009). Whereas peak at 945.3
cm-1 refer to W=O stretching mode of terminal oxygen atoms that are present on
the surface of the cluster (dagling bond) or at the bounderies of nanometer
grains(Huirache-Acuña et al., 2009). Furthermore, all WO3/rGO samples display
peaks at which are in good correspondence with disordered (D) band and graphitic
(G) band of graphene(Xiao et al., 2013). With the increasing amount of rGO in
composite, the intensity of peaks corresponding to WO3 is decreasing comparing
to that of D and G band.
To calculate the mass ratio of WO3 to rGO, TG analysis is conducted from
temperature of 100oC to 900oC at heating rate of 10oC/minute in air atmosphere.
Figure 4.15 Raman Spectra of as-synthesized WO3 with different amount of graphene oxide
60
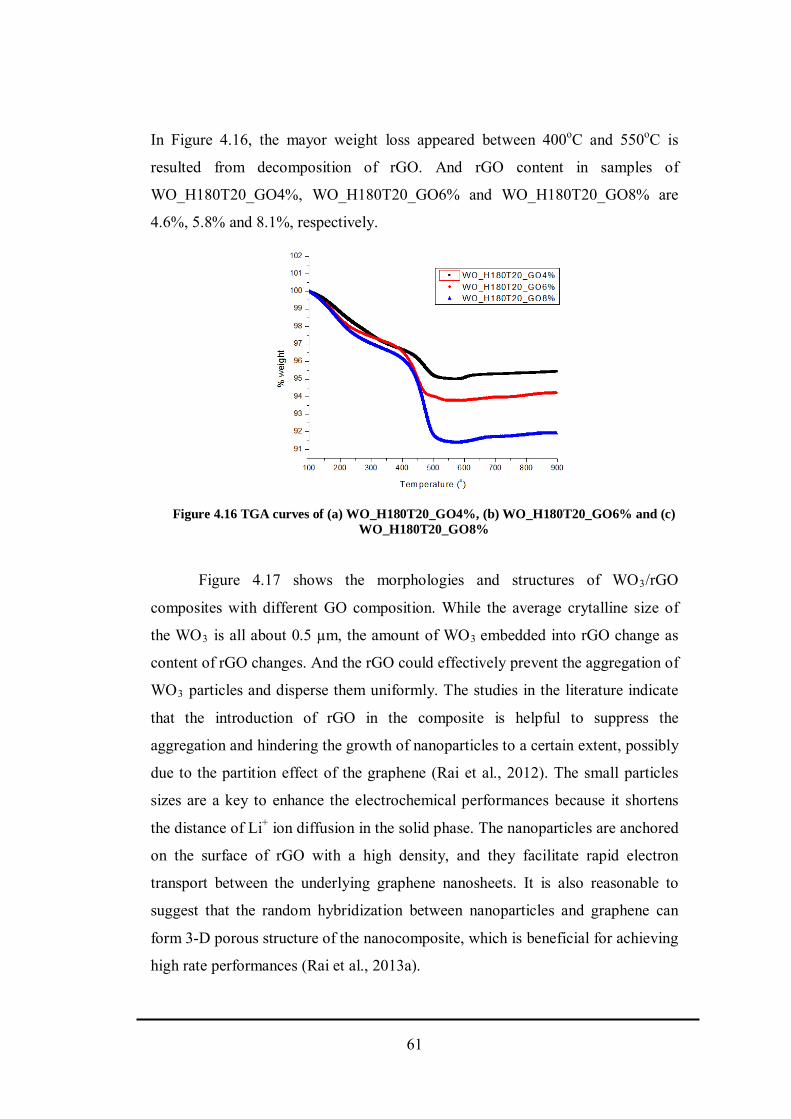
In Figure 4.16, the mayor weight loss appeared between 400oC and 550oC is
resulted from decomposition of rGO. And rGO content in samples of
WO_H180T20_GO4%, WO_H180T20_GO6% and WO_H180T20_GO8% are
4.6%, 5.8% and 8.1%, respectively.
Figure 4.17 shows the morphologies and structures of WO3/rGO
composites with different GO composition. While the average crytalline size of
the WO3 is all about 0.5 µm, the amount of WO3 embedded into rGO change as
content of rGO changes. And the rGO could effectively prevent the aggregation of
WO3 particles and disperse them uniformly. The studies in the literature indicate
that the introduction of rGO in the composite is helpful to suppress the
aggregation and hindering the growth of nanoparticles to a certain extent, possibly
due to the partition effect of the graphene (Rai et al., 2012). The small particles
sizes are a key to enhance the electrochemical performances because it shortens
the distance of Li+ ion diffusion in the solid phase. The nanoparticles are anchored
on the surface of rGO with a high density, and they facilitate rapid electron
transport between the underlying graphene nanosheets. It is also reasonable to
suggest that the random hybridization between nanoparticles and graphene can
form 3-D porous structure of the nanocomposite, which is beneficial for achieving
high rate performances (Rai et al., 2013a).
Figure 4.16 TGA curves of (a) WO_H180T20_GO4%, (b) WO_H180T20_GO6% and (c) WO_H180T20_GO8%
61
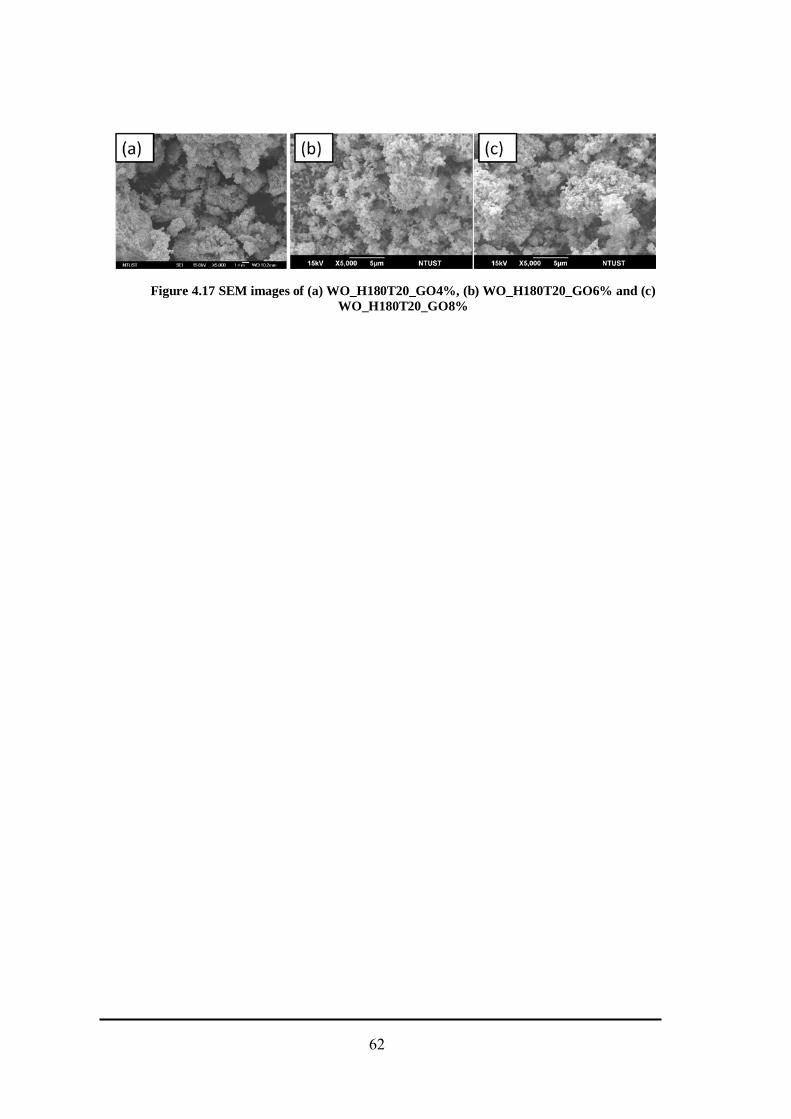
Figure 4.17 SEM images of (a) WO_H180T20_GO4%, (b) WO_H180T20_GO6% and (c) WO_H180T20_GO8%
62
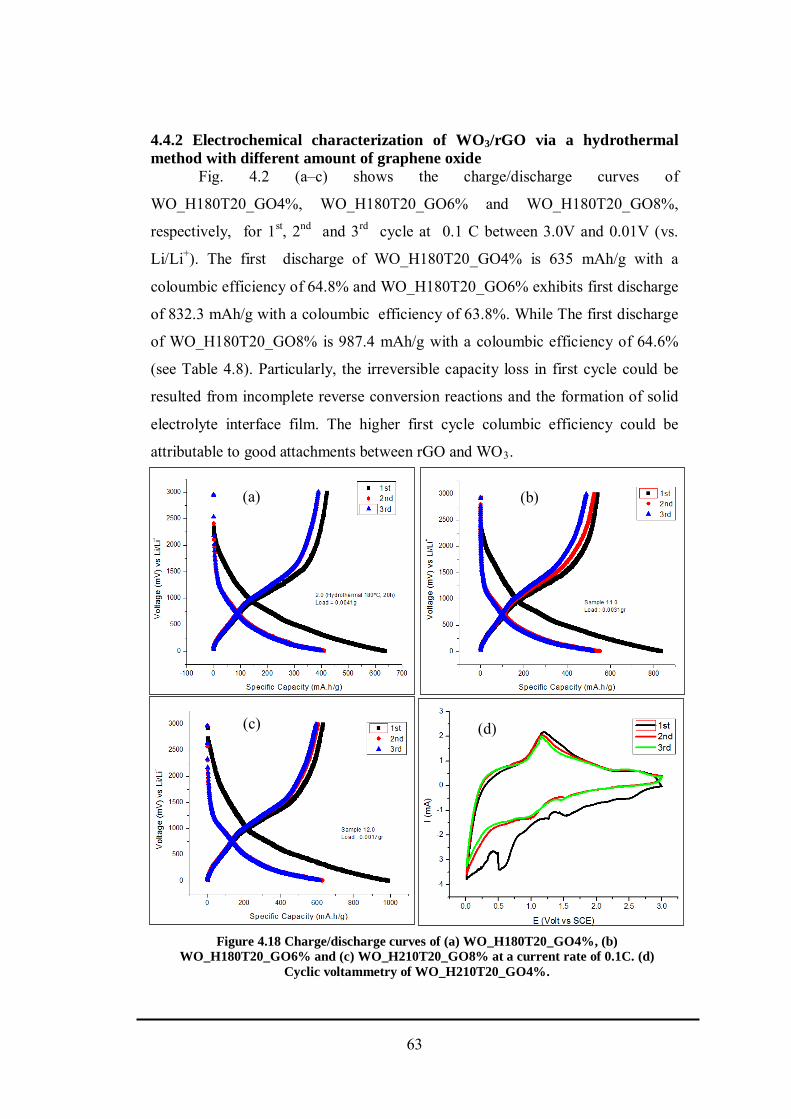
4.4.2 Electrochemical characterization of WO3/rGO via a hydrothermal method with different amount of graphene oxide
Fig. 4.2 (a–c) shows the charge/discharge curves of
WO_H180T20_GO4%, WO_H180T20_GO6% and WO_H180T20_GO8%,
respectively, for 1st, 2nd and 3rd cycle at 0.1 C between 3.0V and 0.01V (vs.
Li/Li+). The first discharge of WO_H180T20_GO4% is 635 mAh/g with a
coloumbic efficiency of 64.8% and WO_H180T20_GO6% exhibits first discharge
of 832.3 mAh/g with a coloumbic efficiency of 63.8%. While The first discharge
of WO_H180T20_GO8% is 987.4 mAh/g with a coloumbic efficiency of 64.6%
(see Table 4.8). Particularly, the irreversible capacity loss in first cycle could be
resulted from incomplete reverse conversion reactions and the formation of solid
electrolyte interface film. The higher first cycle columbic efficiency could be
attributable to good attachments between rGO and WO3.
Figure 4.18 Charge/discharge curves of (a) WO_H180T20_GO4%, (b) WO_H180T20_GO6% and (c) WO_H210T20_GO8% at a current rate of 0.1C. (d)
Cyclic voltammetry of WO_H210T20_GO4%.
(a) (b)
(c) (d)
63
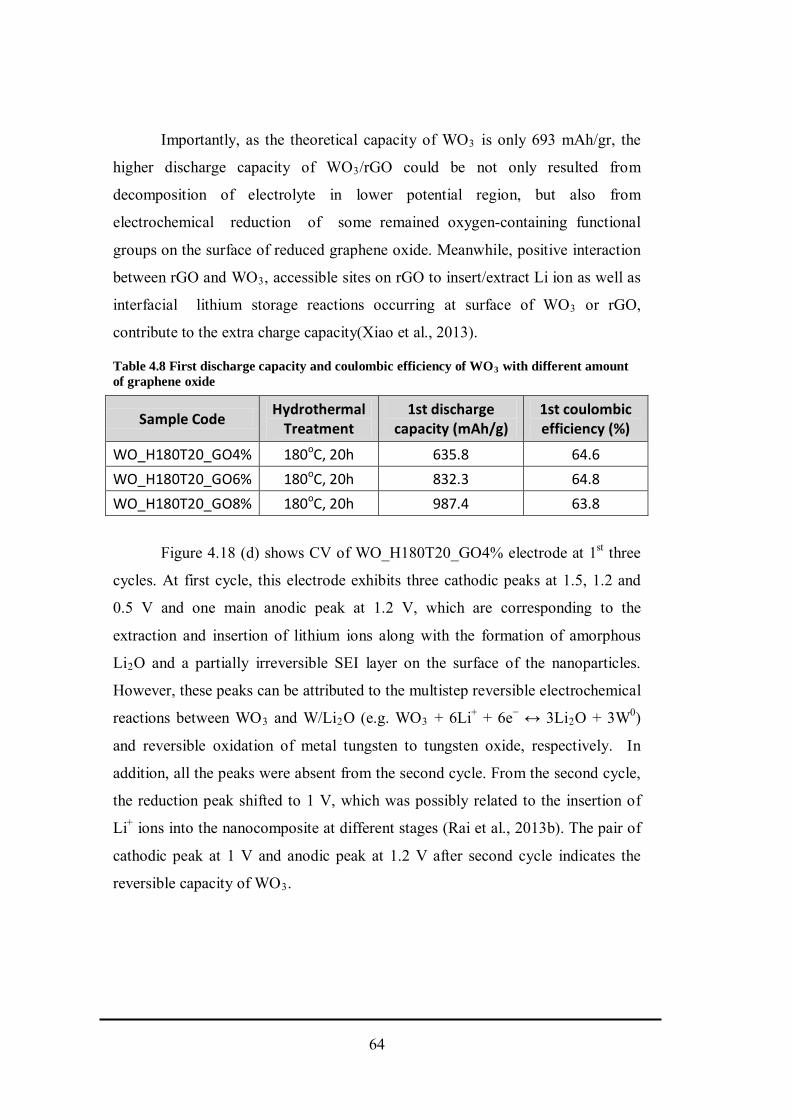
Importantly, as the theoretical capacity of WO3 is only 693 mAh/gr, the
higher discharge capacity of WO3/rGO could be not only resulted from
decomposition of electrolyte in lower potential region, but also from
electrochemical reduction of some remained oxygen-containing functional
groups on the surface of reduced graphene oxide. Meanwhile, positive interaction
between rGO and WO3, accessible sites on rGO to insert/extract Li ion as well as
interfacial lithium storage reactions occurring at surface of WO3 or rGO,
contribute to the extra charge capacity(Xiao et al., 2013).
Table 4.8 First discharge capacity and coulombic efficiency of WO3 with different amount of graphene oxide
Figure 4.18 (d) shows CV of WO_H180T20_GO4% electrode at 1st three
cycles. At first cycle, this electrode exhibits three cathodic peaks at 1.5, 1.2 and
0.5 V and one main anodic peak at 1.2 V, which are corresponding to the
extraction and insertion of lithium ions along with the formation of amorphous
Li2O and a partially irreversible SEI layer on the surface of the nanoparticles.
However, these peaks can be attributed to the multistep reversible electrochemical
reactions between WO3 and W/Li2O (e.g. WO3 + 6Li+ + 6e− ↔ 3Li2O + 3W0)
and reversible oxidation of metal tungsten to tungsten oxide, respectively. In
addition, all the peaks were absent from the second cycle. From the second cycle,
the reduction peak shifted to 1 V, which was possibly related to the insertion of
Li+ ions into the nanocomposite at different stages (Rai et al., 2013b). The pair of
cathodic peak at 1 V and anodic peak at 1.2 V after second cycle indicates the
reversible capacity of WO3.
Sample Code Hydrothermal Treatment
1st discharge capacity (mAh/g)
1st coulombic efficiency (%)
WO_H180T20_GO4% 180oC, 20h 635.8 64.6 WO_H180T20_GO6% 180oC, 20h 832.3 64.8 WO_H180T20_GO8% 180oC, 20h 987.4 63.8
64
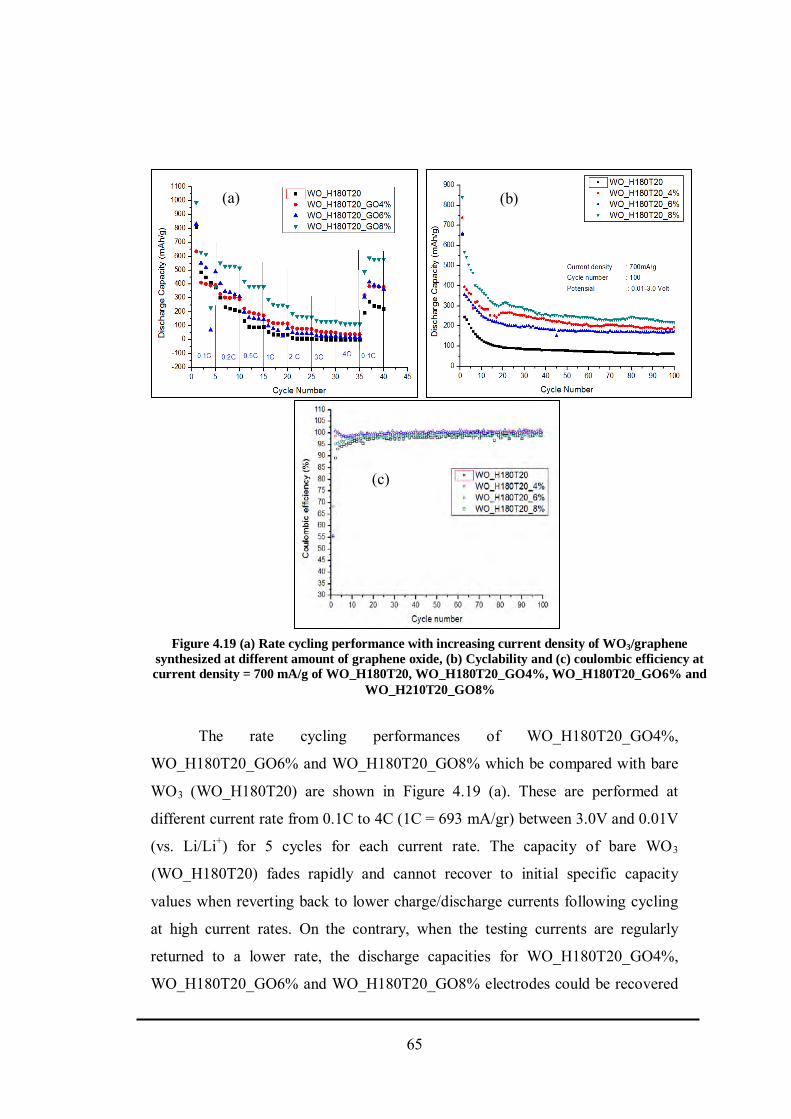
The rate cycling performances of WO_H180T20_GO4%,
WO_H180T20_GO6% and WO_H180T20_GO8% which be compared with bare
WO3 (WO_H180T20) are shown in Figure 4.19 (a). These are performed at
different current rate from 0.1C to 4C (1C = 693 mA/gr) between 3.0V and 0.01V
(vs. Li/Li+) for 5 cycles for each current rate. The capacity of bare WO3
(WO_H180T20) fades rapidly and cannot recover to initial specific capacity
values when reverting back to lower charge/discharge currents following cycling
at high current rates. On the contrary, when the testing currents are regularly
returned to a lower rate, the discharge capacities for WO_H180T20_GO4%,
WO_H180T20_GO6% and WO_H180T20_GO8% electrodes could be recovered
Figure 4.19 (a) Rate cycling performance with increasing current density of WO3/graphene synthesized at different amount of graphene oxide, (b) Cyclability and (c) coulombic efficiency at current density = 700 mA/g of WO_H180T20, WO_H180T20_GO4%, WO_H180T20_GO6% and
WO_H210T20_GO8%
(a) (b)
(c)
65
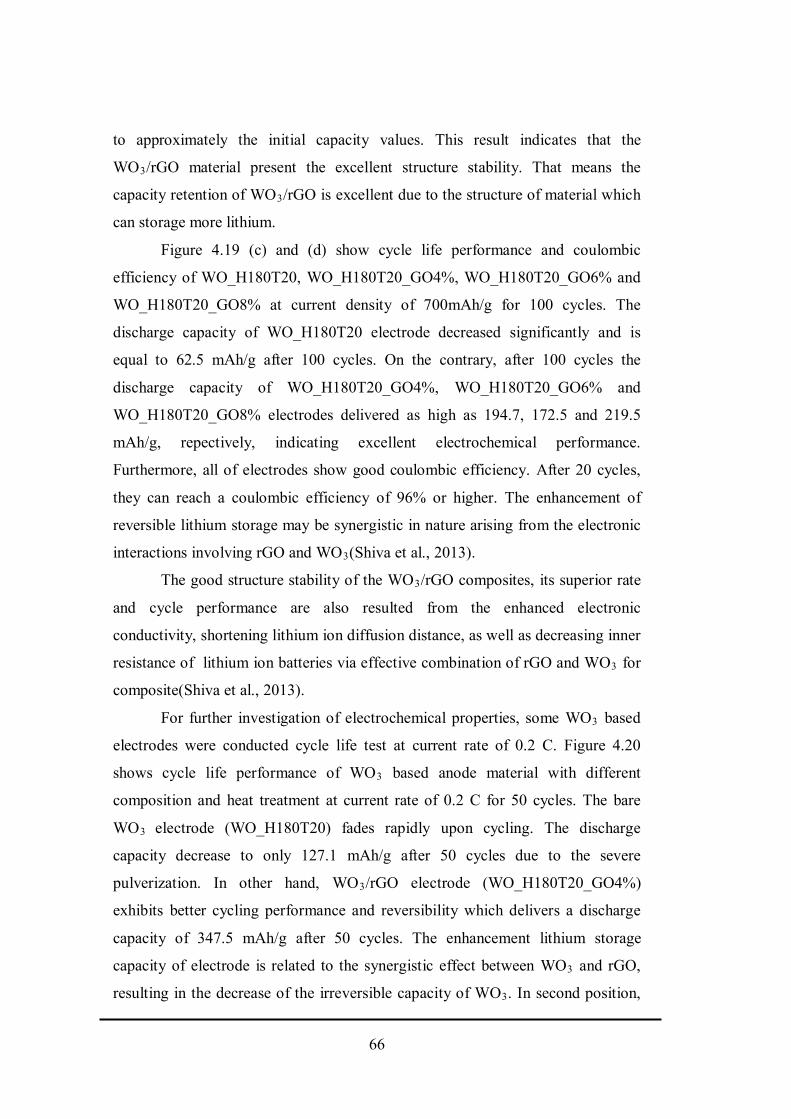
to approximately the initial capacity values. This result indicates that the
WO3/rGO material present the excellent structure stability. That means the
capacity retention of WO3/rGO is excellent due to the structure of material which
can storage more lithium.
Figure 4.19 (c) and (d) show cycle life performance and coulombic
efficiency of WO_H180T20, WO_H180T20_GO4%, WO_H180T20_GO6% and
WO_H180T20_GO8% at current density of 700mAh/g for 100 cycles. The
discharge capacity of WO_H180T20 electrode decreased significantly and is
equal to 62.5 mAh/g after 100 cycles. On the contrary, after 100 cycles the
discharge capacity of WO_H180T20_GO4%, WO_H180T20_GO6% and
WO_H180T20_GO8% electrodes delivered as high as 194.7, 172.5 and 219.5
mAh/g, repectively, indicating excellent electrochemical performance.
Furthermore, all of electrodes show good coulombic efficiency. After 20 cycles,
they can reach a coulombic efficiency of 96% or higher. The enhancement of
reversible lithium storage may be synergistic in nature arising from the electronic
interactions involving rGO and WO3(Shiva et al., 2013).
The good structure stability of the WO3/rGO composites, its superior rate
and cycle performance are also resulted from the enhanced electronic
conductivity, shortening lithium ion diffusion distance, as well as decreasing inner
resistance of lithium ion batteries via effective combination of rGO and WO3 for
composite(Shiva et al., 2013).
For further investigation of electrochemical properties, some WO3 based
electrodes were conducted cycle life test at current rate of 0.2 C. Figure 4.20
shows cycle life performance of WO3 based anode material with different
composition and heat treatment at current rate of 0.2 C for 50 cycles. The bare
WO3 electrode (WO_H180T20) fades rapidly upon cycling. The discharge
capacity decrease to only 127.1 mAh/g after 50 cycles due to the severe
pulverization. In other hand, WO3/rGO electrode (WO_H180T20_GO4%)
exhibits better cycling performance and reversibility which delivers a discharge
capacity of 347.5 mAh/g after 50 cycles. The enhancement lithium storage
capacity of electrode is related to the synergistic effect between WO3 and rGO,
resulting in the decrease of the irreversible capacity of WO3. In second position,
66
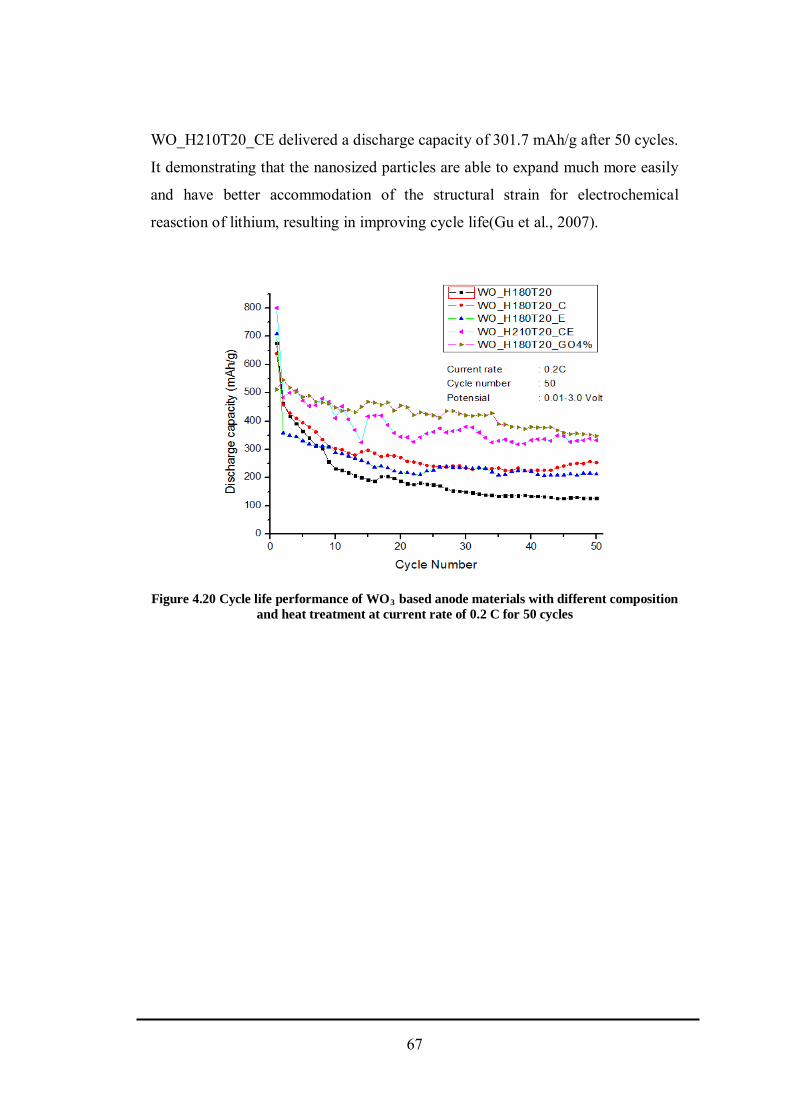
WO_H210T20_CE delivered a discharge capacity of 301.7 mAh/g after 50 cycles.
It demonstrating that the nanosized particles are able to expand much more easily
and have better accommodation of the structural strain for electrochemical
reasction of lithium, resulting in improving cycle life(Gu et al., 2007).
Figure 4.20 Cycle life performance of WO3 based anode materials with different composition
and heat treatment at current rate of 0.2 C for 50 cycles
67
(This page is empty deliberately)
68
5. CHAPTER 5
CONCLUSIONS AND SUGGESTIONS
5.1 Conclusions
Hexagonal tungsten trioxide (h-WO3) with improved reversible capacity
and cyclic stability has been successfully synthesized via hydrothermal method
using different sodium salts. The morphologies of WO3 were obtained are
nanoparticle (WO_H180T20 and WO_H180T20_C) and flake like nanostructure
(WO_H180T20_E and WO_H180T20_CE). Compared to others,
WO_H180T20_CE has the best electrochemical performance owing to its good
homogeneity, high crystallinity and small grain size. It can be attributed to the
effect of NaCl and Na-EDTA. WO_H180T20_CE electrode delivers discharge
capacity of 418.50 mAh/g with a coulombic afficiency of 85.3% at the first cycle
at a current rate of 0.1 C. Furthermore, it remains 150 mAh/g after 100 cycles at a
current density of 700 mA/g.
Synthesis of WO3 via NaCl and NaEDTA assisted hydrothermal with
different temperatures have been carried out. All of samples morphologies are
flake like nanostructure. As the reaction temperature was increased, the
crystallinity of WO3 also increased. It has been found that the WO3 synthesized
at 210oC (WO_H150T20_CE) reveals the best electrochemical properties, which
obtain pure hexagonal phase, well grown, small crystalline size, high crystallinity
and high homogeinity. The discharge capacity of WO_H210T20_CE is 533.5
mAh/gr with a coulombic efficiency of 80.4% at first cycle. Furthermore,
WO_H210T20_CE has a capacity retention of 180 mAh/g after 100 cycles at
current density of 700 mA/g.
Subsequently, WO3 was synthesized by varying the molar ratio of Na-
EDTA to investigate the role of EDTA in determining the phase and crystallinity
of the product. The different EDTA molar ratio, the different morphology was
obtained. The morphologies of WO_H210T20CE0.4 and WO_H180T20_CE0.8
with NaEDTA molar ratio of 0.4 and 0.8 are nanoparticle and rod-like structure,
respectively. On the other hand, WO_H210T20CE and WO_H210T20CE1.6 with
NaEDTA molar ratio of 1 and 1.6, the nanocrystal grow up in uniform size with
69
good aggregation and ultimately form the flake like structures.
WO_H180T20_CE0.8 has the best electrochemical performances. Its electrode
delivers discharge capacity of 558.93 mAh/g with a high coulombic efficiency of
86.9%. Moreover, this electrode has capacity retention of 218.1 mAh/g after 100
cycles at a current density of 700 mA/g due to the hierarchical nanostructure and
lower surface area of WO3.
In the last part, WO3/rGO was synthesized by using hydrothermal method
at different amount of graphene oxide to enhance its electrochemical
performance. The rGO could effectively prevent the aggregation of WO3 particles
and disperse them uniformly. The first discharge of WO_H180T20_GO8% is
987.4 mAh/g with a co loumbic efficiency of 64.6% due to good attachments
between rGO and WO3. Furthermore, at a cu rrent density of 700 mA/g the
discharge capacity of WO_H180T20_GO8% electrode delivers as high as 219.5
mAh/g after 100 cycles, indicating excellent electrochemical performance. The
good structure stability of the WO3/rGO, its superior rate and cycle performance
are resulted from the enhanced electronic conductivity, shortening lithium ion
diffusion distance, as well as decreasing inner resistance of lithium ion batteries
via effective combination of rGO and WO3.
This work proved that WO3 based anode materials exhibit a h igh
reversible capacity, excellent cycling performance and remarkable rate capability
when used as anode electrode materials for lithium ion batteries.
5.2 Suggestions
There are some suggestions for the next work about synthesis WO3 based
anode materials for lithium ion battery, such as:
1. Introducing graphene into synthesis of WO3 via a NaCl and Na-EDTA
assisted hydrothermal to improve its discharge capacity and rate
capability.
2. Optimizing the amount of graphene oxide added to WO3/graphane.
70
3. Adding sulfate ion like Na2SO4 to enhance the one dimensional growth of
the final product. Na2SO4 also play important role in the formation of self
assembled nanostructures.
4. Optimizing the reaction temperature because it looks that the higher
temperature shows better performances
71

(This page is empty deliberately)
72
ENCLOSURE
A. Theoritical Capacity of Materials for Battery Anode
The theoretical capacity of a battery is the quantity of electricity involved in
the electrochemical reaction. It is denoted Q and is given by:
where x = number of moles of reaction, n = number of electrons transferred per
mole of reaction and F = Faraday's constant (96500 C/mol)
The capacity is usually given in terms of mass, not the number of moles:
where Mr = Molecular Mass. This gives the capacity in units of mili-Ampere
hours per gram (mAh/g).
Example: Calculate Theoritical capacity of WO3:
According to the following conversion reaction mechanism:
WO3 + 6Li+ + 6e- W + 3Li2O
So,
n = 6
F = 96500 C/mol
Mr = 232 gr/mol
***Theoritical capacity of WO3 Q = 6 x 96500 C/mol232 𝑔𝑔𝑔𝑔/𝑚𝑚𝑚𝑚𝑚𝑚
= 2297.62 C/gr
Because I mAh =3.6 C, so 2297.62 C/g = 638.23 mAh/gr
81
B. Current rate (Crate)
Crate is the current amount which applied in an electrode during charging or
discharging. 1 C means that for charging or discharging a sample in one hour, we
apply a positive or negative current that is equivalent to the capacity of the
material. It means that we will charge a battery to full capacity in one hour. A
battery performs best if it is charged and discharged slowly. If a battery is charged
too quickly, then it will be hindered from reaching full capacity. The reason for
this is that upon charging and discharging, there is reduction/oxidation going on
both at the anode and cathode, this means there is literally a structural transition
happening. If a battery is charged too quickly not all of the material will release
Li+ or will not undergo the proper structural transition.
In this work, the batteries were charged at 1C, so it should take one hour to
charge each battery and it should take one hour to discharge each battery.
However, we will find that the battery actually took less than one hour to charge,
and less than one hour to discharge.
Example: a WO3 electrode with loading of 10 mg=0.01 g would be charged at I C
(h-1), so the current should be applied is :
I = 0.01 x 693 mAh x 1 h-1 = 6.93 mA
82
C. Coulombic efficiciency
Coulombic efficiency is the comparison between charge capacity to
discharge capacity in the same cycle multipled by 100%. In the first cycle, an
electrode has discharge capacity of D and charge capacity of C, so its coulombic
efficiency (E) is:
E =𝐶𝐶D x 100%
Example :
WO3 electrode has discharge capacity of 600 mAh/gr with charge capacity of 400
mAh/gr in the 1st cycle, So its coulombic efficiency is:
𝐸𝐸 =400600 𝑥𝑥 100% = 66.67 %
83

(This page is empty deliberately)
84
REFERENCES ADHIKARI, R., GYAWALI, G., SEKINO, T. & WOHN LEE, S. 2014. EDTA
mediated microwave hydrothermal synthesis of WO3 hierarchical structure and its photoactivity under simulated solar light. Journal of Environmental Chemical Engineering.
BAKER, A., HODGSON, S. & EDIRISINGHE, M. 2002. Production of tungsten oxide coatings, via sol–gel processing of tungsten anion solutions. Surface and Coatings Technology, 153, 184-193.
BATHE, S. R. & PATIL, P. 2009. Electrochromic characteristics of pulsed spray pyrolyzed polycrystalline WO3 thin films. Smart Materials and structures, 18, 025004.
BECERRIL, H. A., MAO, J., LIU, Z., STOLTENBERG, R. M., BAO, Z. & CHEN, Y. 2008. Evaluation of solution-processed reduced graphene oxide films as transparent conductors. ACS nano, 2, 463-470.
BERGER, C., SONG, Z., LI, X., WU, X., BROWN, N., NAUD, C., MAYOU, D., LI, T., HASS, J. & MARCHENKOV, A. N. 2006. Electronic confinement and coherence in patterned epitaxial graphene. Science, 312, 1191-1196.
BOBLETER, O. 1994. Hydrothermal degradation of polymers derived from plants. Progress in Polymer Science, 19, 797-841.
BUDAVARI, S., O’NEIL, M., SMITH, A. & HECKELMAN, P. 1989. The merck index: an encyclopedia of chemicals, drug, and biologicals.
CAI, D., WANG, S., LIAN, P., ZHU, X., LI, D., YANG, W. & WANG, H. 2013. Superhigh capacity and rate capability of high-level nitrogen-doped graphene sheets as anode materials for lithium-ion batteries. Electrochimica Acta, 90, 492-497.
CHEN, B.-D., PENG, C.-X. & CUI, Z. 2012. Ultrasonic synthesis of CoO/graphene nanohybrids as high performance anode materials for lithium-ion batteries. Transactions of Nonferrous Metals Society of China, 22, 2517-2522.
CHEN, D., GAO, L., YASUMORI, A., KURODA, K. & SUGAHARA, Y. 2008. Size‐and Shape‐Controlled Conversion of Tungstate‐Based Inorganic–Organic Hybrid Belts to WO3 Nanoplates with High Specific Surface Areas. Small, 4, 1813-1822.
CHEN, X. & M AO, S. S. 2007. Titanium dioxide nanomaterials: synthesis, properties, modifications, and applications. Chemical reviews, 107, 2891-2959.
DE LAS CASAS, C. & LI, W. 2012. A review of application of carbon nanotubes for lithium ion battery anode material. Journal of Power Sources, 208, 74-85.
DING, Y., JIANG, Y., XU, F., YIN, J., REN, H., ZHUO, Q., LONG, Z. & ZHANG, P. 2010. Preparation of nano-structured LiFePO4/graphene composites by co-precipitation method. Electrochemistry Communications, 12, 10-13.
73
DONG, H., LIU, Y., YANG, P., WANG, W. & LIN, J. 2010. Controlled synthesis and characterization of LaPO4, LaPO4: Ce3+ and LaPO4: Ce3+, Tb3+ by EDTA assisted hydrothermal method. Solid state sciences, 12, 1652-1660.
DREYER, D. R., PARK, S., BIELAWSKI, C. W. & RUOFF, R. S. 2010. The chemistry of graphene oxide. Chemical Society Reviews, 39, 228-240.
FELIX. 2012. Investigation on Novel Sulfured-Based Additives for Solid Electrolyte Interface (SEI) Improver in High Voltage Lithium Ion Battery Application. Master, National taiwan University of Science and Technology.
FERNANDEZ-MERINO, M., GUARDIA, L., PAREDES, J., VILLAR-RODIL, S., SOLIS-FERNANDEZ, P., MARTINEZ-ALONSO, A. & TASCON, J. 2010. Vitamin C is an ideal substitute for hydrazine in the reduction of graphene oxide suspensions. The Journal of Physical Chemistry C, 114, 6426-6432.
GARROTE, G., DOMINGUEZ, H. & PARAJO, J. 1999. Hydrothermal processing of lignocellulosic materials. European Journal of Wood and Wood Products, 57, 191-202.
GEIM, A. K. & NOVOSELOV, K. S. 2007. The rise of graphene. Nature materials, 6, 183-191.
GORIPARTI, S., MIELE, E., DE ANGELIS, F., DI FABRIZIO, E., PROIETTI ZACCARIA, R. & CAPIGLIA, C. 2014. Review on recent progress of nanostructured anode materials for Li-ion batteries. Journal of Power Sources.
GU, Z., LI, H., ZHAI, T., YANG, W., XIA, Y., MA, Y. & YAO, J. 2007. Large-scale synthesis of single-crystal hexagonal tungsten trioxide nanowires and electrochemical lithium intercalation into the nanocrystals. Journal of Solid State Chemistry, 180, 98-105.
GU, Z., MA, Y., YANG, W., ZHANG, G. & YAO, J. 2005. Self-assembly of highly oriented one-dimensional h-WO3 nanostructures. Chemical communications, 3597-3599.
HA, J.-H., MURALIDHARAN, P. & KIM, D. K. 2009. Hydrothermal synthesis and characterization of self-assembled h-WO3 nanowires/nanorods using EDTA salts. Journal of Alloys and Compounds, 475, 446-451.
HAM, D. J., PHURUANGRAT, A., THONGTEM, S. & LEE, J. S. 2010. Hydrothermal synthesis of monoclinic WO3 nanoplates and nanorods used as an electrocatalyst for hydrogen evolution reactions from water. Chemical Engineering Journal, 165, 365-369.
HARI KRISHNA, R., NAGABHUSHANA, B. M., NAGABHUSHANA, H., CHAKRADHAR, R. P. S., SIVARAMAKRISHNA, R., SHIVAKUMARA, C. & THOMAS, T. 2014. Auto-ignition based synthesis of Y2O3 for photo- and thermo-luminescent applications. Journal of Alloys and Compounds, 585, 129-137.
HARIHARAN, V., PARTHIBAVARMAN, M. & SEKAR, C. 2011. Synthesis of tungsten oxide (W18O49) nanosheets utilizing EDTA salt by microwave irradiation method. Journal of Alloys and Compounds, 509, 4788-4792.
74
HEINDORFF, K., AURICH, O., MICHAELIS, A. & RIEGER, R. 1983. Genetic toxicology of ethylenediaminetetraacetic acid (EDTA). Mutation Research, 115, 149-173.
HU, Y., LI, X., GENG, D., CAI, M., LI, R. & SUN, X. 2013. Influence of paper thickness on the electrochemical performances of graphene papers as an anode for lithium ion batteries. Electrochimica Acta, 91, 227-233.
HUANG, R., SHEN, Y., ZHAO, L. & YAN, M. 2012. Effect of hydrothermal temperature on structure and photochromic properties of WO3 powder. Advanced Powder Technology, 23, 211-214.
HUIRACHE-ACUÑA, R., PARAGUAY-DELGADO, F., ALBITER, M., LARA-ROMERO, J. & MARTÍNEZ-SÁNCHEZ, R. 2009. Synthesis and characterization of WO3 nanostructures prepared by an aged-hydrothermal method. Materials characterization, 60, 932-937.
HUMMERS, W. S. & OFFEMAN, R. E. 1958. Preparation of Graphitic Oxide. Journal of the American Chemical Society, 80, 1339-1339.
INFOPLEASE. 2014. Sodium chloride [Online]. Available: http://www.infoplease.com/encyclopedia/science/sodium-chloride-properties.html [Accessed June 11st 2014 2014].
JOHN M. HILLS, R. H. R., FRANK OSBORNE WOOD 2014. Salt (NaCl). KOSTICK, D. S. 2014. Sodium chloride [Online]. Wikipedia. Available:
http://en.wikipedia.org/wiki/Sodium_chloride [Accessed June 11st 2014 2014].
KUCINSKIS, G., BAJARS, G. & KLEPERIS, J. 2013. Graphene in lithium ion battery cathode materials: A review. Journal of Power Sources, 240, 66-79.
LANIGAN, R. S., YAMARIK, T. A. & ANDERSEN, F. A. 2002. Final report on the safety assessment of EDTA, calcium disodium EDTA, diammonium EDTA, dipotassium EDTA, disodium EDTA, TEA-EDTA, tetrasodium EDTA, tripotassium EDTA, trisodium EDTA, HEDTA, and trisodium HEDTA. International Journal of Toxicology, 21, 95-142.
LARCHER, D., BEATTIE, S., MORCRETTE, M., EDSTROEM, K., JUMAS, J.-C. & TARASCON, J.-M. 2007. Recent findings and prospects in the field of pure metals as negative electrodes for Li-ion batteries. Journal of Materials Chemistry, 17, 3759-3772.
LEE, C.-K., WANG, C.-C., LYU, M.-D., JUANG, L.-C., LIU, S.-S. & HUNG, S.-H. 2007. Effects of sodium content and calcination temperature on the morphology, structure and photocatalytic activity of nanotubular titanates. Journal of colloid and interface science, 316, 562-569.
LEE, W.-K., CHA, S.-H., KIM, K.-H., KIM, B.-W. & LEE, J.-C. 2009. Shape-controlled synthesis of gold icosahedra and nanoplates using Pluronic P123 block copolymer and sodium chloride. Journal of Solid State Chemistry, 182, 3243-3248.
LERF, A., HE, H., FORSTER, M. & KLINOWSKI, J. 1998. Structure of graphite oxide revisited. The Journal of Physical Chemistry B, 102, 4477-4482.
LI, D., MÜLLER, M. B., GILJE, S., KANER, R. B. & WALLACE, G. G. 2008. Processable aqueous dispersions of graphene nanosheets. Nature nanotechnology, 3, 101-105.
75
LI, W.-J. & FU, Z.-W. 2010. Nanostructured WO3 thin film as a new anode material for lithium-ion batteries. Applied Surface Science, 256, 2447-2452.
LI, X., ZHANG, G., CHENG, F., GUO, B. & CHEN, J. 2006. Synthesis, characterization, and gas-sensor application of WO3 nanocuboids. Journal of The Electrochemical Society, 153, H133-H137.
LIDE, D. R. 2004. CRC handbook of chemistry and physics, CRC press. LIU, B. & AYDIL, E. S. 2009. Growth of oriented single-crystalline rutile TiO2
nanorods on transparent conducting substrates for dye-sensitized solar cells. Journal of the American Chemical Society, 131, 3985-3990.
LIU, Y., KANG, Z., CHEN, Z., SHAFIQ, I., ZAPIEN, J., BELLO, I., ZHANG, W. & LEE, S. 2009. Synthesis, characterization, and photocatalytic application of different ZnO nanostructures in array configurations. Crystal Growth and Design, 9, 3222-3227.
LONGER, M., ROBINSON, J. & GENNARO, A. 1990. Remington's Pharmaceutical Sciences. by Gennaro AR, Mack Publishing Company, Easton, PA, 1687.
LUO, F., JIA, C.-J., SONG, W., YOU, L.-P. & YAN, C.-H. 2005. Chelating ligand-mediated crystal growth of cerium orthovanadate. Crystal growth & design, 5, 137-142.
MARCANO, D. C., KOSYNKIN, D. V., BERLIN, J. M., SINITSKII, A., SUN, Z., SLESAREV, A., ALEMANY, L. B., LU, W. & TOUR, J. M. 2010. Improved synthesis of graphene oxide. ACS nano, 4, 4806-4814.
MCALLISTER, M. J., LI, J.-L., ADAMSON, D. H., SCHNIEPP, H. C., ABDALA, A. A., LIU, J., HERRERA-ALONSO, M., MILIUS, D. L., CAR, R. & PRUD'HOMME, R. K. 2007. Single sheet functionalized graphene by oxidation and thermal expansion of graphite. Chemistry of Materials, 19, 4396-4404.
MUNSHI, M. Z. A. 1995. Handbook of Solid State Batteries & Capacitors, World Scientific.
NOVOSELOV, K. S., GEIM, A. K., MOROZOV, S., JIANG, D., ZHANG, Y., DUBONOS, S., GRIGORIEVA, I. & FIRSOV, A. 2004. Electric field effect in atomically thin carbon films. science, 306, 666-669.
OBROVAC, M. & CHRISTENSEN, L. 2004. Structural changes in silicon anodes during lithium insertion/extraction. Electrochemical and Solid-State Letters, 7, A93-A96.
OHZUKU, T. & BRODD, R. J. 2007. An overview of positive-electrode materials for advanced lithium-ion batteries. Journal of Power Sources, 174, 449-456.
PEI, S. & CHENG, H.-M. 2012. The reduction of graphene oxide. Carbon, 50, 3210-3228.
PETERSON, A. A., VOGEL, F., LACHANCE, R. P., FRÖLING, M., ANTAL JR, M. J. & TESTER, J. W. 2008. Thermochemical biofuel production in hydrothermal media: a review of sub-and supercritical water technologies. Energy & Environmental Science, 1, 32-65.
76
POIZOT, P., LARUELLE, S., GRUGEON, S., DUPONT, L. & TARASCON, J. 2000. Nano-sized transition-metal oxides as negative-electrode materials for lithium-ion batteries. Nature, 407, 496-499.
RAI, A. K., GIM, J., ANH, L. T. & KIM, J. 2013a. Partially reduced Co3O4/graphene nanocomposite as an anode material for secondary lithium ion battery. Electrochimica Acta, 100, 63-71.
RAI, A. K., GIM, J., ANH, L. T. & KIM, J. 2013b. Partially reduced Co3O4/graphene nanocomposite as an anode material for secondary lithium ion battery. Electrochimica Acta, 100, 63-71.
RAI, A. K., GIM, J., SONG, J., MATHEW, V., ANH, L. T. & KIM, J. 2012. Electrochemical and safety characteristics of TiP2O7–graphene nanocomposite anode for rechargeable lithium-ion batteries. Electrochimica Acta, 75, 247-253.
RAO, F., ZHOU, Y., LI, T. & WANG, Y. 2009. Synthesis of radially aligned single-walled carbon nanotubes on a SiO2/Si substrate by introducing sodium chloride. Carbon, 47, 2548-2552.
ROMANÍ, A., GARROTE, G., ALONSO, J. L. & PARAJÓ, J. C. 2010. Bioethanol production from hydrothermally pretreated Eucalyptus globuluswood. Bioresource technology, 101, 8706-8712.
SAQUY, P. C., MAIA CAMPOS, G., SOUSA NETO, M. D., GUIMARÃES, L. F. & PÉCORA, J. D. 1994. Evaluation of chelating action of EDTA in association with Dakin's solution. Brazilian dental journal, 5, 65-70.
SARON, K. & HASHIM, M. 2013. Broad visible emission from GaN nanowires grown on n-Si (111) substrate by PVD for solar cell application. Superlattices and Microstructures, 56, 55-63.
SASIDHARAN, M., GUNAWARDHANA, N., YOSHIO, M. & NAKASHIMA, K. 2012. WO3hollow nanospheres for high-lithium storage capacity and good cyclability. Nano Energy, 1, 503-508.
SAYıLKAN, F., ERDEMOĞLU, S., ASILTÜRK, M., AKARSU, M., ŞENER, Ş., SAYıLKAN, H., ERDEMOĞLU, M. & ARPAÇ, E. 2006. Photocatalytic performance of pure anatase nanocrystallite TiO2 synthesized under low temperature hydrothermal conditions. Materials research bulletin, 41, 2276-2285.
SCHNIEPP, H. C., LI, J.-L., MCALLISTER, M. J., SAI, H., HERRERA-ALONSO, M., ADAMSON, D. H., PRUD'HOMME, R. K., CAR, R., SAVILLE, D. A. & AKSAY, I. A. 2006. Functionalized single graphene sheets derived from splitting graphite oxide. The Journal of Physical Chemistry B, 110, 8535-8539.
SCHULTZ, B. J., PATRIDGE, C. J., LEE, V., JAYE, C., LYSAGHT, P. S., SMITH, C., BARNETT, J., FISCHER, D. A., PRENDERGAST, D. & BANERJEE, S. 2011. Imaging local electronic corrugations and doped regions in graphene. Nature communications, 2, 372.
SHIN, H. J., KIM, K. K., BENAYAD, A., YOON, S. M., PARK, H. K., JUNG, I. S., JIN, M. H., JEONG, H. K., KIM, J. M. & CHOI, J. Y. 2009. Efficient reduction of graphite oxide by sodium borohydride and its effect on electrical conductance. Advanced Functional Materials, 19, 1987-1992.
77
SHIVA, K., RAMAKRISHNA MATTE, H., RAJENDRA, H., BHATTACHARYYA, A. J. & RAO, C. 2013. Employing synergistic interactions between few-layer WS2 and reduced graphene oxide to improve lithium storage, cyclability and rate capability of Li-ion batteries. Nano Energy, 2, 787-793.
SHUKLA, A. & PREM KUMAR, T. 2013. Nanostructured electrode materials for electrochemical energy storage and conversion. Wiley Interdisciplinary Reviews: Energy and Environment, 2, 14-30.
SICILIANO, T., TEPORE, A., MICOCCI, G., SERRA, A., MANNO, D. & FILIPPO, E. 2008. WO3 gas sensors prepared by thermal oxidization of tungsten. Sensors and Actuators B: Chemical, 133, 321-326.
SONG, P., ZHANG, X., SUN, M., CUI, X. & LIN, Y. 2012. Graphene oxide modified TiO2 nanotube arrays: enhanced visible light photoelectrochemical properties. Nanoscale, 4, 1800-1804.
SUPOTHINA, S., SEEHARAJ, P., YORIYA, S. & SRIYUDTHSAK, M. 2007. Synthesis of tungsten oxide nanoparticles by acid precipitation method. Ceramics International, 33, 931-936.
TAO, H.-C., FAN, L.-Z., YAN, X. & QU, X. 2012. In situ synthesis of TiO2–graphene nanosheets composites as anode materials for high-power lithium ion batteries. Electrochimica Acta, 69, 328-333.
ULLMANN, F. & ELVERS, B. 1991. Encyclopedia of industrial chemistry, VCH.
VAYSSIERES, L., CHANÉAC, C., TRONC, E. & JOLIVET, J. P. 1998. Size tailoring of magnetite particles formed by aqueous precipitation: An example of thermodynamic stability of nanometric oxide particles. Journal of colloid and interface science, 205, 205-212.
WANG, J., XU, Y., HOJAMBERDIEV, M., PENG, J. & ZHU, G. 2009. Na2EDTA-assisted hydrothermal synthesis and luminescent properties of YVO4: Eu3+ with different morphologies in a wide pH range. Materials science & engineering. B, Solid-state materials for advanced technology, 156, 42-47.
WANG, X., LI, B., LIU, D. & XIONG, H. 2014. ZnWO4 nanocrystals/reduced graphene oxide hybrids: Synthesis and their application for Li ion batteries. Science China Chemistry, 57, 122-126.
WINTTERLIN, J. & BOCQUET, M.-L. 2009. Graphene on metal surfaces. Surface Science, 603, 1841-1852.
WOLCOTT, A., KUYKENDALL, T. R., CHEN, W., CHEN, S. & ZHANG, J. Z. 2006. Synthesis and characterization of ultrathin WO3 nanodisks utilizing long-chain poly (ethylene glycol). The Journal of Physical Chemistry B, 110, 25288-25296.
XIAO, W., WANG, Z., GUO, H., LI, X., WANG, J., HUANG, S. & GAN, L. 2013. Fe2O3 particles enwrapped by graphene with excellent cyclability and rate capability as anode materials for lithium ion batteries. Applied Surface Science, 266, 148-154.
XU, R. & ZENG, H. C. 2003. Mechanistic investigation on salt-mediated formation of free-standing Co3O4 nanocubes at 95oC. The Journal of Physical Chemistry B, 107, 926-930.
78
XU, Z., KANG, X., LI, C., HOU, Z., ZHANG, C., YANG, D., LI, G. & LIN, J. 2010. Ln3+ (Ln= Eu, Dy, Sm, and Er) ion-doped YVO4 nano/microcrystals with multiform morphologies: Hydrothermal synthesis, growing mechanism, and luminescent properties. Inorganic chemistry, 49, 6706-6715.
YANG, H., SONG, T., LEE, S., HAN, H., XIA, F., DEVADOSS, A., SIGMUND, W. & PAIK, U. 2013a. Tin indium oxide/graphene nanosheet nanocomposite as an anode material for lithium ion batteries with enhanced lithium storage capacity and rate capability. Electrochimica Acta, 91, 275-281.
YANG, Q., LU, Z., LIU, J., LEI, X., CHANG, Z., LUO, L. & SUN, X. 2013b. Metal oxide and hydroxide nanoarrays: Hydrothermal synthesis and applications as supercapacitors and nanocatalysts. Progress in Natural Science: Materials International, 23, 351-366.
YANG, X., ZHOU, L., CHEN, C. & XU, J. 2010. Synthesis of Zr-MCM-41 by the assistance of sodium chloride in the self-generated acid conditions. Materials Chemistry and Physics, 120, 42-45.
YIN, J., CAO, H., ZHANG, J., QU, M. & ZHOU, Z. 2012. Synthesis and Applications of γ-Tungsten Oxide Hierarchical Nanostructures. Crystal Growth & Design, 13, 759-769.
YOON, S., JO, C., NOH, S. Y., LEE, C. W., SONG, J. H. & LEE, J. 2011. Development of a high-performance anode for lithium ion batteries using novel ordered mesoporous tungsten oxide materials with high electrical conductivity. Physical Chemistry Chemical Physics, 13, 11060-11066.
YU, M., SUN, H., SUN, X., LU, F., HU, T., WANG, G., QIU, H. & LIAN, J. 2013. 3D WO3 nanowires/graphene nanocomposite with improved reversible capacity and cyclic stability for lithium ion batteries. Materials Letters, 108, 29-32.
ZHENG, F., ZHANG, M. & GUO, M. 2013. Controllable preparation of WO3 nanorod arrays by hydrothermal method. Thin Solid Films, 534, 45-53.
79

(This page is empty deliberately)
80
BIOGRAPHY
Augus Tino Tri Widyantoro obtained his B.Sc. in Materials and Metallurgical Engineering from Sepuluh Nopember Institute of Technology in Indonesia (ITS Surabaya) at 2013, under the supervision of Diah Susanti, Ph.D, with a thesis on “The Effect of Calcination Temperature on the Morphology and Electrochemical Properties of WO3 as Electrode Materials for Pseudocapacitor”.
Currently, He is completing his Dual Master Degree in Materials Science and Engineering, National
Taiwan University of Science and Technology (NTUST) and Materials and Metallurgical Engineering, ITS under the supervision of Professor Chen-Hao Wang, Prof. Bing-Joe Hwang, Dr. Ming-Yao Cheng and Diah Susanti Ph. D, with a thesis addressed to the preparation and characterization of WO3 as anode material for lithium ion battery.
85