sistem informasi sumberdaya lahan ptt...
TRANSCRIPT
PENDAHULUAN
SISTEM INFORMASI SUMBERDAYA LAHANPTT 102003
SudartoLaboratorium Pedologi dan Sistem Informasi Sumberdaya LahanJurusan Tanah, Fakultas Pertanian Universitas Brawijaya
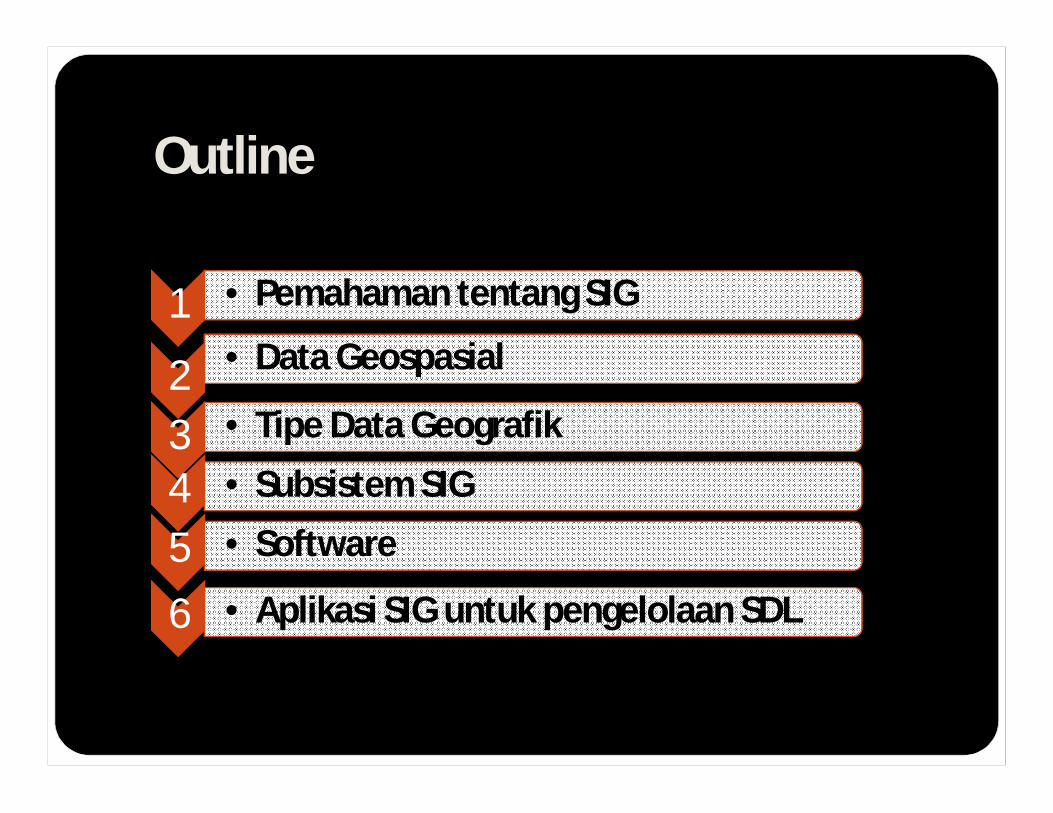
Outline
1 • Pemahaman tentang SIG
2 • Data Geospasial
3 • Tipe Data Geografik
4 • Subsistem SIG
5 • Software
6 • Aplikasi SIG untuk pengelolaan SDL

What is GIS?
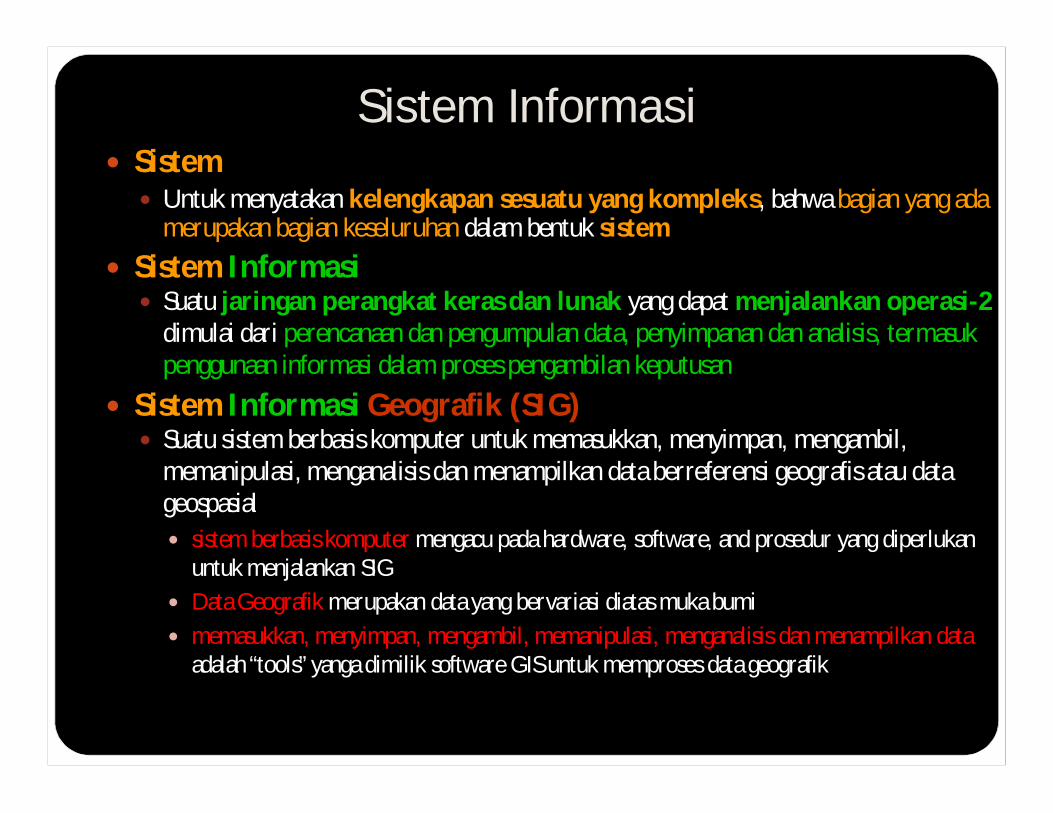
Sistem Informasi Sistem
Untuk menyatakan kelengkapan sesuatu yang kompleks, bahwa bagian yang ada merupakan bagian keseluruhan dalam bentuk sistem
Sistem Informasi Suatu jaringan perangkat keras dan lunak yang dapat menjalankan operasi-2
dimulai dari perencanaan dan pengumpulan data, penyimpanan dan analisis, termasuk penggunaan informasi dalam proses pengambilan keputusan
Sistem Informasi Geografik (SIG) Suatu sistem berbasis komputer untuk memasukkan, menyimpan, mengambil,
memanipulasi, menganalisis dan menampilkan data berreferensi geografis atau data geospasial sistem berbasis komputer mengacu pada hardware, software, and prosedur yang diperlukan
untuk menjalankan SIG Data Geografik merupakan data yang bervariasi diatas muka bumi memasukkan, menyimpan, mengambil, memanipulasi, menganalisis dan menampilkan data
adalah “tools” yanga dimilik software GIS untuk memproses data geografik

Sistem Informasi Sumberdaya Lahan sistem informasi yang digunakan untuk memasukkan, menyimpan,
mengambil, memanipulasi, menganalisis dan menampilkan data berreferensi geografis atau data geospasial, untuk mendukung pengambilan keputusan untuk perencanaan dan pengelolaan penggunaan lahan, sumber daya alam, lingkungan, transportasi, perkotaan fasilitas, dan catatan administratif lainnya.
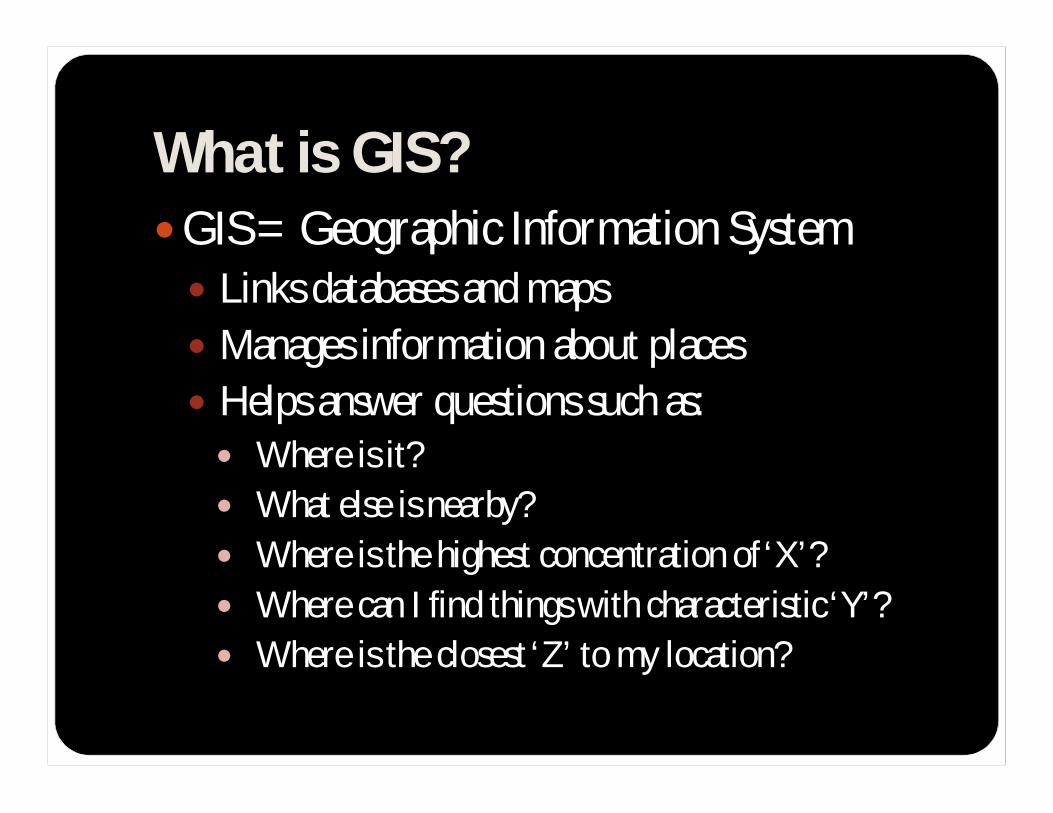
What is GIS?GIS = Geographic Information System Links databases and maps Manages information about places Helps answer questions such as: Where is it? What else is nearby? Where is the highest concentration of ‘X’? Where can I find things with characteristic ‘Y’? Where is the closest ‘Z’ to my location?
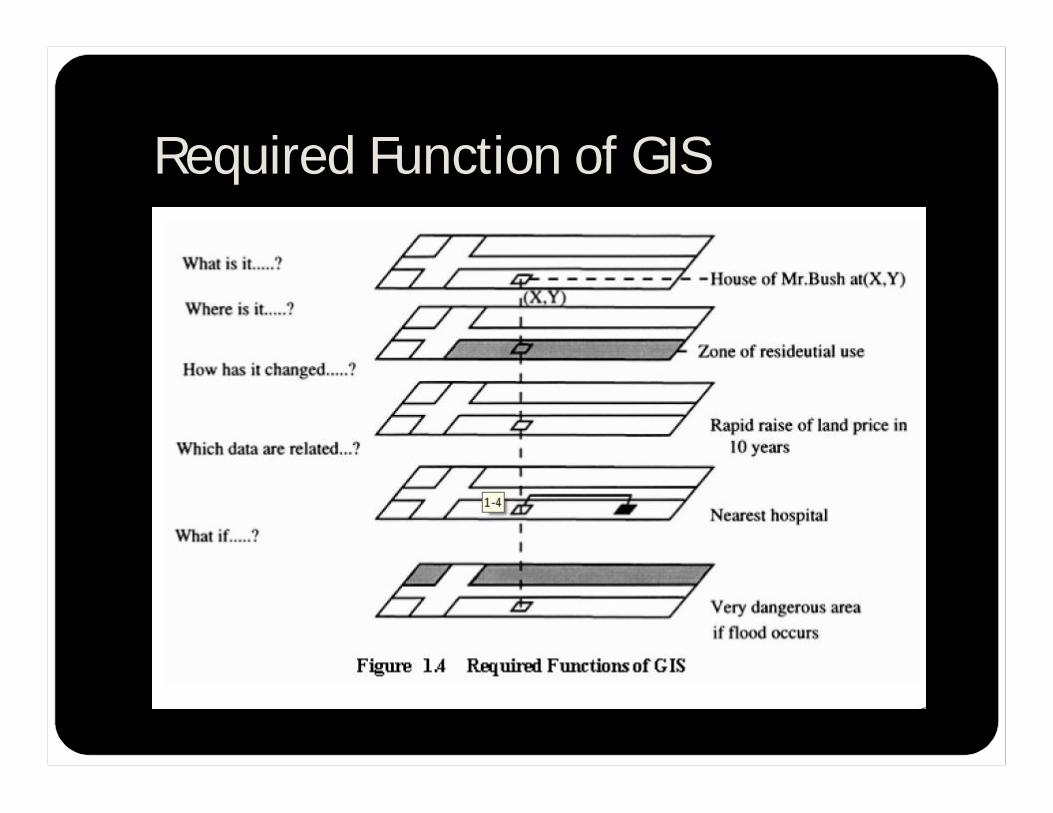
Required Function of GIS
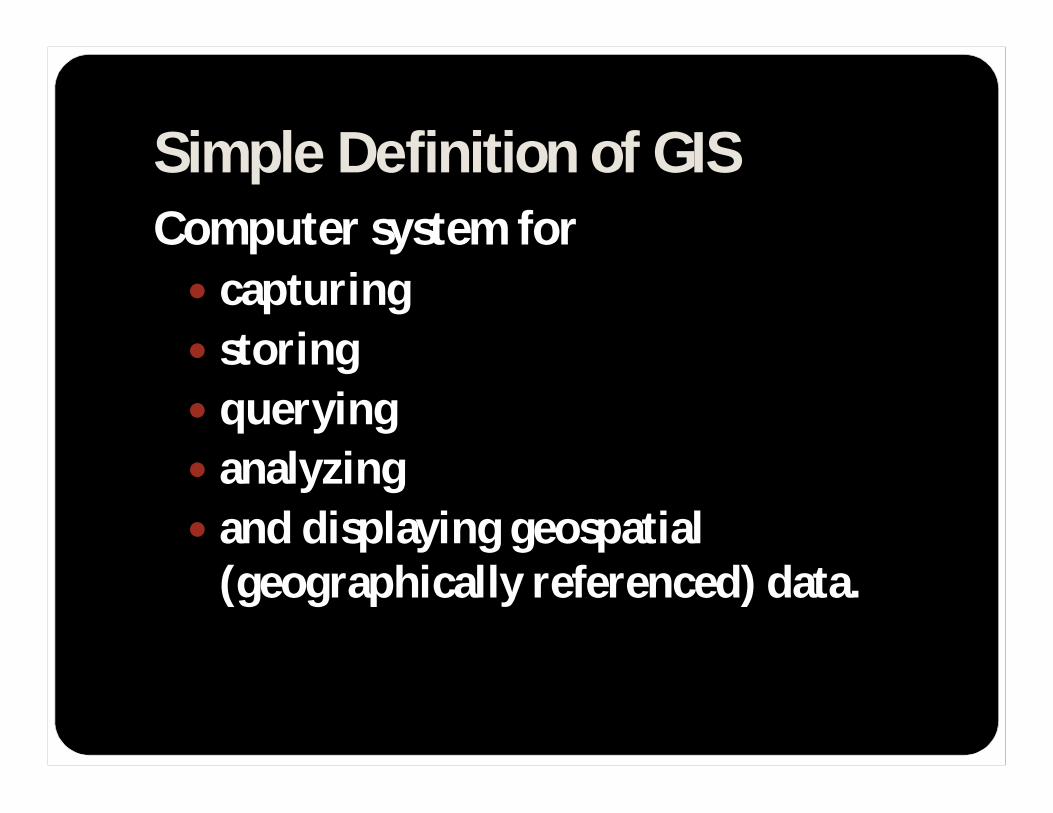
Simple Definition of GIS Computer system for capturing storing querying analyzing and displaying geospatial
(geographically referenced) data.

Aplikasi SIG

Over 7,000 universities worldwide teach GIS GIS used in multiple disciplines:
Agriculture ArchaeologyArchitecture/LanscapeArch. BusinessComputer Science Environmental Science Engineering GeographyGeology MeteorologyJournalism Law EnforcementMilitary Science ManagementNatural Resource OceanographyPublic Health HistorySociology Urban/Regional Planning
GIS in Education
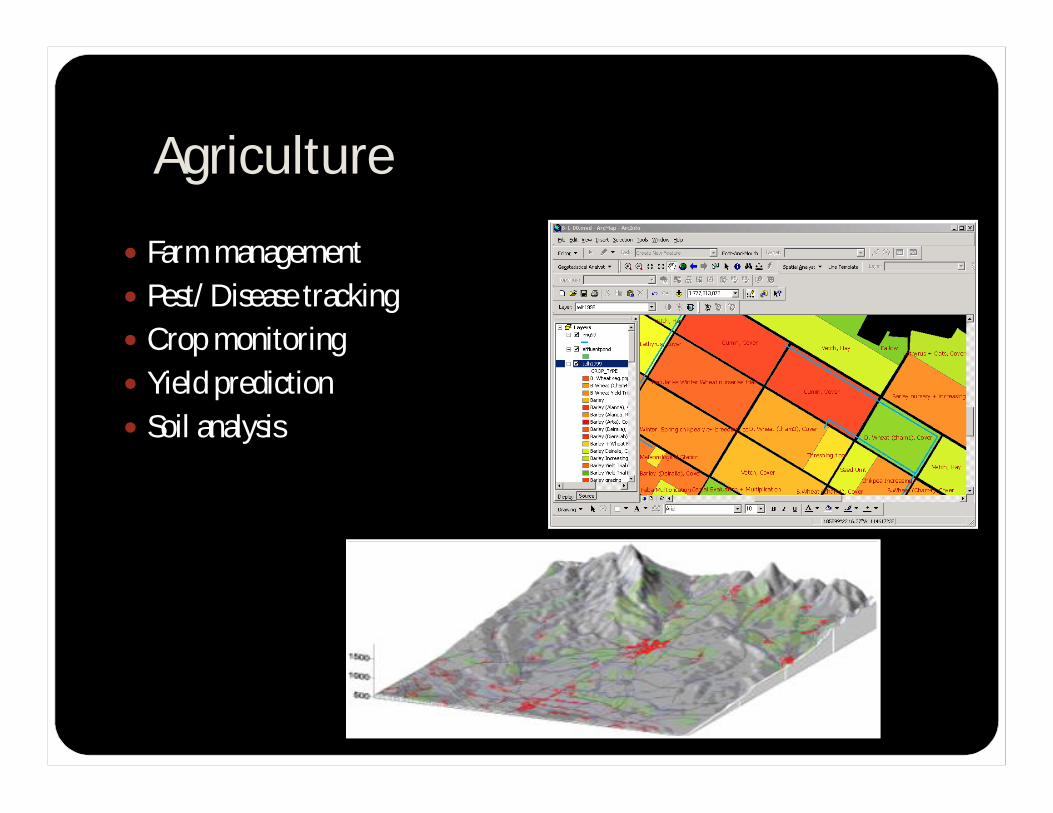
Agriculture
Farm management Pest/Disease tracking Crop monitoring Yield prediction Soil analysis
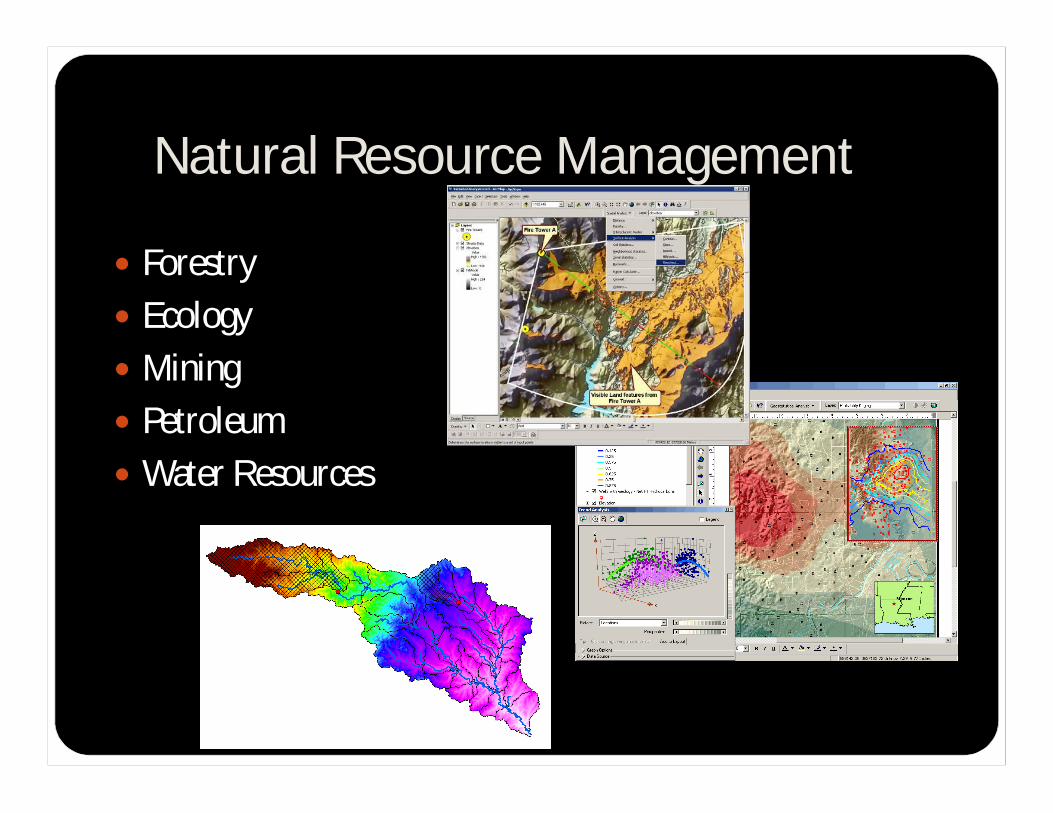
Natural Resource Management
Forestry Ecology Mining Petroleum Water Resources
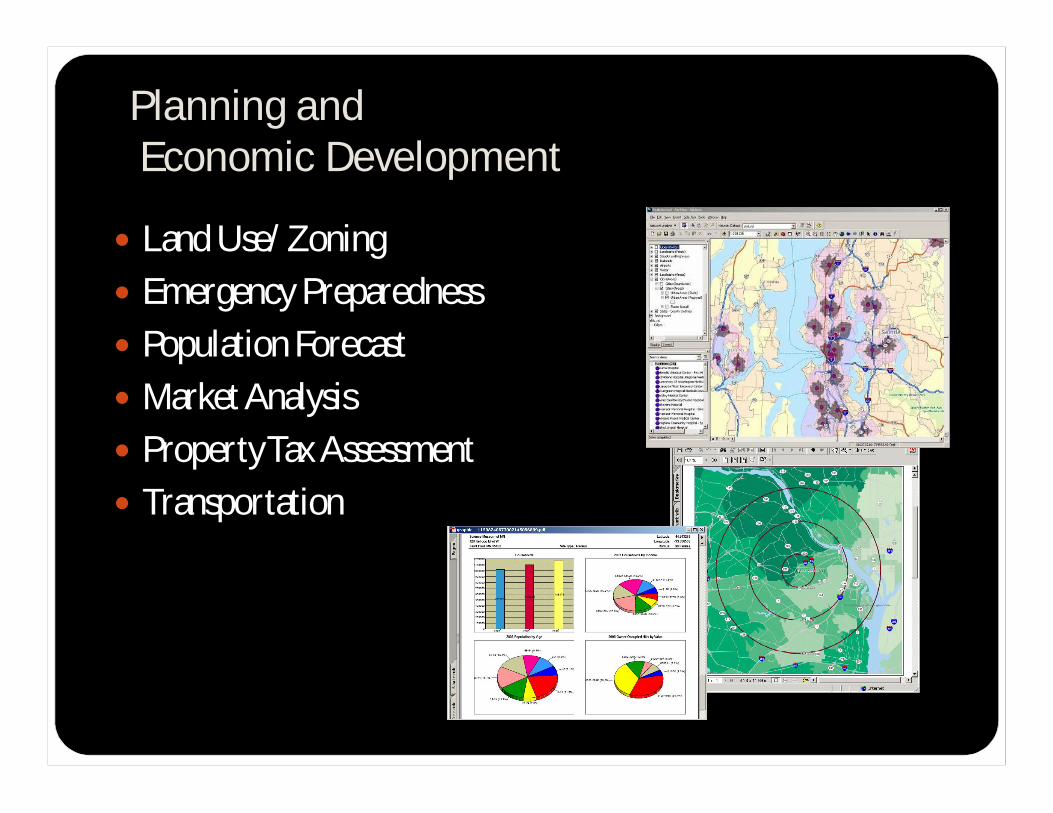
Planning andEconomic Development
Land Use/Zoning Emergency Preparedness Population Forecast Market Analysis Property Tax Assessment Transportation

GIS: A Framework for Understanding and Managing Our Earth
Holistic
Comprehensive
Systematic
Analytic
Visual
CreatingMeasuringOrganizingAnalyzingModeling
ApplyingPlanningManagingActing
Geographic Knowledge
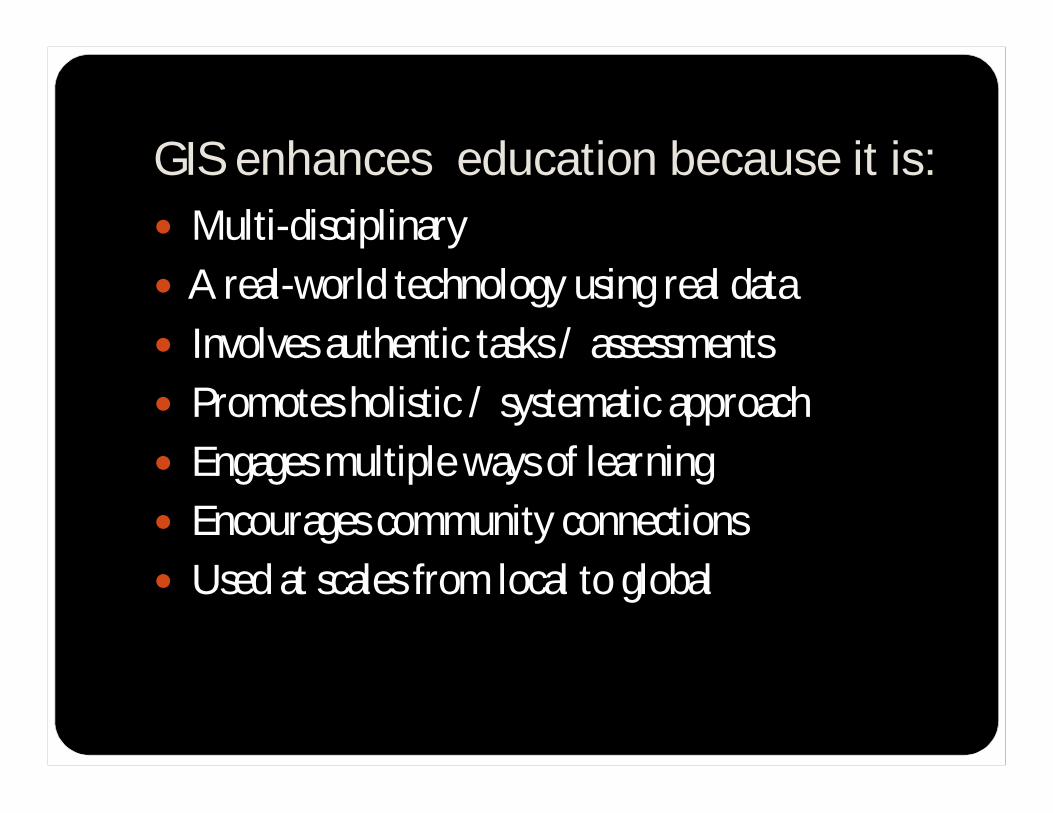
GIS enhances education because it is: Multi-disciplinary A real-world technology using real data Involves authentic tasks / assessments Promotes holistic / systematic approach Engages multiple ways of learning Encourages community connections Used at scales from local to global

Geography matters
Today’s challenges require geographic approach Climate Change Urban Growth Sustainable Agriculture Water Quality and Availability International and National Security Energy Epidemiology/Disease Tracking Natural Hazards: Seismicity, Weather Events

GIS as infrastructure
Virtual GlobesArcGIS ExplorerGoogle EarthVirtual Earth
Desktop GISArcInfoArcEditorArcViewArcReader
Server GISArcGIS ServerPortal Toolkit
Mobile GISPC, PDAPhone
Network
DBMSFiles XMLGeodatabases
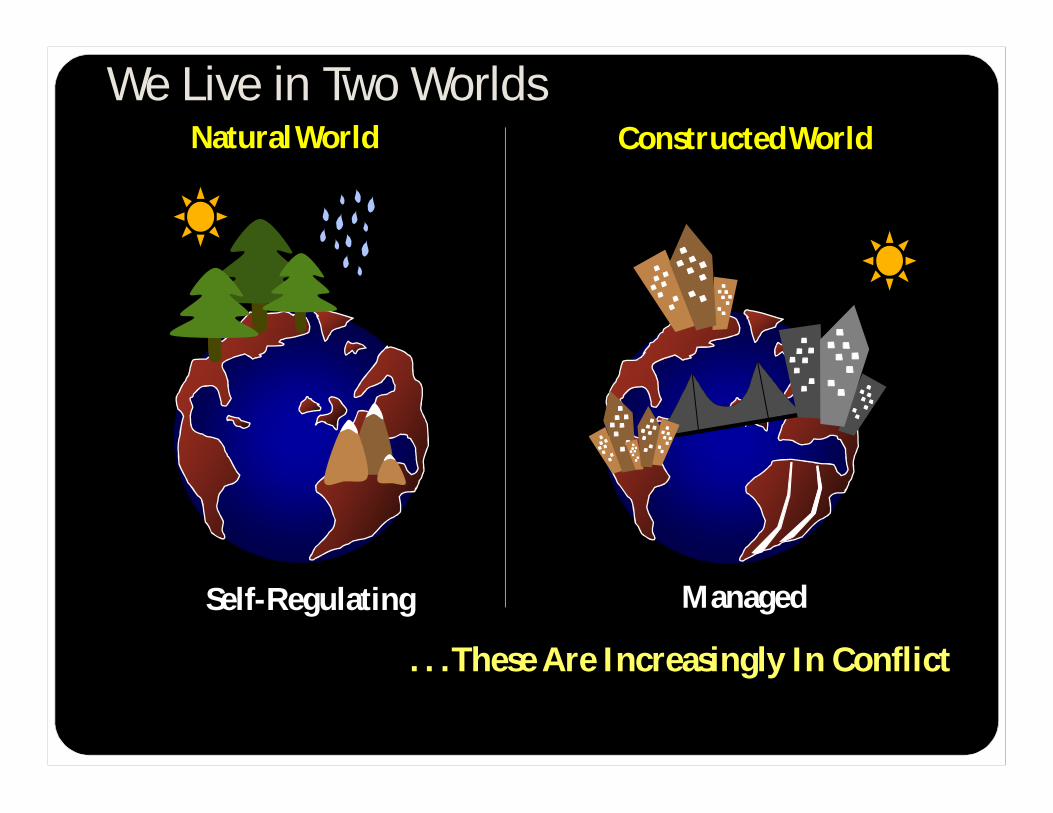
We Live in Two Worlds
Self-Regulating Managed
Natural World Constructed World
. . . These Are Increasingly In Conflict

Watersheds Communities Neighborhoods Districts
Context and Content
Patterns Linkages Trends
Seeing the Whole Managing Places
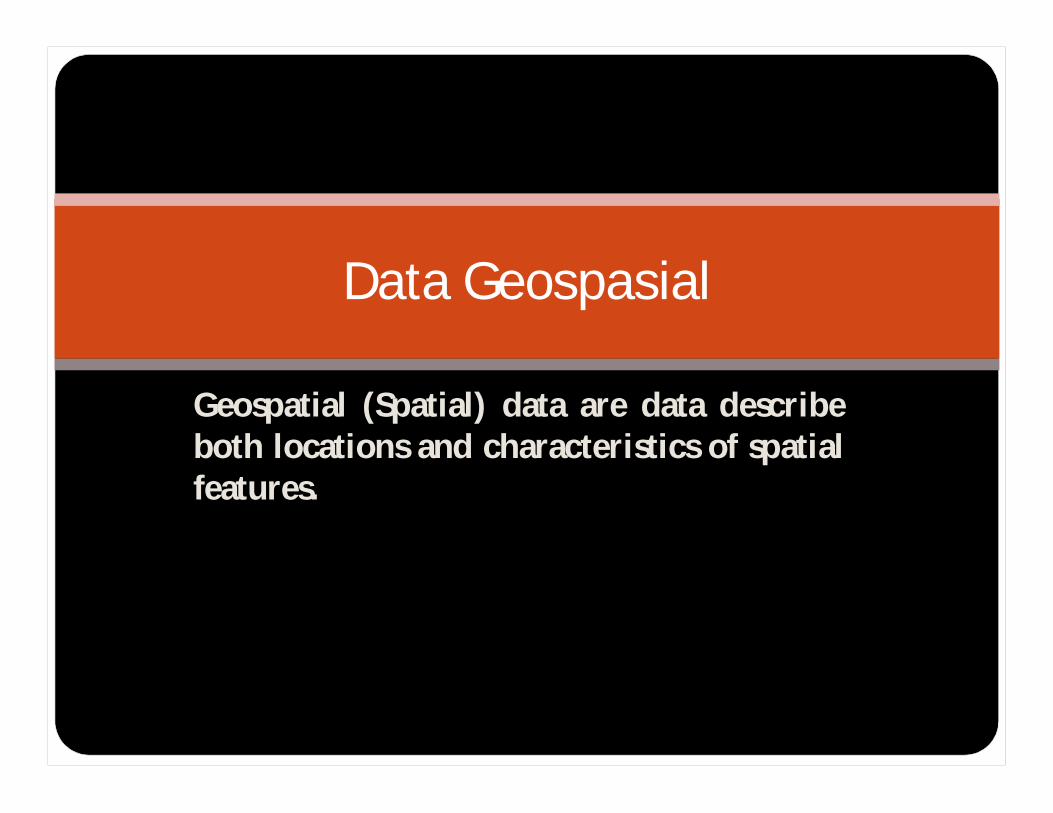
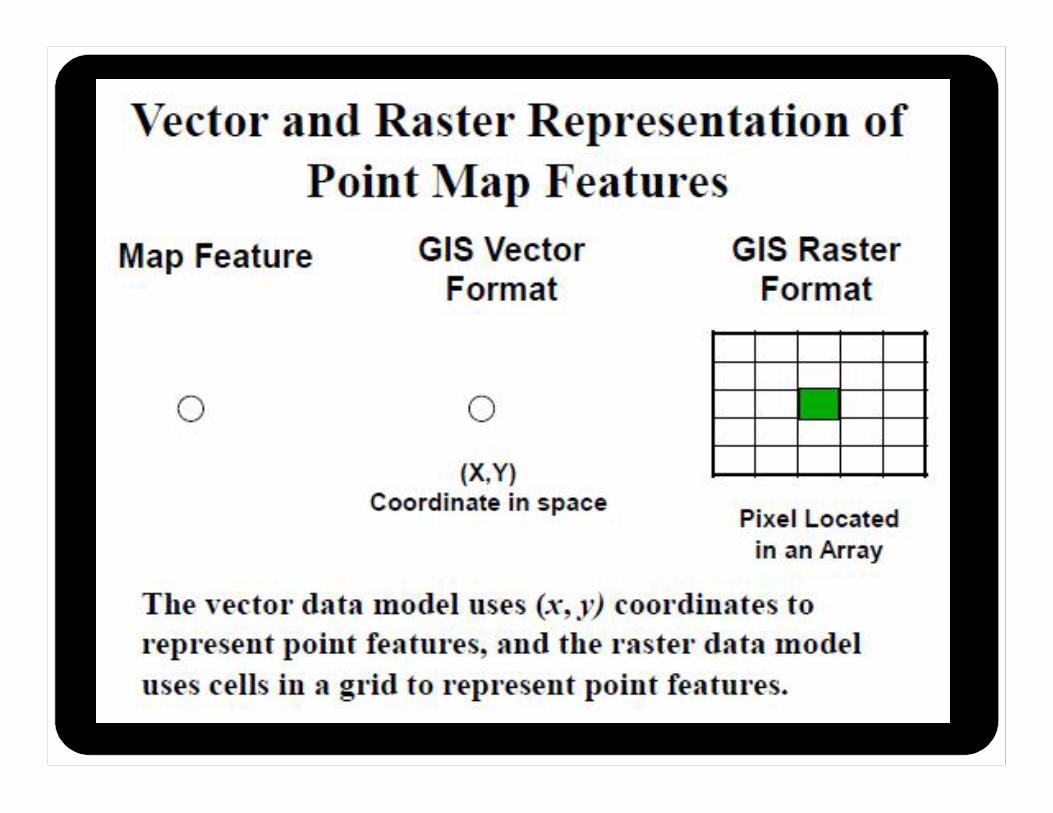
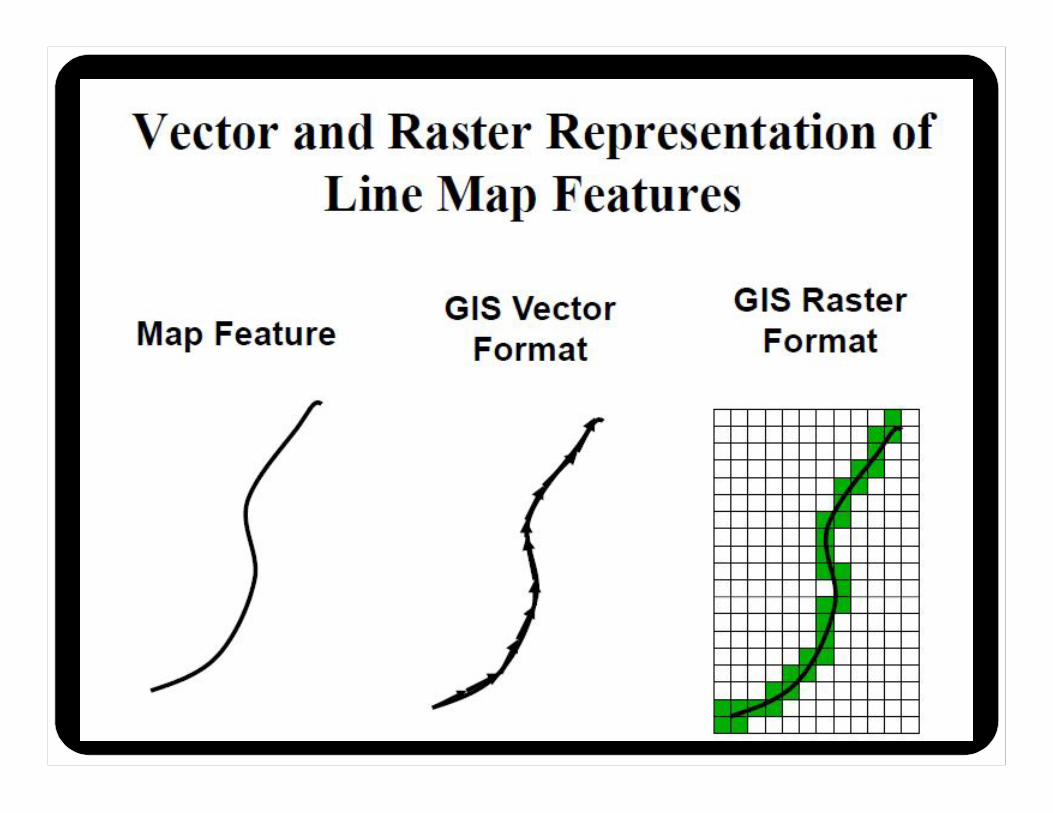
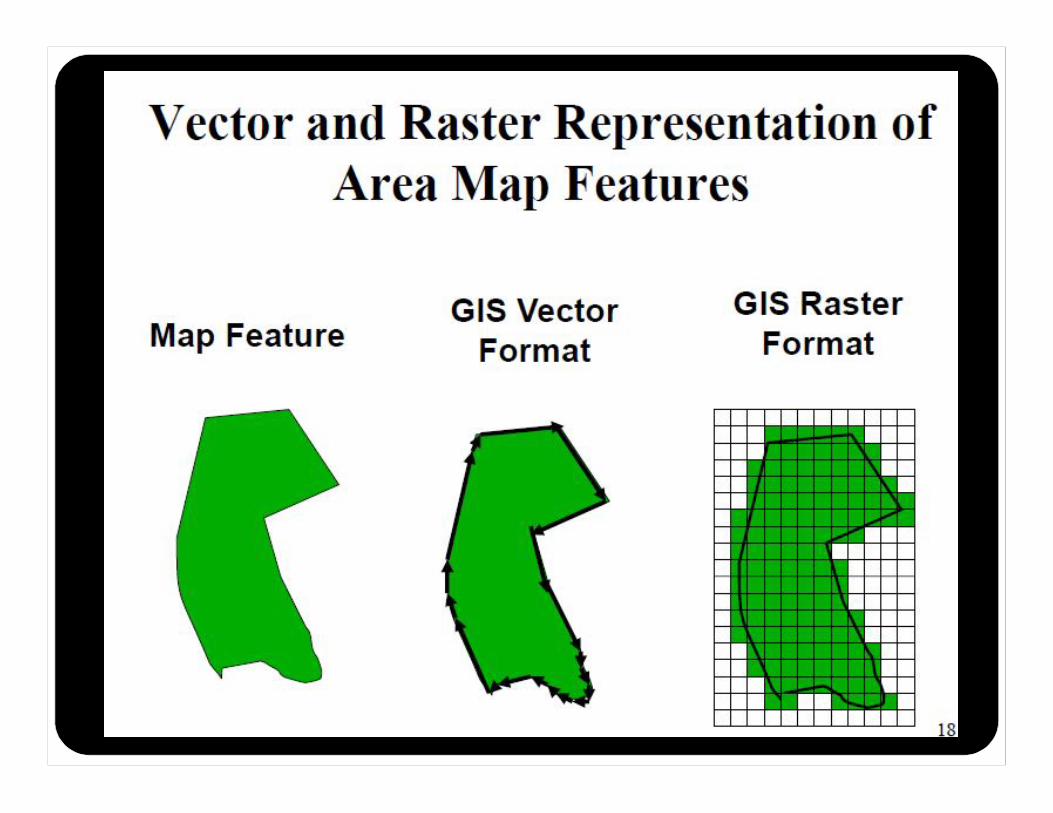
Geospatial (Spatial) data are data describeboth locations and characteristics of spatialfeatures.
Data Geospasial

Can be classified into:1. Graphic data (or called geometric data) and
has three elements ; point (or called node), line (orcalled arc) and area (or called polygon) in eithervector or raster form which represent a geometry oftopology, size, shape, position and orientation.(Spatial coordinates)
2. Attributes (or called thematic data) are called sometimes thematic data or non-spatial
data. Attributes refer to a defined characteristic of an entity in the real world. Attributes include nominal, ordinal, numerical, conditional and other characteristics. (Tabular data)
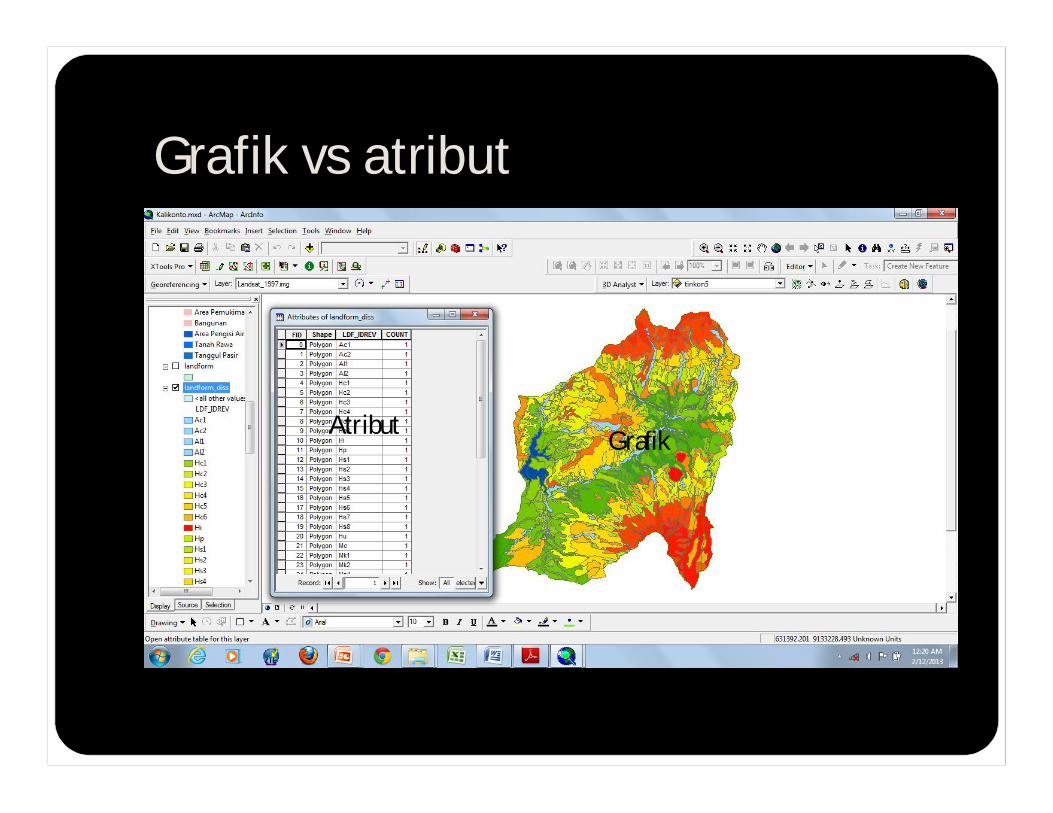
Grafik vs atribut
GrafikAtribut
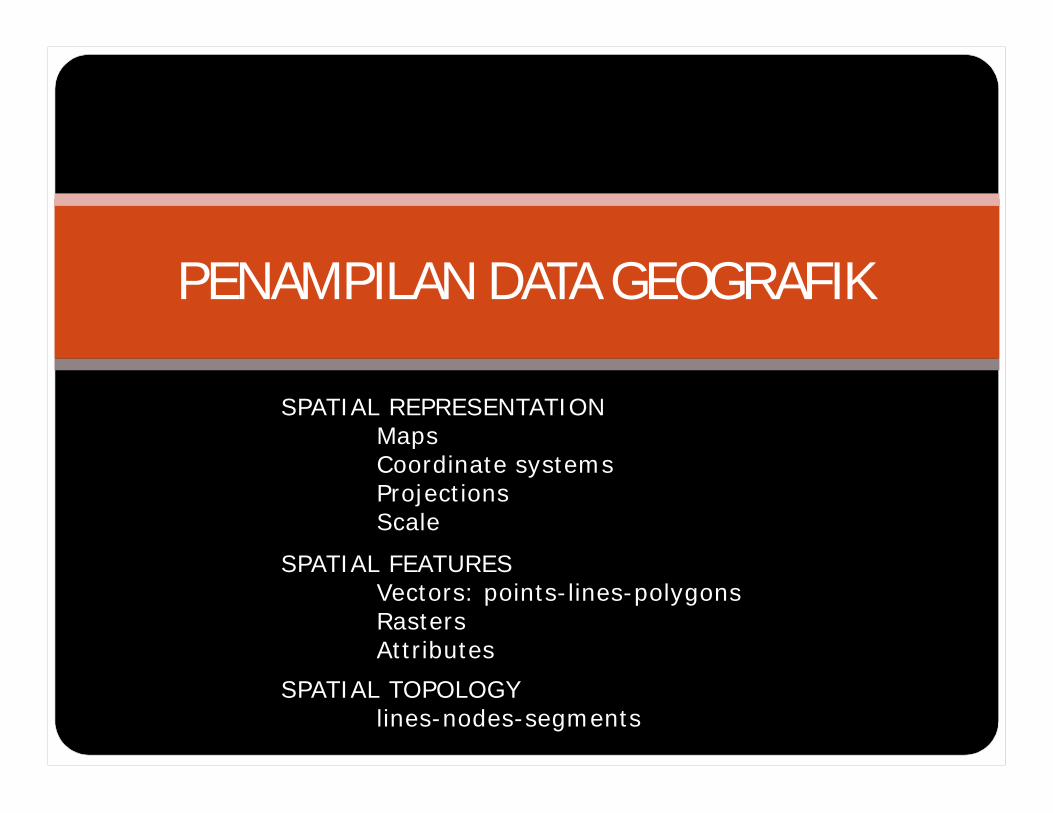
PENAMPILAN DATA GEOGRAFIK
SPATIAL FEATURESVectors: points-lines-polygonsRastersAttributes
SPATIAL REPRESENTATIONMapsCoordinate systemsProjectionsScale
SPATIAL TOPOLOGYlines-nodes-segments
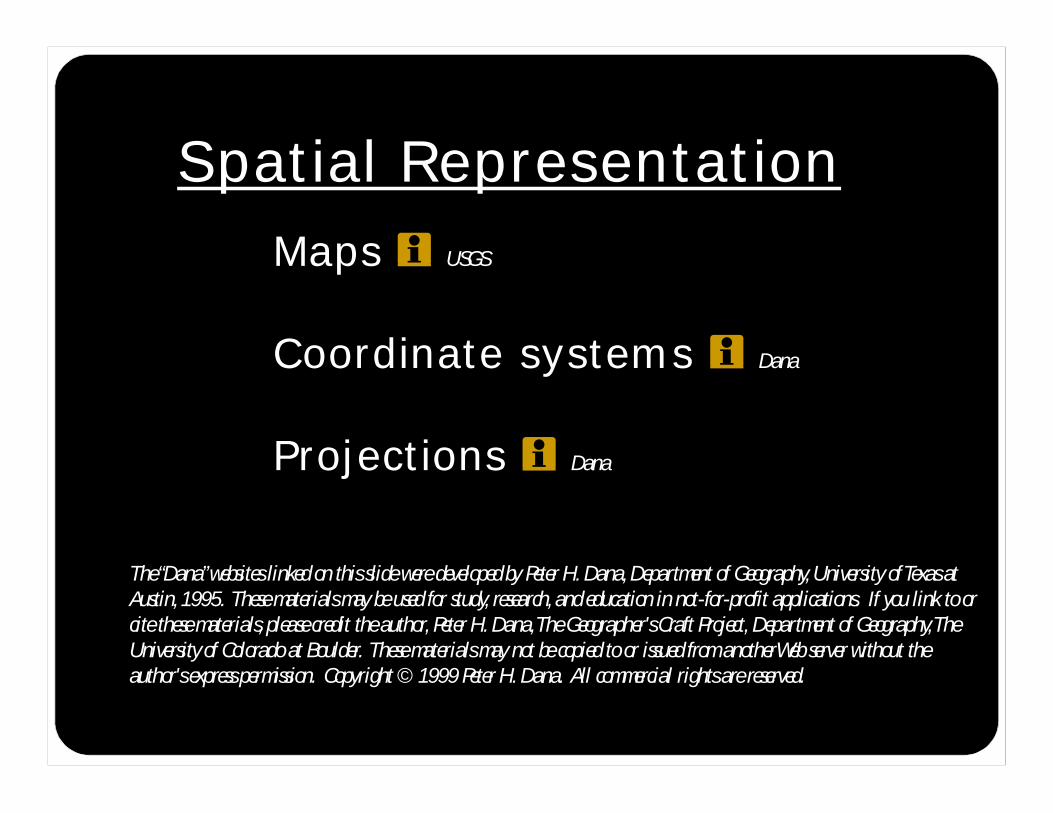
Spatial RepresentationMaps USGS
Coordinate systems Dana
Projections Dana
The “Dana” websites linked on this slide were developed by Peter H. Dana, Department of Geography, University of Texas at Austin, 1995. These materials may be used for study, research, and education in not-for-profit applications. If you link to orcite these materials, please credit the author, Peter H. Dana, The Geographer's Craft Project, Department of Geography, The University of Colorado at Boulder. These materials may not be copied to or issued from another Web server without the author's express permission. Copyright © 1999 Peter H. Dana. All commercial rights are reserved.
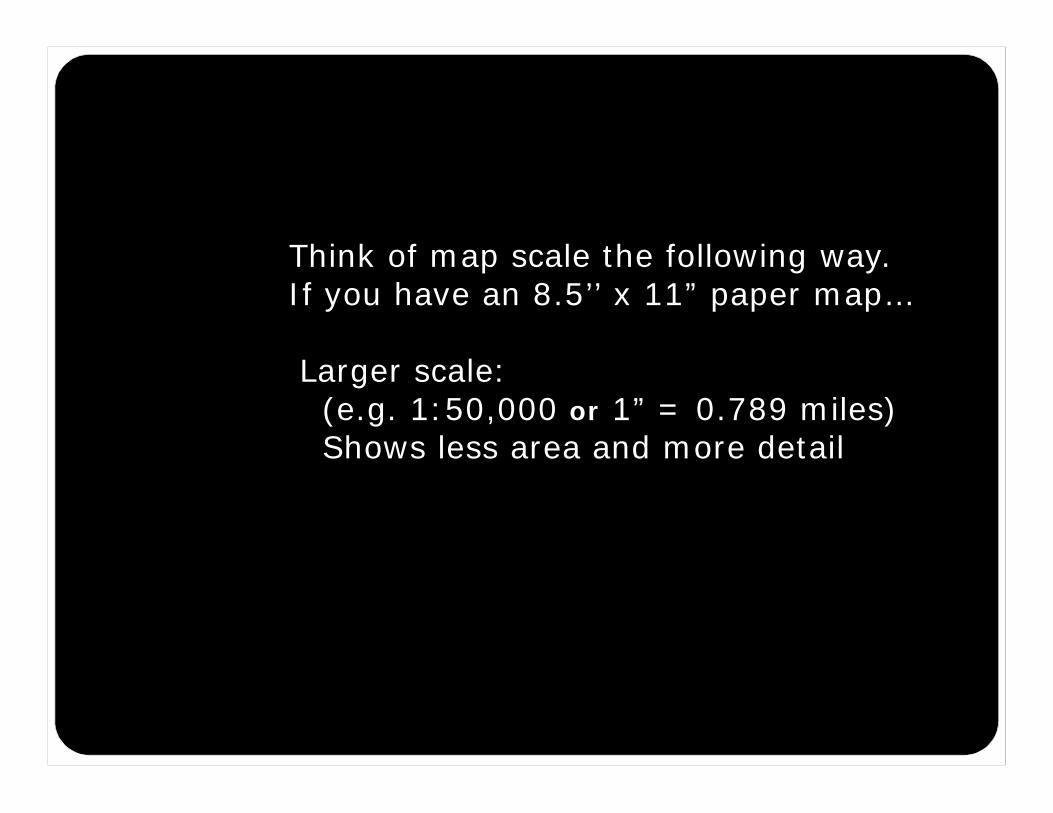
Think of map scale the following way.If you have an 8.5’’ x 11” paper map…
Larger scale: (e.g. 1:50,000 or 1” = 0.789 miles)Shows less area and more detail
MAP SCALE
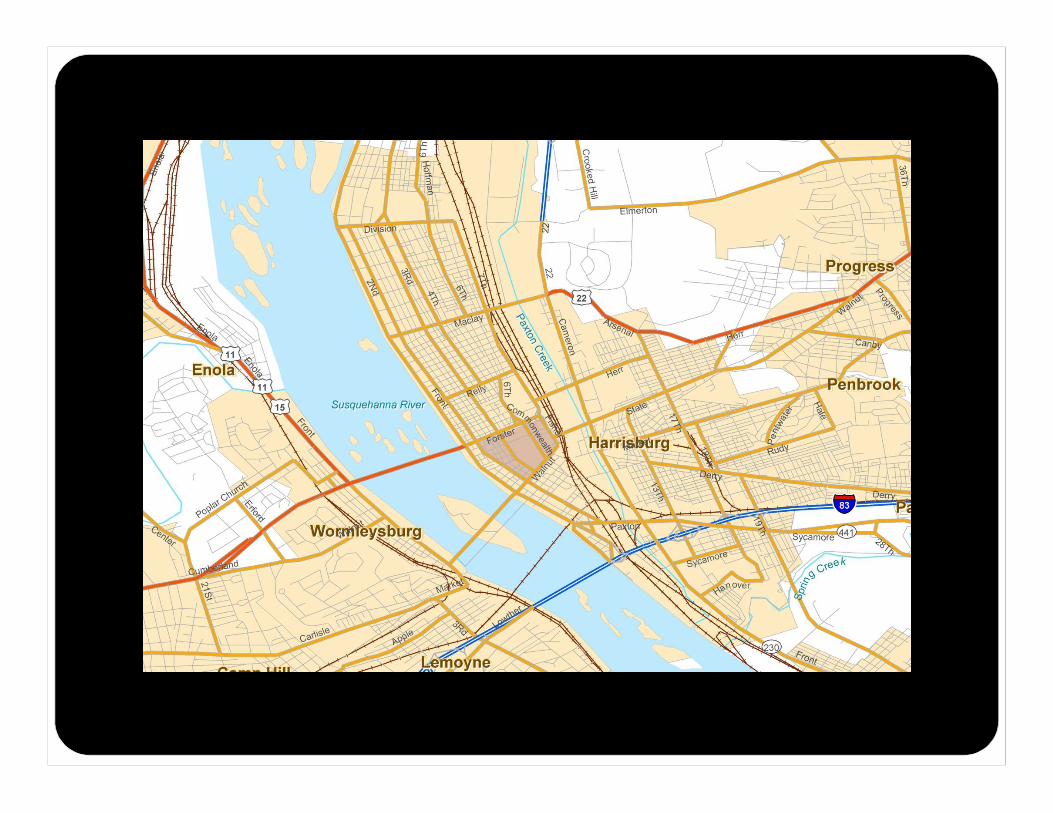
1:50,000 scale map of Harrisburg

Smaller scale: (e.g. 1:500,000 or 1” = 7.89 miles)Shows more area and less detail
Think of map scale the following way.If you have an 8.5’’ x 11” paper map…
Larger scale: (e.g. 1:50,000 or 1” = 0.789 miles)Shows less area and more detail
MAP SCALE
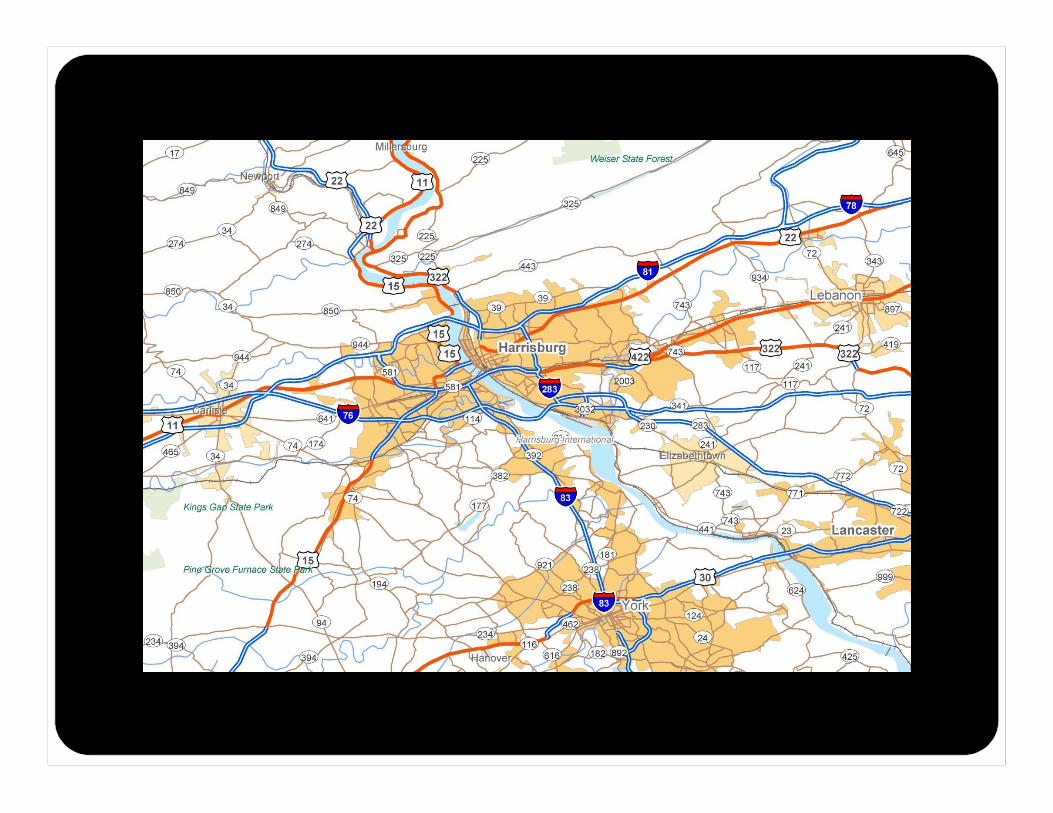
1:500,000 scale map of Harrisburg
Smaller scale: (e.g. 1:500,000 or 1” = 7.89 miles)Shows more area and less detail
Think of map scale the following way.If you have an 8.5’’ x 11” paper map…
Larger scale: (e.g. 1:50,000 or 1” = 0.789 miles)Shows less area and more detail
MAP SCALE
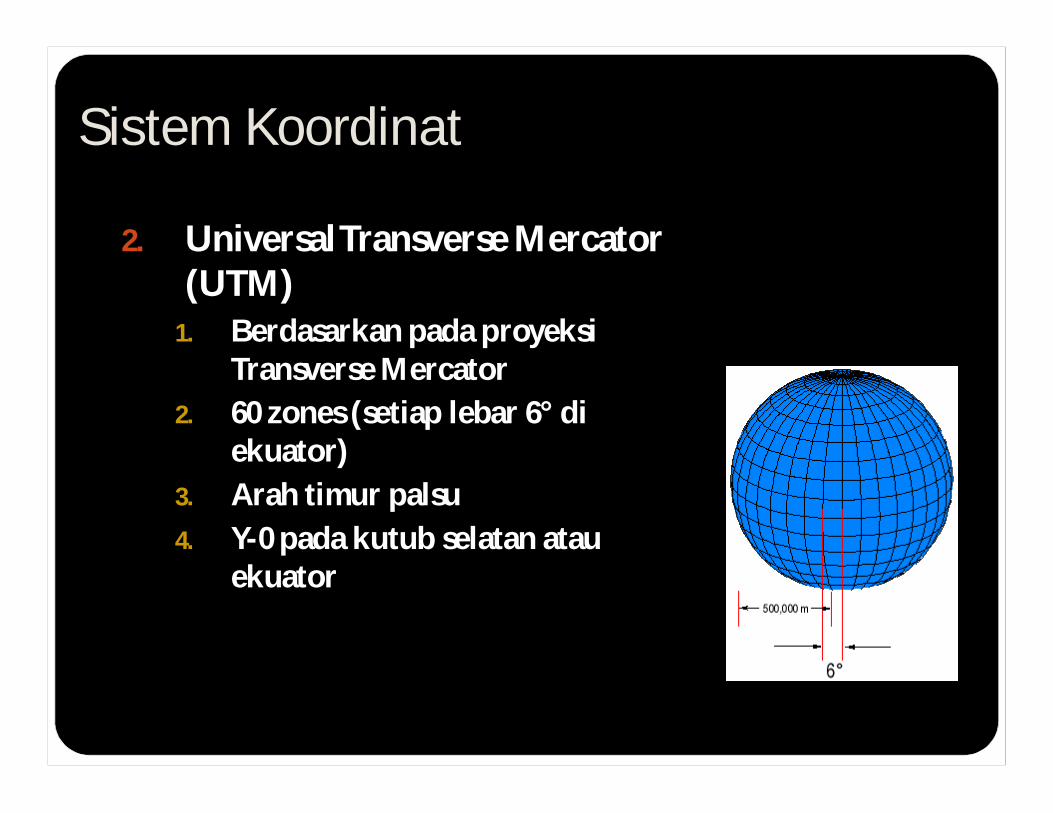
Sistem Koordinat
2. Universal Transverse Mercator (UTM)
1. Berdasarkan pada proyeksi Transverse Mercator
2. 60 zones (setiap lebar 6° di ekuator)
3. Arah timur palsu 4. Y-0 pada kutub selatan atau
ekuator
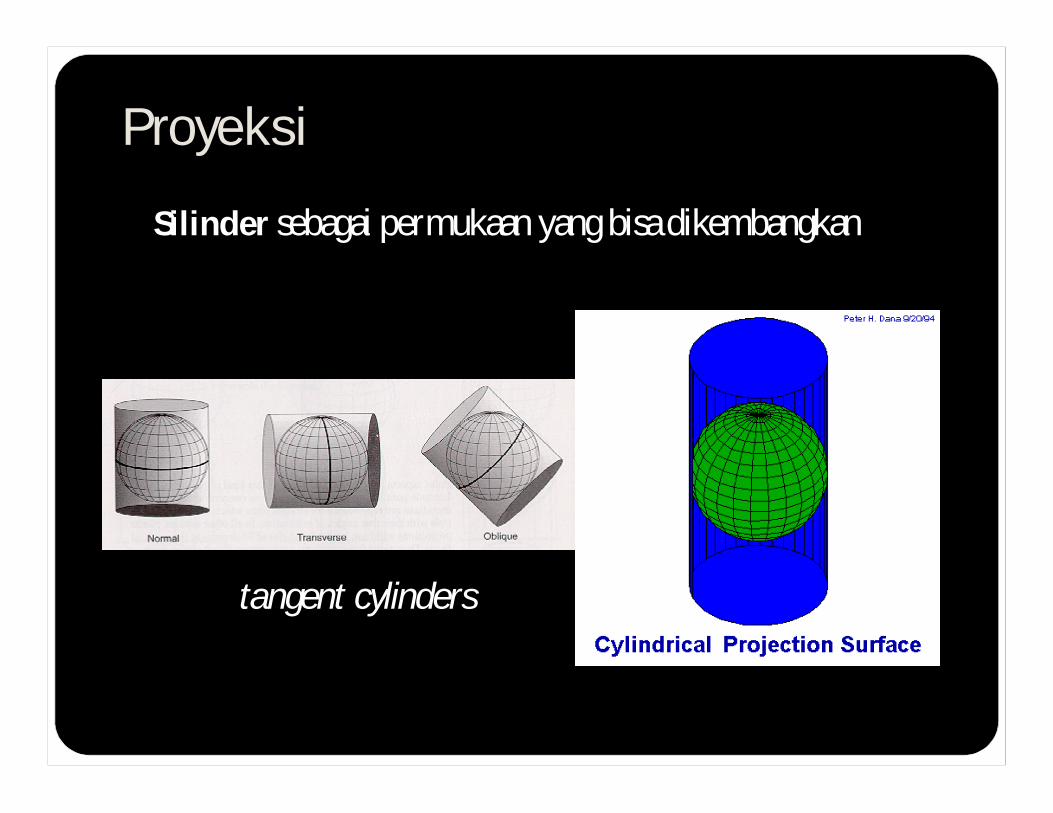
Proyeksi
Silinder sebagai permukaan yang bisa dikembangkan
tangent cylinders
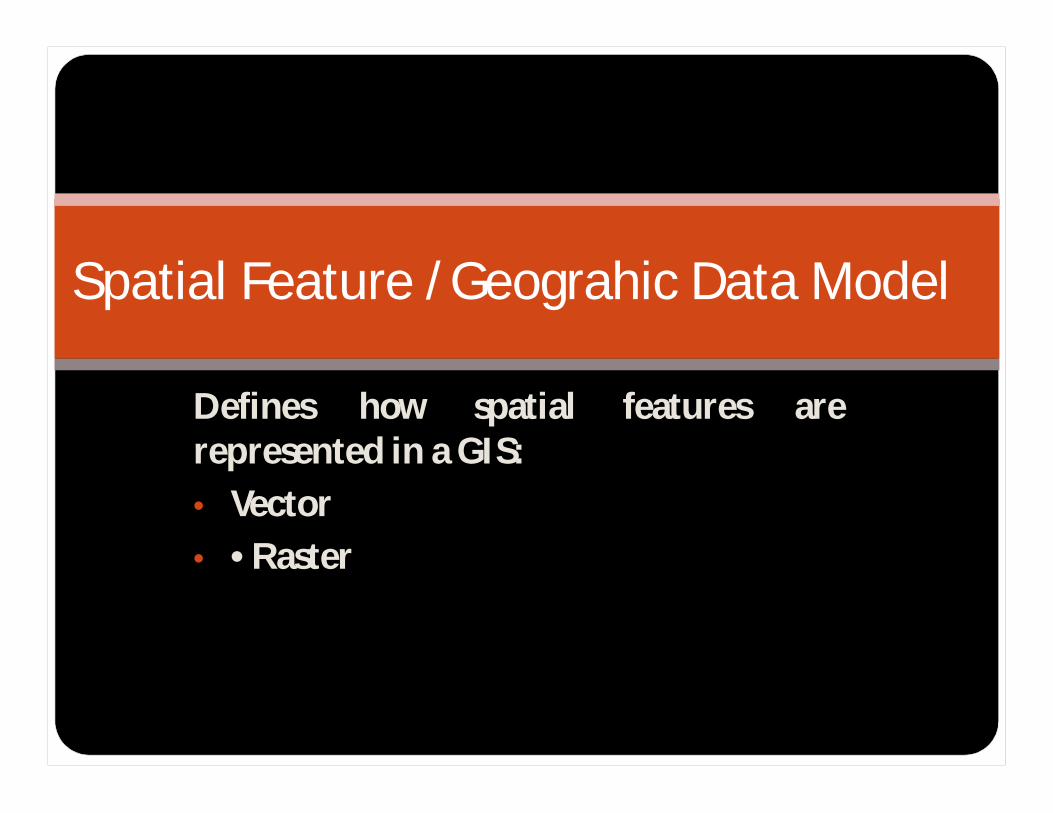
Defines how spatial features arerepresented in a GIS:• Vector • • Raster
Spatial Feature /Geograhic Data Model
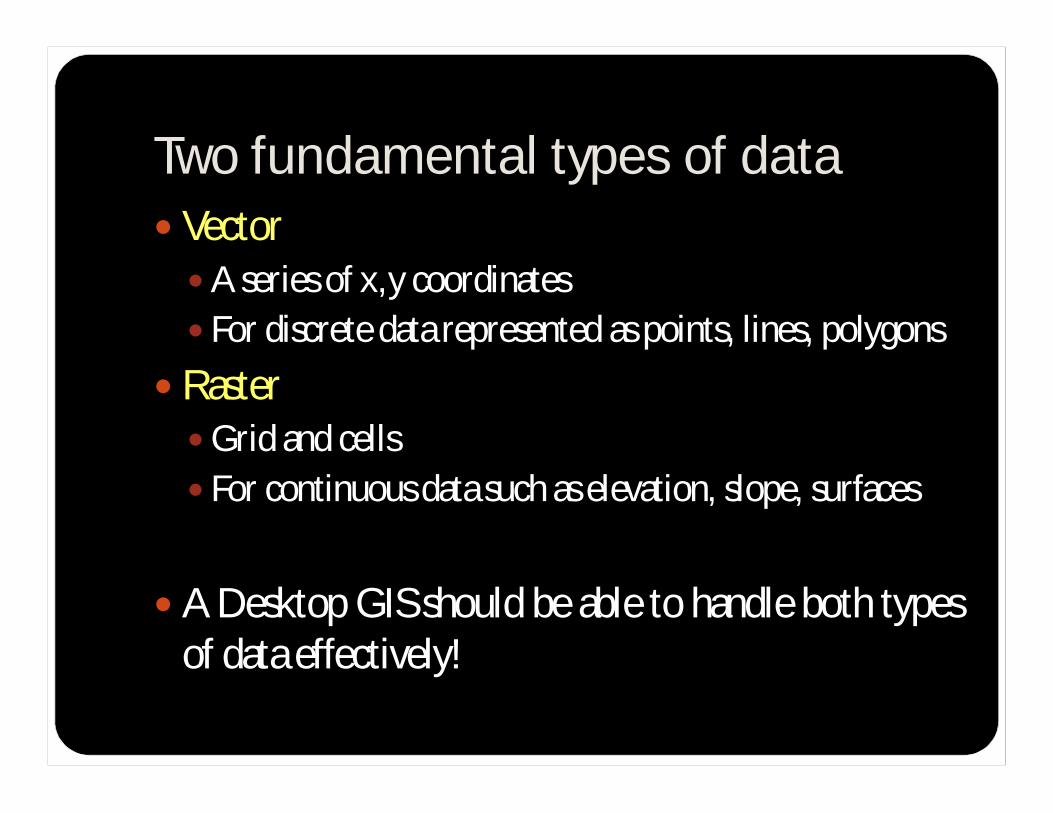
Two fundamental types of data Vector A series of x,y coordinates For discrete data represented as points, lines, polygons
Raster Grid and cells For continuous data such as elevation, slope, surfaces
A Desktop GIS should be able to handle both types of data effectively!
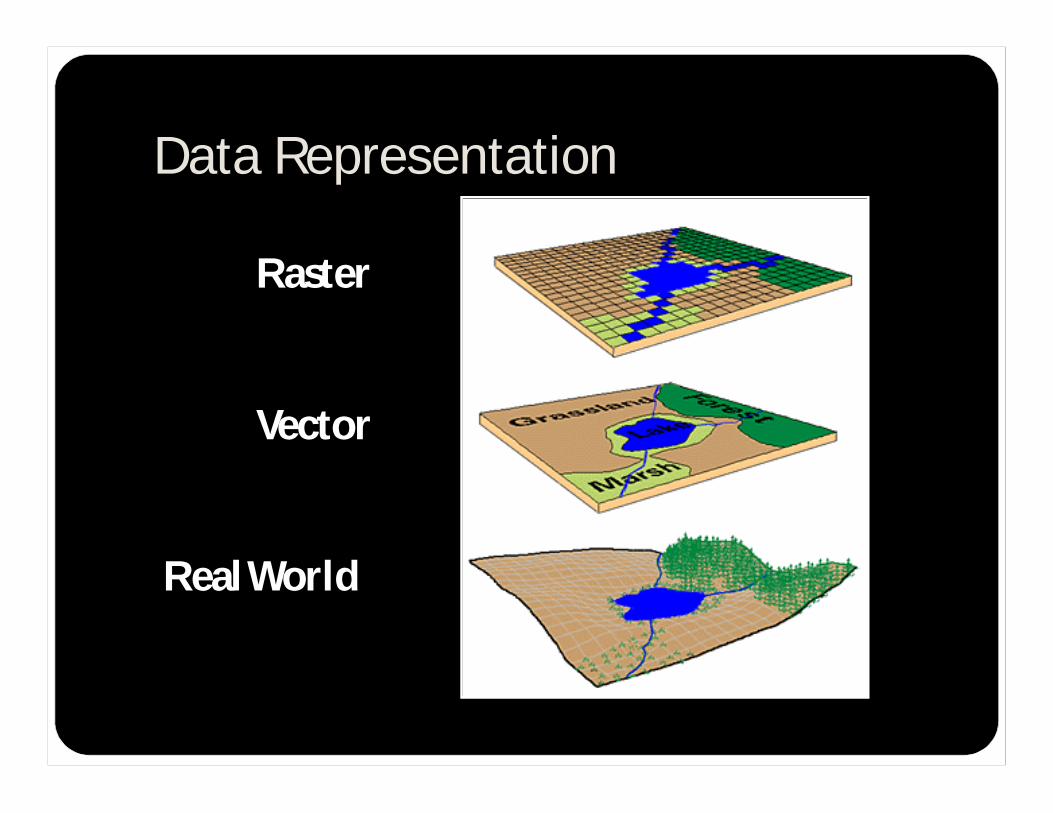
Raster
Vector
Real World
Data Representation

SPATIAL FEATURES Vectors (points-lines-polygons)Rasters
Attributes:Feature Feature class Attribute Point Water wells Depth to waterLine State roads Traffic volumePolygon Counties Total population

“Layer” dalam SIG
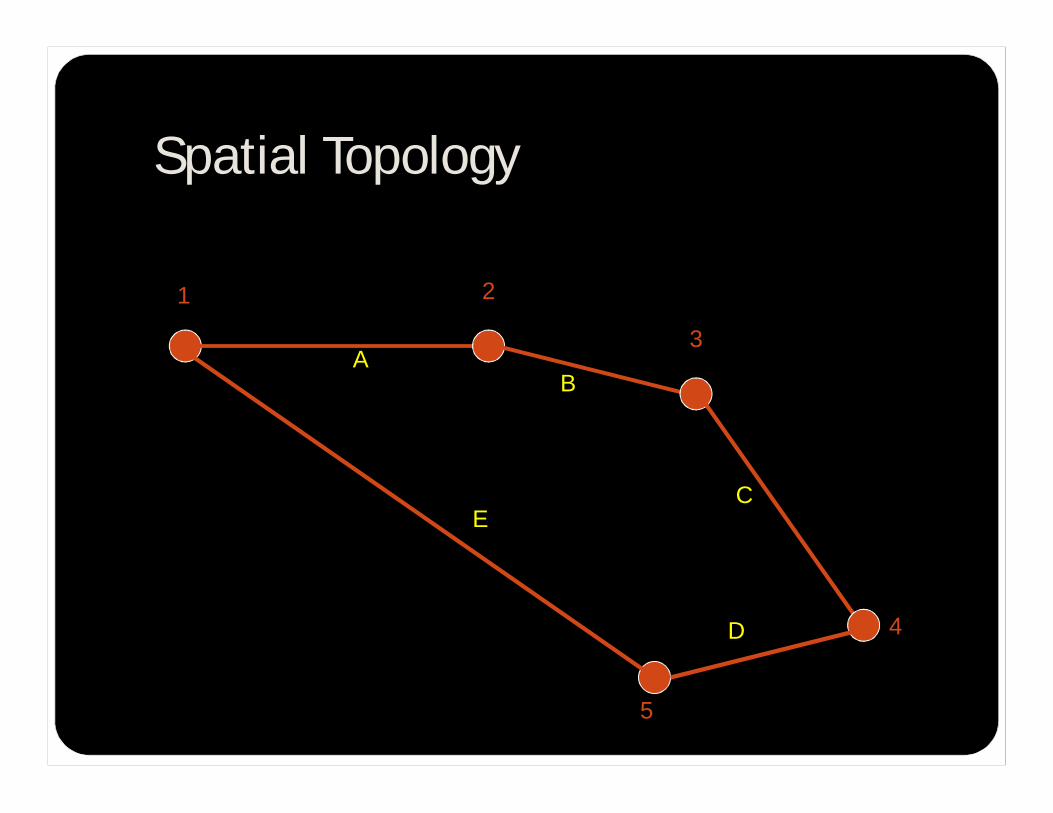
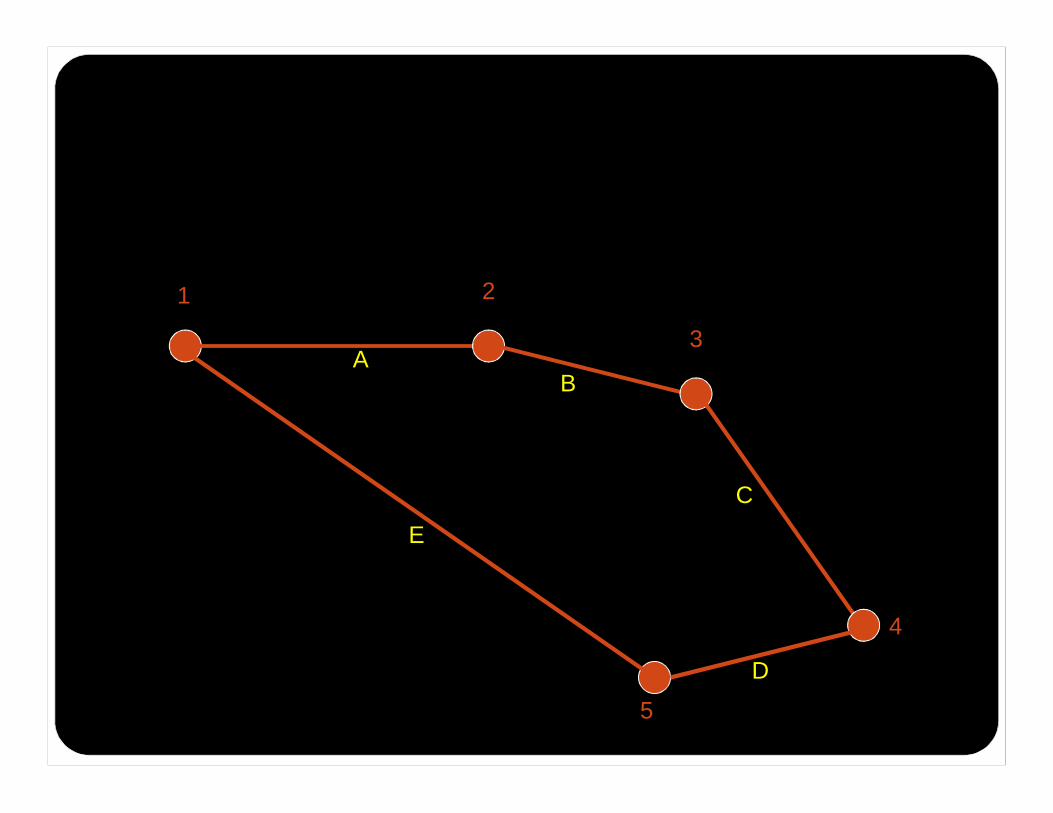
SPATIAL TOPOLOGY: lines-nodes-segments
1
3
2
4
5
AB
C
D
E
Spatial Topology
SPATIAL TOPOLOGY: lines-nodes-segments
1
3
2
4
5
AB
C
D
E
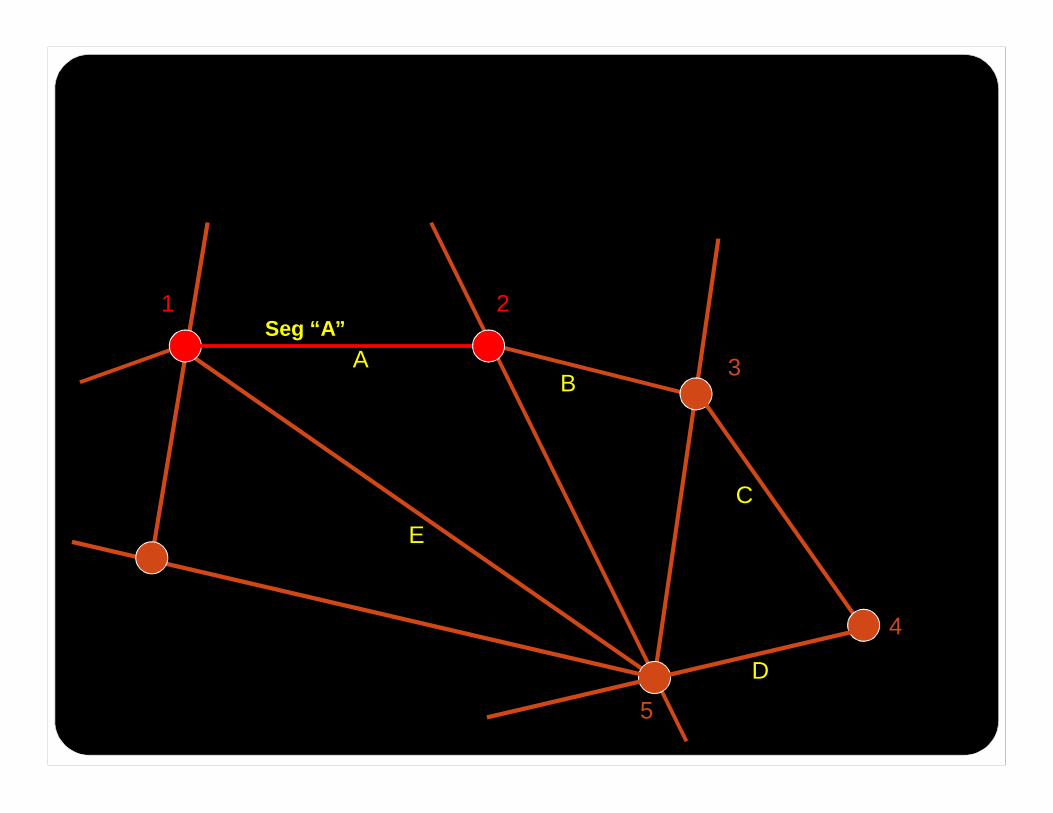
SPATIAL TOPOLOGY: lines-nodes-segments
1
3
2
4
5
AB
C
D
E
Seg “A”
SUBSISTEM DALAM SIG
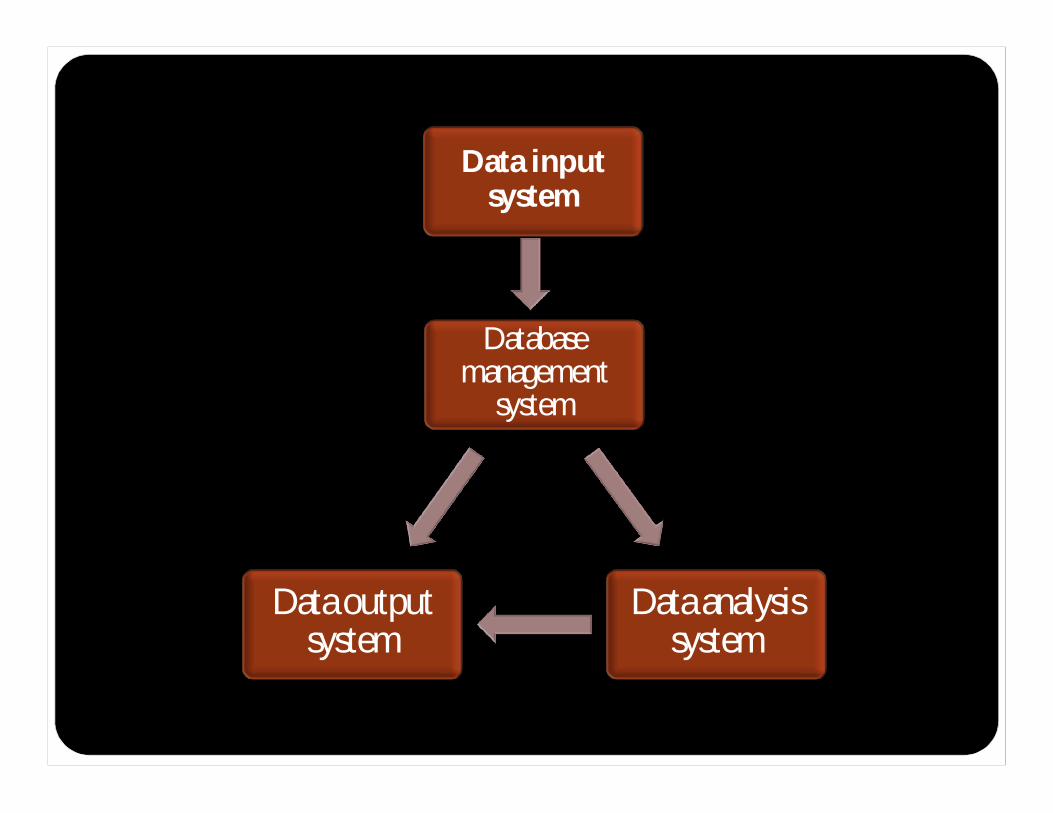
Database management
system
Data analysis system
Data output system
Data input system

Data input system: collects spatial data from existing sources, such as maps,
remote sensing data, GPS, and text data. Database management system: organizes spatial data and allows for quick retrieval and
updates (i.e., editing). Data analysis system: analyzes, manipulates, and models spatial data. Data output system: displays spatial data in graphic (i.e., map) or tabular
form.
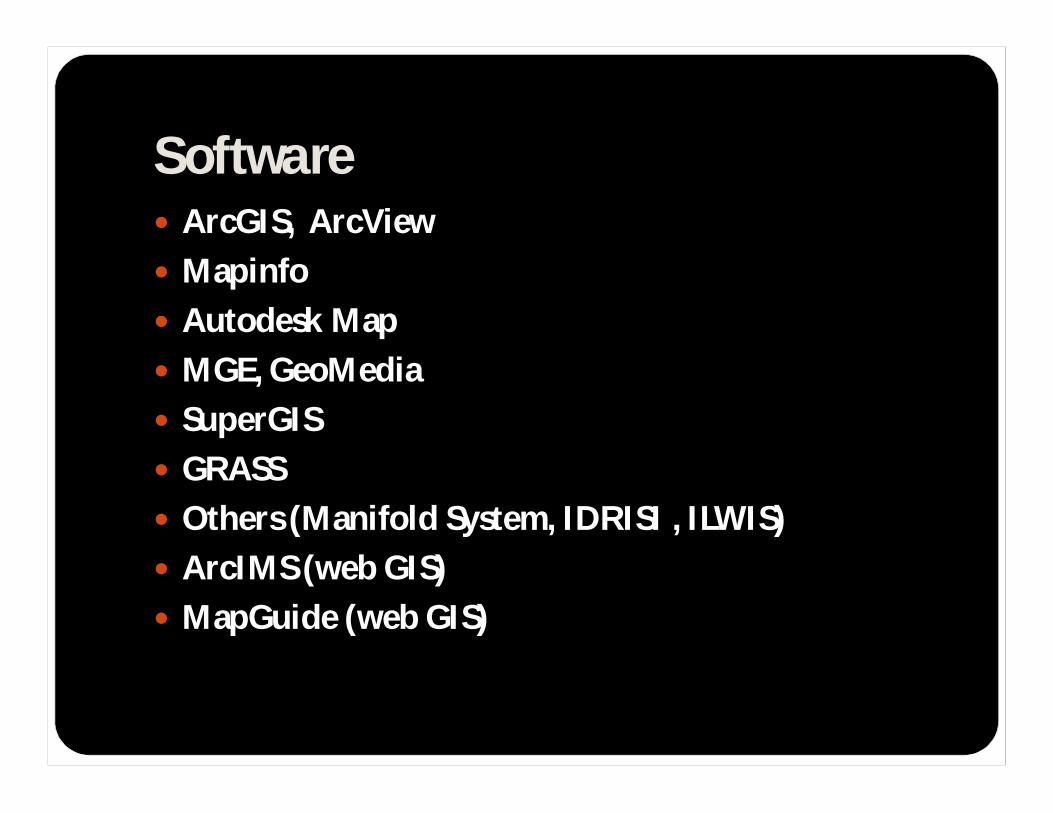
Software ArcGIS, ArcView Mapinfo Autodesk Map MGE, GeoMedia SuperGIS GRASS Others (Manifold System, IDRISI , ILWIS) ArcIMS (web GIS) MapGuide (web GIS)
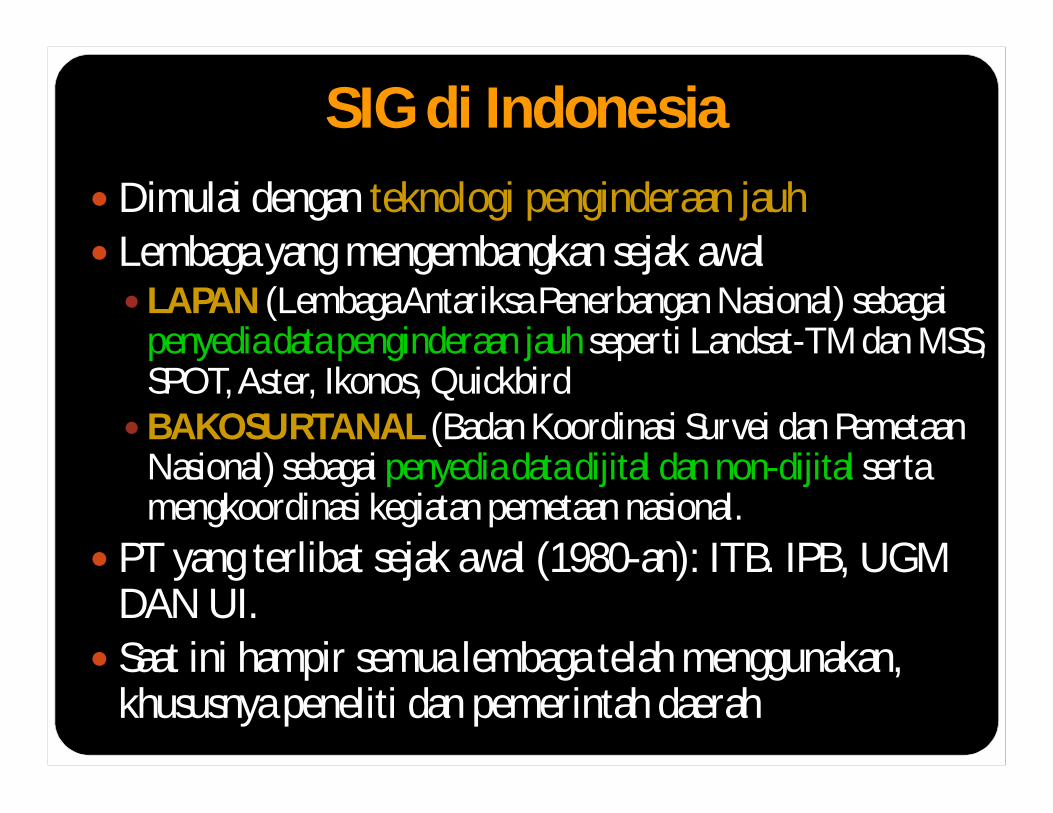
SIG di Indonesia Dimulai dengan teknologi penginderaan jauh Lembaga yang mengembangkan sejak awal LAPAN (Lembaga Antariksa Penerbangan Nasional) sebagai
penyedia data penginderaan jauh seperti Landsat-TM dan MSS, SPOT, Aster, Ikonos, Quickbird
BAKOSURTANAL (Badan Koordinasi Survei dan PemetaanNasional) sebagai penyedia data dijital dan non-dijital serta mengkoordinasi kegiatan pemetaan nasional.
PT yang terlibat sejak awal (1980-an): ITB. IPB, UGM DAN UI.
Saat ini hampir semua lembaga telah menggunakan, khususnya peneliti dan pemerintah daerah
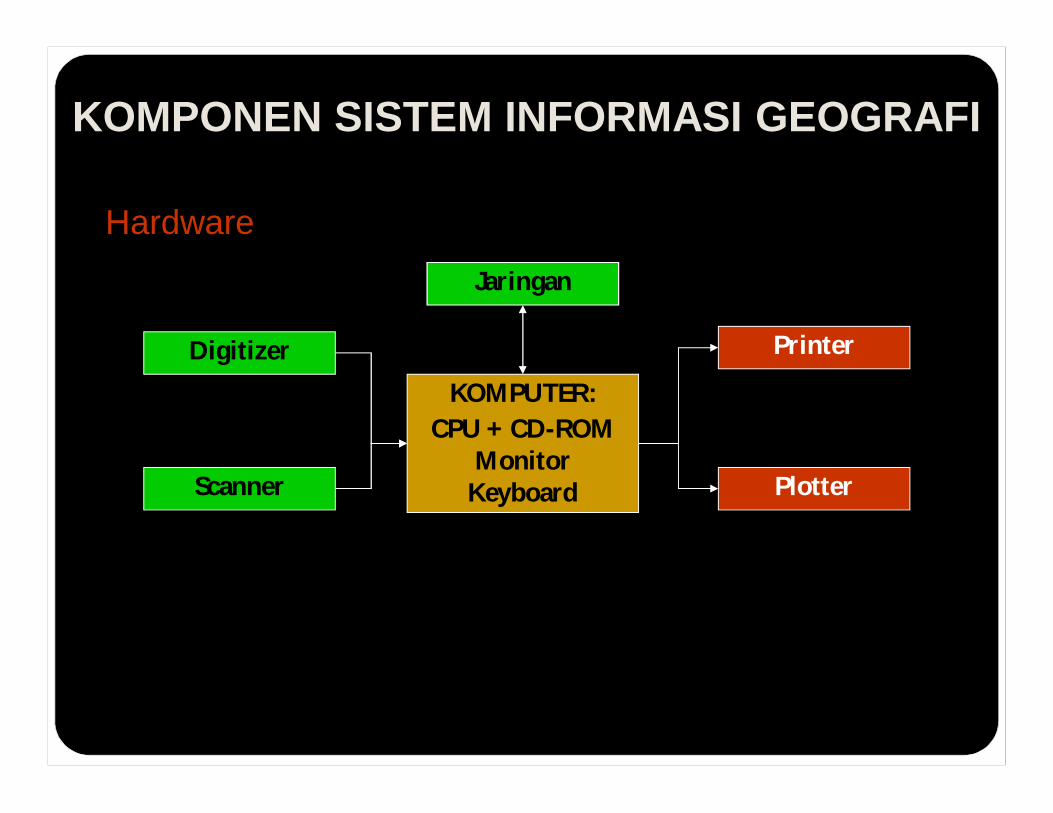
KOMPONEN SISTEM INFORMASI GEOGRAFI
Hardware
KOMPUTER:CPU + CD-ROM
MonitorKeyboard
Digitizer
Scanner
Printer
Plotter
Jaringan
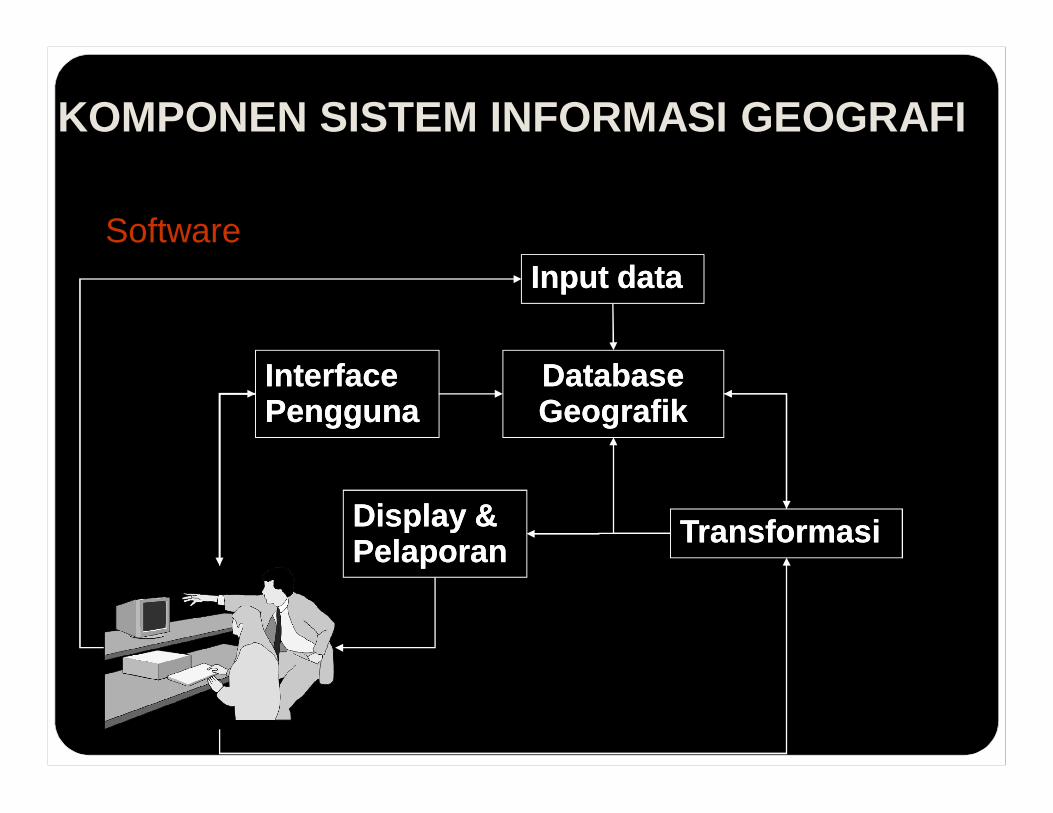
KOMPONEN SISTEM INFORMASI GEOGRAFI
Software
Database Database GeografikGeografik
TransformasiTransformasi
Input dataInput data
Display & Display & PelaporanPelaporan
Interface Interface PenggunaPengguna
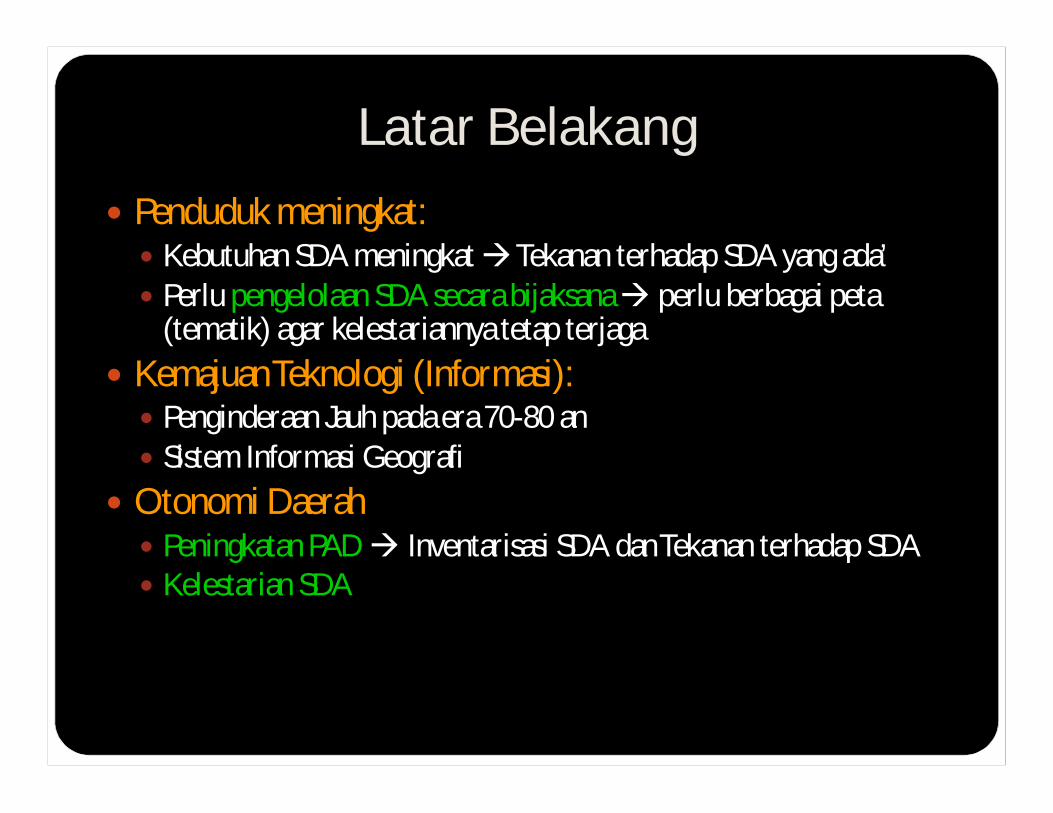
Latar Belakang Penduduk meningkat: Kebutuhan SDA meningkat Tekanan terhadap SDA yang ada’ Perlu pengelolaan SDA secara bijaksana perlu berbagai peta
(tematik) agar kelestariannya tetap terjaga Kemajuan Teknologi (Informasi): Penginderaan Jauh pada era 70-80 an Sistem Informasi Geografi
Otonomi Daerah Peningkatan PAD Inventarisasi SDA dan Tekanan terhadap SDA Kelestarian SDA
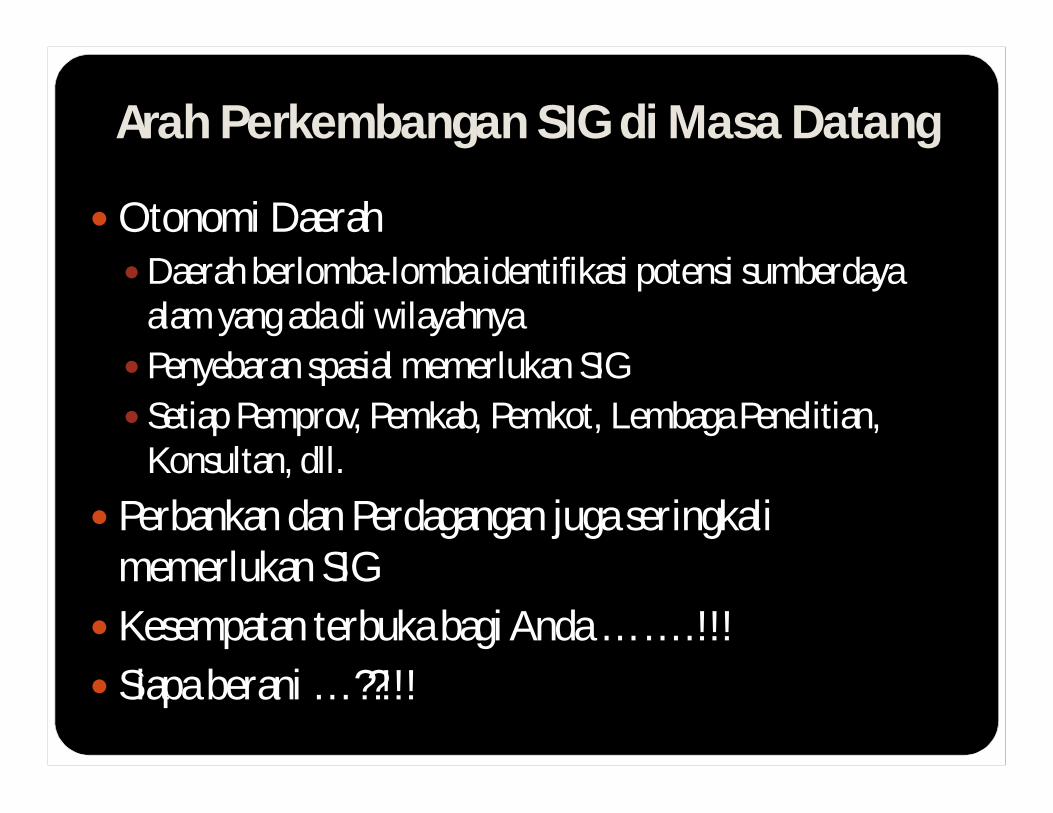
Arah Perkembangan SIG di Masa Datang
Otonomi DaerahDaerah berlomba-lomba identifikasi potensi sumberdaya
alam yang ada di wilayahnya Penyebaran spasial memerlukan SIG Setiap Pemprov, Pemkab, Pemkot, Lembaga Penelitian,
Konsultan, dll.
Perbankan dan Perdagangan juga seringkalimemerlukan SIG
Kesempatan terbuka bagi Anda …….!!! Siapa berani …??!!!

TUGASKoleksi istilah-istilah yang banyak dipakai dalam Sistem Informasi Geografi dan berikan definisnya, misalnya:1. Peta2. Kartografi3. Sistem Koordinat4. Sistem Proyeksi5. Data Vektor6. Data Raster, dllCatatan:Tugas hanya diupload pada blog masing-masing mahasiswa (Blog UB)