pengumuman equity research pt multi indocitra tbk (mice ... fileterobosan diversifikasi dengan...
TRANSCRIPT
PENGUMUMAN
Equity Research PT Multi Indocitra Tbk (MICE)
(Tercatat Di Papan : Pengembangan) No.Peng-ER-00022/BEI.PPJ/12-2010
(dapat dilihat di internet : http://www.idx.co.id) PT Bursa Efek Indonesia telah menerima surat melalui email dari PT Pemeringkat Efek Indonesia dengan No. 1525/PEF-DIR/XII/2010 tanggal 2 Desember 2010 mengenai Publikasi Laporan Penilaian Target Harga Referensi Saham PT Multi Indocitra Tbk sebagaimana terlampir (lampiran 17 lembar). Demikian agar maklum.
Jakarta, 2 Desember 2010
Umi Kulsum Andre PJ. Toelle Kepala Divisi Penilaian Perusahaan Sektor Jasa Kepala Divisi Perdagangan Saham Tembusan Yth. : 1. Ketua Badan Pengawas Pasar Modal dan LK; 2. Kepala Biro Transaksi dan Lembaga Efek Bapepam dan LK; 3. Kepala Biro PKP Sektor Jasa Bapepam dan LK; 4. Pusat Referensi Pasar Modal; 5. Direksi PT Multi Indocitra Tbk.
lau_MICE_er_20101202_22
Multi Indocitra, Tbk Laporan Utama
Equity Valuation
2 Desember 2010
Target Harga
Terendah Tertinggi 810 900
Distribusi
Kinerja Saham
2000
2250
2500
2750
3000
3250
3500
3750
Sep-09 Nov-09 Jan-10 Mar-10 Jun-10 Aug-10 Oct-10200
250
300
350
400
450
500
550
600
IHSGMICE
Sumber : Bloomberg
Informasi Saham Rp
Kode Saham MICE
Harga Saham Per 1 Desember 2010 410
Harga Tertinggi 52 minggu terakhir 570
Harga Terendah 52 minggu terakhir 240 Kapitalisasi Pasar Tertinggi 52 minggu (miliar)
342
Kapitalisasi Pasar Terendah 52 minggu (miliar)
144
Pemegang Saham (%)
PT Buana Graha Utama 60,44
HSBC-Fund Services Client A/C 500 8,80
The Northern Trust Co, Ldv S/A 6,94
Surono Subekti 6,22
Thomas Surjadi Linggodigdo 0,00
Publik 17,60
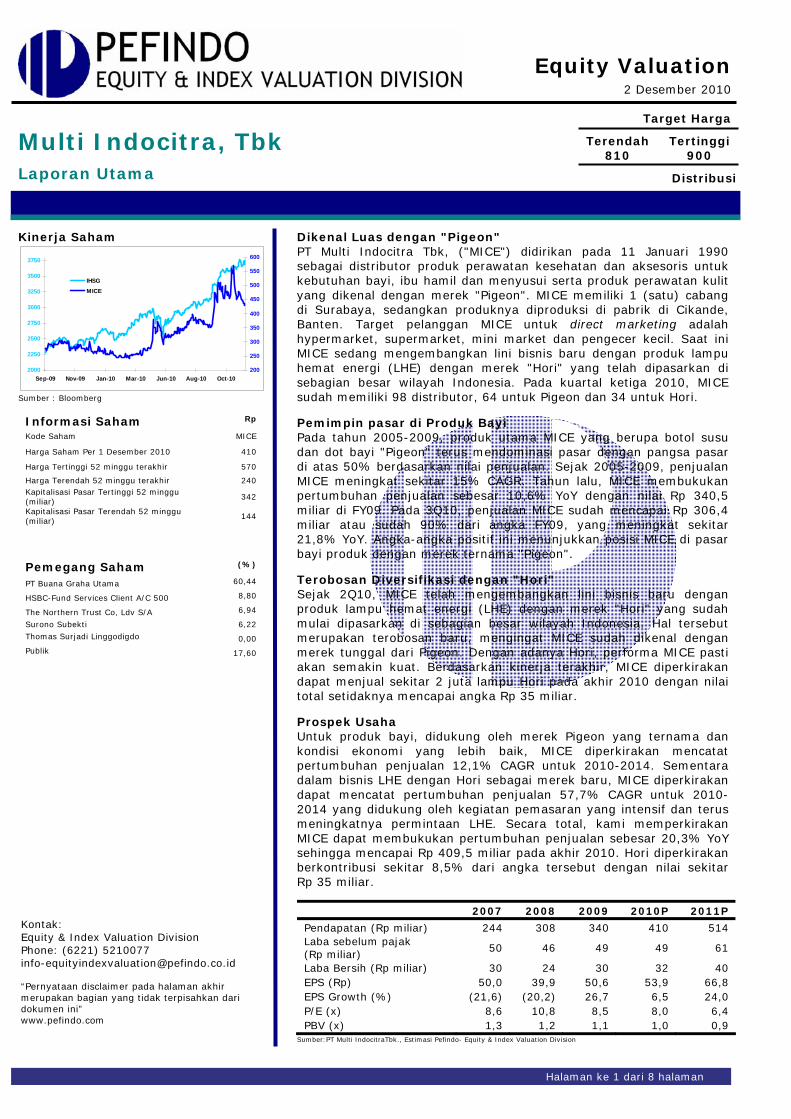
Dikenal Luas dengan "Pigeon" PT Multi Indocitra Tbk, ("MICE") didirikan pada 11 Januari 1990 sebagai distributor produk perawatan kesehatan dan aksesoris untuk kebutuhan bayi, ibu hamil dan menyusui serta produk perawatan kulit yang dikenal dengan merek "Pigeon". MICE memiliki 1 (satu) cabang di Surabaya, sedangkan produknya diproduksi di pabrik di Cikande, Banten. Target pelanggan MICE untuk direct marketing adalah hypermarket, supermarket, mini market dan pengecer kecil. Saat ini MICE sedang mengembangkan lini bisnis baru dengan produk lampu hemat energi (LHE) dengan merek "Hori" yang telah dipasarkan di sebagian besar wilayah Indonesia. Pada kuartal ketiga 2010, MICE sudah memiliki 98 distributor, 64 untuk Pigeon dan 34 untuk Hori.
Pemimpin pasar di Produk Bayi Pada tahun 2005-2009, produk utama MICE yang berupa botol susu dan dot bayi "Pigeon" terus mendominasi pasar dengan pangsa pasar di atas 50% berdasarkan nilai penjualan. Sejak 2005-2009, penjualan MICE meningkat sekitar 15% CAGR. Tahun lalu, MICE membukukan pertumbuhan penjualan sebesar 10,6% YoY dengan nilai Rp 340,5 miliar di FY09. Pada 3Q10, penjualan MICE sudah mencapai Rp 306,4 miliar atau sudah 90% dari angka FY09, yang meningkat sekitar 21,8% YoY. Angka-angka positif ini menunjukkan posisi MICE di pasar bayi produk dengan merek ternama "Pigeon".
Terobosan Diversifikasi dengan "Hori" Sejak 2Q10, MICE telah mengembangkan lini bisnis baru dengan produk lampu hemat energi (LHE) dengan merek "Hori" yang sudah mulai dipasarkan di sebagian besar wilayah Indonesia. Hal tersebut merupakan terobosan baru, mengingat MICE sudah dikenal dengan merek tunggal dari Pigeon. Dengan adanya Hori, performa MICE pasti akan semakin kuat. Berdasarkan kinerja terakhir, MICE diperkirakan dapat menjual sekitar 2 juta lampu Hori pada akhir 2010 dengan nilai total setidaknya mencapai angka Rp 35 miliar.
Prospek Usaha Untuk produk bayi, didukung oleh merek Pigeon yang ternama dan kondisi ekonomi yang lebih baik, MICE diperkirakan mencatat pertumbuhan penjualan 12,1% CAGR untuk 2010-2014. Sementara dalam bisnis LHE dengan Hori sebagai merek baru, MICE diperkirakan dapat mencatat pertumbuhan penjualan 57,7% CAGR untuk 2010-2014 yang didukung oleh kegiatan pemasaran yang intensif dan terus meningkatnya permintaan LHE. Secara total, kami memperkirakan MICE dapat membukukan pertumbuhan penjualan sebesar 20,3% YoY sehingga mencapai Rp 409,5 miliar pada akhir 2010. Hori diperkirakan berkontribusi sekitar 8,5% dari angka tersebut dengan nilai sekitar Rp 35 miliar.
2007 2008 2009 2010P 2011P
Pendapatan (Rp miliar) 244 308 340 410 514 Laba sebelum pajak (Rp miliar)
50 46 49 49 61
Laba Bersih (Rp miliar) 30 24 30 32 40 EPS (Rp) 50,0 39,9 50,6 53,9 66,8 EPS Growth (%) (21,6) (20,2) 26,7 6,5 24,0 P/E (x) 8,6 10,8 8,5 8,0 6,4 PBV (x) 1,3 1,2 1,1 1,0 0,9
Sumber:PT Multi IndocitraTbk., Estimasi Pefindo- Equity & Index Valuation Division
Kontak: Equity & Index Valuation Division Phone: (6221) 5210077 [email protected] “Pernyataan disclaimer pada halaman akhir merupakan bagian yang tidak terpisahkan dari dokumen ini” www.pefindo.com
Halaman ke 1 dari 8 halaman
Multi Indocitra, Tbk
“Pernyataan disclaimer pada halaman akhir merupakan bagian yang tidak terpisahkan dari dokumen ini” www.pefindo.com
INFORMASI BISNIS
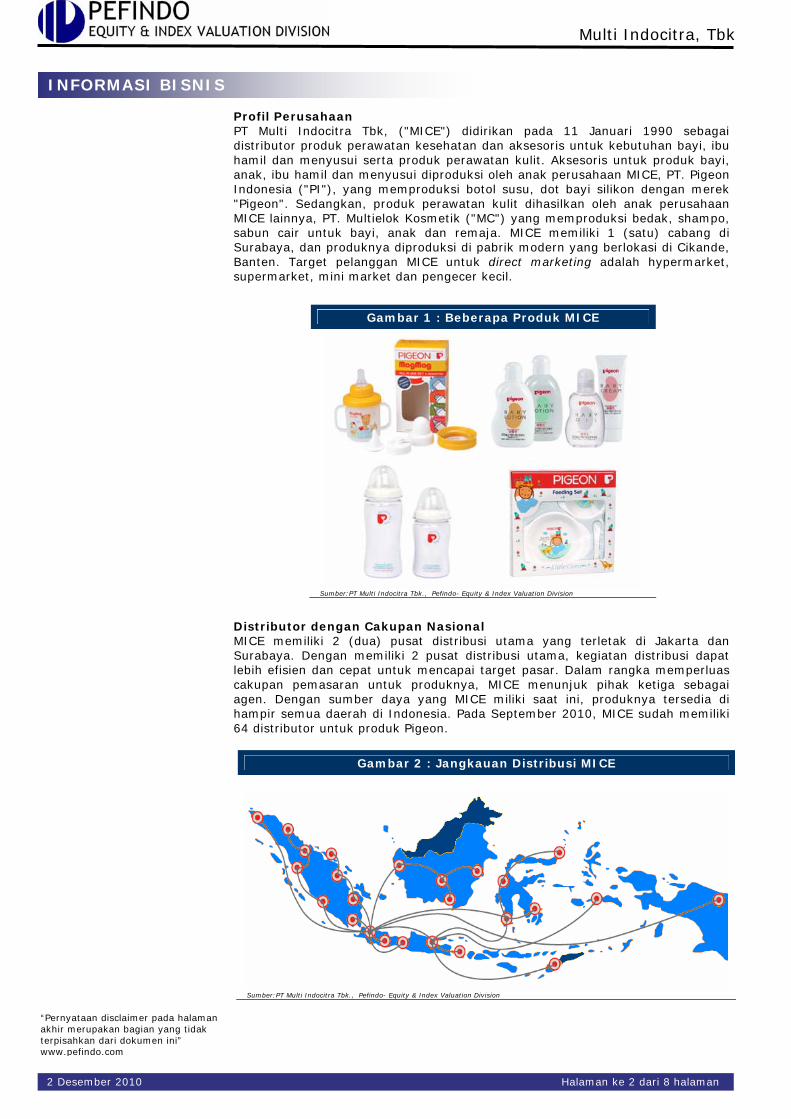
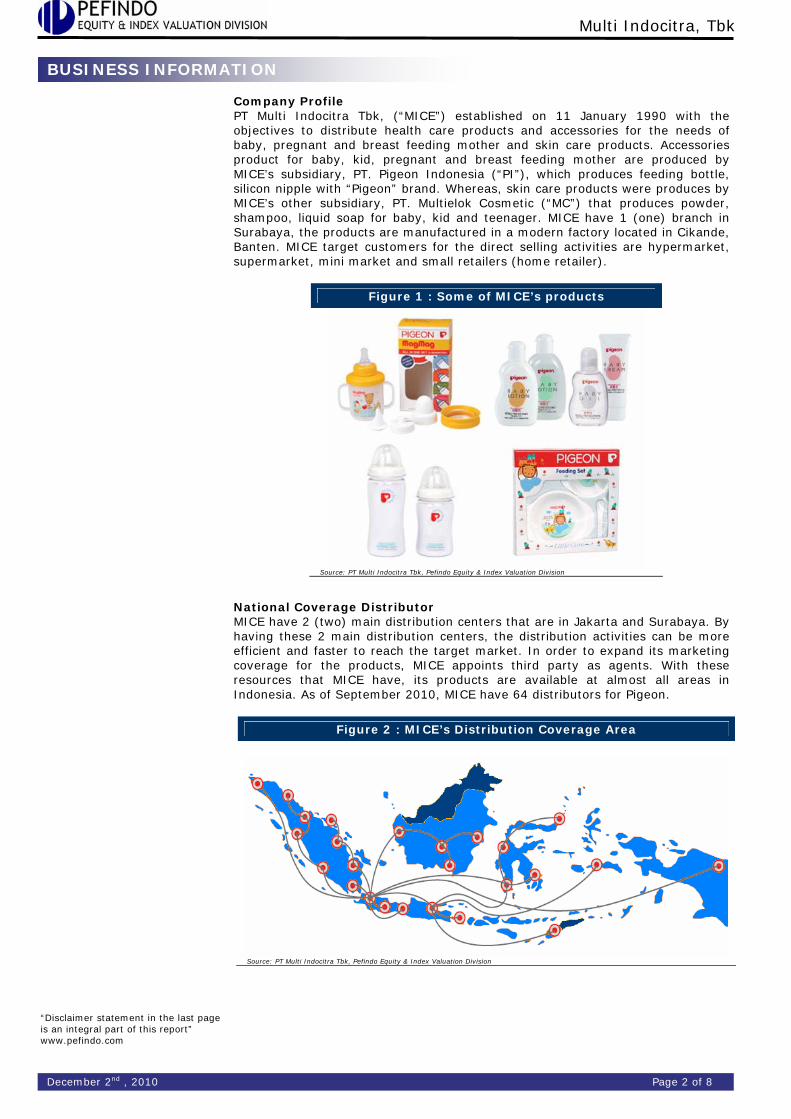
Profil Perusahaan PT Multi Indocitra Tbk, ("MICE") didirikan pada 11 Januari 1990 sebagai distributor produk perawatan kesehatan dan aksesoris untuk kebutuhan bayi, ibu hamil dan menyusui serta produk perawatan kulit. Aksesoris untuk produk bayi, anak, ibu hamil dan menyusui diproduksi oleh anak perusahaan MICE, PT. Pigeon Indonesia ("PI"), yang memproduksi botol susu, dot bayi silikon dengan merek "Pigeon". Sedangkan, produk perawatan kulit dihasilkan oleh anak perusahaan MICE lainnya, PT. Multielok Kosmetik ("MC") yang memproduksi bedak, shampo, sabun cair untuk bayi, anak dan remaja. MICE memiliki 1 (satu) cabang di Surabaya, dan produknya diproduksi di pabrik modern yang berlokasi di Cikande, Banten. Target pelanggan MICE untuk direct marketing adalah hypermarket, supermarket, mini market dan pengecer kecil.
Gambar 1 : Beberapa Produk MICE
Sumber:PT Multi Indocitra Tbk., Pefindo- Equity & Index Valuation Division
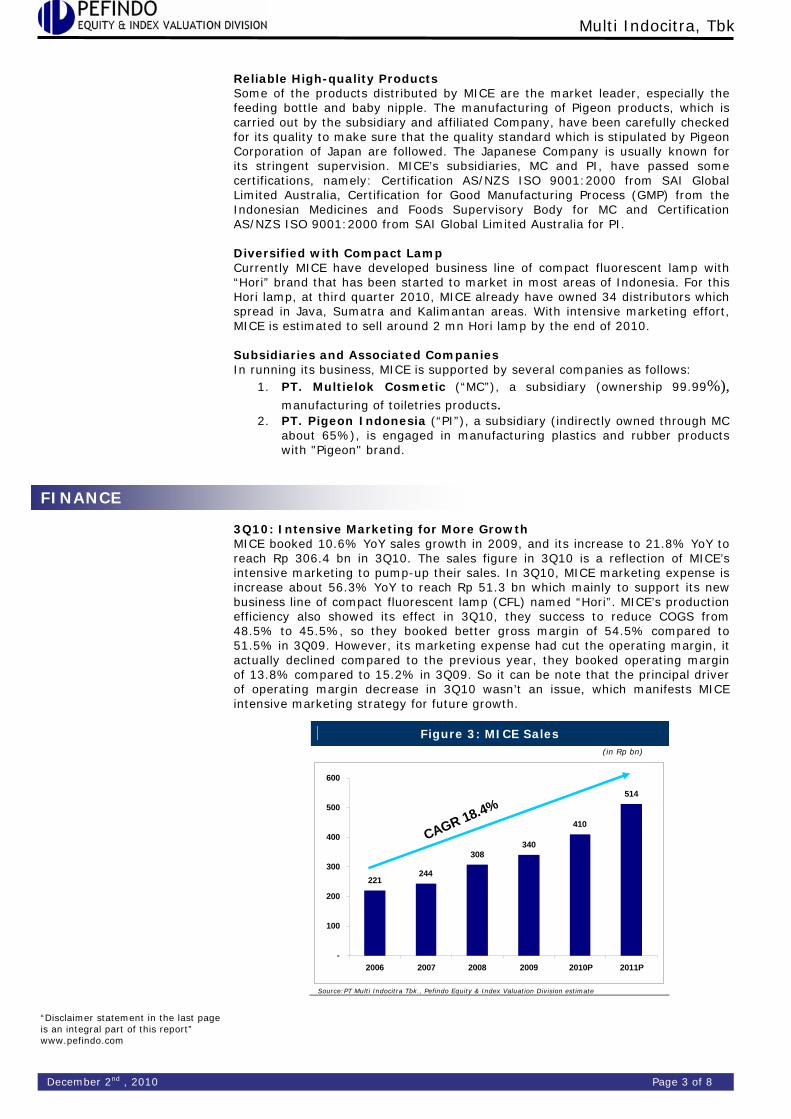
Distributor dengan Cakupan Nasional MICE memiliki 2 (dua) pusat distribusi utama yang terletak di Jakarta dan Surabaya. Dengan memiliki 2 pusat distribusi utama, kegiatan distribusi dapat lebih efisien dan cepat untuk mencapai target pasar. Dalam rangka memperluas cakupan pemasaran untuk produknya, MICE menunjuk pihak ketiga sebagai agen. Dengan sumber daya yang MICE miliki saat ini, produknya tersedia di hampir semua daerah di Indonesia. Pada September 2010, MICE sudah memiliki 64 distributor untuk produk Pigeon.
Gambar 2 : Jangkauan Distribusi MICE
Sumber:PT Multi Indocitra Tbk., Pefindo- Equity & Index Valuation Division
2 Desember 2010 Halaman ke 2 dari 8 halaman
Multi Indocitra, Tbk
“Pernyataan disclaimer pada halaman akhir merupakan bagian yang tidak terpisahkan dari dokumen ini” www.pefindo.com
Produk Handal dan Berkualitas Beberapa produk yang didistribusikan oleh MICE merupakan pemimpin pasar, terutama botol susu dan dot bayi. Pembuatan produk Pigeon yang dilakukan oleh anak perusahaan dan perusahaan afiliasi telah diperiksa kualitasnya untuk memastikan bahwa sudah sesuai standar mutu yang ditetapkan oleh Pigeon Corporation Jepang. Perusahaan Jepang dikenal dengan pengawasannya yang ketat. Anak perusahaan MICE, MC dan PI, telah mendapatkan berbagai sertifikasi, yaitu: Sertifikasi AS / NZS ISO 9001:2000 dari SAI Global Limited Australia, Sertifikasi Good Manufacturing Process (GMP) dari Badan Pengawas Obat dan Makanan Indonesia untuk MC dan Sertifikasi AS / NZS ISO 9001:2000 dari SAI Global Limited Australia untuk PI. Diversifikasi dengan Lampu Hemat Energi Saat ini MICE sedang mengembangkan lini bisnis baru berupa lampu hemat energi dengan merek "Hori" yang sudah dipasarkan di sebagian besar wilayah Indonesia. Untuk lampu Hori, pada triwulan ketiga 2010 MICE telah telah memiliki 34 distributor yang tersebar di Jawa, Sumatera dan Kalimantan. Dengan upaya pemasaran yang intensif, MICE diperkirakan dapat menjual sekitar 2 juta lampu Hori hingga akhir 2010. Anak Perusahaan dan Perusahaan Asosiasi Dalam menjalankan usahanya, MICE didukung oleh beberapa perusahaan sebagai berikut:
1. PT Multielok Kosmetik ("MC"), anak perusahaan (kepemilikan 99,99%), bergerak dalam produksi barang toiletries.
2. PT Pigeon Indonesia ("PI"), anak perusahaan (kepemilikan tidak langsung melalui MC sekitar 65%), bergerak dalam produksi barang plastik dan karet untuk bayi dengan merek "Pigeon".
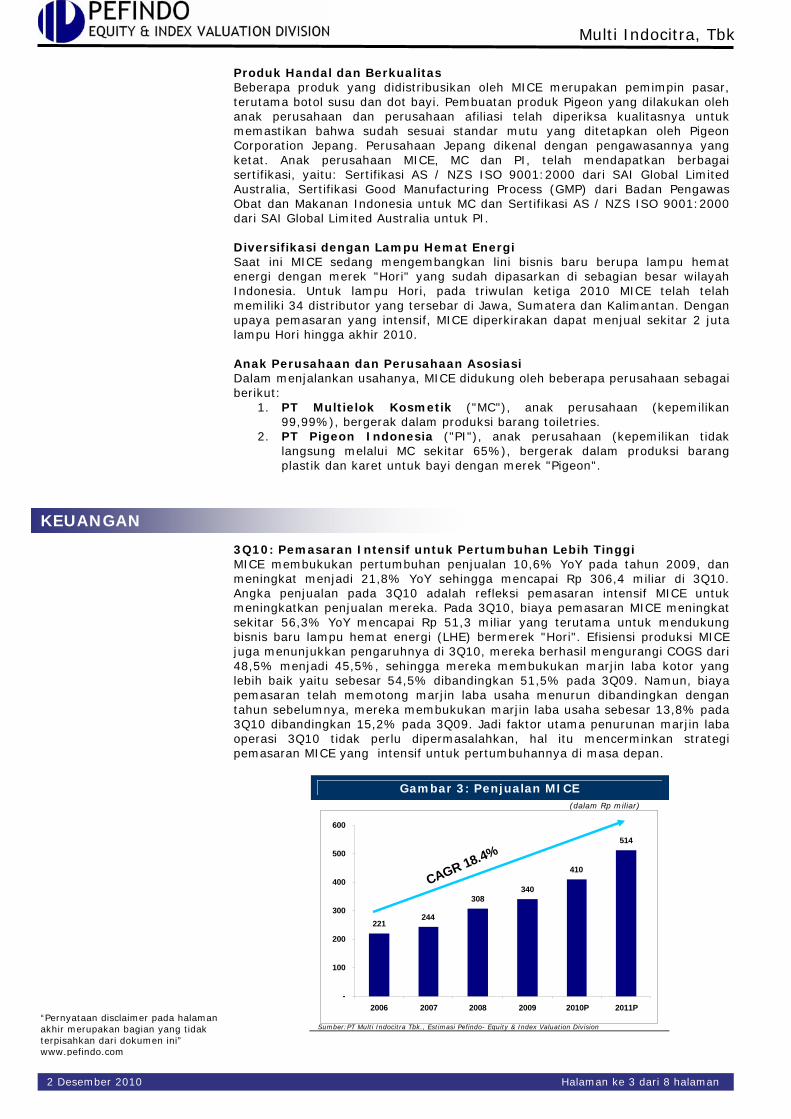
3Q10: Pemasaran Intensif untuk Pertumbuhan Lebih Tinggi MICE membukukan pertumbuhan penjualan 10,6% YoY pada tahun 2009, dan meningkat menjadi 21,8% YoY sehingga mencapai Rp 306,4 miliar di 3Q10. Angka penjualan pada 3Q10 adalah refleksi pemasaran intensif MICE untuk meningkatkan penjualan mereka. Pada 3Q10, biaya pemasaran MICE meningkat sekitar 56,3% YoY mencapai Rp 51,3 miliar yang terutama untuk mendukung bisnis baru lampu hemat energi (LHE) bermerek "Hori". Efisiensi produksi MICE juga menunjukkan pengaruhnya di 3Q10, mereka berhasil mengurangi COGS dari 48,5% menjadi 45,5%, sehingga mereka membukukan marjin laba kotor yang lebih baik yaitu sebesar 54,5% dibandingkan 51,5% pada 3Q09. Namun, biaya pemasaran telah memotong marjin laba usaha menurun dibandingkan dengan tahun sebelumnya, mereka membukukan marjin laba usaha sebesar 13,8% pada 3Q10 dibandingkan 15,2% pada 3Q09. Jadi faktor utama penurunan marjin laba operasi 3Q10 tidak perlu dipermasalahkan, hal itu mencerminkan strategi pemasaran MICE yang intensif untuk pertumbuhannya di masa depan.
Gambar 3: Penjualan MICE (dalam Rp miliar)
Sumber:PT Multi Indocitra Tbk., Estimasi Pefindo- Equity & Index Valuation Division
221244
308340
410
514
-
100
200
300
400
500
600
2006 2007 2008 2009 2010P 2011P
CAGR 18.4%
KEUANGAN
2 Desember 2010 Halaman ke 3 dari 8 halaman
Multi Indocitra, Tbk
“Pernyataan disclaimer pada halaman akhir merupakan bagian yang tidak terpisahkan dari dokumen ini” www.pefindo.com
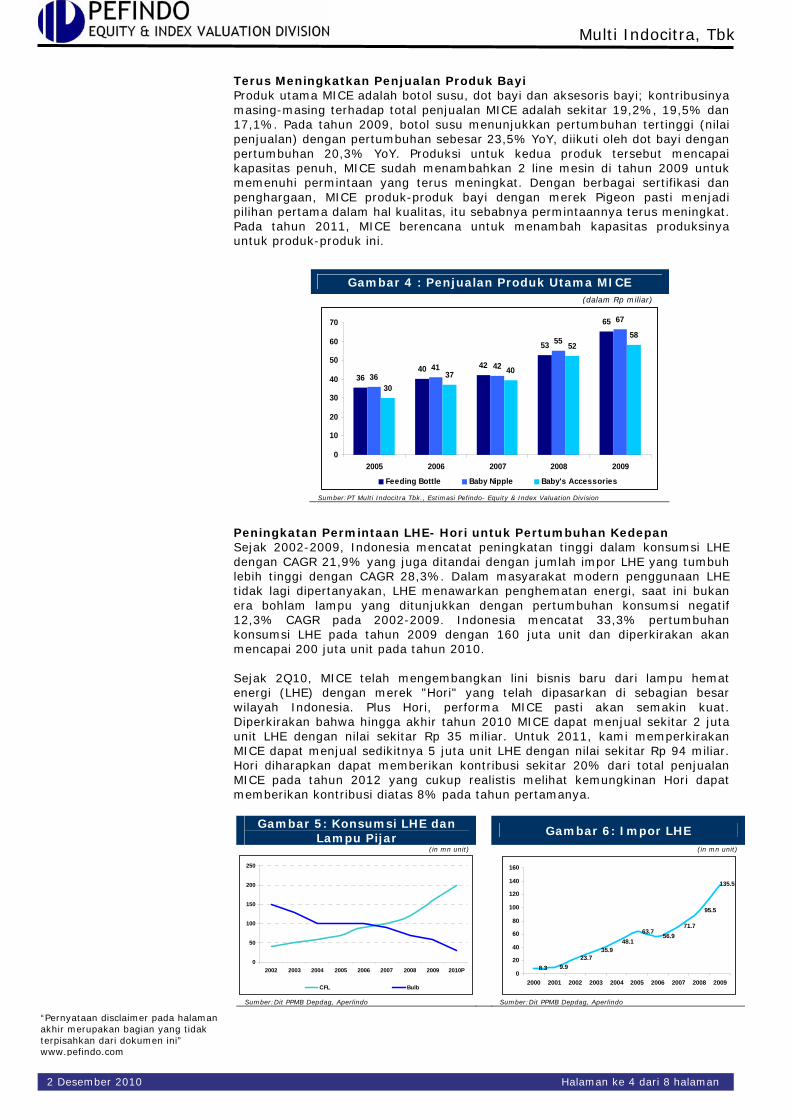
Terus Meningkatkan Penjualan Produk Bayi Produk utama MICE adalah botol susu, dot bayi dan aksesoris bayi; kontribusinya masing-masing terhadap total penjualan MICE adalah sekitar 19,2%, 19,5% dan 17,1%. Pada tahun 2009, botol susu menunjukkan pertumbuhan tertinggi (nilai penjualan) dengan pertumbuhan sebesar 23,5% YoY, diikuti oleh dot bayi dengan pertumbuhan 20,3% YoY. Produksi untuk kedua produk tersebut mencapai kapasitas penuh, MICE sudah menambahkan 2 line mesin di tahun 2009 untuk memenuhi permintaan yang terus meningkat. Dengan berbagai sertifikasi dan penghargaan, MICE produk-produk bayi dengan merek Pigeon pasti menjadi pilihan pertama dalam hal kualitas, itu sebabnya permintaannya terus meningkat. Pada tahun 2011, MICE berencana untuk menambah kapasitas produksinya untuk produk-produk ini.
Gambar 4 : Penjualan Produk Utama MICE (dalam Rp miliar)
3640 42
53
65
3641 42
55
67
3037 40
5258
0
10
20
30
40
50
60
70
2005 2006 2007 2008 2009
Feeding Bottle Baby Nipple Baby's Accessories
Sumber:PT Multi Indocitra Tbk., Estimasi Pefindo- Equity & Index Valuation Division
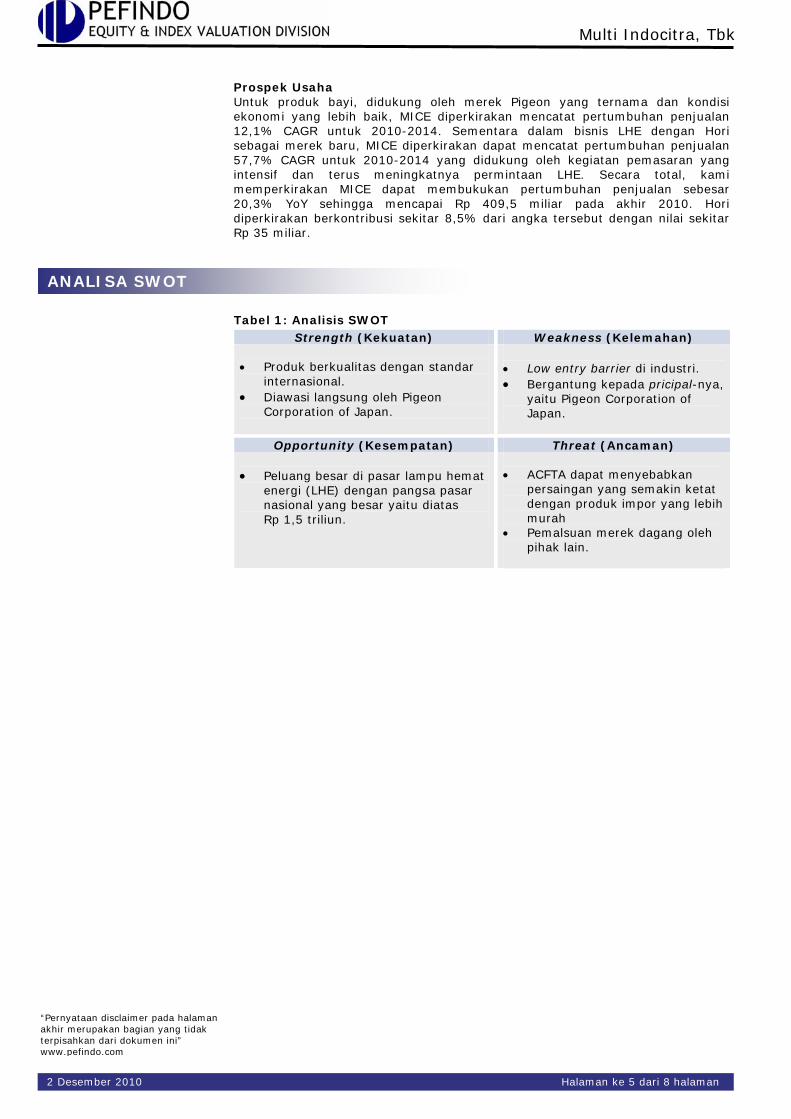
Peningkatan Permintaan LHE- Hori untuk Pertumbuhan Kedepan Sejak 2002-2009, Indonesia mencatat peningkatan tinggi dalam konsumsi LHE dengan CAGR 21,9% yang juga ditandai dengan jumlah impor LHE yang tumbuh lebih tinggi dengan CAGR 28,3%. Dalam masyarakat modern penggunaan LHE tidak lagi dipertanyakan, LHE menawarkan penghematan energi, saat ini bukan era bohlam lampu yang ditunjukkan dengan pertumbuhan konsumsi negatif 12,3% CAGR pada 2002-2009. Indonesia mencatat 33,3% pertumbuhan konsumsi LHE pada tahun 2009 dengan 160 juta unit dan diperkirakan akan mencapai 200 juta unit pada tahun 2010. Sejak 2Q10, MICE telah mengembangkan lini bisnis baru dari lampu hemat energi (LHE) dengan merek "Hori" yang telah dipasarkan di sebagian besar wilayah Indonesia. Plus Hori, performa MICE pasti akan semakin kuat. Diperkirakan bahwa hingga akhir tahun 2010 MICE dapat menjual sekitar 2 juta unit LHE dengan nilai sekitar Rp 35 miliar. Untuk 2011, kami memperkirakan MICE dapat menjual sedikitnya 5 juta unit LHE dengan nilai sekitar Rp 94 miliar. Hori diharapkan dapat memberikan kontribusi sekitar 20% dari total penjualan MICE pada tahun 2012 yang cukup realistis melihat kemungkinan Hori dapat memberikan kontribusi diatas 8% pada tahun pertamanya.
Gambar 5: Konsumsi LHE dan Lampu Pijar
Gambar 6: Impor LHE
(in mn unit) (in mn unit)
0
50
100
150
200
250
2002 2003 2004 2005 2006 2007 2008 2009 2010P
CFL Bulb
8.3 9.923.7
35.948.1
63.756.9
71.7
95.5
135.5
0
20
40
60
80
100
120
140
160
2000 2001 2002 2003 2004 2005 2006 2007 2008 2009
Sumber:Dit PPMB Depdag, Aperlindo Sumber:Dit PPMB Depdag, Aperlindo
2 Desember 2010 Halaman ke 4 dari 8 halaman
Multi Indocitra, Tbk
“Pernyataan disclaimer pada halaman akhir merupakan bagian yang tidak terpisahkan dari dokumen ini” www.pefindo.com
Prospek Usaha Untuk produk bayi, didukung oleh merek Pigeon yang ternama dan kondisi ekonomi yang lebih baik, MICE diperkirakan mencatat pertumbuhan penjualan 12,1% CAGR untuk 2010-2014. Sementara dalam bisnis LHE dengan Hori sebagai merek baru, MICE diperkirakan dapat mencatat pertumbuhan penjualan 57,7% CAGR untuk 2010-2014 yang didukung oleh kegiatan pemasaran yang intensif dan terus meningkatnya permintaan LHE. Secara total, kami memperkirakan MICE dapat membukukan pertumbuhan penjualan sebesar 20,3% YoY sehingga mencapai Rp 409,5 miliar pada akhir 2010. Hori diperkirakan berkontribusi sekitar 8,5% dari angka tersebut dengan nilai sekitar Rp 35 miliar.
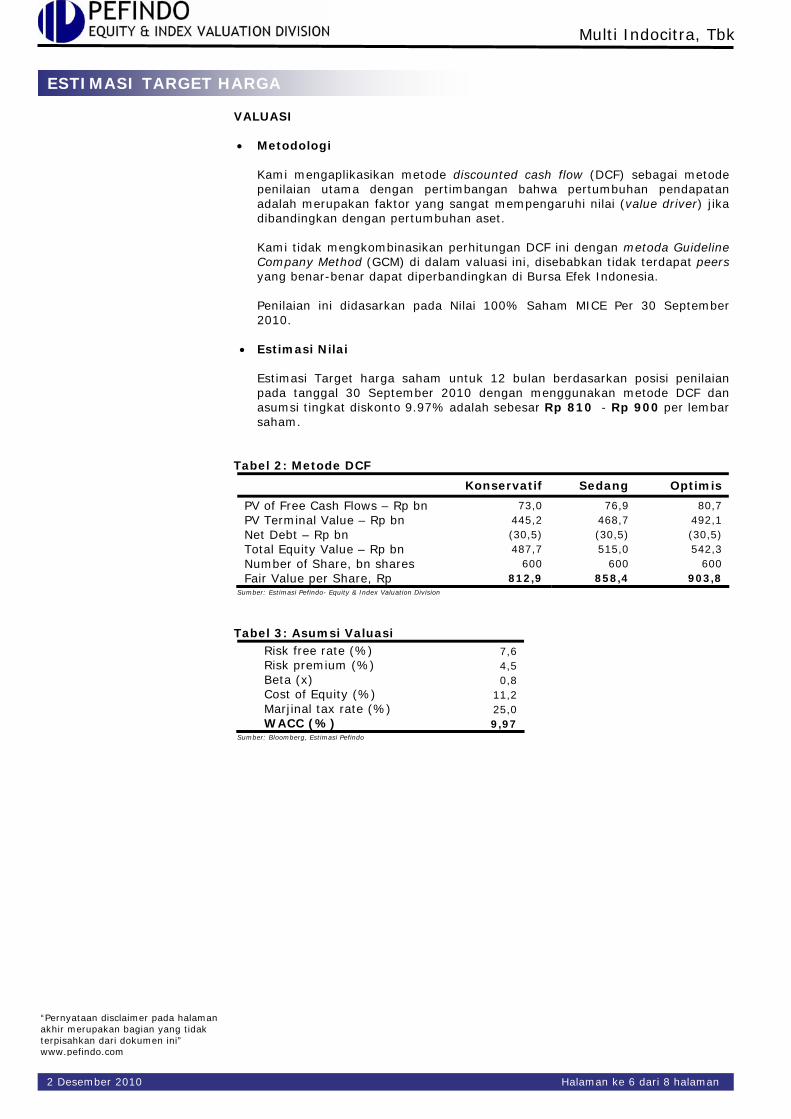
ANALISA SWOT Tabel 1: Analisis SWOT
Strength (Kekuatan) Weakness (Kelemahan) • Produk berkualitas dengan standar
internasional. • Diawasi langsung oleh Pigeon
Corporation of Japan.
• Low entry barrier di industri. • Bergantung kepada pricipal-nya,
yaitu Pigeon Corporation of Japan.
Opportunity (Kesempatan) Threat (Ancaman) • Peluang besar di pasar lampu hemat
energi (LHE) dengan pangsa pasar nasional yang besar yaitu diatas Rp 1,5 triliun.
• ACFTA dapat menyebabkan
persaingan yang semakin ketat dengan produk impor yang lebih murah
• Pemalsuan merek dagang oleh pihak lain.
2 Desember 2010 Halaman ke 5 dari 8 halaman
Multi Indocitra, Tbk
“Pernyataan disclaimer pada halaman akhir merupakan bagian yang tidak terpisahkan dari dokumen ini” www.pefindo.com
ESTIMASI TARGET HARGA
VALUASI
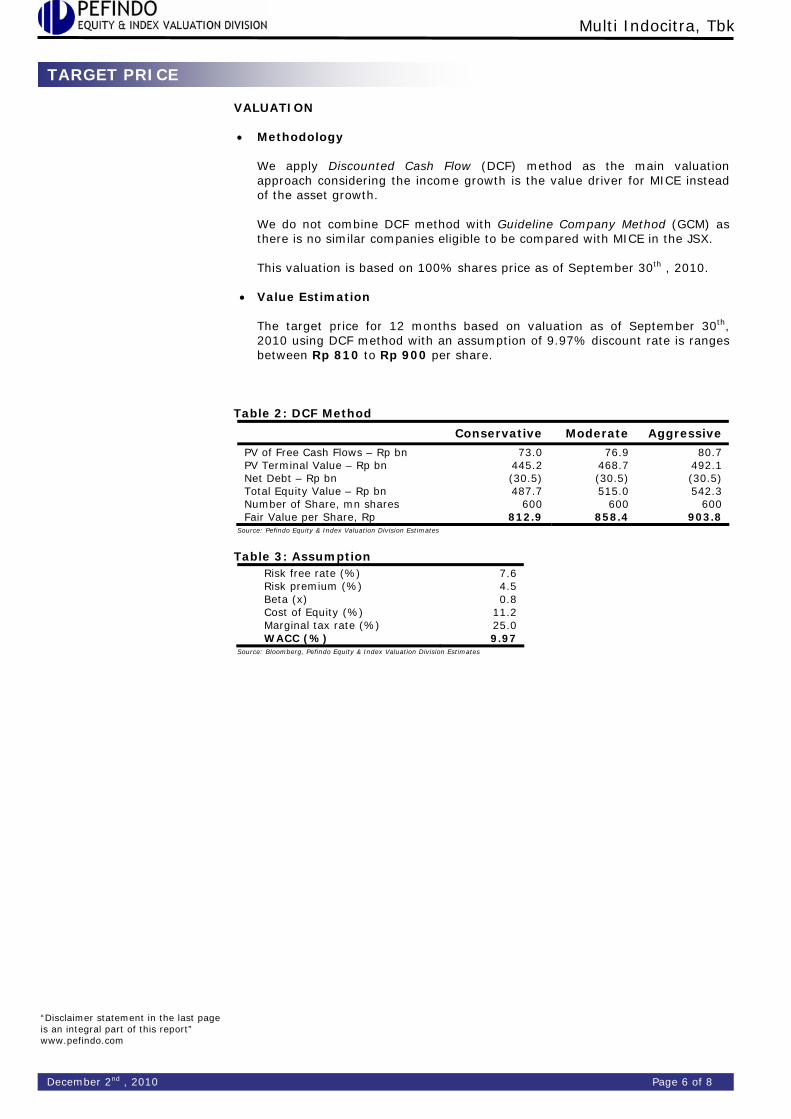
• Metodologi Kami mengaplikasikan metode discounted cash flow (DCF) sebagai metode penilaian utama dengan pertimbangan bahwa pertumbuhan pendapatan adalah merupakan faktor yang sangat mempengaruhi nilai (value driver) jika dibandingkan dengan pertumbuhan aset. Kami tidak mengkombinasikan perhitungan DCF ini dengan metoda Guideline Company Method (GCM) di dalam valuasi ini, disebabkan tidak terdapat peers yang benar-benar dapat diperbandingkan di Bursa Efek Indonesia. Penilaian ini didasarkan pada Nilai 100% Saham MICE Per 30 September 2010.
• Estimasi Nilai
Estimasi Target harga saham untuk 12 bulan berdasarkan posisi penilaian pada tanggal 30 September 2010 dengan menggunakan metode DCF dan asumsi tingkat diskonto 9.97% adalah sebesar Rp 810 - Rp 900 per lembar saham.
Tabel 2: Metode DCF
Konservatif Sedang Optimis
PV of Free Cash Flows – Rp bn 73,0 76,9 80,7 PV Terminal Value – Rp bn 445,2 468,7 492,1 Net Debt – Rp bn (30,5) (30,5) (30,5) Total Equity Value – Rp bn 487,7 515,0 542,3 Number of Share, bn shares 600 600 600 Fair Value per Share, Rp 812,9 858,4 903,8
Sumber: Estimasi Pefindo- Equity & Index Valuation Division
Tabel 3: Asumsi Valuasi
Risk free rate (%) 7,6 Risk premium (%) 4,5 Beta (x) 0,8 Cost of Equity (%) 11,2 Marjinal tax rate (%) 25,0 WACC (%) 9,97
Sumber: Bloomberg, Estimasi Pefindo
2 Desember 2010 Halaman ke 6 dari 8 halaman
“Pernyataan disclaimer pada halaman akhir merupakan bagian yang tidak terpisahkan dari dokumen ini” www.pefindo.com
Multi Indocitra, Tbk
2 Desember 2010 Halaman ke 7 dari 8 halaman
(dalam Rp miliar)
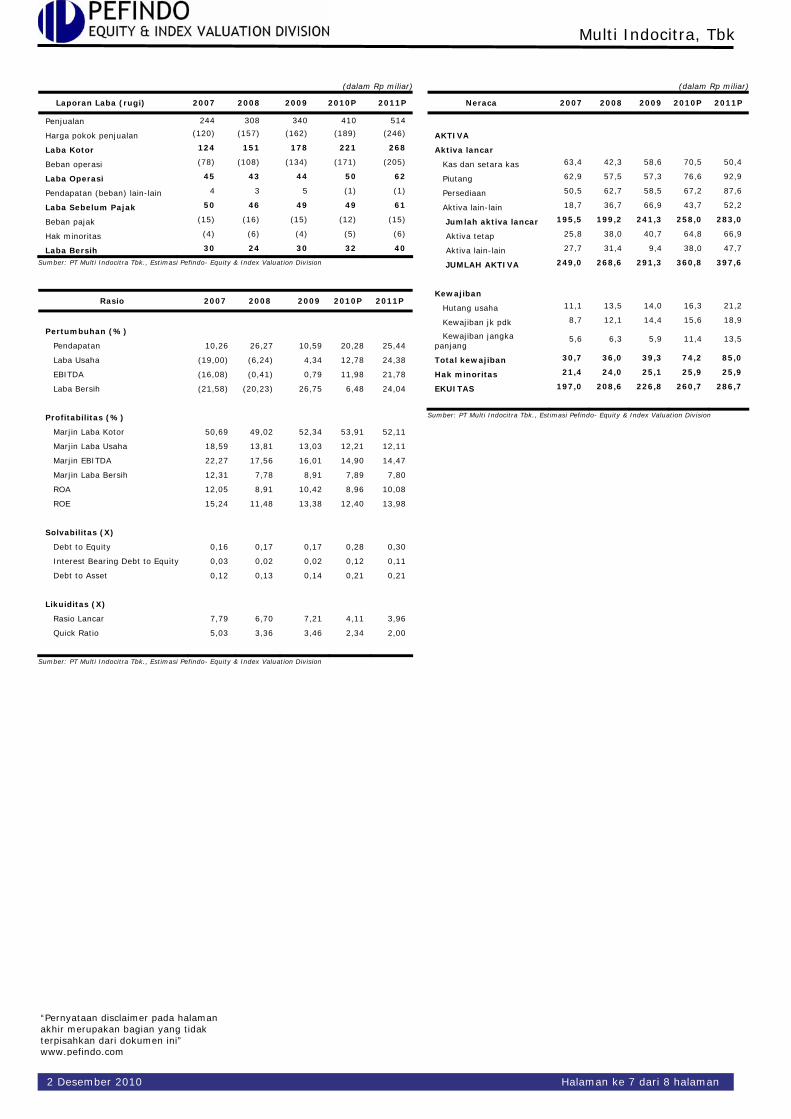
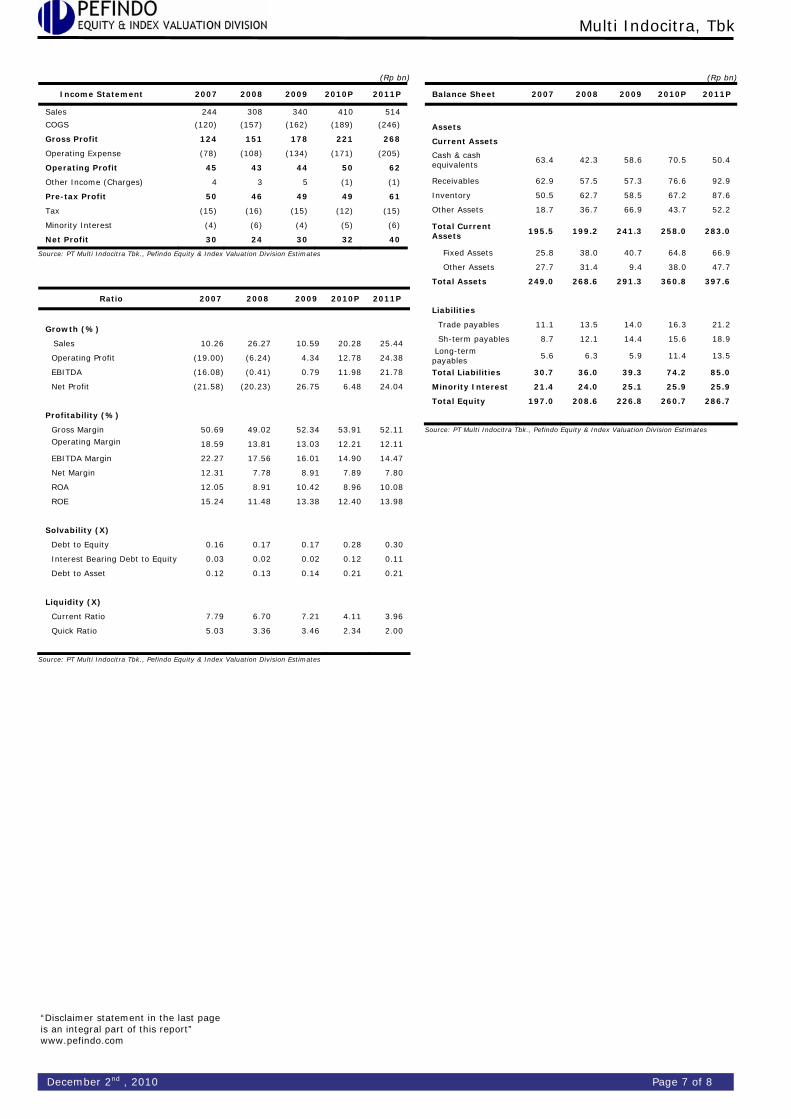
Laporan Laba (rugi) 2007 2008 2009 2010P 2011P
Penjualan 244 308 340 410 514
Harga pokok penjualan (120) (157) (162) (189) (246)
Laba Kotor 124 151 178 221 268
Beban operasi (78) (108) (134) (171) (205)
Laba Operasi 45 43 44 50 62
Pendapatan (beban) lain-lain 4 3 5 (1) (1)
Laba Sebelum Pajak 50 46 49 49 61
Beban pajak (15) (16) (15) (12) (15)
Hak minoritas (4) (6) (4) (5) (6)
Laba Bersih 30 24 30 32 40
Sumber: PT Multi Indocitra Tbk., Estimasi Pefindo- Equity & Index Valuation Division
Rasio 2007 2008 2009 2010P 2011P
Pertumbuhan (%)
Pendapatan 10,26 26,27 10,59 20,28 25,44
Laba Usaha (19,00) (6,24) 4,34 12,78 24,38
EBITDA (16,08) (0,41) 0,79 11,98 21,78
Laba Bersih (21,58) (20,23) 26,75 6,48 24,04
Profitabilitas (%)
Marjin Laba Kotor 50,69 49,02 52,34 53,91 52,11
Marjin Laba Usaha 18,59 13,81 13,03 12,21 12,11
Marjin EBITDA 22,27 17,56 16,01 14,90 14,47
Marjin Laba Bersih 12,31 7,78 8,91 7,89 7,80
ROA 12,05 8,91 10,42 8,96 10,08
ROE 15,24 11,48 13,38 12,40 13,98
Solvabilitas (X)
Debt to Equity 0,16 0,17 0,17 0,28 0,30
Interest Bearing Debt to Equity 0,03 0,02 0,02 0,12 0,11
Debt to Asset 0,12 0,13 0,14 0,21 0,21
Likuiditas (X)
Rasio Lancar 7,79 6,70 7,21 4,11 3,96
Quick Ratio 5,03 3,36 3,46 2,34 2,00
Sumber: PT Multi Indocitra Tbk., Estimasi Pefindo- Equity & Index Valuation Division
(dalam Rp miliar) Neraca 2007 2008 2009 2010P 2011P
AKTIVA
Aktiva lancar
Kas dan setara kas 63,4 42,3 58,6 70,5 50,4
Piutang 62,9 57,5 57,3 76,6 92,9
Persediaan 50,5 62,7 58,5 67,2 87,6
Aktiva lain-lain 18,7 36,7 66,9 43,7 52,2
Jumlah aktiva lancar 195,5 199,2 241,3 258,0 283,0
Aktiva tetap 25,8 38,0 40,7 64,8 66,9
Aktiva lain-lain 27,7 31,4 9,4 38,0 47,7
JUMLAH AKTIVA 249,0 268,6 291,3 360,8 397,6
Kewajiban
Hutang usaha 11,1 13,5 14,0 16,3 21,2
Kewajiban jk pdk 8,7 12,1 14,4 15,6 18,9
Kewajiban jangka panjang
5,6 6,3 5,9 11,4 13,5
Total kewajiban 30,7 36,0 39,3 74,2 85,0
Hak minoritas 21,4 24,0 25,1 25,9 25,9
EKUITAS 197,0 208,6 226,8 260,7 286,7
Sumber: PT Multi Indocitra Tbk., Estimasi Pefindo- Equity & Index Valuation Division
Multi Indocitra, Tbk
“Pernyataan disclaimer pada halaman akhir merupakan bagian yang tidak terpisahkan dari dokumen ini” www.pefindo.com
DISCLAIMER
Laporan ini dibuat berdasarkan sumber-sumber yang kami anggap terpercaya dan dapat diandalkan. Namun kami tidak menjamin kelengkapan, keakuratan atau kecukupannya. Dengan demikian kami tidak bertanggung jawab atas segala keputusan investasi yang diambil berdasarkan laporan ini. Adapun asumsi, opini, dan perkiraan merupakan hasil dari pertimbangan internal kami per tanggal penilaian (cut off date), dan kami dapat mengubah pertimbangan diatas sewaktu-waktu tanpa pemberitahuan terlebih dahulu. Kami tidak bertanggung jawab atas kekeliruan atau kelalaian yang terjadi akibat penggunaan laporan ini. Kinerja dimasa lalu tidak selalu dapat dijadikan acuan hasil masa depan. Laporan ini bukan merupakan rekomendasi penawaran, pembelian atau menahan suatu saham tertentu. Laporan ini mungkin tidak sesuai untuk beberapa investor. Seluruh opini dalam laporan ini telah disampaikan dengan itikad baik, namun sewaktu-waktu dapat berubah tanpa pemberitahuan terlebih dahulu, dan disajikan dengan benar per tanggal diterbitkan laporan ini. Harga, nilai, atau pendapatan dari setiap saham Perseroan yang disajikan dalam laporan ini kemungkinan dapat lebih rendah dari harapan pemodal, dan pemodal juga mungkin mendapatkan pengembalian yang lebih rendah dari nilai investasi yang ditanamkan. Investasi didefinisikan sebagai pendapatan yang kemungkinan besar diterima dimasa depan, namun nilai dari pendapatan yang akan diterima tersebut kemungkinan besar juga akan berfluktuasi. Untuk saham Perseroan yang penyajian laporan keuangannya didenominasi dalam mata uang selain Rupiah, perubahan nilai tukar mata uang tersebut kemungkinan dapat menurunkan nilai, harga, atau pendapatan investasi pemodal. Informasi dalam laporan ini bukan merupakan pertimbangan pajak dalam mengambil suatu keputusan investasi. Target harga saham dalam Laporan ini merupakan nilai fundamental, bukan merupakan Nilai Pasar Wajar, dan bukan merupakan harga acuan transaksi yang diwajibkan oleh peraturan perundang-undangan yang berlaku. Laporan target harga saham yang diterbitkan oleh Pefindo Divisi Valuasi Saham dan Indexing bukan merupakan rekomendasi untuk membeli, menjual, atau menahan suatu saham tertentu, dan tidak dapat dianggap sebagai nasehat investasi oleh Pefindo Divisi Valuasi Saham dan Indexing yang behubungan dengan cakupan Jasa Pefindo kepada, atau kaitannya kepada, beberapa pihak, termasuk emiten, penasehat keuangan, pialang saham, investment banks, institusi keuangan dan perantara keuangan, dalam kaitannya menerima imbalan atau keuntungan lainnya dari pihak tersebut, Laporan ini tidak ditujukan untuk pemodal tertentu dan tidak dapat dijadikan bagian dari tujuan investasi terhadap suatu saham dan juga bukan merupakan rekomendasi investasi terhadap suatu saham tertentu atau suatu strategi investasi. Sebelum melakukan tindakan dari hasil laporan ini, pemodal disarankan untuk mempertimbangkan terlebih dahulu kesesuaian situasi dan kondisi dan, jika dibutuhkan, mintalah bantuan penasehat keuangan. PEFINDO memisahkan kegiatan Valuasi Saham dengan kegiatan Pemeringkatan untuk menjaga independensi dan objektivitas dari proses dan produk kegiatan analitis. PEFINDO telah menetapkan kebijakan dan prosedur untuk menjaga kerahasiaan informasi non-publik tertentu yang diterima sehubungan dengan proses analitis. Keseluruhan proses, metodologi dan databse yang digunakan dalam penyusunan Laporan Target Harga Referensi Saham ini secara keseluruhan adalah berbeda dengan proses, metodologi dan database yang digunakan PEFINDO dalam melakukan pemeringkatan. Laporan ini dibuat dan disiapkan Pefindo Divisi Valuasi Saham & Indexing dengan tujuan untuk meningkatkan transparansi harga saham yang tercatat di Bursa Efek Indonesia. Laporan ini juga bebas dari pengaruh tekanan atau paksaan dari Bursa maupun Perseroan yang dinilai. Laporan ini bersifat unsolicited berdasarkan penugasan dari Bursa Efek Indonesia, dimana Pefindo Divisi Valuasi Saham & Indexing akan menerima imbalan sebesar Rp.20.000.000,- dari Bursa Efek Indonesia untuk 2 (dua) kali pelaporan per tahun. Untuk keterangan lebih lanjut, dapat mengunjungi website kami di http://www.pefindo.com Laporan ini dibuat dan disiapkan oleh Pefindo Divisi Valuasi Saham dan Indexing. Di Indonesia Laporan ini dipublikasikan pada website kami dan juga pada website Bursa Efek Indonesia.
2 Desember 2010 Halaman ke 8 dari 8 halaman

Multi Indocitra, Tbk Primary Report
Equity Valuation
December 2nd , 2010
Target Price
Low High 810 900
Distribution
Contact: Equity & Index Valuation Division Phone: (6221) 5210077 [email protected] “Disclaimer statement in the last page is an integral part of this report” www.pefindo.com
Historical Chart
2000
2250
2500
2750
3000
3250
3500
3750
Sep-09 Nov-09 Jan-10 Mar-10 Jun-10 Aug-10 Oct-10200
250
300
350
400
450
500
550
600JCIMICE
Source : Bloomberg
Stock Information Rp
Ticker code MICE
Market price as of December 1st 2010 410
Market price – 52 week high 570
Market price – 52 week low 240
Market cap – 52 week high (bn) 342
Market cap – 52 week low (bn) 144
Shareholders (%)
PT Buana Graha Utama 60.44
HSBC-Fund Services Client A/C 500 8.80
The Northern Trust Co, Ldv S/A 6.94
Surono Subekti 6.22
Thomas Surjadi Linggodigdo 0.00
Public 17.60
Well Known with “Pigeon” PT Multi Indocitra Tbk, (“MICE”) established on 11 January 1990 with the objectives to distribute health care products and accessories for the needs of baby, pregnant and breast feeding mother and skin care products which well known with “Pigeon” brand. MICE have 1 (one) branch in Surabaya, while the products are manufactured in a modern factory located in Cikande, Banten. MICE target customers for the direct selling activities are hypermarket, supermarket, mini market and small retailers (home retailer). Currently MICE have developed business line of compact fluorescent lamp (CFL) with “Hori” brand that has been started to market in most areas of Indonesia. At third quarter of 2010, MICE already have 98 distributors, which 64 for Pigeon and the rest 34 for Hori. Market Leader in Baby Products In 2005 to 2009, MICE’s main product which are feeding bottle and baby nipple of “Pigeon” continually dominate the market with above 50% market share based on sales value. Since 2005-2009, MICE sales have well increase with about CAGR 15%. Last year, MICE booked 10.6% YoY sales growth with Rp 340.5 bn figure in FY09. In 3Q10, MICE sales already reach Rp 306.4 bn or around 90% of FY09 figure, its about 21.8% YoY increase. These positive figures manifest MICE’s position in the baby products market with their well known brand “Pigeon”. Breakthrough Diversification with “Hori” Since 2Q10, MICE have developed a new business line of compact fluorescent lamp (CFL) with “Hori” brand that has been started to market in most areas of Indonesia. Its kind a breakthrough since MICE already well known with its single brand of Pigeon. Plus Hori, MICE’s performances will definitely getting stronger. Based on recently performance, MICE is estimated to sell around 2 mn Hori lamp by the end of 2010 with total value at least reaching Rp 35 bn figure. Business Prospects In baby products, supported by strong Pigeon brand and better economic condition, MICE is estimated to booked CAGR 12.1% sales growth from 2010-2014. While in CFL business with Hori as a new brand, MICE is estimated to booked CAGR 57.7% sales growth from 2010-2014 which supported by MICE’s intensive marketing effort and keep increasing CFL demand. In total, we estimate MICE to booked 20.3% YoY of revenue growth to reach Rp 409.5 bn in the end of 2010. Hori is estimated to contribute about 8.5% of that figure with around Rp 35 bn.
2007 2008 2009 2010P 2011P
Revenue (Rp bn) 244 308 340 410 514
Pre-tax Profit (Rp bn) 50 46 49 49 61
Net Profit (Rp bn) 30 24 30 32 40
EPS (Rp) 50.0 39.9 50.6 53.9 66.8
EPS Growth (%) (21.6) (20.2) 26.7 6.5 24.0
P/E (x) 8.6 10.8 8.5 8.0 6.4
PBV (x) 1.3 1.2 1.1 1.0 0.9 Source:PT Multi IndocitraTbk., Pefindo Equity & Index Valuation Division Estimates
Page 1 of 8
“Disclaimer statement in the last page is an integral part of this report” www.pefindo.com
Multi Indocitra, Tbk
Company Profile PT Multi Indocitra Tbk, (“MICE”) established on 11 January 1990 with the objectives to distribute health care products and accessories for the needs of baby, pregnant and breast feeding mother and skin care products. Accessories product for baby, kid, pregnant and breast feeding mother are produced by MICE’s subsidiary, PT. Pigeon Indonesia (“PI”), which produces feeding bottle, silicon nipple with “Pigeon” brand. Whereas, skin care products were produces by MICE’s other subsidiary, PT. Multielok Cosmetic (“MC”) that produces powder, shampoo, liquid soap for baby, kid and teenager. MICE have 1 (one) branch in Surabaya, the products are manufactured in a modern factory located in Cikande, Banten. MICE target customers for the direct selling activities are hypermarket, supermarket, mini market and small retailers (home retailer).
Figure 1 : Some of MICE’s products
Source: PT Multi Indocitra Tbk, Pefindo Equity & Index Valuation Division
National Coverage Distributor MICE have 2 (two) main distribution centers that are in Jakarta and Surabaya. By having these 2 main distribution centers, the distribution activities can be more efficient and faster to reach the target market. In order to expand its marketing coverage for the products, MICE appoints third party as agents. With these resources that MICE have, its products are available at almost all areas in Indonesia. As of September 2010, MICE have 64 distributors for Pigeon.
Figure 2 : MICE’s Distribution Coverage Area
Source: PT Multi Indocitra Tbk, Pefindo Equity & Index Valuation Division
BUSINESS INFORMATION
December 2nd , 2010 Page 2 of 8
“Disclaimer statement in the last page is an integral part of this report” www.pefindo.com
Multi Indocitra, Tbk
Reliable High-quality Products Some of the products distributed by MICE are the market leader, especially the feeding bottle and baby nipple. The manufacturing of Pigeon products, which is carried out by the subsidiary and affiliated Company, have been carefully checked for its quality to make sure that the quality standard which is stipulated by Pigeon Corporation of Japan are followed. The Japanese Company is usually known for its stringent supervision. MICE’s subsidiaries, MC and PI, have passed some certifications, namely: Certification AS/NZS ISO 9001:2000 from SAI Global Limited Australia, Certification for Good Manufacturing Process (GMP) from the Indonesian Medicines and Foods Supervisory Body for MC and Certification AS/NZS ISO 9001:2000 from SAI Global Limited Australia for PI. Diversified with Compact Lamp Currently MICE have developed business line of compact fluorescent lamp with “Hori” brand that has been started to market in most areas of Indonesia. For this Hori lamp, at third quarter 2010, MICE already have owned 34 distributors which spread in Java, Sumatra and Kalimantan areas. With intensive marketing effort, MICE is estimated to sell around 2 mn Hori lamp by the end of 2010. Subsidiaries and Associated Companies In running its business, MICE is supported by several companies as follows:
1. PT. Multielok Cosmetic (“MC”), a subsidiary (ownership 99.99%), manufacturing of toiletries products.
2. PT. Pigeon Indonesia (“PI”), a subsidiary (indirectly owned through MC about 65%), is engaged in manufacturing plastics and rubber products with "Pigeon" brand.
FINANCE
3Q10: Intensive Marketing for More Growth MICE booked 10.6% YoY sales growth in 2009, and its increase to 21.8% YoY to reach Rp 306.4 bn in 3Q10. The sales figure in 3Q10 is a reflection of MICE’s intensive marketing to pump-up their sales. In 3Q10, MICE marketing expense is increase about 56.3% YoY to reach Rp 51.3 bn which mainly to support its new business line of compact fluorescent lamp (CFL) named “Hori”. MICE’s production efficiency also showed its effect in 3Q10, they success to reduce COGS from 48.5% to 45.5%, so they booked better gross margin of 54.5% compared to 51.5% in 3Q09. However, its marketing expense had cut the operating margin, it actually declined compared to the previous year, they booked operating margin of 13.8% compared to 15.2% in 3Q09. So it can be note that the principal driver of operating margin decrease in 3Q10 wasn’t an issue, which manifests MICE intensive marketing strategy for future growth.
Figure 3: MICE Sales (in Rp bn)
Source:PT Multi Indocitra Tbk., Pefindo Equity & Index Valuation Division estimate
221244
308340
410
514
-
100
200
300
400
500
600
2006 2007 2008 2009 2010P 2011P
CAGR 18.4%
December 2nd , 2010 Page 3 of 8
“Disclaimer statement in the last page is an integral part of this report” www.pefindo.com
Multi Indocitra, Tbk
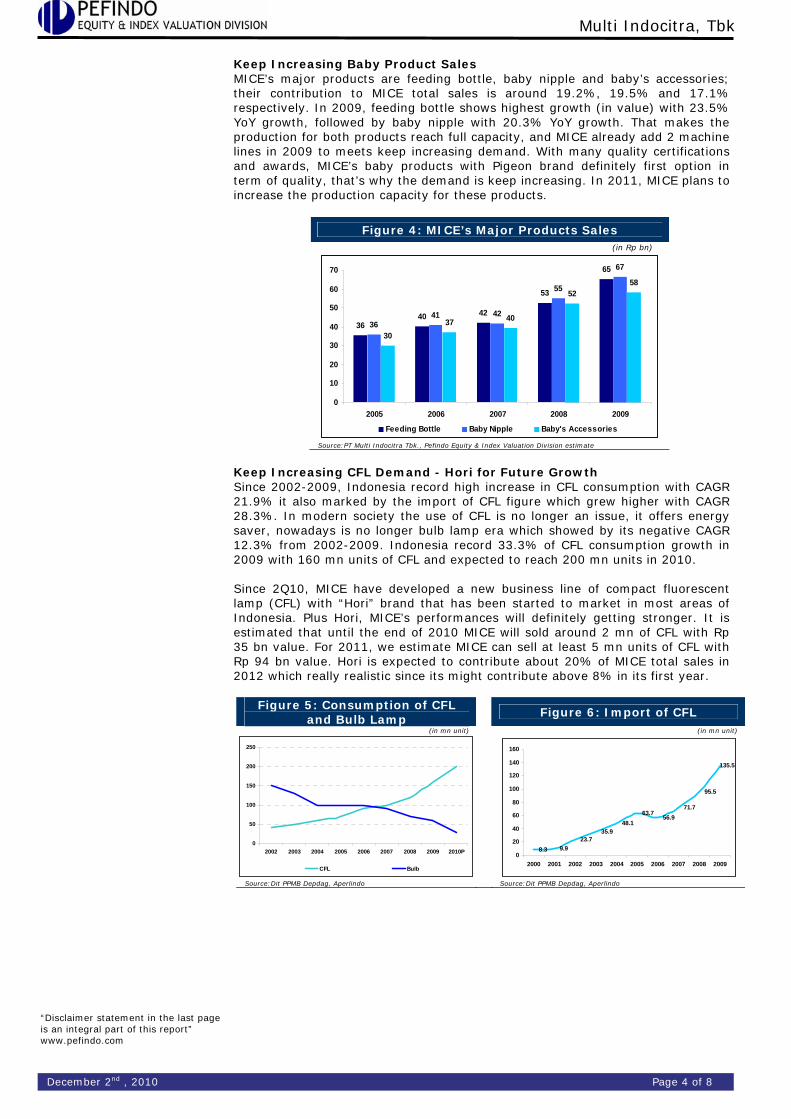
Keep Increasing Baby Product Sales MICE’s major products are feeding bottle, baby nipple and baby’s accessories; their contribution to MICE total sales is around 19.2%, 19.5% and 17.1% respectively. In 2009, feeding bottle shows highest growth (in value) with 23.5% YoY growth, followed by baby nipple with 20.3% YoY growth. That makes the production for both products reach full capacity, and MICE already add 2 machine lines in 2009 to meets keep increasing demand. With many quality certifications and awards, MICE’s baby products with Pigeon brand definitely first option in term of quality, that’s why the demand is keep increasing. In 2011, MICE plans to increase the production capacity for these products.
Figure 4: MICE’s Major Products Sales (in Rp bn)
3640 42
53
65
3641 42
55
67
3037 40
5258
0
10
20
30
40
50
60
70
2005 2006 2007 2008 2009
Feeding Bottle Baby Nipple Baby's Accessories
Source:PT Multi Indocitra Tbk., Pefindo Equity & Index Valuation Division estimate
Keep Increasing CFL Demand - Hori for Future Growth Since 2002-2009, Indonesia record high increase in CFL consumption with CAGR 21.9% it also marked by the import of CFL figure which grew higher with CAGR 28.3%. In modern society the use of CFL is no longer an issue, it offers energy saver, nowadays is no longer bulb lamp era which showed by its negative CAGR 12.3% from 2002-2009. Indonesia record 33.3% of CFL consumption growth in 2009 with 160 mn units of CFL and expected to reach 200 mn units in 2010. Since 2Q10, MICE have developed a new business line of compact fluorescent lamp (CFL) with “Hori” brand that has been started to market in most areas of Indonesia. Plus Hori, MICE’s performances will definitely getting stronger. It is estimated that until the end of 2010 MICE will sold around 2 mn of CFL with Rp 35 bn value. For 2011, we estimate MICE can sell at least 5 mn units of CFL with Rp 94 bn value. Hori is expected to contribute about 20% of MICE total sales in 2012 which really realistic since its might contribute above 8% in its first year.
Figure 5: Consumption of CFL and Bulb Lamp
Figure 6: Import of CFL
(in mn unit) (in mn unit)
0
50
100
150
200
250
2002 2003 2004 2005 2006 2007 2008 2009 2010P
CFL Bulb
8.3 9.923.7
35.948.1
63.756.9
71.7
95.5
135.5
0
20
40
60
80
100
120
140
160
2000 2001 2002 2003 2004 2005 2006 2007 2008 2009
Source:Dit PPMB Depdag, Aperlindo Source:Dit PPMB Depdag, Aperlindo
December 2nd , 2010 Page 4 of 8

“Disclaimer statement in the last page is an integral part of this report” www.pefindo.com
Multi Indocitra, Tbk
Business Outlook In baby products, supported by strong Pigeon brand and better economic condition, MICE is estimated to booked CAGR 12.1% sales growth from 2010-2014. While Hori, as a new brand, is estimated to booked CAGR 57.7% sales growth from 2010-2014, it supported by MICE’s intensive marketing effort and keep increasing CFL demand. We estimate MICE to booked 20.3% YoY of revenue growth to reach Rp 409.5 bn. Hori is estimated to contribute about 8.5% of that figure with around Rp 35 bn.
SWOT ANALYSIS
Table 1: SWOT Analysis
Strength Weakness • High quality product with
international standard. • Supervised by Pigeon Corporation
of Japan.
• Low entry barrier. • Dependence to its main
principal, namely Pigeon Corporation of Japan.
Opportunity Threat
• Big opportunity in compact
fluorescent lamp market with big national market which above Rp 1.5 tn.
• ACFTA might cause tighter
competition with lower price imported product.
• Fraudulent act by other parties.
December 2nd , 2010 Page 5 of 8
“Disclaimer statement in the last page is an integral part of this report” www.pefindo.com
Multi Indocitra, Tbk
TARGET PRICE
VALUATION • Methodology
We apply Discounted Cash Flow (DCF) method as the main valuation approach considering the income growth is the value driver for MICE instead of the asset growth. We do not combine DCF method with Guideline Company Method (GCM) as there is no similar companies eligible to be compared with MICE in the JSX. This valuation is based on 100% shares price as of September 30th , 2010.
• Value Estimation
The target price for 12 months based on valuation as of September 30th, 2010 using DCF method with an assumption of 9.97% discount rate is ranges between Rp 810 to Rp 900 per share.
Table 2: DCF Method
Conservative Moderate Aggressive
PV of Free Cash Flows – Rp bn 73.0 76.9 80.7 PV Terminal Value – Rp bn 445.2 468.7 492.1 Net Debt – Rp bn (30.5) (30.5) (30.5) Total Equity Value – Rp bn 487.7 515.0 542.3 Number of Share, mn shares 600 600 600 Fair Value per Share, Rp 812.9 858.4 903.8
Source: Pefindo Equity & Index Valuation Division Estimates
Table 3: Assumption
Risk free rate (%) 7.6 Risk premium (%) 4.5 Beta (x) 0.8 Cost of Equity (%) 11.2 Marginal tax rate (%) 25.0 WACC (%) 9.97
Source: Bloomberg, Pefindo Equity & Index Valuation Division Estimates
December 2nd , 2010 Page 6 of 8
“Disclaimer statement in the last page is an integral part of this report” www.pefindo.com
Multi Indocitra, Tbk
December 2nd , 2010 Page 7 of 8
(Rp bn)
Income Statement 2007 2008 2009 2010P 2011P
Sales 244 308 340 410 514
COGS (120) (157) (162) (189) (246)
Gross Profit 124 151 178 221 268
Operating Expense (78) (108) (134) (171) (205)
Operating Profit 45 43 44 50 62
Other Income (Charges) 4 3 5 (1) (1)
Pre-tax Profit 50 46 49 49 61
Tax (15) (16) (15) (12) (15)
Minority Interest (4) (6) (4) (5) (6)
Net Profit 30 24 30 32 40
Source: PT Multi Indocitra Tbk., Pefindo Equity & Index Valuation Division Estimates
Ratio 2007 2008 2009 2010P 2011P
Growth (%)
Sales 10.26 26.27 10.59 20.28 25.44
Operating Profit (19.00) (6.24) 4.34 12.78 24.38
EBITDA (16.08) (0.41) 0.79 11.98 21.78
Net Profit (21.58) (20.23) 26.75 6.48 24.04
Profitability (%)
Gross Margin 50.69 49.02 52.34 53.91 52.11
Operating Margin
18.59 13.81 13.03 12.21 12.11
EBITDA Margin 22.27 17.56 16.01 14.90 14.47
Net Margin 12.31 7.78 8.91 7.89 7.80
ROA 12.05 8.91 10.42 8.96 10.08
ROE 15.24 11.48 13.38 12.40 13.98
Solvability (X)
Debt to Equity 0.16 0.17 0.17 0.28 0.30
Interest Bearing Debt to Equity 0.03 0.02 0.02 0.12 0.11
Debt to Asset 0.12 0.13 0.14 0.21 0.21
Liquidity (X)
Current Ratio 7.79 6.70 7.21 4.11 3.96
Quick Ratio 5.03 3.36 3.46 2.34 2.00
Source: PT Multi Indocitra Tbk., Pefindo Equity & Index Valuation Division Estimates
(Rp bn) Balance Sheet 2007 2008 2009 2010P 2011P
Assets
Current Assets
Cash & cash equivalents
63.4 42.3 58.6 70.5 50.4
Receivables 62.9 57.5 57.3 76.6 92.9
Inventory 50.5 62.7 58.5 67.2 87.6
Other Assets 18.7 36.7 66.9 43.7 52.2
Total Current Assets 195.5 199.2 241.3 258.0 283.0
Fixed Assets 25.8 38.0 40.7 64.8 66.9
Other Assets 27.7 31.4 9.4 38.0 47.7
Total Assets 249.0 268.6 291.3 360.8 397.6
Liabilities
Trade payables 11.1 13.5 14.0 16.3 21.2
Sh-term payables 8.7 12.1 14.4 15.6 18.9
Long-term payables
5.6 6.3 5.9 11.4 13.5
Total Liabilities 30.7 36.0 39.3 74.2 85.0
Minority Interest 21.4 24.0 25.1 25.9 25.9
Total Equity 197.0 208.6 226.8 260.7 286.7
Source: PT Multi Indocitra Tbk., Pefindo Equity & Index Valuation Division Estimates
“Disclaimer statement in the last page is an integral part of this report” www.pefindo.com
Multi Indocitra, Tbk
DISCLAIMER
This report was prepared based on the trusted and reliable sources. Nevertheless, we do not guarantee its completeness, accuracy and adequacy. Therefore we do not responsible of any investment decision making based on this report. As for any assumptions, opinions and predictions were solely our internal judgments as per reporting date, and those judgments are subject to change without further notice. We do not responsible for mistake and negligence occurred by using this report. Last performance could not always be used as reference for future outcome. This report is not an offering recommendation, purchase or holds particular shares. This report might not be suitable for some investors. All opinion in this report has been presented fairly as per issuing date with good intentions; however it could be change at any time without further notice. The price, value or income from each share of the Company stated in this report might lower than the investor expectation and investor might obtain lower return than the invested amount. Investment is defined as the probable income that will be received in the future; nonetheless such return may possibly fluctuate. As for the Company which its share is denominated other than Rupiah, the foreign exchange fluctuation may reduce the value, price or investor investment return. This report does not contain any information for tax consideration in investment decision making. The share price target in this report is a fundamental value, not a fair market value nor a transaction price reference required by the regulations. The share price target issued by Pefindo Equity & Index Valuation Division is not a recommendation to buy, sell or hold particular shares and it could not be considered as an investment advice from Pefindo Equity & Index Valuation Division as its scope of service to, or in relation to some parties, including listed companies, financial advisor, broker, investment bank, financial institution and intermediary, in correlation with receiving rewards or any other benefits from that parties. This report is not intended for particular investor and cannot be used as part of investment objective on particular shares and neither an investment recommendation on particular shares or an investment strategy. We strongly recommended investor to consider the suitable situation and condition at first before making decision in relation with the figure in this report. If it is necessary, kindly contact your financial advisor. PEFINDO keeps the activities of Equity Valuation separate from Ratings to preserve independence and objectivity of its analytical processes and products. PEFINDO has established policies and procedures to maintain the confidentiality of certain non-public information received in connection with each analytical process. The entire process, methodology and the database used in the preparation of the Reference Share Price Target Report as a whole is different from the processes, methodologies and databases used PEFINDO in doing the rating. This report was prepared and composed by Pefindo Equity & Index Valuation Division with the objective to enhance shares price transparency of listed companies in Indonesia Stock Exchange (IDX). This report is also free of other party’s influence, pressure or force either from IDX or the listed company which reviewed by Pefindo Equity & Index Valuation Division. Pefindo Equity & Index Valuation Division will earn reward amounting to Rp 20 mn from IDX for issuing report twice per year. For further information, please visit our website at http://www.pefindo.com This report is prepared and composed by Pefindo Equity & Index Valuation Division. In Indonesia, this report is published in our website and in IDX website.
December 2nd , 2010 Page 8 of 8