manufacturing, quarrying and energipusdalisbang.jabarprov.go.id/pusdalisbang/berkas/... · 26....
TRANSCRIPT

Manufacturing, Quarrying and Energi
MANUFACTURING, QUARRYING AND ENERGY
! Jawa Barat Dalam Angka/Jawa Barat in Figures 2010 307
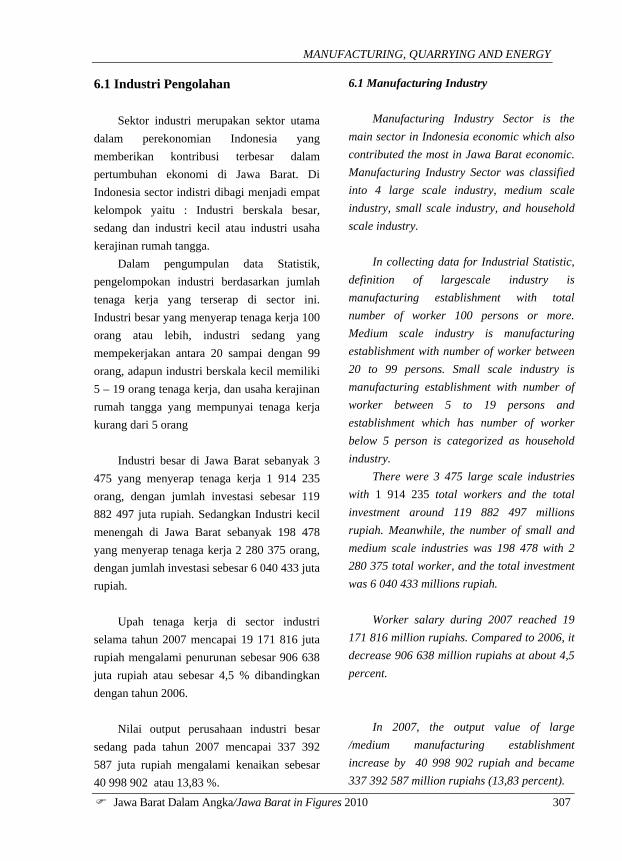
6.1 Industri Pengolahan Sektor industri merupakan sektor utama
dalam perekonomian Indonesia yang memberikan kontribusi terbesar dalam pertumbuhan ekonomi di Jawa Barat. Di Indonesia sector indistri dibagi menjadi empat kelompok yaitu : Industri berskala besar, sedang dan industri kecil atau industri usaha kerajinan rumah tangga.
Dalam pengumpulan data Statistik, pengelompokan industri berdasarkan jumlah tenaga kerja yang terserap di sector ini. Industri besar yang menyerap tenaga kerja 100 orang atau lebih, industri sedang yang mempekerjakan antara 20 sampai dengan 99 orang, adapun industri berskala kecil memiliki 5 – 19 orang tenaga kerja, dan usaha kerajinan rumah tangga yang mempunyai tenaga kerja kurang dari 5 orang
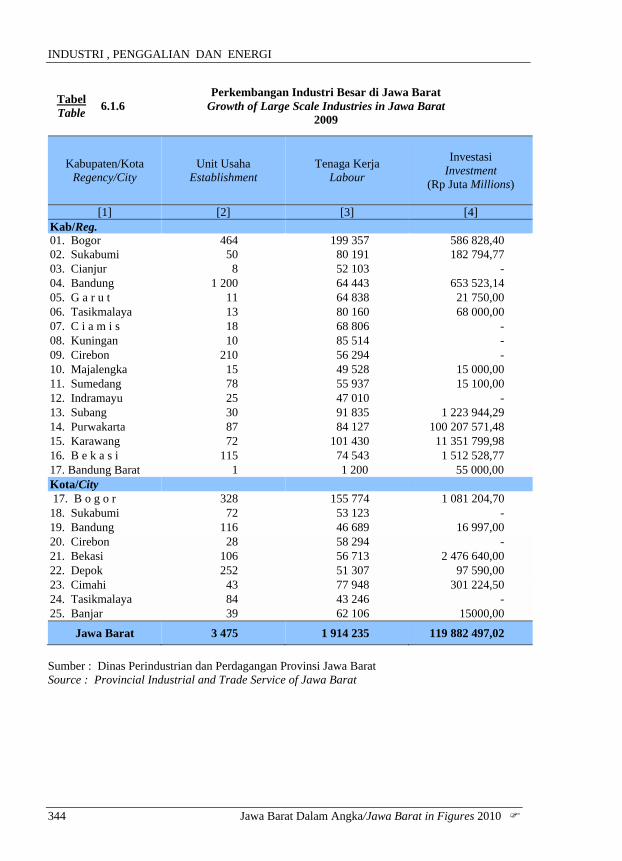
Industri besar di Jawa Barat sebanyak 3
475 yang menyerap tenaga kerja 1 914 235 orang, dengan jumlah investasi sebesar 119 882 497 juta rupiah. Sedangkan Industri kecil menengah di Jawa Barat sebanyak 198 478 yang menyerap tenaga kerja 2 280 375 orang, dengan jumlah investasi sebesar 6 040 433 juta rupiah.
Upah tenaga kerja di sector industri
selama tahun 2007 mencapai 19 171 816 juta rupiah mengalami penurunan sebesar 906 638 juta rupiah atau sebesar 4,5 % dibandingkan dengan tahun 2006.
Nilai output perusahaan industri besar
sedang pada tahun 2007 mencapai 337 392 587 juta rupiah mengalami kenaikan sebesar 40 998 902 atau 13,83 %.
6.1 Manufacturing Industry Manufacturing Industry Sector is the
main sector in Indonesia economic which also contributed the most in Jawa Barat economic. Manufacturing Industry Sector was classified into 4 large scale industry, medium scale industry, small scale industry, and household scale industry.
In collecting data for Industrial Statistic,
definition of largescale industry is manufacturing establishment with total number of worker 100 persons or more. Medium scale industry is manufacturing establishment with number of worker between 20 to 99 persons. Small scale industry is manufacturing establishment with number of worker between 5 to 19 persons and establishment which has number of worker below 5 person is categorized as household industry.
There were 3 475 large scale industries with 1 914 235 total workers and the total investment around 119 882 497 millions rupiah. Meanwhile, the number of small and medium scale industries was 198 478 with 2 280 375 total worker, and the total investment was 6 040 433 millions rupiah.
Worker salary during 2007 reached 19
171 816 million rupiahs. Compared to 2006, it decrease 906 638 million rupiahs at about 4,5 percent.
In 2007, the output value of large
/medium manufacturing establishment increase by 40 998 902 rupiah and became 337 392 587 million rupiahs (13,83 percent).

I N D U S T R I
Jawa Barat Dalam Angka /Jawa Barat in Figures 2010 ! 308
Sedangkan untuk nilai inputnya sebesar 204 551 180mengalami kenaikan sebesar 10,66 % atau sebesar 19 697 818. Dengan demikian nilai tambah yang dihasilkan oleh sector ini mencapai kenaikan sebesar 21 301 083 juta rupiah atau sebesar 19,1 %.
6.2 Penggalian
Pengambilan air bawah tanah secara berlebihan dapat mengakibatkan terganggunya ekosistem alam Indonesia. Oleh sebab itu volume air yang diijinkan untuk diambil dan jumlah air yang diambil harus terus dipantau untuk menjaga keseimbangan ekosistem.
Pada tahun 2009 jumlah ijin usaha
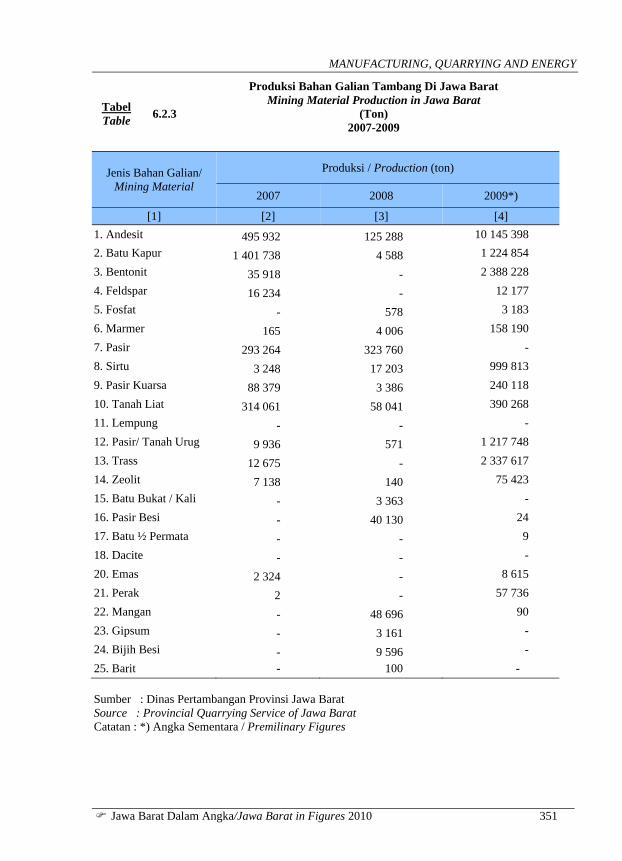
pertambangan berdasarkan SK Bupati di Jawa Barat sebanyak 146 unit usaha dengan luas areal sebanyak 45 058 ,89 Ha. Sedangkan jumlah produksi bahan galian tambang di Jawa Barat pada tahun 2009 yang paling besar adalah jenis Andesit yaitu sebesar 10 145 398 ton, disusul oleh Bentonit dan Trass.
6.3 Listrik dan Air Minum
Kebutuhan energi listrik akan terus
meningkat sejalan dengan berkembangnya roda pembangunan perekonomian daerah di sector perindustrian dan bertambahnya pengguna listrik rumah tanga.
Tahun 2009 jumlah pelanggan sebesar 7
731 798 dengan daya tersambung 545 021 110 kwh dan energi listrik yang terjual yaitu sebesar 1 689 150 942 kwh. Akan tetapi dari 2 493 695 417 ribu kwh yang siap dijual,
On the other hand,Input value reached 204 551 180 million rupiahs or it increased 19 697 818 (10,66 percent). Nevertheless added value of large/medium scale industri at market prices increased to 21 301 083 billion rupiahs (19,1percent).
6.3 Quarrying
Exploiting Natural Water Resources
overly can damage the nature of ecosystem in Indonesia. Therefore, government has to regulate the volume of water taken and these number has to be observed in order to balance the ecosystem itself.
In 2009, the number of mining
business lisence from the regent in Jawa barat was 146 with the area was 45 058, 89hectares. On the other hand, the highest production of mining in Jawa Barat was andesite as 10 145 398 tons, followed by bentonite and trass.
6.3 Electricity and Water Supply The needs of electricity increased sharply
since development of manufacturing industry sector increased and the number of household increased every year.
In 2009, total customer was 7 731 798
with power installed 545 021 110 kwh, and the total electricity sold was 1 689 150 942 thousand kwh.However, the total of ready sold energy

MANUFACTURING, QUARRYING AND ENERGY
! Jawa Barat Dalam Angka/Jawa Barat in Figures 2010 309
hanya 2 257 126 781 ribu kwh yang terjual, sisanya sebanyak 202 532 410 kwh susut atau hilang ( 8,12 persen).
Jumlah desa yang dialiri listrik pada
tahun 2009 sebanyak 5 863 desa dengan daya tersambung 5 749 MVA.
Kebutuhan akan air minum yang bersih
dan sehat dari tahun ke tahun semakin meningkat, dengan bertambahnya penduduk terutama di daerah perkotaan. Jumlah pelanggan air minum terbesar yang didistribusikan oleh PDAM yaitu rumah tangga mencapai 92,17 % kemudian Perdagangan dan Industri besar sebesar 5,55 % sedangkan pelanggan lainnya hanya sebesar 2,28 %.
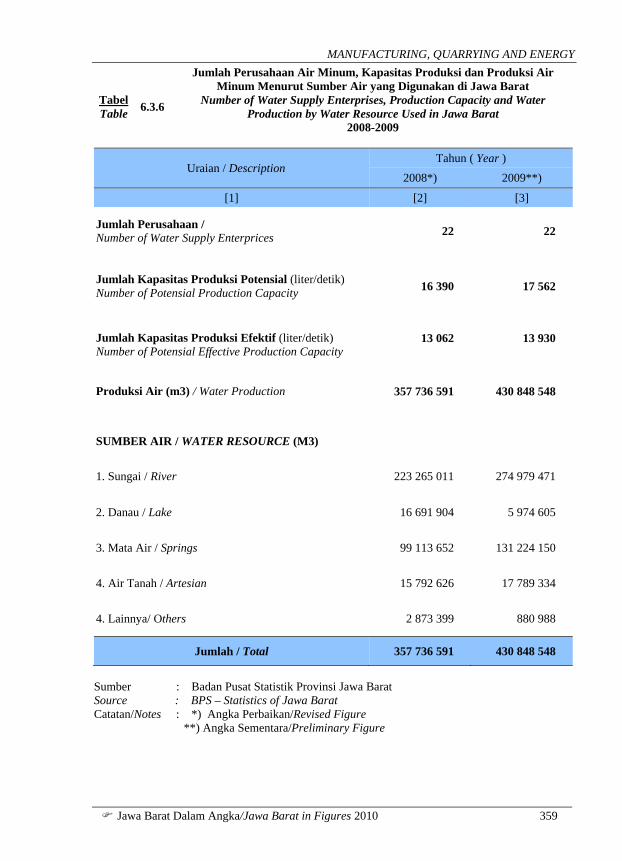
Pada tahun 2009 jumlah perusahaan air
minum di Jawa Barat sebesar 22 perusahaan dengan kemampuan kapasitas produksi efektif sebesar 13 930 lt/detik. Sedangkan jumlah kapasitas produksi potensial adalah sebesar 17 562 lt/detik. Sedangkan total produksi air sebesar 430 848 548 m3 dengan produksi terbesar bersumber dari sungai sebesar 63,82 %. Pendistribusian air disalurkan ke berbagai golongan konsumen dengan total nilai 749 932 juta rupiah.
Was 2 493 695 417 thousand kwh. There was only 2 257 126 781 thousand kwh being sold, and the rest 202 532 410 thousand kwh was lost ( 8,12 percent).
The number of villages that had electricity in year 2009 was 5 863 villages with connected power 5 749 MVA.
At this moment, urban societes rely
heavily on clean water supply. It is an impact of highly populated density in urban area together with scarcity of fresh water resources. The number of clean water customer which distributed by clean water company was mostly general households for around 92,17 percent, and followed by trading and industry for around 5,55 percent. Other customer was only 2,28 percent.
In year 2009 the number of water supply
enterprises was 22 with total effective production capacity 13 930 lt/seconds. However, the number of potential capacity production was 17562 lt/second. Furthermore, total water production was about 430 848 548 m3, with river at the most water resources for 63,82 percent. Water was distributed through all type of consumers with total value about 749 932 millions rupiah.

MANUFACTURING, QUARRYING AND ENERGY
! Jawa Barat Dalam Angka/Jawa Barat in Figures 2010 311

MANUFACTURING, QUARRYING AND ENERGY
! Jawa Barat Dalam Angka/Jawa Barat in Figures 2010 313
Tabel Table 6.1.1
Jumlah Perusahaan Tenaga Kerja dan Pengeluaran untuk Tenaga Kerja Menurut Golongan Industri di Jawa Barat
Number of Establishments Employment and Employment Costs by Group of Industry in Jawa Barat
2005 - 2007
Golongan Industri Group of Industry
Tahun Year
Perusahaan Establish-
ment
Tenaga Kerja
Employment
Pengeluaran Tenaga Kerja
Employment Cost ( Juta/Millions Rp)
[1] [2] [3] [4] [5]
15. Industri Makanan dan Minuman / Manufacture of Food Beverages
2005 832 86 123 881 829
2006 1320 140 334 1 759 364
2007 1229 118 572 1 452 007
16. Industri PengolahanTembakau / Tobacco Industries
2005 5 275 7 687
2006 20 1 024 1 759 364
2007 17 842 12 887
17. Industri Tekstil /Textile Industries
2005 802 270 451 3 606 174
2006 859 297 158 3 811 679
2007 1143 284 616 4 035 387
18. Industri Pakaian Jadi / Wearing Apparel Industries
2005 423 180 767 1 730 640
2006 582 248 782 2 765 128
2007 732 222 528 2 590 419
19. Industri Kulit barang dari Kulit dan alas kaki / Leather Industries
2005 119 50 728 622 110
2006 217 60 068 824 002
2007 260 46 625 723 563 Sumber : Badan Pusat Statistik Provinsi Jawa Barat Source : BPS- Statistics of Jawa Barat
INDUSTRI , PENGGALIAN DAN ENERGI
314 Jawa Barat Dalam Angka/Jawa Barat in Figures 2010 !
Tabel Table 6.1.1 Lanjutan
[Continued]
Golongan Industri Group of Industry
Tahun Year
PerusahaanEstablish-
ment
Tenaga Kerja
Employment
Pengeluaran Tenaga Kerja
Employment Cost(Juta/Millions Rp)
[1] [2] [3] [4] [5]
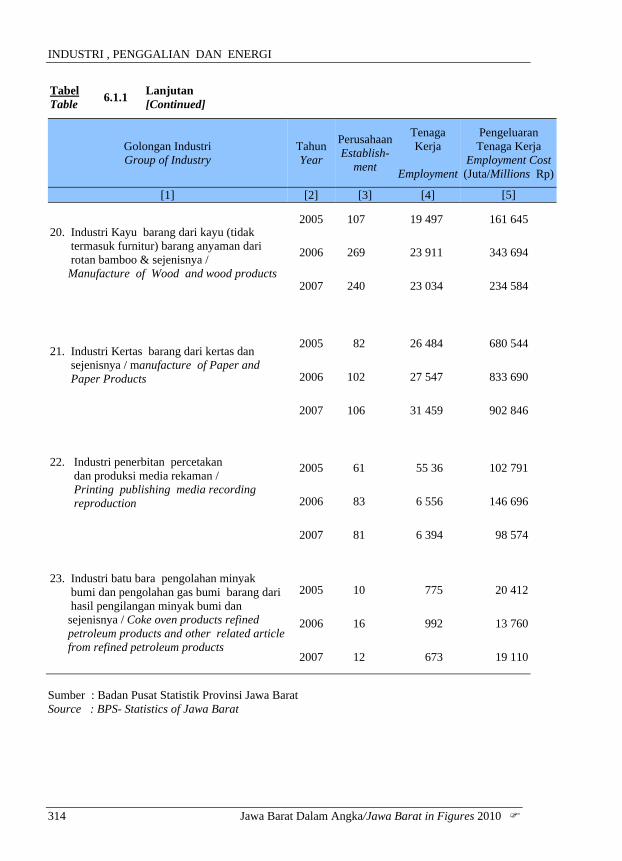
20. Industri Kayu barang dari kayu (tidak termasuk furnitur) barang anyaman dari rotan bamboo & sejenisnya / Manufacture of Wood and wood products
2005 107 19 497 161 645
2006 269 23 911 343 694
2007 240 23 034 234 584
21. Industri Kertas barang dari kertas dan sejenisnya / manufacture of Paper and Paper Products
2005 82 26 484 680 544
2006 102 27 547 833 690
2007 106 31 459 902 846
22. Industri penerbitan percetakan dan produksi media rekaman / Printing publishing media recording reproduction
2005 61 55 36 102 791
2006 83 6 556 146 696
2007 81 6 394 98 574
23. Industri batu bara pengolahan minyak bumi dan pengolahan gas bumi barang dari hasil pengilangan minyak bumi dan sejenisnya / Coke oven products refined petroleum products and other related article from refined petroleum products
2005 10 775 20 412
2006 16 992 13 760
2007 12 673 19 110
Sumber : Badan Pusat Statistik Provinsi Jawa Barat Source : BPS- Statistics of Jawa Barat

MANUFACTURING, QUARRYING AND ENERGY
! Jawa Barat Dalam Angka/Jawa Barat in Figures 2010 315
Tabel Table 6.1.1 Lanjutan
[Continued]
Golongan Industri Group of Industry
Tahun Year
Perusahaan Establish-
ment
Tenaga Kerja
Employment
Pengeluaran Tenaga Kerja
Employment Cost (Juta/Millions Rp)
[1] [2] [3] [4] [5]
24. Industri Kimia dan barang - barang dari bahan kimia Chemical and other chemi- cal products
2005 248 54 842 1 416 518
2006 281 45 458 1 409 803
2007 276 47 801 1 220 413
25. Industri Karet barang dari karet dan barang dari plastik Rubber rubber and plastics products
2005 313 71 429 948 661
2006 411 85 500 1 489 108
2007 376 81 650 1 339 768
26. Industri barang galian bukan logam Other mineral non metal
2005 634 55 200 842 777
2006 888 65 799 930 994
2007 809 57 431 796 978
27. Industri logam dasar / Basic metal
2005 44 9 464 365 422
2006 43 8 477 390 464
2007 56 9 946 357 726
28. Industri barang dari logam kecuali mesin dan peralatannya Fabricated metal products except machinery and equipment
2005 215 29 405 419 482
2006 250 30 357 621 138
2007 236 33 933 602 441
Sumber : Badan Pusat Statistik Provinsi Jawa Barat Source : BPS- Statistics of Jawa Barat

INDUSTRI , PENGGALIAN DAN ENERGI
316 Jawa Barat Dalam Angka/Jawa Barat in Figures 2010 !
Tabel Table 6.1.1 Lanjutan
[Continued]
Golongan Industri Group of Industry
Tahun Year
Perusahaan Establish-
ment
Tenaga Kerja
Employment
Pengeluaran Tenaga Kerja
Employment Cost (Juta/Millions Rp)
[1] [2] [3] [4] [5]
29. Industri mesin dan peralatannya Machinery and apparatus
2005 174 43 401 715 441
2006 190 46 063 900 359
2007 170 30 528 686 570
30. Industri mesin dan peralat an kantor akutansi dan pengolahan data Office accounting and computering machinery
2005 5 3 598 28 359
2006 6 1 236 23 167
2007 6 3 157 62 281
31. Industri mesin lainnya dan perlengkapannya Other machinery and Apparatus
2005 87 25 351 513 099
2006 93 27 869 565 996
2007 100 28 302 624 671
32. Industri radio televisi dan peralatan komunikasi Serta perlengkapannya Radio television and communication equipment and apparatus
2005 76 43 125 782 876
2006 99 47 221 972 700
2007 92 52 081 964 223
Sumber : Badan Pusat Statistik Provinsi Jawa Barat Source : BPS- Statistics of Jawa Barat

MANUFACTURING, QUARRYING AND ENERGY
! Jawa Barat Dalam Angka/Jawa Barat in Figures 2010 317
Tabel Table 6.1.1 Lanjutan
[Continued]
Golongan Industri Group of Industry
Tahun Year
Perusahaan Establish-
ment
Tenaga Kerja
Employment
Pengeluaran Tenaga Kerja
Employment Cost (Juta/Millions Rp)
[1] [2] [3] [4] [5] 33. Industri peralatan kedokteran, alat-alat ukur peralatan navigasi peralatan optik jam dan lonceng/ Medical apphainces precisian navigation and optical instruments watche and clocks
2005 13 3 783 80 021
2006 17 5 561 134 059
2007 20 9 379 181 467
34. Industri kendaraan bermotor / Transport equipment
2005 128 29 137 630 932
2006 152 34 378 727 409
2007 140 36 264 779 047
35. Industri alat angkutan selain ken- daraan bermotor roda empat atau lebih / Transport equipment except four wheel or more
2005 49 18 757 287 203
2006 79 25 774 515 946
2007 76 26 334 518 823
36. Industri furnitur dan industri pengolahan lainnya / Furniture and other product
2005 346 63 578 532 820
2006 573 81 153 877 402
2007 575 79 518 959 263
37. Daur ulang / Wastes or scraps Manufacture
2005 9 426 2 943
2006 23 1 138 7 573
2007 24 972 8 768
Jumlah/ Total
2005 4 782 1 092 132 14 834 384
2006 7 086 1 312 366 20 078 454
2007 6 776 1 232 039 19 171 816 Sumber : Badan Pusat Statistik Provinsi Jawa Barat Source : BPS- Statistics of Jawa Barat

INDUSTRI , PENGGALIAN DAN ENERGI
318 Jawa Barat Dalam Angka/Jawa Barat in Figures 2010 !
Tabel Table 6.1.2
Nilai Output Biaya Input dan Nilai Tambah Menurut Golongan Industri di Jawa Barat
Value of Gross Output Input Cost and value Added at Market Prices by Group of Industry in Jawa Barat
(Juta/Millions Rp) 2005 - 2007
Golongan Industri Group of Industry
Tahun Year
Nilai Output Value of
Gross Output
Biaya Input Input Cost
Nilai Tambah (Harga Pasar) Value Added
at Market Prices
[1] [2] [3] [4] [5]
15. Industri Makanan dan Minuman / Manufacture of Food Beverages
2005 16 827 969 10 827 354 6 000 615
2006 23 173 248 15 369 589 7 803 659
2007 27 425 982 18 380 577 9 045 405
16. Industri Pengolahan Tembakau / Tabacco Industries
2005 1 807 240 353 986 1 453 254
2006 796 978 334 792 462 187
2007 1 493 431 1 039 316 454 115
17. Industri Tekstil / Textile Industries
2005 49 316 106 35 389 976 13 926 130
2006 53 310 496 34 273 801 19 036 695
2007 64 022 308 43 233 574 20 788 734
18. Industri Pakaian Jadi / Wearing Apparel Industries
2005 13 134 064 8 751 712 4 382 352
2006 15 236 925 7 936 157 7 300 767
2007 16 473 105 8 911 556 7 561 549
19. Industri Kulit barang dari Kulit dan alas kaki / Leather Industries and Paper Products
2005 8 914 525 6 344 315 2 570 210
2006 6 426 331 3 583 781 2 842 550
2007 5 554 795 2 721 487 2 833 308
Sumber : Badan Pusat Statistik Provinsi Jawa Barat Source : BPS- Statistics of Jawa Barat
MANUFACTURING, QUARRYING AND ENERGY
! Jawa Barat Dalam Angka/Jawa Barat in Figures 2010 319
Tabel Table
6.1.2 Lanjutan [Continued]
Golongan Industri Group of Industry
Tahun Year
Nilai Output Value of
Gross Output
Biaya Input Input Cost
Nilai Tambah(Harga Pasar)Value Added
at Market Prices
[1] [2] [3] [4] [5]
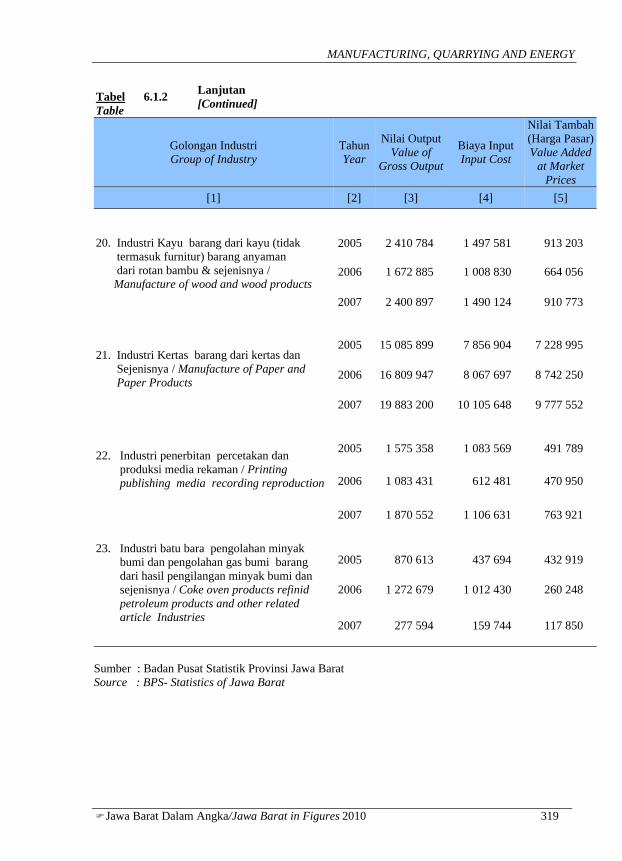
20. Industri Kayu barang dari kayu (tidak termasuk furnitur) barang anyaman dari rotan bambu & sejenisnya / Manufacture of wood and wood products
2005 2 410 784 1 497 581 913 203
2006 1 672 885 1 008 830 664 056
2007 2 400 897 1 490 124 910 773
21. Industri Kertas barang dari kertas dan Sejenisnya / Manufacture of Paper and Paper Products
2005 15 085 899 7 856 904 7 228 995
2006 16 809 947 8 067 697 8 742 250
2007 19 883 200 10 105 648 9 777 552
22. Industri penerbitan percetakan dan produksi media rekaman / Printing publishing media recording reproduction
2005 1 575 358 1 083 569 491 789
2006 1 083 431 612 481 470 950
2007 1 870 552 1 106 631 763 921
23. Industri batu bara pengolahan minyak bumi dan pengolahan gas bumi barang dari hasil pengilangan minyak bumi dan sejenisnya / Coke oven products refinid petroleum products and other related article Industries
2005 870 613 437 694 432 919
2006 1 272 679 1 012 430 260 248
2007 277 594 159 744 117 850
Sumber : Badan Pusat Statistik Provinsi Jawa Barat Source : BPS- Statistics of Jawa Barat
INDUSTRI , PENGGALIAN DAN ENERGI
320 Jawa Barat Dalam Angka/Jawa Barat in Figures 2010 !
Tabel Table 6.1.2 Lanjutan
[Continued]
Golongan Industri Group of Industry
Tahun Year
Nilai Output Value of
Gross Output
Biaya Input Input Cost
Nilai Tambah (Harga Pasar) Value Added
at Market Prices
[1] [2] [3] [4] [5]
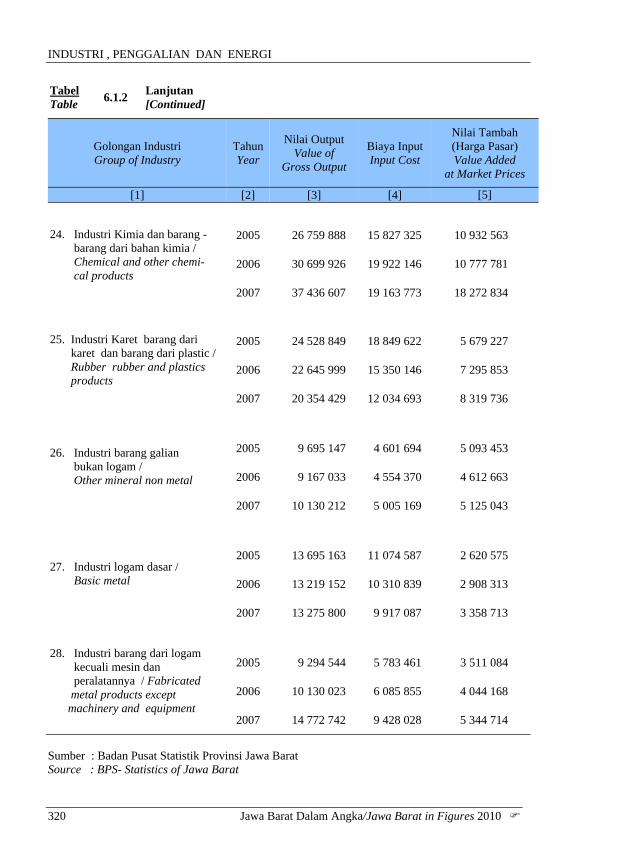
24. Industri Kimia dan barang - barang dari bahan kimia / Chemical and other chemi- cal products
2005 26 759 888 15 827 325 10 932 563
2006 30 699 926 19 922 146 10 777 781
2007 37 436 607 19 163 773 18 272 834
25. Industri Karet barang dari karet dan barang dari plastic / Rubber rubber and plastics products
2005 24 528 849 18 849 622 5 679 227
2006 22 645 999 15 350 146 7 295 853
2007 20 354 429 12 034 693 8 319 736
26. Industri barang galian bukan logam / Other mineral non metal
2005 9 695 147 4 601 694 5 093 453
2006 9 167 033 4 554 370 4 612 663
2007 10 130 212 5 005 169 5 125 043
27. Industri logam dasar / Basic metal
2005 13 695 163 11 074 587 2 620 575
2006 13 219 152 10 310 839 2 908 313
2007 13 275 800 9 917 087 3 358 713
28. Industri barang dari logam kecuali mesin dan peralatannya / Fabricated metal products except machinery and equipment
2005 9 294 544 5 783 461 3 511 084
2006 10 130 023 6 085 855 4 044 168
2007 14 772 742 9 428 028 5 344 714
Sumber : Badan Pusat Statistik Provinsi Jawa Barat Source : BPS- Statistics of Jawa Barat

MANUFACTURING, QUARRYING AND ENERGY
! Jawa Barat Dalam Angka/Jawa Barat in Figures 2010 321
Tabel Table 6.1.2 Lanjutan
[Continued]
Golongan Industri Group of Industry
TahunYear
Nilai Output Value of
Gross Output
Biaya Input Input Cost
Nilai Tambah (Harga Pasar) Value Added
at Market Prices
[1] [2] [3] [4] [5]
29. Industri mesin dan Peralatannya / Machinery and apparatus
2005 7 895 061 4 486 990 3 408 071
2006 14 503 045 9 729 157 4 773 889
2007 10 499 530 6 080 152 4 419 378
30. Industri mesin dan peralatan kantor akutansi dan pengolahan data / Office accounting and computering machinery
2005 1 756 472 1 112 966 643 506
2006 149 221 45 583 103 638
2007 252 925 6 224 246 701
31. Industri mesin lainnya dan Perlengkapannya / Other machinery and Apparatus
2005 9 284 786 5 878 126 3 406 660
2006 9 639 504 5 970 969 3 668 535
2007 9 634 473 6 103 848 3 530 625
32. Industri radio televisi dan peralatan komunikasi Serta perlengkapannya Radio television and communication equipment and apparatus
2005 9 246 203 4 177 064 5 069 139
2006 27 984 780 20 627 135 7 357 645
2007 25 467 869 16 824 544 8 643 325 Sumber : Badan Pusat Statistik Provinsi Jawa Barat Source : BPS- Statistics of Jawa Barat

INDUSTRI , PENGGALIAN DAN ENERGI
322 Jawa Barat Dalam Angka/Jawa Barat in Figures 2010 !
Tabel Table 6.1.2 Lanjutan
[Continued]
Golongan Industri Group of Industry
Tahun Year
Nilai Output Value of
Gross Output
Biaya Input Input Cost
Nilai Tambah (Harga Pasar) Value Added
at Market Prices
[1] [2] [3] [4] [5] 33. Industri peralatan kedokteran alat- alat ukur peralatan navigasi peralatan optik jam dan lonceng / Medical apphainces preci sian navigation and optical instruments watches and clocks
2005 658 916 512 724 146 192
2006 949 936 409 057 540 879
2007 1 588 378 858 877 729 501
34. Industri kendaraan bermotor / Transport equipment
2005 17 335 384 9 282 450 8 052 934
2006 18 882 492 9 075 034 9 807 458
2007 29 003 302 15 597 732 13 405 570
35. Industri alat angkutan selain kendaraan Bermotor roda empat atau lebih / Transport equipment except four wheel or more
2005 6 271 363 4 437 048 1 834 314
2006 9 864 772 6 277 894 3 586 877
2007 9 852 545 6 065 686 3 786 859
36. Industri furnitur dan industri pengolahan lainnya / Furniture and other product
2005 7 786 765 4 807 221 2 979 544
2006 8 689 550 4 240 610 4 448 941
2007 15 436 958 10 144 615 5 292 343
37. Daur ulang / Wastes or scraps Manufacture
2005 21 320 15 481 5 839
2006 85 333 55 010 30 323
2007 284 953 172 095 112 858
Jumlah/ Total 2005 254 172 419 163 389 850 90 782 569
2006 296 393 685 184 853 362 111 540 324
2007 337 392 587 204 551 180 132 841 407 Sumber : Badan Pusat Statistik Provinsi Jawa Barat Source : BPS – Statistics of Jawa Barat

MANUFACTURING, QUARRYING AND ENERGY
! Jawa Barat Dalam Angka/Jawa Barat in Figures 2010 323
Tabel Table 6.1.3
Biaya Input Menurut Golongan Industri di Jawa Barat Value of Input costs by Group of Industry in Jawa Barat
(Juta/Millions Rp) 2005 - 2007
Golongan Industri Group of Industry
TahunYear
Bahan Baku Raw
Materials
Bahan Bakar Dan Pelumas
Fuel and Lube Oil
Listrik Yang Dipakai
Electricity Used
[1] [2] [3] [4] [5]
15. Industri Makanan dan Minuman/ Manufacture of Food Beverages
2005 9 259 810 388 321 282 620
2006 13 007 607 586 003 342 962
2007 15 395 242 870 458 512 653
16. Industri Pengolahan Tembakau/ Tabacco Industries
2005 349 603 331 3 474
2006 331 765 1 414 61
2007 1 019 126 2 116 670
17. Industri Tekstil / Textile Industries
2005 27 112 158 2 651 499 2 738 637
2006 26 458 768 2 035 909 3 072 544
2007 34 133 314 2 500 214 2 596 521
18. Industri Pakaian Jadi / Wearing Apparel Industries
2005 6 908 603 335 657 420 001
2006 6 517 938 245 911 293 317
2007 6 717 649 420 224 463 934
19. Industri Kulit barang dari Kulit dan alas kaki / Leather Industries
2005 5 255 947 115 563 187 549
2006 2 583 522 35 204 113 464
2007 2 293 764 60 568 140 354 Sumber : Badan Pusat Statistik Provinsi Jawa Barat Source : BPS- Statistics of Jawa Barat

INDUSTRI , PENGGALIAN DAN ENERGI
324 Jawa Barat Dalam Angka/Jawa Barat in Figures 2010 !
Tabel Table 6.1.3 Lanjutan
[Continued]
Golongan Industri Group of Industry
Tahun Year
Sewa Gedung Mesin & Alat-alat
Rent of BuildingMachinery and
Equipment
Jasa Lainnya Other Services
Jumlah Total
[1] [2] [6] [7] [8]
15. Industri Makanan dan Minuman/ Manufacture of Food Beverages
2005 85 312 811 292 10 827 354
2006 29 574 1 403 444 15 369 589
2007 44 033 1 558 192 18 380 578
16. Industri Pengolahan Tembakau/ Tabacco Industries
2005 57 521 353 986
2006 - 1 553 334 792
2007 68 17 336 1 039 316
17. Industri Tekstil / Textile Industries
2005 239 753 2 647 929 35 389 976
2006 245 151 2 461 429 34 273 801
2007 200 030 3 803 495 43 233 574
18. Industri Pakaian Jadi / Wearing Apparel Industries
2005 156 360 931 091 8 751 712
2006 89 170 789 820 7 936 157
2007 199 291 1 110 458 8 911 556
19. Industri Kulit barang dari Kulit dan alas kaki / Leather Industries
2005 12 188 773 069 6 344 315
2006 14 419 837 171 3 583 781
2007 11 408 215 392 2 721 486 Sumber : Badan Pusat Statistik Provinsi Jawa Barat Source : BPS- Statistics of Jawa Barat

MANUFACTURING, QUARRYING AND ENERGY
! Jawa Barat Dalam Angka/Jawa Barat in Figures 2010 325
Tabel Table 6.1.3 Lanjutan
[Continued]
Golongan Industri Group of Industry
TahunYear
Bahan Baku Raw
Materials
Bahan Bakar Dan Pelumas
Fuel and Lube Oil
Listrik Yang Dipakai
Electricity Used
[1] [2] [3] [4] [5]
20. Industri Kayu barang dari kayu (tidak termasuk furnitur) barang anyaman dari rotan bambu & sejenisnya / Manufacture of wood and wood products
2005 1 330 335 51 599 53 027
2006 912 589 22 251 20 254
2007 1 309 005 56 341 71 819
21. Industri Kertas barang dari kertas dan Sejenisnya / Manufacture of Paper and Paper Products
2005 6 214 889 721 233 518 617
2006 5 869 211 1 143 278 648 267
2007 7 386 593 1 141 596 714 155
22. Industri penerbitan percetakan dan produksi media rekaman / Printing publishing media recording reproduction
2005 780 150 50 722 38 406
2006 483 893 24 073 28 690
2007 910 764 33 193 56 301
23. Industri batu bara pengolahan minyak bumi dan pengolahan gas bumi barang dari hasil pengilangan minyak bumi dan sejenisnya / Coke oven products refinid petroleum products and other related article Industries
2005 400 436 19 611 1 816
2006 963 436 3 573 6 645
2007 143 324 10 009 4 995
Sumber : Badan Pusat Statistik Provinsi Jawa Barat Source : BPS- Statistics of Jawa Barat

INDUSTRI , PENGGALIAN DAN ENERGI
326 Jawa Barat Dalam Angka/Jawa Barat in Figures 2010 !
Tabel Table 6.1.3 Lanjutan
[Continued]
products Tahun Year
Sewa Gedung Mesin & Alat-alat Rent of
Building Machinery and
Equipment
Jasa Lainnya Other Services
Jumlah Total
[1] [2] [6] [7] [8]
20. Industri Kayu barang dari kayu (tidak termasuk furnitur) barang anyaman dari rotan bambu & sejenisnya / Manufacture of wood and wood products
2005 15 789 46 831 1 497 581
2006 9 401 44 355 1 008 830
2007 2 969 49 991 1 490 125
21. Industri Kertas barang dari kertas dan Sejenisnya / Manufacture of Paper and Paper Products
2005 41 831 360 334 7 856 904
2006 69 630 337 310 8 067 697
2007 18 276 845 028 10 105 648
22. Industri penerbitan percetakan dan produksi media rekaman / Printing publishing media recording reproduction
2005 10 861 203 429 1 083 569
2006 3 389 72 435 612 481
2007 4 502 101 871 1 106 631
23. Industri batu bara pengolahan minyak bumi dan pengolahan gas bumi barang dari hasil pengilangan minyak bumi dan sejenisnya / Coke oven products refinid petroleum products and other related article Industries
2005 3 140 12 691 437 694
2006 9 522 29 255 1 012 430
2007 78 1 338 159 744
Sumber : Badan Pusat Statistik Provinsi Jawa Barat Source : BPS- Statistics of Jawa Barat

MANUFACTURING, QUARRYING AND ENERGY
! Jawa Barat Dalam Angka/Jawa Barat in Figures 2010 327
Tabel Table 6.1.3 Lanjutan
[Continued]
Golongan Industri Group of Industry
Tahun Year
Bahan Baku Raw
Materials
Bahan Bakar Dan Pelumas
Fuel and Lube Oil
Listrik Yang Dipakai
Electricity Used
[1] [2] [3] [4] [5]
24. Industri Kimia dan barang- barang dari bahan kimia / Chemical and other chemi- cal products
2005 10 700 859 470 495 435 613
2006 14 638 8853 588 624 1 008 182
2007 14 480 556 682 319 712 810
25. Industri Karet barang dari karet dan barang dari plastic /Rubber rubber and plastics products
2005 16 791 858 699 118 646 357
2006 13 848 567 393 759 466 248
2007 10 157 698 408 628 605 490
26. Industri barang galian bukan logam / Other mineral non metal
2005 2 137 184 1 235 688 305 322
2006 2 734 269 1 033 797 394 306
2007 2 994 129 1 078 304 496 838
27. Industri logam dasar / Basic metal
2005 10 223 404 221 650 226 200
2006 9 208 713 161 952 154 100
2007 8 672 022 175 495 528 992
28. Industri barang dari logam kecuali mesin dan peralatannya / Fabricated metal products except machinery and equipment
2005 5 039 735 114 432 208 782
2006 5 223 684 131 548 192 498
2007 7 857 524 282 652 477 085 Sumber : Badan Pusat Statistik Provinsi Jawa Barat Source : BPS – Statistics of Jawa Barat

INDUSTRI , PENGGALIAN DAN ENERGI
328 Jawa Barat Dalam Angka/Jawa Barat in Figures 2010 !
Tabel Table 6.1.3 Lanjutan
[Continued]
Golongan Industri Group of Industry
Tahun Year
Sewa Gedung Mesin & Alat-alat Rent of
Building Machinery
and Equipment
Jasa LainnyaOther
Services
Jumlah Total
[1] [2] [6] [7] [8]
24. Industri Kimia dan barang- barang dari bahan kimia / Chemical and other chemi- cal products
2005 368 465 3 851 893 15 827 325
2006 183 401 3 503 088 19 922 146
2007 281 808 3 006 281 19 163 774
25. Industri Karet barang dari karet dan barang dari plastic /Rubber rubber and plastics products
2005 93 647 618 642 18 849 622
2006 72 911 568 661 15 350 146
2007 76 635 786 242 12 034 693
26. Industri barang galian bukan logam / Other mineral non metal
2005 16 793 906 707 4 601 694
2006 10 525 381 473 4 554 370
2007 9 701 426 196 5 005 168
27. Industri logam dasar / Basic metal
2005 7 051 396 281 11 074 587
2006 2 859 773 214 10 310 839
2007 20 716 519 862 9 917 087
28. Industri barang dari logam kecuali mesin dan peralatannya / Fabricated metal products except machinery and equipment
2005 27 654 392 858 5 783 461
2006 37 004 501 121 6 085 855
2007 49 085 761 683 9 428 029 Sumber : Badan Pusat Statistik Provinsi Jawa Barat Source : BPS – Statistics of Jawa Barat

MANUFACTURING, QUARRYING AND ENERGY
! Jawa Barat Dalam Angka/Jawa Barat in Figures 2010 329
Tabel Table 6.1.3 Lanjutan
[Continued]
Golongan Industri Group of Industry
Tahun Year
Bahan Baku Raw
Materials
Bahan Bakar Dan Pelumas
Fuel and Lube Oil
Listrik Yang Dipakai
Electricity Used
[1] [2] [3] [4] [5]
29. Industri mesin dan peralatannya Machinery and apparatus
2005 3 712 699 68 009 162 341
2006 8 062 962 196 514 316 681
2007 4 950 733 165 580 189 787
30. Industri mesin dan peralatan kantor akutansi dan pengolahan data / Office accounting and computering machinery
2005 971 213 1 102 3 794
2006 34 555 868 1 063
2007 1 037 161 481
31. Industri mesin lainnya dan Perlengkapannya / Other machinery And appratus
2005 5 365 081 49 000 199 282
2006 5 267 615 52 516 102 968
2007 5 311 144 118 042 134 780
32. Industri radio televisi dan peralatan komunikasi serta perlengkapannya / Radio televisian and communication equipment and appartus equipment and other related article
2005 3 389 849 87 123 147 005
2006 19 755 090 92 539 305 099
2007 15 834 133 77 336 436 690
Sumber : Badan Pusat Statistik Provinsi Jawa Barat Source : BPS – Statistics of Jawa Barat
INDUSTRI , PENGGALIAN DAN ENERGI
330 Jawa Barat Dalam Angka/Jawa Barat in Figures 2010 !
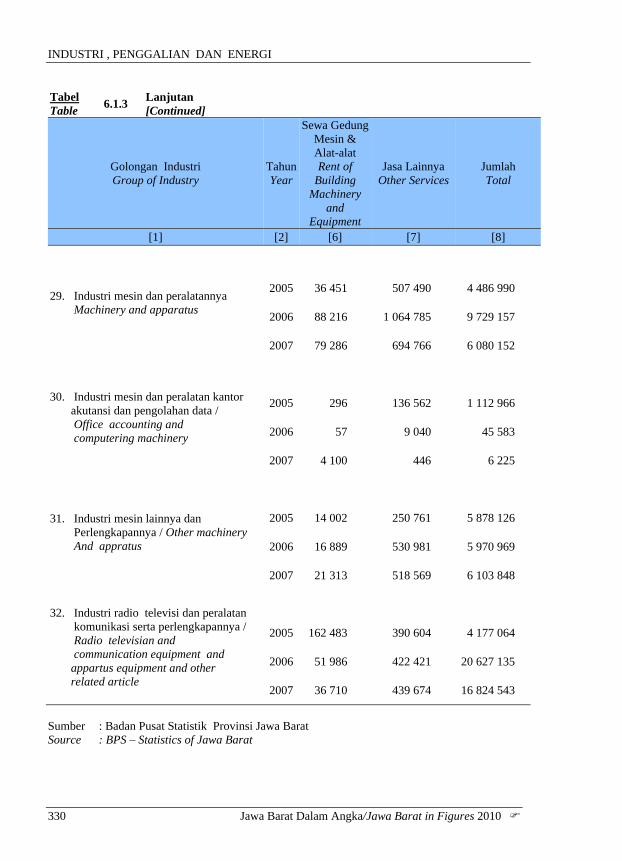
Tabel Table 6.1.3 Lanjutan
[Continued]
Golongan Industri Group of Industry
Tahun Year
Sewa GedungMesin & Alat-alat Rent of
Building Machinery
and Equipment
Jasa Lainnya Other Services
Jumlah Total
[1] [2] [6] [7] [8]
29. Industri mesin dan peralatannya Machinery and apparatus
2005 36 451 507 490 4 486 990
2006 88 216 1 064 785 9 729 157
2007 79 286 694 766 6 080 152
30. Industri mesin dan peralatan kantor akutansi dan pengolahan data / Office accounting and computering machinery
2005 296 136 562 1 112 966
2006 57 9 040 45 583
2007 4 100 446 6 225
31. Industri mesin lainnya dan Perlengkapannya / Other machinery And appratus
2005 14 002 250 761 5 878 126
2006 16 889 530 981 5 970 969
2007 21 313 518 569 6 103 848
32. Industri radio televisi dan peralatan komunikasi serta perlengkapannya / Radio televisian and communication equipment and appartus equipment and other related article
2005 162 483 390 604 4 177 064
2006 51 986 422 421 20 627 135
2007 36 710 439 674 16 824 543
Sumber : Badan Pusat Statistik Provinsi Jawa Barat Source : BPS – Statistics of Jawa Barat
MANUFACTURING, QUARRYING AND ENERGY
! Jawa Barat Dalam Angka/Jawa Barat in Figures 2010 331
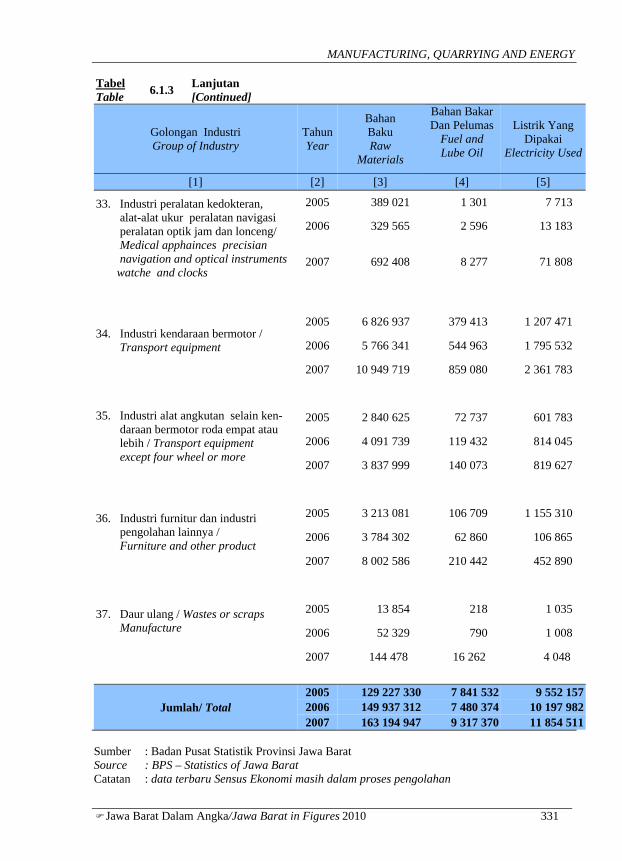
Tabel Table 6.1.3 Lanjutan
[Continued]
Golongan Industri Group of Industry
TahunYear
Bahan Baku Raw
Materials
Bahan Bakar Dan Pelumas
Fuel and Lube Oil
Listrik Yang Dipakai
Electricity Used
[1] [2] [3] [4] [5]
33. Industri peralatan kedokteran, alat-alat ukur peralatan navigasi peralatan optik jam dan lonceng/ Medical apphainces precisian navigation and optical instruments watche and clocks
2005 389 021 1 301 7 713
2006 329 565 2 596 13 183
2007 692 408 8 277 71 808
34. Industri kendaraan bermotor / Transport equipment
2005 6 826 937 379 413 1 207 471
2006 5 766 341 544 963 1 795 532
2007 10 949 719 859 080 2 361 783
35. Industri alat angkutan selain ken- daraan bermotor roda empat atau lebih / Transport equipment except four wheel or more
2005 2 840 625 72 737 601 783
2006 4 091 739 119 432 814 045
2007 3 837 999 140 073 819 627
36. Industri furnitur dan industri pengolahan lainnya / Furniture and other product
2005 3 213 081 106 709 1 155 310
2006 3 784 302 62 860 106 865
2007 8 002 586 210 442 452 890
37. Daur ulang / Wastes or scraps Manufacture
2005 13 854 218 1 035
2006 52 329 790 1 008
2007 144 478 16 262 4 048
Jumlah/ Total 2005 129 227 330 7 841 532 9 552 1572006 149 937 312 7 480 374 10 197 9822007 163 194 947 9 317 370 11 854 511
Sumber : Badan Pusat Statistik Provinsi Jawa Barat Source : BPS – Statistics of Jawa Barat Catatan : data terbaru Sensus Ekonomi masih dalam proses pengolahan

INDUSTRI , PENGGALIAN DAN ENERGI
332 Jawa Barat Dalam Angka/Jawa Barat in Figures 2010 !
Tabel Table 6.1.3 Lanjutan
[Continued]
Golongan Industri Group of Industry
Tahun Year
Sewa Gedung Mesin & Alat-
alat Rent of BuildingMachinery and
Equipment
Pengeluaran Lainnya
Other Services
Jumlah Total
[1] [2] [6] [7] [8]
33. Industri peralatan kedokteran, alat-alat ukur peralatan navigasi peralatan optik jam dan lonceng/ Medical apphainces precisian navigation and optical instruments watche and clocks
2005 2 953 111 735 512 724
2006 2 667 61 047 409 057
2007 1 658 84 725 858 876
34. Industri kendaraan bermotor / Transport equipment
2005 85 553 783 077 9 282 450
2006 53 150 915 046 9 075 034
2007 135 067 1 292 083 15 597 732
35. Industri alat angkutan selain ken- daraan bermotor roda empat atau lebih / Transport equipment except four wheel or more
2005 47 167 874 736 4 437 048
2006 60 133 1 192 544 6 277894
2007 78 657 1 189 329 6 065 685
36. Industri furnitur dan industri pengolahan lainnya / Furniture and other product
2005 104 846 227 275 4 807 221
2006 30 916 255 666 4 240 610
2007 81 792 1 396 905 10 144 615
37. Daur ulang / Wastes or scraps Manufacture
2005 - 373 15 481
2006 45 839 55 010
2007 5 473 1 834 172 095
Jumlah/ Total
2005 1 532 653 15 236 180 163 389 850
2006 1 081 013 16 156 681 184 853 362
2007 1 362 656 18 821 696 204 551 180 Sumber : Badan Pusat Statistik Provinsi Jawa Barat Source : BPS – Statistics of Jawa Barat

MANUFACTURING, QUARRYING AND ENERGY
! Jawa Barat Dalam Angka/Jawa Barat in Figures 2010 333
Tabel Table 6.1.4
Nilai Output Menurut Golongan Industri di Jawa Barat Value of Gross Output by Group of Industry in Jawa Barat
(Juta/Millions Rp) 2005 - 2007
Golongan Industri Group of Industry
Tahun Year
Barang yang dihasilkan
Value of Goods Produced
Tenaga Listrik Yang dijual ke-Pada Pihak lainValue of Elec tricity Sold
Jasa IndustriYang
diberikan Kepada
Pihak Lain [1] [2] [3] [4] [5]
15. Industri Makanan dan Minuman Manufacture of Food Beverages
2005 15 801 052 16 881 961
2006 22 172 711 16 355 113
2007 26 469 206 515 286 997
16. Industri Pengolahan Tembakau/ Tabacco Industries
2005 1 806 949 - -
2006 792 141 - 54
2007 1 491 739 - -
17. Industri Tekstil / Textile Industries
2005 45 737 338 35 267 2 136 250
2006 47 214 431 36 630 2 987 214
2007 58 468 858 574 3 628 494
18. Industri Pakaian Jadi / Wearing Apparel Industries
2005 10 426 955 - 2 332 155
2006 11 779 836 1 924 2 717 341
2007 12 782 881 - 3 124 786
19. Industri Kulit barang dari Kulit dan alas kaki /Leather Industries
2005 6 449 814 5 2 143 708
2006 5 998 723 - 121 747
2007 5 109 321 - 212 045 Sumber : Badan Pusat Statistik Provinsi Jawa Barat Source : BPS – Statistics of Jawa Barat

INDUSTRI , PENGGALIAN DAN ENERGI
334 Jawa Barat Dalam Angka/Jawa Barat in Figures 2010 !
Tabel Table 6.1.4 Lanjutan
[Continued]
Golongan Industri Group of Industry
Tahun Year
Selisih Nilai Stock barang Setengah jadi Increase in Stock of Semi
Finished Goods
Pendapatan lainnya Bukan
Industri Receipt From Non Industrial
Service Rendered
Jumlah Total
[1] [2] [6] [7] [8]
15. Industri Makanan dan Minuman Manufacture of Food Beverages
2005 81 600 63 341 16 827 969
2006 122 225 523 183 23 173 248
2007 573 642 95 622 27 425 982
16. Industri Pengolahan Tembakau/ Tabacco Industries
2005 290 2 1 807 240
2006 663 4 120 796 978
2007 1 631 62 1 493 432
17. Industri Tekstil / Textile Industries
2005 786 627 620 625 49 316 106
2006 878 819 2 193 402 53 310496
2007 1 469 479 454 904 64 022 309
18. Industri Pakaian Jadi / Wearing Apparel Industries
2005 161 346 213 607 13 134 064
2006 172 385 565 440 15 236 925
2007 362 576 202 861 16 473 104
19. Industri Kulit barang dari Kulit dan alas kaki /Leather Industries
2005 46 551 274 448 8 914 525
2006 164 345 141 516 6 426 331
2007 209 294 24 135 5 554 795
Sumber : Badan Pusat Statistik Provinsi Jawa Barat Source : BPS – Statistics of Jawa Barat
MANUFACTURING, QUARRYING AND ENERGY
! Jawa Barat Dalam Angka/Jawa Barat in Figures 2010 335
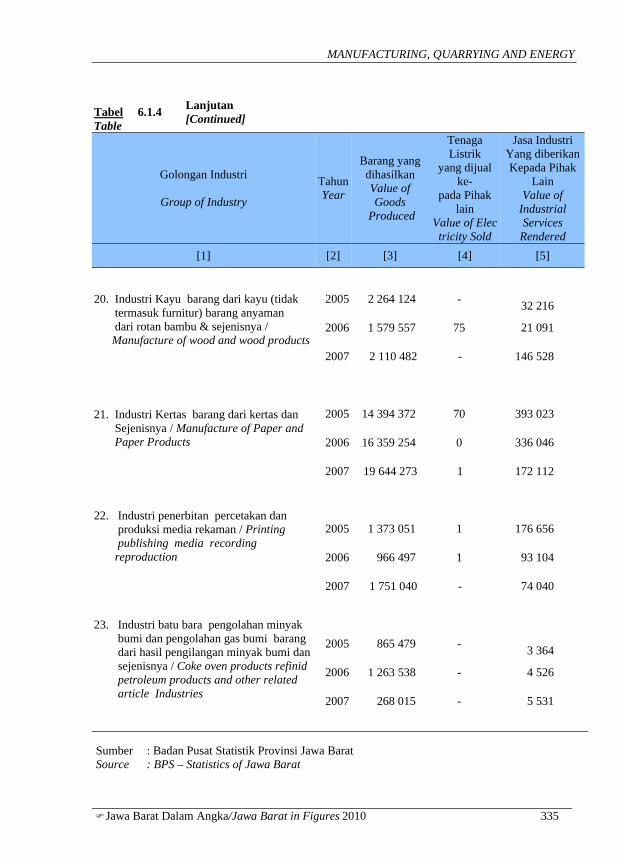
Tabel Table
6.1.4 Lanjutan [Continued]
Golongan Industri
Group of Industry
TahunYear
Barang yang dihasilkan Value of Goods
Produced
Tenaga Listrik
yang dijual ke-
pada Pihak lain
Value of Electricity Sold
Jasa Industri Yang diberikanKepada Pihak
Lain Value of
Industrial Services
Rendered [1] [2] [3] [4] [5]
20. Industri Kayu barang dari kayu (tidak termasuk furnitur) barang anyaman dari rotan bambu & sejenisnya / Manufacture of wood and wood products
2005 2 264 124 - 32 216
2006 1 579 557 75 21 091
2007 2 110 482 - 146 528
21. Industri Kertas barang dari kertas dan Sejenisnya / Manufacture of Paper and Paper Products
2005 14 394 372 70 393 023
2006 16 359 254 0 336 046
2007 19 644 273 1 172 112
22. Industri penerbitan percetakan dan produksi media rekaman / Printing publishing media recording reproduction
2005 1 373 051 1 176 656
2006 966 497 1 93 104
2007 1 751 040 - 74 040
23. Industri batu bara pengolahan minyak bumi dan pengolahan gas bumi barang dari hasil pengilangan minyak bumi dan sejenisnya / Coke oven products refinid petroleum products and other related article Industries
2005 865 479 - 3 364
2006 1 263 538 - 4 526
2007 268 015 - 5 531
Sumber : Badan Pusat Statistik Provinsi Jawa Barat Source : BPS – Statistics of Jawa Barat
INDUSTRI , PENGGALIAN DAN ENERGI
336 Jawa Barat Dalam Angka/Jawa Barat in Figures 2010 !
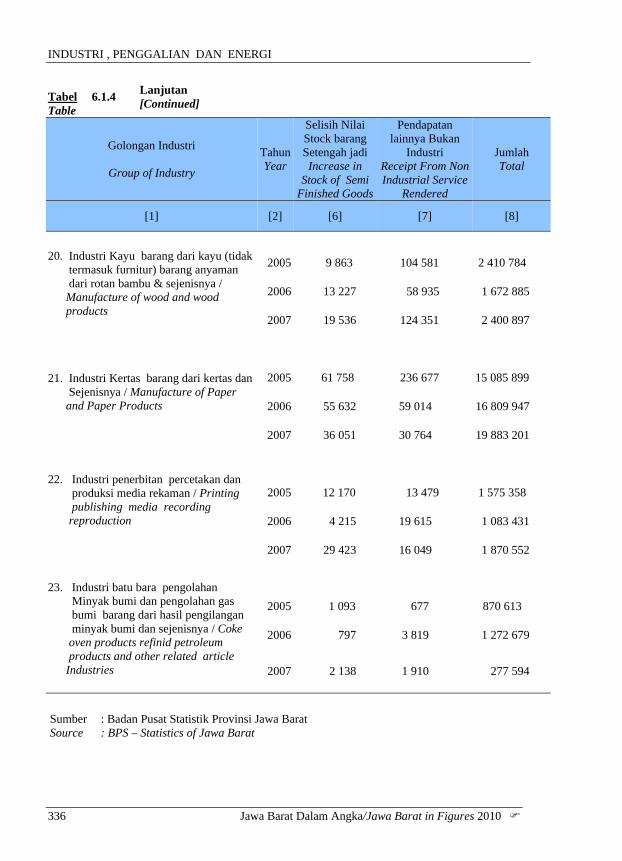
Tabel Table
6.1.4 Lanjutan [Continued]
Golongan Industri
Group of Industry
Tahun Year
Selisih Nilai Stock barang Setengah jadi Increase in
Stock of Semi Finished Goods
Pendapatan lainnya Bukan
Industri Receipt From Non Industrial Service
Rendered
Jumlah Total
[1] [2] [6] [7] [8]
20. Industri Kayu barang dari kayu (tidak termasuk furnitur) barang anyaman dari rotan bambu & sejenisnya / Manufacture of wood and wood products
2005 9 863 104 581 2 410 784
2006 13 227 58 935 1 672 885
2007 19 536 124 351 2 400 897
21. Industri Kertas barang dari kertas dan Sejenisnya / Manufacture of Paper and Paper Products
2005 61 758 236 677 15 085 899
2006 55 632 59 014 16 809 947
2007 36 051 30 764 19 883 201
22. Industri penerbitan percetakan dan produksi media rekaman / Printing publishing media recording reproduction
2005 12 170 13 479 1 575 358
2006 4 215 19 615 1 083 431
2007 29 423 16 049 1 870 552
23. Industri batu bara pengolahan Minyak bumi dan pengolahan gas bumi barang dari hasil pengilangan minyak bumi dan sejenisnya / Coke oven products refinid petroleum products and other related article Industries
2005 1 093 677 870 613
2006 797 3 819 1 272 679
2007 2 138 1 910 277 594
Sumber : Badan Pusat Statistik Provinsi Jawa Barat Source : BPS – Statistics of Jawa Barat

MANUFACTURING, QUARRYING AND ENERGY
! Jawa Barat Dalam Angka/Jawa Barat in Figures 2010 337
Tabel Table 6.1.4 Lanjutan
[Continued]
Golongan Industri
Group of Industry
Tahun Year
Barang yang dihasilkan Value of Goods
Produced
Tenaga Listrik
yang dijual ke-
pada Pihak lain
Value of Electricity Sold
Jasa Industri Yang diberikan Kepada Pihak
Lain Value of
Industrial Services Rendered
[1] [2] [3] [4] [5]
24. Industri Kimia dan barang -barang dari bahan kimia / Chemical and other chemical products
2005 24 309 854 20 1 550 613
2006 26 952 714 29 628 126
2007 31 248 156 9 2 769 656
25. Industri Karet barang dari karet dan barang dari plastik / Rubber rubber and plastics products
2005 23 127 070 101 1 202 850
2006 21 190 684 1 2 085 804
2007 19 130 101 1 916 284
26. Industri barang galian bukan logam / Other mineral non metal
2005 9 125 751 11 703 454 729
2006 8 298 388 - 524 837
2007 9 605 516 - 148 172
27. Industri logam dasar/ Basic metal
2005 13 295 703 - 349 812
2006 12 539 810 - 623 089
2007 12 907 279 - 266 914
28. Industri barang dari logam kecuali mesin dan peralatannya / Fabricated metal products except machinery and equipment products
2005 8 227 330 - 814 048
2006 9 141 441 - 722 927
2007 13 323 360 - 1 207 515 Sumber : Badan Pusat Statistik Provinsi Jawa Barat Source : BPS – Statistics of Jawa Barat

INDUSTRI , PENGGALIAN DAN ENERGI
338 Jawa Barat Dalam Angka/Jawa Barat in Figures 2010 !
Tabel Table 6.1.4 Lanjutan
[Continued]
Golongan Industri
Group of Industry
Tahun Year
Selisih Nilai Stock barang Setengah jadi Increase in
Stock of Semi Finished Goods
Penerimaan Lain
Bukan IndustriReceipt From Non Industrial
Services Rendered
Jumlah Total
[1] [2] [6] [7] [8]
24. Industri Kimia dan barang -barang dari bahan kimia / Chemical and other chemical products
2005 315 340 584 060 26 759 888
2006 165 242 2 953 817 30 699 926
2007 3 119 316 299 470 37 436 607
25. Industri Karet barang dari karet dan barang dari plastik / Rubber rubber and plastics products
2005 98 811 100 016 24 528 849
2006 65 864 303 646 22 645 999
2007 167 575 140 468 20 354 429
26. Industri barang galian bukan logam / Other mineral non metal
2005 12 700 90 264 9 695 147
2006 97 593 246 215 9 167 033
2007 360 853 15 672 10 130 213
27. Industri logam dasar/ Basic metal
2005 37 735 11 913 13 695 163
2006 30 280 25 973 13 219 152
2007 83 583 18 025 13 275 801
28. Industri barang dari logam kecuali mesin dan peralatannya / Fabricated metal products except machinery and equipment products
2005 139 059 114 107 9 294 544
2006 162 687 102 967 10 130 023
2007 172 964 68 903 14 772 742 Sumber : Badan Pusat Statistik Provinsi Jawa Barat Source : BPS – Statistics of Jawa Barat

MANUFACTURING, QUARRYING AND ENERGY
! Jawa Barat Dalam Angka/Jawa Barat in Figures 2010 339
Tabel Table 6.1.4 Lanjutan
[Continued]
Golongan Industri Group of Industry
TahunYear
Barang yang Dihasilkan
Value of Goods Produced
Tenaga Listrik
yang dijual ke-
pada Pihak lain
Value of Elec
tricity Sold
Jasa Industri Yang diberikan
Kepada Pihak LainValue of IndustrialServices Rendered
[1] [2] [3] [4] [5]
29. Industri mesin dan peralatannya Machinery and apparatus
2005 6 898 507
- 691 804
2006 12 559 211 - 931 280
2007 9 042 258 - 853 886
30. Industri mesin dan peralatan kantor akutansi dan pengolahan data / Office accounting and computering machinery
2005 1 670 039
- 83 776
2006 105 733 - 40 823
2007 8 019 - 224 041
31. Industri mesin lainnya dan Perlengkapannya / Other machinery and appratus
2005 8 764 053
- 411 194
2006 8 627 124 - 536 141
2007 8 362 850 - 689 543
32. Industri radio televisi dan peralatan komunikasi serta perlengkapannya / Radio televisian and communication equipment and appartus
2005 7 891 353
- 1 228 306
2006 26 474 003 - 1 053 922
2007 22 795 750 - 2 461 055 Sumber : Badan Pusat Statistik Provinsi Jawa Barat Source : BPS – Statistics of Jawa Barat

INDUSTRI , PENGGALIAN DAN ENERGI
340 Jawa Barat Dalam Angka/Jawa Barat in Figures 2010 !
Tabel Table 6.1.4 Lanjutan
[Continued]
Golongan Industri Group of Industry
Tahun Year
Selisih Nilai Stock barang Setengah jadi Increase in
Stock of Semi Finished Goods
Penerimaan Lain
Bukan Industri Receipt
From Non Industrial Services Rendered
Jumlah Total
[1] [2] [6] [7] [8]
29. Industri mesin dan peralatannya Machinery and apparatus
2005 180 155 124 595 7 895 061
2006 177 050 835 504 14 503 045
2007 191 869 411 517 10 499 530
30. Industri mesin dan peralatan kantor akutansi dan pengolahan data / Office accounting and computering machinery
2005 975 1 683 1 756 472
2006 -3 142 5 806 149 221
2007 (18 476) 39 342 252 926
31. Industri mesin lainnya dan Perlengkapannya / Other machinery and appratus
2005 57 104 52 435 9 284 786
2006 17 408 458 831 9 639 504
2007 542 415 39 665 9 634 473
32. Industri radio televisi dan peralatan komunikasi serta perlengkapannya / Radio televisian and communication equipment and appartus
2005 22 678 103 867 9 246 203
2006 225 253 231 602 27 984 780
2007 53 309 157 756 25 467 870
Sumber : Badan Pusat Statistik Provinsi Jawa Barat Source : BPS – Statistics of Jawa Barat

MANUFACTURING, QUARRYING AND ENERGY
! Jawa Barat Dalam Angka/Jawa Barat in Figures 2010 341
Tabel Table 6.1.4 Lanjutan
[Continued]
Golongan Industri Group of Industry
Tahun Year
Barang yang dihasilkan
Value of Goods Produced
Tenaga Listrik yang dijual ke-pada Pihak lainValue of Elec tricity Sold
Jasa Industri Yang diberikan
Kepada Pihak Lain Value of Industrial Services Rendered
[1] [2] [3] [4] [5] 33. Industri peralatan kedokteran alat-alat ukur peralatan navigasi peralatan optik jam dan lonceng / Medical pphainces preci sian navigation and optical instruments watches and clocks
2005 615 773 - 32 626
2006 812 477 - 102 947
2007 1 312 704 - 203 143
34. Industri kendaraan Bermotor / Transport equipment
2005 14 304 718 - 2 642 992
2006 16 750 914 - 1 588 204
2007 26 517 428 - 1 917 005
35. Industri alat angkutan selain kendaraan bermotor roda empat atau lebih /Transport equipment except four wheel or more
2005 4 909 623 - 731 903
2006 8 177 997 - 856 225
2007 7 974 829 - 1 010 028
36. Industri furnitur dan industri pengolahan lainnya / Furniture and other product
2005 6 255 194 3 127 546
2006 8 422 780 - 80 373
2007 14 179 523 - 841 153
37. Daur ulang / Wastes or scraps Manufacture
2005 21 218 -
-
2006 84 105 - -
2007 283 543 - 328
Jumlah /Total
2005 228 535 320 47 116 18 060 723 2006 268 264 067 38 676 15 410 934 2007 304 787 131 1 100 21 159 256
Sumber : Badan Pusat Statistik Provinsi Jawa Barat Source : BPS- Statistics of Jawa Barat

INDUSTRI , PENGGALIAN DAN ENERGI
342 Jawa Barat Dalam Angka/Jawa Barat in Figures 2010 !
Tabel Table 6.1.4 Lanjutan
[Continued]
Golongan Industri Group of Industry
Tahun Year
Selisih Nilai Stock barang Setengah jadi Increase in
Stock of Semi Finished Goods
Penerimaan Lain
Bukan IndustriReceipt From Non Industrial
Services Rendered
Jumlah Total
[1] [2] [6] [7] [8] 33. Industri peralatan kedokteran alat-alat ukur peralatan navigasi peralatan optik jam dan lonceng / Medical
2005 9 836 681 658 916
2006 20 161 14 351 949 936 2007 53 426 19 104 1 588 377
34. Industri kendaraan Bermotor / Transport equipment
2005 329 204 58 470 17 335 384
2006 243 516 299 857 18 882 492
2007 493 357 75 511 29 003 301
35. Industri alat angkutan selain kendaraan bermotor roda empat atau lebih /Transport equipment except four wheel or more
2005 626 897 2 940 6 271 363
2006 716 464 114 085 9 864 772
2007 844 844 22 843 9 852 544
36. Industri furnitur dan industri pengolahan lainnya / Furniture and other product
2005 106 314 1 297 709 7 786 765 2006 86 819 99 578 8 689 580 2007 314 756 101 526 15 436 958
37. Daur ulang / Wastes or scraps Manufacture
2005 101 0 21 320
2006 327 901 85 333
2007 268 814 284 953
Jumlah /Total
2005 3 098 208 4 070 176 254 172 419 2006 3 417 831 9 262 178 296 393 685 2007 9 083 829 2 361 274 337 392 590
Sumber : Badan Pusat Statistik Provinsi Jawa Barat Source : BPS- Statistics of Jawa Barat

MANUFACTURING, QUARRYING AND ENERGY
! Jawa Barat Dalam Angka/Jawa Barat in Figures 2010 343
Tabel Table 6.1.5
Perkembangan Industri Kecil Menengah di Jawa Barat Growth of Small and Medium Scale Industries in Jawa Barat
2009
Kabupaten/Kota Regency/City
Unit Usaha Establishment
Tenaga Kerja Labour
Investasi Investment
(Rp Juta / Millions)
[1] [2] [3] [4] Kab/Reg. 01. Bogor 14 333 135 733 2 122 770,88 02. Sukabumi 15 329 128 748 98 860,02 03. Cianjur 1 211 106 892 11 806,30 04. Bandung 12 269 123 812 450 671,15 05. G a r u t 9 763 102 592 21 594,61 06. Tasikmalaya 1 382 91 161 48 847,58 07. C i a m i s 1 313 68 806 1 842,07 08. Kuningan 2 169 106 134 20 469,90 09. Cirebon 10 427 32 029 68 349,00 10. Majalengka 7 366 93 866 22 142,65 11. Sumedang 5 030 103 540 42 408,90 12. Indramayu 2 329 76 381 5414,00 13. Subang 3 380 48 858 95 583,91 14. Purwakarta 10 704 32 004 85 399,64 15. Karawang 9 242 114 150 214 292,95 16. B e k a s i 10 580 118 106 2 061 796,60 17. Bandung Barat 16 480 14 980,00 Kota/City 18. B o g o r 7 761 111 101 110 108,67 19. Sukabumi 9 363 77 008 8 295,65 20. Bandung 10 701 72 431 69 253,40 21. Cirebon 9 324 99 702 2 701,05 22. Bekasi 9 775 49 791 165 900,30 23. Depok 9 949 110 264 103 056,37 24. Cimahi 6 028 109 267 31 573,95 25. Tasikmalaya 9 591 74 818 155 673,05 26. Banjar 9 143 92 701 6 640,61
Jawa Barat 198 478 2 280 375 6 040 433,20 Sumber : Dinas Perindustrian dan Perdagangan Provinsi Jawa Barat Source : Provincial Industrial and Trade Service of Jawa Barat
INDUSTRI , PENGGALIAN DAN ENERGI
344 Jawa Barat Dalam Angka/Jawa Barat in Figures 2010 !
Tabel Table 6.1.6
Perkembangan Industri Besar di Jawa Barat Growth of Large Scale Industries in Jawa Barat
2009
Kabupaten/Kota Regency/City
Unit Usaha Establishment
Tenaga Kerja Labour
Investasi Investment
(Rp Juta Millions)
[1] [2] [3] [4] Kab/Reg. 01. Bogor 464 199 357 586 828,40 02. Sukabumi 50 80 191 182 794,77 03. Cianjur 8 52 103 - 04. Bandung 1 200 64 443 653 523,14 05. G a r u t 11 64 838 21 750,00 06. Tasikmalaya 13 80 160 68 000,00 07. C i a m i s 18 68 806 - 08. Kuningan 10 85 514 - 09. Cirebon 210 56 294 - 10. Majalengka 15 49 528 15 000,00 11. Sumedang 78 55 937 15 100,00 12. Indramayu 25 47 010 - 13. Subang 30 91 835 1 223 944,29 14. Purwakarta 87 84 127 100 207 571,48 15. Karawang 72 101 430 11 351 799,98 16. B e k a s i 115 74 543 1 512 528,77 17. Bandung Barat 1 1 200 55 000,00 Kota/City 17. B o g o r 328 155 774 1 081 204,70 18. Sukabumi 72 53 123 - 19. Bandung 116 46 689 16 997,00 20. Cirebon 28 58 294 - 21. Bekasi 106 56 713 2 476 640,00 22. Depok 252 51 307 97 590,00 23. Cimahi 43 77 948 301 224,50 24. Tasikmalaya 84 43 246 - 25. Banjar 39 62 106 15000,00
Jawa Barat 3 475 1 914 235 119 882 497,02 Sumber : Dinas Perindustrian dan Perdagangan Provinsi Jawa Barat Source : Provincial Industrial and Trade Service of Jawa Barat

MANUFACTURING, QUARRYING AND ENERGY
! Jawa Barat Dalam Angka/Jawa Barat in Figures 2010 345
Tabel Table 6.1.7
Jumlah Unit Industri Kecil Menengah dan Besar di Jawa Barat Number of Small Medium and Large Scale Industries in Jawa Barat
2009
Kabupaten/Kota Regency/City
Unit Usaha Establishment
Tenaga Kerja Labour
Investasi Investment
(Rp Juta / Millions)
[1] [2] [3] [4] Kab/Reg. 01. Bogor 14 797 335 090 2 709 599,28 02. Sukabumi 15 379 208 939 281 654,79 03. Cianjur 1 219 158 995 11 806,30 04. Bandung 13 469 188 255 1 104 194,29 05. G a r u t 9 774 167 430 43 344,61 06. Tasikmalaya 1 395 171 321 116 847,58 07. C i a m i s 1 331 137 612 1 842,07 08. Kuningan 2 179 191 648 20 469,90 09. Cirebon 10 637 88 323 68 349,00 10. Majalengka 7 381 143 394 37 142,65 11. Sumedang 5 108 159 477 57 508,90 12. Indramayu 2 354 123 391 5 414,00 13. Subang 3 410 140 693 1 319 528,20 14. Purwakarta 10 791 116 131 100 292 971,12 15. Karawang 9 314 215 580 11 566 092,93 16. B e k a s i 10 695 192 649 3 574 325,37 17. Bandung Barat 17 1 680 29 980,00 Kota/City 17. B o g o r 8 089 266 875 1 191 313,37 18. Sukabumi 9 435 130 131 8 295,65 19. Bandung 10 817 119 120 86 250,40 20. Cirebon 9 352 157 996 2 701,05 21. Bekasi 9 881 106 504 2 642 540,30 22. Depok 10 201 161 571 200 646,37 23. Cimahi 6 071 187 215 332 798,45 24. Tasikmalaya 9 675 118 064 155 673,05 25. Banjar 9 182 154 807 21 640,61
Jawa Barat 201 953 4 194 610 125 922 930,22 Sumber : Dinas Perindustrian dan Perdagangan Provinsi Jawa Barat Source : Provincial Industrial and Trade Service of Jawa Barat

INDUSTRY, PENGGALIAN DAN ENERGY
346 Jawa Barat Dalam Angka/Jawat Barat in Figures 2010 !
Tabel Table 6.2.1
Volume Pengambilan Air per Bulan Se - Jawa Barat Volume of Water Resource Taken every Month in Jawa Barat
2009
Wilayah/Area Januari/January Februari/February Maret/March
Volum (M3) Volume
Volum (M3) Volume
Volum (M3) Volume
[1] [2] [3] [4] Wilayah I Cianjur
1. Kab. Bogor 2 990 632 3 141 488 3 537 207 2. Kota Bogor 77 381 78 979 80 884 3. Kota Depok 244 388 248 901 250 395 4. Kab. Sukabumi 986 362 959 312 741 609 5. Kota Sukabumi 145 243 128 018 95 917 6. Kab. Cianjur 496 870 491 159 496 870
Jumlah/Total 4 940 876 5 047 857 5 202 882 Wilayah II Purwakarta
7. Kab. Purwakarta 152 123 153 196 152 638 8. Kab. Karawang 255 749 260 116 248 222 9. Kab. Bekasi 532 088 535 237 495 555 10. Kota Bekasi 435 125 439 457 440 249 11. Kab. Subang 344 880 324 915 312 049
Jumlah/Total 1 719 965 1 712 921 1 648 713 Wilayah III Tasikmalaya
12. Kab. Bandung 852 178 869 726 845 757 13. Kab. Bandung Barat 630 567 667 328 568 786 14. Kota Bandung 1 245 533 1 202 248 1 200 974 15. Kab. Sumedang 407 981 383 206 382 182 16. Kab. Garut 319 787 319 860 319 697 17. Tasikamalaya 3 806 3 880 3 649 18. Ciamis 26 810 24 386 23 982 19. Kota Tasikmalaya 37 180 39 850 35 029 20. Kota Cimahi 573 290 610 021 579 709 21. Kota Banjar 4 554 4 480 3 947
Jumlah/Total 4 101 686 4 124 985 3 963 712 Wilayah IV Cirebon
22. Kab. Cirebon 327 322 393 281 318 23. Kota Cirebon 17 817 17 511 17 775 24. Kab. Indramayu 41 001 41 061 41 001 25. Kab.Kuningan 2 910 905 2 914 265 2 804 652 26. Kab. Majalengka 65 384 64 553 66 696
Jumlah/Total 3 035 434 3 359 783 3 211 442
Jumlah Total/Grand Total
13 797 961
14 245 546
14 026 749
Sumber : Dinas Pertambangan Provinsi Jawa Barat Source : Provincial Quarrying Service of Jawa Barat
MANUFACTURING, QUARRYING AND ENERGY
! Jawa Barat Dalam Angka/Jawa Barat in Figures 2010 347
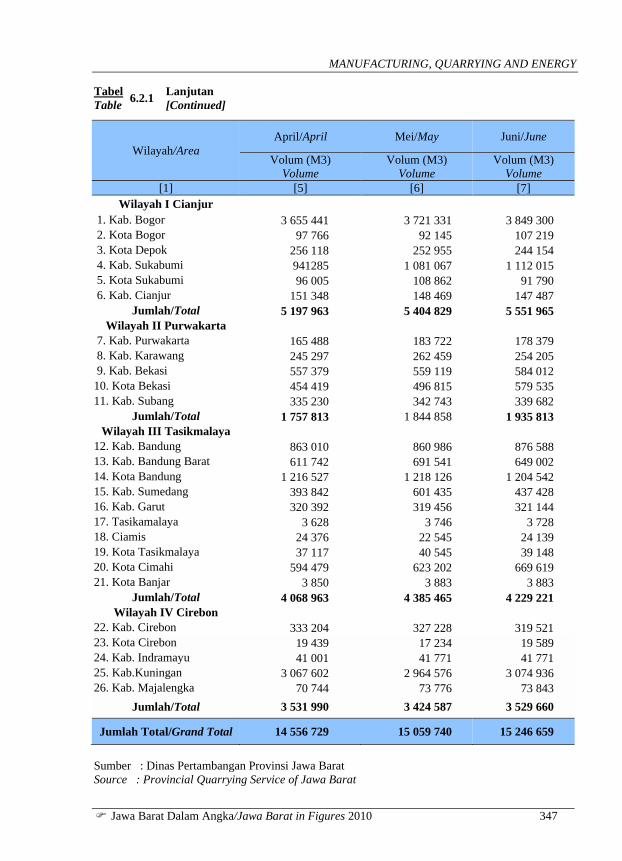
Tabel Table 6.2.1 Lanjutan
[Continued]
Wilayah/Area April/April Mei/May Juni/June
Volum (M3) Volume
Volum (M3) Volume
Volum (M3) Volume
[1] [5] [6] [7] Wilayah I Cianjur
1. Kab. Bogor 3 655 441 3 721 331 3 849 300 2. Kota Bogor 97 766 92 145 107 219 3. Kota Depok 256 118 252 955 244 154 4. Kab. Sukabumi 941285 1 081 067 1 112 015 5. Kota Sukabumi 96 005 108 862 91 790 6. Kab. Cianjur 151 348 148 469 147 487
Jumlah/Total 5 197 963 5 404 829 5 551 965 Wilayah II Purwakarta
7. Kab. Purwakarta 165 488 183 722 178 379 8. Kab. Karawang 245 297 262 459 254 205 9. Kab. Bekasi 557 379 559 119 584 012 10. Kota Bekasi 454 419 496 815 579 535 11. Kab. Subang 335 230 342 743 339 682
Jumlah/Total 1 757 813 1 844 858 1 935 813 Wilayah III Tasikmalaya
12. Kab. Bandung 863 010 860 986 876 588 13. Kab. Bandung Barat 611 742 691 541 649 002 14. Kota Bandung 1 216 527 1 218 126 1 204 542 15. Kab. Sumedang 393 842 601 435 437 428 16. Kab. Garut 320 392 319 456 321 144 17. Tasikamalaya 3 628 3 746 3 728 18. Ciamis 24 376 22 545 24 139 19. Kota Tasikmalaya 37 117 40 545 39 148 20. Kota Cimahi 594 479 623 202 669 619 21. Kota Banjar 3 850 3 883 3 883
Jumlah/Total 4 068 963 4 385 465 4 229 221 Wilayah IV Cirebon
22. Kab. Cirebon 333 204 327 228 319 521 23. Kota Cirebon 19 439 17 234 19 589 24. Kab. Indramayu 41 001 41 771 41 771 25. Kab.Kuningan 3 067 602 2 964 576 3 074 936 26. Kab. Majalengka 70 744 73 776 73 843
Jumlah/Total 3 531 990 3 424 587 3 529 660
Jumlah Total/Grand Total 14 556 729 15 059 740 15 246 659
Sumber : Dinas Pertambangan Provinsi Jawa Barat Source : Provincial Quarrying Service of Jawa Barat

INDUSTRY, PENGGALIAN DAN ENERGY
348 Jawa Barat Dalam Angka/Jawat Barat in Figures 2010 !
Tabel Table 6.2.1 Lanjutan
[Continued]
Wilayah/Area Juli/July Agustus/August September/
September
Volume (M3) Volume
Volume (M3) Volume
Volume (M3) Volume
[1] [8] [9] [10] Wilayah I Cianjur
1. Kab. Bogor 3 900 970 3 860 217 3 851 756 2. Kota Bogor 91 186 101 075 109 407 3. Kota Depok 271 446 267 928 239 226 4. Kab. Sukabumi 1 052 482 1 067 673 752 599 5. Kota Sukabumi 114 222 109 094 116 124 6. Kab. Cianjur 147 189 157 756 170 138
Jumlah/Total 5 577 495 5 563 743 5 239 250 Wilayah II Purwakarta
7. Kab. Purwakarta 185 340 186 252 173 736 8. Kab. Karawang 257 848 252 023 269 951 9. Kab. Bekasi 618 903 664 147 585 542 10. Kota Bekasi 506 886 519 499 526 483 11. Kab. Subang 360 657 364 356 351 984
Jumlah/Total 1 929 634 1 986 277 1 907 696 Wilayah III Tasikmalaya
12. Kab. Bandung 925 728 885 226 795 682 13. Kab. Bandung Barat 638 503 669 200 633 499 14. Kota Bandung 1085 978 1 121 454 968 996 15. Kab. Sumedang 468 477 480 179 461 556 16. Kab. Garut 320 492 319 725 319 886 17. Tasikamalaya 3 620 3 635 4 122 18. Ciamis 23 297 23 411 22 450 19. Kota Tasikmalaya 40 394 42 872 40 277 20. Kota Cimahi 669 752 672 201 586 029 21. Kota Banjar 3 907 3 589 4 125
Jumlah/Total 4 180 148 4 221 492 3 836 622 Wilayah IV Cirebon
22. Kab. Cirebon 319 353 306 724 326 454 23. Kota Cirebon 63 457 22 641 27 293 24. Kab. Indramayu 41 771 41 771 41 771 25. Kab.Kuningan 2 999 788 3 153 496 3 022 782 26. Kab. Majalengka 71 524 75 842 81 282
Jumlah/Total 3 495 893 3 600 474 3 499 582 Jumlah Total/Grand Total 15183170 15371986 14 483 150
Sumber : Dinas Pertambangan Provinsi Jawa Barat Source : Provincial Quarrying Service of Jawa Barat

MANUFACTURING, QUARRYING AND ENERGY
! Jawa Barat Dalam Angka/Jawa Barat in Figures 2010 349
Tabel Table 6.2.1 Lanjutan
[Continued]
Wilayah/Area Oktober/October November/November Desember/
December
Volume (M3) Volume
Volume (M3) Volume
Volume (M3) Volume
[1] [11] [12] [13] Wilayah I Cianjur
1. Kab. Bogor 3 839 978 3 867 350 3 780 153 2. Kota Bogor 108 127 81 189 66 570 3. Kota Depok 257 875 258 821 249 233 4. Kab. Sukabumi 782 205 762 460 724 597 5. Kota Sukabumi 133 603 125 587 123 077 6. Kab. Cianjur 160 829 126 407 165 256
Jumlah/Total 5 282 617 5 221 814 5 108 886 Wilayah II Purwakarta
7. Kab. Purwakarta 169 599 171 343 160 391 8. Kab. Karawang 262 111 278 712 257 995 9. Kab. Bekasi 601 466 690 651 642 918 10. Kota Bekasi 535 798 544 842 537 838 11. Kab. Subang 377 230 390 846 356 152
Jumlah/Total 1 946 204 2 076 394 1 955 294 Wilayah III Tasikmalaya
12. Kab. Bandung 858 410 904 992 856 851 13. Kab. Bandung Barat 681 482 652 960 610 534 14. Kota Bandung 1 050 746 1 048 811 999 381 15. Kab. Sumedang 474 412 500 981 494 042 16. Kab. Garut 321 990 321 805 320 288 17. Tasikamalaya 4 173 4 183 4 134 18. Ciamis 22 851 24 085 23 663 19. Kota Tasikmalaya 44 370 44 674 52 750 20. Kota Cimahi 572 956 620 187 612 665 21. Kota Banjar 4 436 4 088 3 544
Jumlah/Total 4 035 826 4 126 766 3 977 852 Wilayah IV Cirebon
22. Kab. Cirebon 305 414 304 256 293 174 23. Kota Cirebon 20 247 21 415 27 056 24. Kab. Indramayu 42 279 42 520 50 916 25. Kab.Kuningan 2 945 827 2 945 132 2 949 730 26. Kab. Majalengka 72 543 71 393 70 287
Jumlah/Total 3 386 310 3 384 716 3 391 163 Jumlah Total/Grand Total 14 650 958 14 809 690 14 433 195
Sumber : Dinas Pertambangan Provinsi Jawa Barat Source : Provincial Quarrying Service of Jawa Barat

INDUSTRY, PENGGALIAN DAN ENERGY
350 Jawa Barat Dalam Angka/Jawat Barat in Figures 2010 !
Tabel Table 6.2.2
Data Usaha Pertambangan Berdasarkan SK Bupati di Jawa Barat Mining Establishment Data Based on Regent Decree in Jawa Barat
2009
Kabupaten/Kota Regency/City
Data Usaha Pertambangan/Mining Establishment Data
Jumlah Ijin Usaha Pertambangan/
Number of Mining Establishment Permit
Luas/ Area (ha)
[1] [2] [3] Kab/Reg. 01. Bogor 74 12 665,75 02. Sukabumi 14 1 041,00 03. Cianjur 2 7 608,00 04. Bandung 1 954,10 05. Garut 4 6 947,00 06. Tasikmalaya 45 3 457.34 07. Ciamis 5 12 335.70 08. Kuningan - - 09. Cirebon - - 10. Majalengka - - 11. Sumedang - - 12. Indramayu - - 13. Subang - - 14. Purwakarta 1 50 15. Karawang - - 16. Bekasi - - 17. Bandung Barat - - Kota/City 18. Bogor - - 19. Sukabumi - - 20. Bandung - - 21. Cirebon - - 22. Bekasi - - 23. Depok - - 24. Cimahi - - 25. Tasikmalaya - - 26. Banjar - -
Jumlah/ Total 146 45 058.89
Sumber : Dinas Pertambangan Provinsi Jawa Barat Source : Provincial Quarrying Service of Jawa Barat
MANUFACTURING, QUARRYING AND ENERGY
! Jawa Barat Dalam Angka/Jawa Barat in Figures 2010 351
Tabel Table 6.2.3
Produksi Bahan Galian Tambang Di Jawa Barat Mining Material Production in Jawa Barat
(Ton) 2007-2009
Jenis Bahan Galian/ Mining Material
Produksi / Production (ton)
2007 2008 2009*)
[1] [2] [3] [4] 1. Andesit 495 932 125 288 10 145 398 2. Batu Kapur 1 401 738 4 588 1 224 854 3. Bentonit 35 918 - 2 388 228 4. Feldspar 16 234 - 12 177 5. Fosfat - 578 3 183 6. Marmer 165 4 006 158 190 7. Pasir 293 264 323 760 - 8. Sirtu 3 248 17 203 999 813 9. Pasir Kuarsa 88 379 3 386 240 118 10. Tanah Liat 314 061 58 041 390 268 11. Lempung - - - 12. Pasir/ Tanah Urug 9 936 571 1 217 748 13. Trass 12 675 - 2 337 617 14. Zeolit 7 138 140 75 423 15. Batu Bukat / Kali - 3 363 - 16. Pasir Besi - 40 130 24 17. Batu ½ Permata - - 9 18. Dacite - - - 20. Emas 2 324 - 8 615 21. Perak 2 - 57 736 22. Mangan - 48 696 90 23. Gipsum - 3 161 - 24. Bijih Besi - 9 596 - 25. Barit - 100 - Sumber : Dinas Pertambangan Provinsi Jawa Barat Source : Provincial Quarrying Service of Jawa Barat Catatan : *) Angka Sementara / Premilinary Figures

INDUSTRY, PENGGALIAN DAN ENERGY
352 Jawa Barat Dalam Angka/Jawat Barat in Figures 2010 !
Tabel Table 6.2.4
Rekapitulasi Realisasi Paket Perdana (Tabung LPG 3 Kg, Kompor, Regulator) Program Konversi Minyak Tanah ke LPG
2007-2009
Kabupaten / Kota Regency / City 2007 2008 2009*)
Jumlah (Akumulasi)
[1] [2] [3] [4] [5] Kab/Reg. 01. Bogor - 1 224 964 - 1 224 964 02. Sukabumi - 178 500 534 852 713 352 03. Cianjur - 494 247 191 407 685 654 04. Bandung - 825 017 16 598 841 615 05. G a r u t - 232 400 445 833 678 233 06. Tasikmalaya - 30 232 511 702 541 934 07. C i a m i s - 48 795 474 633 523 428 08. Kuningan - 28 732 297 261 325 993 09. Cirebon - 414 426 245 593 660 019 10. Majalengka - 114 621 267205 381 826 11. Sumedang - 48 971 337 034 386 005 12. Indramayu - 510 584 48 307 558 891 13. Subang - 335 038 169 419 504 457 14. Purwakarta - 218 873 53 178 272 051 15. Karawang - 567 032 53 663 620 695 16. B e k a s i 295 117 250 417 4 008 549 542 17. Bandung Barat - 369 869 - 369 869 Kota/City 18. B o g o r - 218 175 - 218 175 19. Sukabumi - 56 77 080 77 136 20. Bandung 240 125 358 354 - 598 479 21. Cirebon - 68 130 15 690 83 820 22. Bekasi 142 061 281 951 - 424 012 23. Depok 188 844 190 943 - 379 787 24. Cimahi 80 000 70 046 - 150 046 25. Tasikmalaya - 61 213 91 544 152 757 26. Banjar - 4 199 53 275 57 474
Jawa Barat 946 147 7 145 785 3 888 282 11 980 214 Sumber : Dinas Pertambangan Provinsi Jawa Barat Source : Provincial Quarrying Service of Jawa Barat Catatan : *) Angka Sementara / Premilinary Figures

MANUFACTURING, QUARRYING AND ENERGY
! Jawa Barat Dalam Angka/Jawa Barat in Figures 2010 353
Tabel Table 6.3.1
Jumlah Pelanggan, Daya Tersambung dan Energi Listrik Terjual Menurut Lokasi di Jawa Barat
Number of Customers, Quantity of Power Installed and Electricity Sold by Location in Jawa Barat
2009
Cabang Branch Location
Jumlah Pelanggan Number of Customers
Daya Tersambung Power Installed
(VA)
Energi yang Terjual Electricity Sold
(KWH) [1] [2] [3] [4]
01. Cirebon 995 665 936 982 490 2 070 126 111
02. Tasikmalaya 780 545 582 749 145 948 802 501
03. G a r u t 330 853 238 953 683 428 288 655
04. Cianjur 338 845 288 126 764 465 054 248
05. Sukabumi 430 568 448 204 520 818 009 353
06. B o g o r 852 772 1 714 841 861 4 383 826 547
07. Purwakarta 484 823 638 219 790 1 593 425 858
08. C i m a h i 368 235 697 799 216 1 884 314 396
09. Bandung 590 477 1 589 446 405 3 277 250 564
10. Majalaya 405 230 646 960 300 1 855 310 449
11. B e k a s i 758 692 1 946 234 363 4 893 207 625
12. D e p o k 478 043 753 386 114 1 512 840 742
13. Karawang 436 586 1 056 943 420 2 934 384 668
14. Sumedang 480 464 545 021 110 1 689 150 942
Jumlah / Total 7 731 798 12 628 890 291
30 443 143 601
2008 7 423 439 11 536 602 516 27 943 963 690
2007 7 051 034 10 907 518 685 26 552 641 810
Sumber : PT PLN Distribusi Jawa Barat dan Banten Source : State Electricity Company Jawa Barat and Banten Distribution

INDUSTRI, PENGGALIAN DAN ENERGY
354 Jawa Barat Dalam Angka/Jawa Barat in Figures 2010 !
Tabel Table 6.3.2
Jumlah Transformator Distribusi Terpasang di Jawa Barat Number of Installed Distribution Transformers in Jawa Barat
2009
Cabang Branch Location
1 - 50 KVA 051 – 100 KVA 101 - 200 KVA 201 - 500 KVA
Unit Unit
Daya Capacity
Unit Unit
Daya Capacity
Unit Unit
Daya Capacity
Unit Unit
Daya Capacity
[1] [2] [3] [4] [5] [6] [7] [8] [9]
01. Cirebon 1 295 60 450 1 003 100 300 1 034 177 400 495 153 455
02.Tasikmalaya 2 962 121 539 622 62 200 372 62 960 153 44 020
03. G a r u t 932 39 650 372 37 175 155 26 120 81 23 020
04. Cianjur 997 42 300 343 34300 237 40720 107 29 840
05. Sukabumi 1 265 51 525 507 50 700 329 56 160 141 40 870
06. B o g o r 243 11 650 902 90 200 880 155 640 1 044 320 490
07. Purwakarta 949 44 125 676 67 600 342 59 080 167 46 770
08. C i m a h i 377 15 250 283 28 300 280 49 200 481 158 990
09. Bandung 25 1 150 81 8 100 150 27 240 1 053 371 190
10. Majalaya 243 11 330 374 37 375 358 62 110 359 102 505
11. B e k a s i 107 5 175 607 60 700 744 133 040 1 417 434 395
12. D e p o k 40 2 000 239 23 575 222 41 760 536 171 365
13. Karawang 351 15 625 383 38 225 523 92 120 271 75 325
14. Sumedang 913 37 150 472 47 200 365 63 320 152 43 545
Jumlah / Total 10 699 458 919 6 864 685 950 5 991 1 046 870 6 457 2 015 780
2008 10 469 442 980 6 399 638 989 5 782 1 008 710 6 241 1 966 430
2007 10 642 440 580 5 908 589 889 4 995 870 350 5 101 1 643 085
2006 12 882 529 500 5 531 514 446 4 687 816 680 4 617 1 471 370
Sumber : PT PLN Distribusi Jawa Barat dan Banten Source : State Electricity Company Jawa Barat and Banten Distribution

MANUFACTURING, QUARRYING AND ENERGY
! Jawa Barat Dalam Angka/Jawa Barat in Figures 2010 355
Tabel Table 6.3.2 Lanjutan
Continued
Cabang Branch Location
501 - 1000 KVA 1001 KVA dan Lebih Jumlah /Total
Unit Unit
Daya Capacity
Unit Unit
Daya Capacity
Unit Unit
Daya Capacity
[1] [10] [11] [12] [13] [14] [15]
01. Cirebon 87 65 680 6 11 700 3 920 568 985
02. Tasikmalaya 16 10 450 7 12 100 4 132 313 269
03. G a r u t 6 3 780 0 0 1 546 129 745
04. Cianjur 22 15 340 2 3 200 1 708 165 700
05. Sukabumi 45 31 990 24 41 850 2 311 273 095
06. B o g o r 276 175 345 10 22 000 3 355 775 325
07. Purwakarta 39 29 830 44 121 000 2 217 368 405
08. C i m a h i 213 150 630 108 206 550 1 742 608 920
09. Bandung 723 502 745 217 383 950 2 249 1 294 375
10. Majalaya 137 96 870 86 173 700 1 557 483 890
11. B e k a s i 446 280 980 0 0 3 321 914 290
12. D e p o k 268 172 510 23 38 290 1 328 449 500
13. Karawang 14 8 820 2 2 500 1 544 232 615
14. Sumedang 16 12 705 26 105 000 1 944 308 920
Jumlah / Total 2 308 1 557 675 555 1 121 840 32 874 6 887 034
2008 2 209 1 500 479 648 1 416 890 31 748 6 974 478
2007 2 234 1 536 959 717 1 549 390 29 597 6 630 253
2006 1 186 752 535 16 54 300 26 484 4 075 933
Sumber : PT PLN Distribusi Jawa Barat dan Banten Source : State Electricity Company Jawa Barat and Banten Distribution

INDUSTRI, PENGGALIAN DAN ENERGY
356 Jawa Barat Dalam Angka/Jawa Barat in Figures 2010 !
Tabel Table 6.3.3
Jumlah Pelanggan, Daya Tersambung dan Energi Listrik Terjual Menurut Jenis Tarif di Jawa Barat
Number of Customers, Quantity of Power Installed and Electricity Sold by Kind of Rate in Jawa Barat
2009
JenisTarif Kind of Tariffs
Jumlah Pelanggan Number of Customers
Daya TersambungPower Installed
(KWH)
Energi yang Terjual Electricity Sold
(Ribu /Thousand KWH)
[1] [2] [3] [4]
S ( Sosial ) 158 786 279 046 790 46 6 113 326
R ( Rumah Tangga ) 7 227 571 5 639 606 600 1 0723 598 179
B ( Bisnis ) 225 502 1 566 393 710 2 675 200 062
I ( Industri ) 10 636 4 225 273 250 14 336 095 349
P ( Publik ) 34 952 221 120 331 429 211 909
*)T/M 74 351 152 428 500 123 773 834
Jumlah / Total 7 731 798 12 083 869 181 28 753 992 659
Sumber : PT PLN Distribusi Jawa Barat dan Banten Source : State Electricity Company Jawa Barat and Banten Distribution

MANUFACTURING, QUARRYING AND ENERGY
! Jawa Barat Dalam Angka/Jawa Barat in Figures 2010 357
Tabel Table 6.3.4
Penyediaan, Penjualan dan Susut Energi Listrik di Jawa BaratElectricity Supply, Sold and Loses in Jawa Barat
(Ribu/Thousands KWH) 2009
Cabang Branch Location
Energi Siap Jual
Ready Sold Energy
Penjualan Sold
Susut Loses
[1] [2] [3] [4]
01. Cirebon 292 712 930 262 119 858 23 331 380
02 Tasikmalaya 437 441 511 380 304 163 40 091 452
03 G a r u t 388 805 345 357 043 621 31 644 343
04 Cianjur 212 064 391 201 203 408 10 858 129
05 Sukabumi 157 225 306 145 581 562 11 596 105
06 B o g o r 134 190 989 125 330 971 8 860 018
07 Purwakarta 184 098 227 173 226 804 10 764 640
08 C i m a h i 161 864 429 148 078 104 12 486 144
09. Bandung 131 845 850 126 895 518 4 950 332
10. Majalaya 135 122 109 118 729 189 15 278 914
11. B e k a s i 9 0 267 299 78 966 121 11 301 178
12. D e p o k 7 6 553 582 66 693 643 8 210 864
13. Karawang 46 182 830 38 452 828 7 730 002
14. Sumedang 45 320 619 34 500 993 5 428 908
Jumlah/Total 2 493 695 417 2 257 126 781 202 532 410
Sumber : PT PLN Distribusi Jawa Barat dan Banten Source : State Electricity Company Jawa Barat and Banten Distribution

INDUSTRI, PENGGALIAN DAN ENERGY
358 Jawa Barat Dalam Angka/Jawa Barat in Figures 2010 !
Tabel Tabel 6.3.5
Jumlah Desa Berlistrik,Langganan Listrik Pedesaan dan Daya Tersambung Menurut Lokasi di Jawa Barat Number Villages Having Electricity,Customers and Power Installed by Location in Jawa Barat
2009
Cabang Branch Location
Desa berlistrik Village Having
Electricity
Jumlah langganan Number of Customers
Daya Tersambung Power Installed
(MVA)
[1] [2] [3] [4]
01. Cirebon 1 135 942 856 633
02. Tasikmalaya 737 734 297 470
03. G a r u t 424 312 472 197
04. Cianjur 348 317 831 216
05. Sukabumi 392 405 306 277
06. B o g o r 496 805 307 681
07. Purwakarta 445 461 708 297
08. C i m a h i 234 351 484 283
09. Bandung 426 541 654 664
10. Majalaya 334 387 606 277
11. B e k a s i 243 715 851 734
12. D e p o k 63 452 963 445
13. Karawang 309 413 687 293
14. Sumedang 277 458 247 282
Jumlah/Total 5 863 7 301 269 5 749
Sumber : PT PLN Distribusi Jawa Barat dan Banten Source : State Electricity Company Jawa Barat and Banten Distribution
MANUFACTURING, QUARRYING AND ENERGY
! Jawa Barat Dalam Angka/Jawa Barat in Figures 2010 359
Tabel Table 6.3.6
Jumlah Perusahaan Air Minum, Kapasitas Produksi dan Produksi Air Minum Menurut Sumber Air yang Digunakan di Jawa Barat
Number of Water Supply Enterprises, Production Capacity and Water Production by Water Resource Used in Jawa Barat
2008-2009
Uraian / Description Tahun ( Year )
2008*) 2009**)
[1] [2] [3]
Jumlah Perusahaan / Number of Water Supply Enterprices 22 22
Jumlah Kapasitas Produksi Potensial (liter/detik) Number of Potensial Production Capacity 16 390 17 562
Jumlah Kapasitas Produksi Efektif (liter/detik) Number of Potensial Effective Production Capacity
13 062 13 930
Produksi Air (m3) / Water Production 357 736 591 430 848 548
SUMBER AIR / WATER RESOURCE (M3)
1. Sungai / River 223 265 011 274 979 471
2. Danau / Lake 16 691 904 5 974 605
3. Mata Air / Springs 99 113 652 131 224 150
4. Air Tanah / Artesian 15 792 626 17 789 334
4. Lainnya/ Others 2 873 399 880 988
Jumlah / Total 357 736 591 430 848 548
Sumber : Badan Pusat Statistik Provinsi Jawa Barat Source : BPS – Statistics of Jawa Barat Catatan/Notes : *) Angka Perbaikan/Revised Figure **) Angka Sementara/Preliminary Figure

INDUSTRI, PENGGALIAN DAN ENERGY
360 Jawa Barat Dalam Angka/Jawa Barat in Figures 2010 !
Tabel Table 6.3.7
Jumlah Pekerja Teknis dan Administrasi Perusahaan Daerah Air Minum Menurut Pendidikan yang Ditamatkan di Jawa Barat
Number of Tehnical Workers and Administration Workers of Water Supply Enterprises by Educational Attainment in Jawa Barat
2008 - 2009
Uraian/Description 2008*) 2009**)
[1] [2] [3]
JumlahPekerjaTeknik/ Number of Technical Worker 2 181 2 450
SD/Primary School 285 309
SLTP/Junior High School
275 296
SLTA/Senior High School 1 357 1 487
Akademi/Bachelor Degree 68 112
Universitas /University Graduate 196 246
Jumlah Pekerja Administrasi Number of Administration Worker
3 214 3 408
SD/Primary School 174 223
SLTP/Junior High School 341 369
SLTA/Senior High School 1 926 2 009
Akademi/Bachelor Degree 132 140
Universitas /University Graduate 641 667
Sumber : Badan Pusat Statistik Provinsi Jawa Barat Source : BPS – Statistics of Jawa Barat Catatan/Notes : *) Angka Perbaikan/Revised Figure **) Angka Sementara/Preliminary Figure

MANUFACTURING, QUARRYING AND ENERGY
! Jawa Barat Dalam Angka/Jawa Barat in Figures 2010 361
Tabel Table 6.3.8
Jumlah Pelanggan Air Minum yang Didistribusikan PDAM Menurut Jenis Konsumen di Jawa Barat
Number of Water Supply Customers Distributed by PDAM by Type of Consumer Group in Jawa Barat
2008- 2009
Jenis Konsumen/ Type of Consumer Group 2008*) 2009**)
[1] [2] [3]
Rumah Tangga/ Household 842 276 864 971
Niaga /Perdagangan dan Industri /Trading and Industry 46 295 52 037
Badan Sosial / Social Institution 6 149 6 074
Umum/ Public 8 278 7 865
Instansi Pemerintah/ Government Institution 5 962 7 073
Lainnya /Others 836 396
Jumlah/Total 909 796 938 416
Sumber : Badan Pusat Statistik Provinsi Jawa Barat Source : BPS – Statistics of Jawa Barat Catatan/Notes : *) Angka Perbaikan/Revised Figure **) Angka Sementara/Preliminary Figure

INDUSTRI, PENGGALIAN DAN ENERGY
362 Jawa Barat Dalam Angka/Jawa Barat in Figures 2010 !
Tabel Table 6.3.9
Volume Air Minum yang Didistribusikan Menurut Jenis Konsumen di Jawa Barat (000 m3)
Volume of Distributed WaterSupply by Type of Consumer Group in Jawa Barat 2008 - 2009
Jenis Konsumen/ Type of Consumer Group 2008*) 2009**)
[1] [2] [3]
Rumah tanggga/Household 179 988 187 021
Niaga /Perdagangan dan Industri/ Trading and Industry 18 108 20 560
Badan Sosial/Social Institution 3 639 4 027
Umum/Public 5 166 4 519
Instansi Pemerintah/Government Institution 8 504 8 722
Lainnya /Others 7 685 12 606
Jumlah/Total 223 089 237 456
Sumber : Badan Pusat Statistik Provinsi Jawa Barat Source : BPS – Statistics of Jawa Barat Catatan/Notes : *) Angka Perbaikan/Revised Figure **) Angka Sementara/Preliminary Figure

MANUFACTURING, QUARRYING AND ENERGY
! Jawa Barat Dalam Angka/Jawa Barat in Figures 2010 363
Tabel Table 6.3.10
Nilai Air Minum yang Didistribusikan Menurut Jenis Konsumen di Jawa Barat
Value of Distributed Water Supply by Type of Consumer Group in Jawa Barat
(Juta /Million Rupiah) 2008-2009
Jenis Konsumen/ Type of Consumer Group 2008*) 2009**)
[1] [2] [3]
Rumah Tangga/Household 519 503 569 522
Niaga/Perdagangan dan Industri/Trading and Industry 104 710 110 388
Badan Sosial/Social Instution 5 463 6 929
Umum/Public 5 941 5 029
Instansi Pemerintah/Government Institution 5 941 35 581
Lainnya/Others 16 347 24 483
Jawa Barat 686 732 749 932
Sumber : Badan Pusat Statistik Provinsi Jawa Barat Source : BPS – Statistics of Jawa Barat Catatan/Notes : *) Angka Perbaikan/Revised Figure **) Angka Sementara/Preliminary Figure