lampiran - corememiliki goodwill dan tepat tanggal publikasi. lampiran 4 : daftar perhitungan...
TRANSCRIPT

88
LAMPIRAN

LAMPIRAN 1 :
DAFTAR PERUSAHAAN YANG
MELAPORKAN AMORTISASI
GOODWILL

LAMPIRAN 2 :
DAFTAR JENIS INDUSTRI DAN
TANGGAL PUBLIKASI PERUSAHAAN
YANG MEMILIKI GOODWILL

LAMPIRAN 3 :
DAFTAR PERUSAHAAN YANG
MEMILIKI GOODWILL DAN TEPAT
TANGGAL PUBLIKASI

LAMPIRAN 4 :
DAFTAR PERHITUNGAN
CUMULATIVE ABNORMAL RETURN
(CAR) – KELOMPOK DATA TEPAT
TANGGAL PUBLIKASI
2005-2009

LAMPIRAN 5 :
DAFTAR PERHITUNGAN GWA,
EPSAGW, EPSBGW – KELOMPOK
DATA TEPAT TANGGAL PUBLIKASI
2005-2009

LAMPIRAN 6 :
UJI ASUMSI KLASIK - PENGUJIAN
UTAMA (KELOMPOK DATA TEPAT
TANGGAL PUBLIKASI)
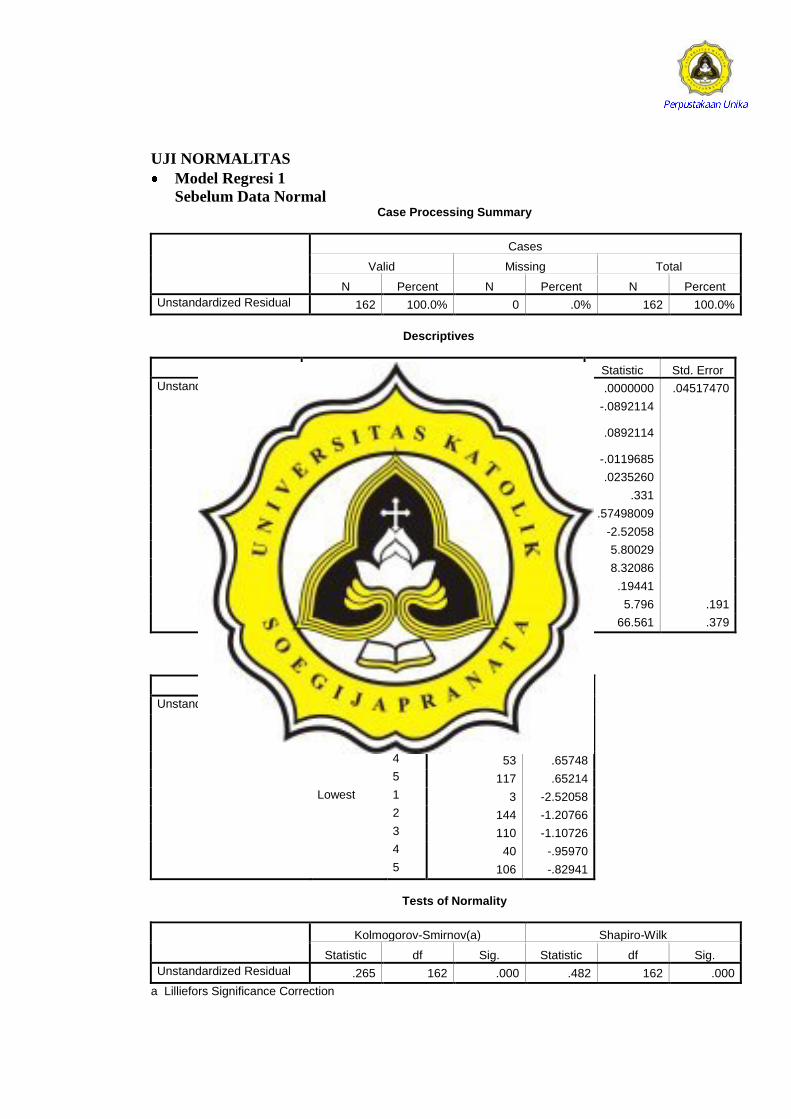
UJI NORMALITAS
Model Regresi 1
Sebelum Data Normal Case Processing Summary
Cases
Valid Missing Total
N Percent N Percent N Percent
Unstandardized Residual 162 100.0% 0 .0% 162 100.0%
Descriptives
Statistic Std. Error
Unstandardized Residual Mean .0000000 .04517470
95% Confidence Interval for Mean Lower Bound -.0892114
Upper Bound .0892114
5% Trimmed Mean -.0119685
Median .0235260
Variance .331
Std. Deviation .57498009
Minimum -2.52058
Maximum 5.80029
Range 8.32086
Interquartile Range .19441
Skewness 5.796 .191
Kurtosis 66.561 .379
Extreme Values
Case Number Value
Unstandardized Residual Highest 1 71 5.80029
2 91 .91794
3 148 .79569
4 53 .65748
5 117 .65214
Lowest 1 3 -2.52058
2 144 -1.20766
3 110 -1.10726
4 40 -.95970
5 106 -.82941
Tests of Normality
Kolmogorov-Smirnov(a) Shapiro-Wilk
Statistic df Sig. Statistic df Sig.
Unstandardized Residual .265 162 .000 .482 162 .000
a Lilliefors Significance Correction
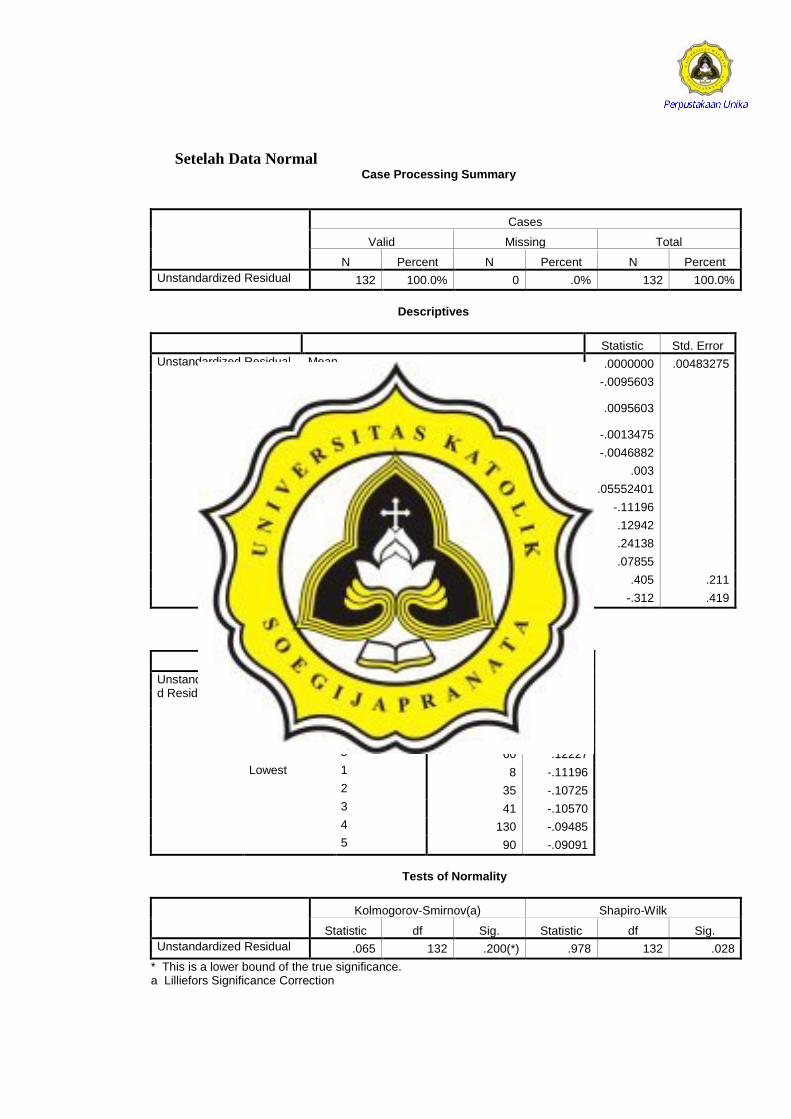
Setelah Data Normal
Case Processing Summary
Cases
Valid Missing Total
N Percent N Percent N Percent
Unstandardized Residual 132 100.0% 0 .0% 132 100.0%
Descriptives
Statistic Std. Error
Unstandardized Residual Mean .0000000 .00483275
95% Confidence Interval for Mean Lower Bound -.0095603
Upper Bound .0095603
5% Trimmed Mean -.0013475
Median -.0046882
Variance .003
Std. Deviation .05552401
Minimum -.11196
Maximum .12942
Range .24138
Interquartile Range .07855
Skewness .405 .211
Kurtosis -.312 .419
Extreme Values
Case Number Value
Unstandardized Residual
Highest 1 62 .12942
2 74 .12736
3 91 .12613
4 97 .12483
5 60 .12227
Lowest 1 8 -.11196
2 35 -.10725
3 41 -.10570
4 130 -.09485
5 90 -.09091
Tests of Normality
Kolmogorov-Smirnov(a) Shapiro-Wilk
Statistic df Sig. Statistic df Sig.
Unstandardized Residual .065 132 .200(*) .978 132 .028
* This is a lower bound of the true significance. a Lilliefors Significance Correction
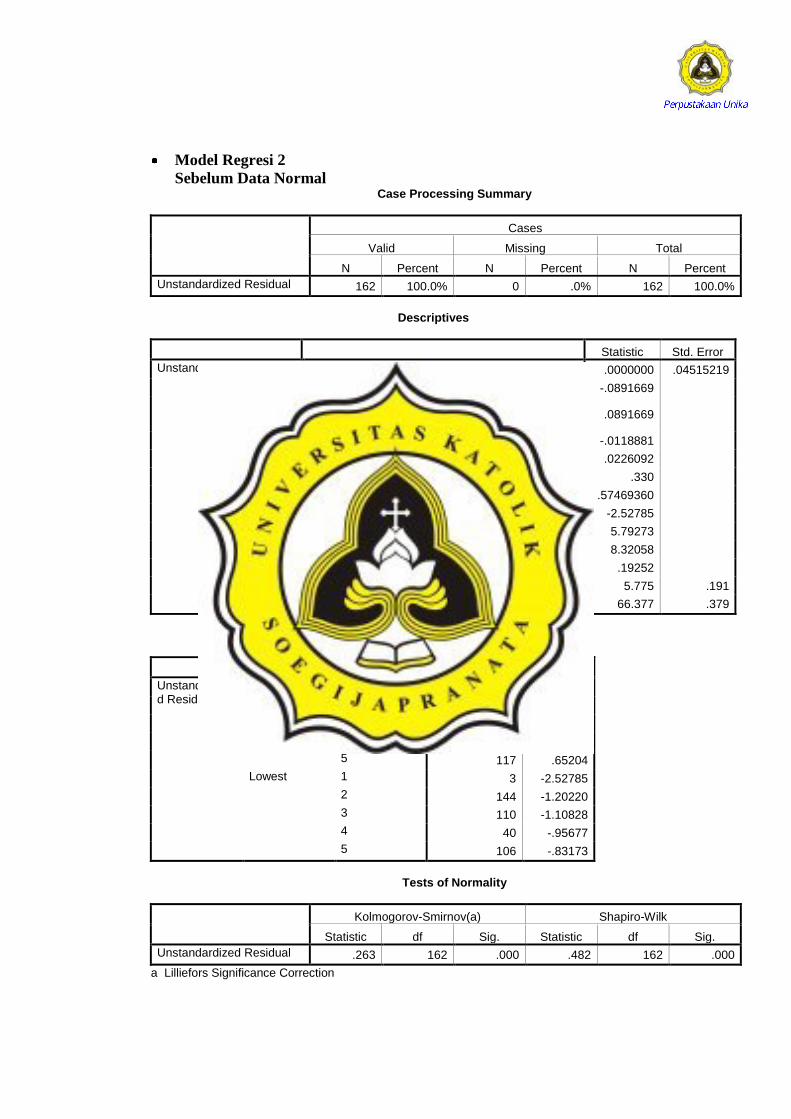
Model Regresi 2
Sebelum Data Normal Case Processing Summary
Cases
Valid Missing Total
N Percent N Percent N Percent
Unstandardized Residual 162 100.0% 0 .0% 162 100.0%
Descriptives
Statistic Std. Error
Unstandardized Residual Mean .0000000 .04515219
95% Confidence Interval for Mean Lower Bound -.0891669
Upper Bound .0891669
5% Trimmed Mean -.0118881
Median .0226092
Variance .330
Std. Deviation .57469360
Minimum -2.52785
Maximum 5.79273
Range 8.32058
Interquartile Range .19252
Skewness 5.775 .191
Kurtosis 66.377 .379
Extreme Values
Case Number Value
Unstandardized Residual
Highest 1 71 5.79273
2 91 .91674
3 148 .79594
4 53 .65624
5 117 .65204
Lowest 1 3 -2.52785
2 144 -1.20220
3 110 -1.10828
4 40 -.95677
5 106 -.83173
Tests of Normality
Kolmogorov-Smirnov(a) Shapiro-Wilk
Statistic df Sig. Statistic df Sig.
Unstandardized Residual .263 162 .000 .482 162 .000
a Lilliefors Significance Correction
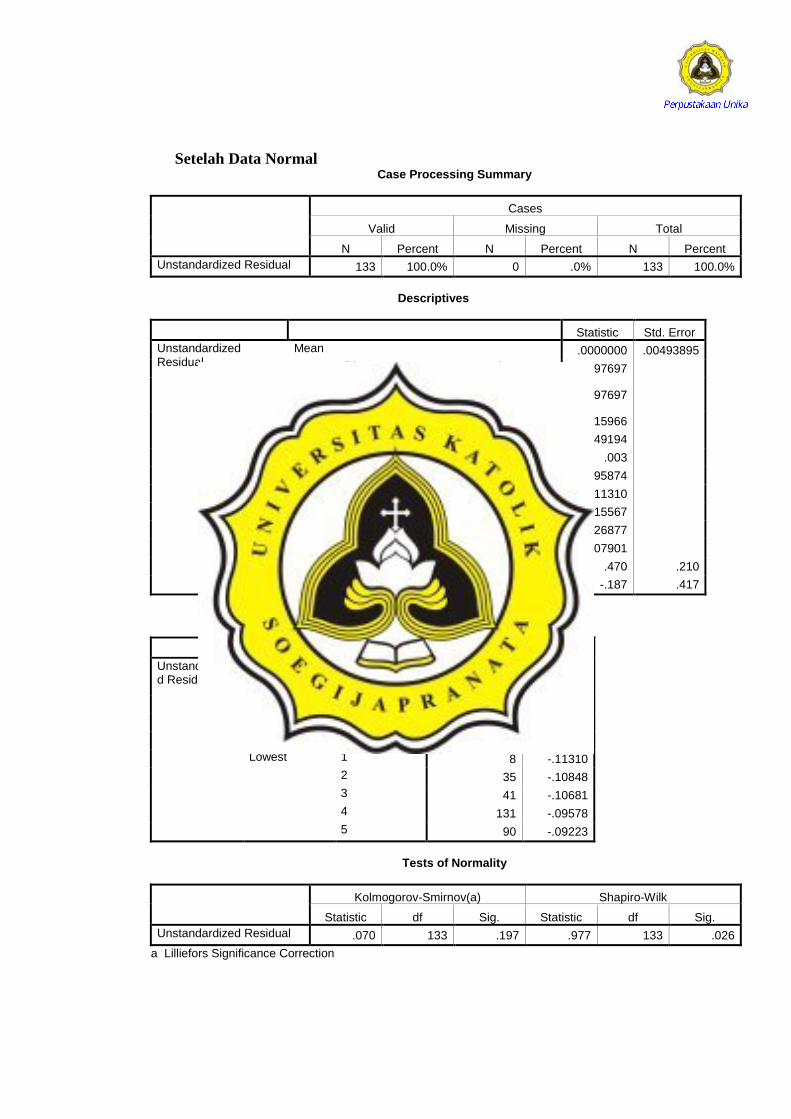
Setelah Data Normal Case Processing Summary
Cases
Valid Missing Total
N Percent N Percent N Percent
Unstandardized Residual 133 100.0% 0 .0% 133 100.0%
Descriptives
Statistic Std. Error
Unstandardized Residual
Mean .0000000 .00493895
95% Confidence Interval for Mean
Lower Bound -.0097697
Upper Bound .0097697
5% Trimmed Mean -.0015966
Median -.0049194
Variance .003
Std. Deviation .05695874
Minimum -.11310
Maximum .15567
Range .26877
Interquartile Range .07901
Skewness .470 .210
Kurtosis -.187 .417
Extreme Values
Case Number Value
Unstandardized Residual
Highest 1 125 .15567
2 62 .12818
3 74 .12612
4 91 .12508
5 97 .12358
Lowest 1 8 -.11310
2 35 -.10848
3 41 -.10681
4 131 -.09578
5 90 -.09223
Tests of Normality
Kolmogorov-Smirnov(a) Shapiro-Wilk
Statistic df Sig. Statistic df Sig.
Unstandardized Residual .070 133 .197 .977 133 .026
a Lilliefors Significance Correction
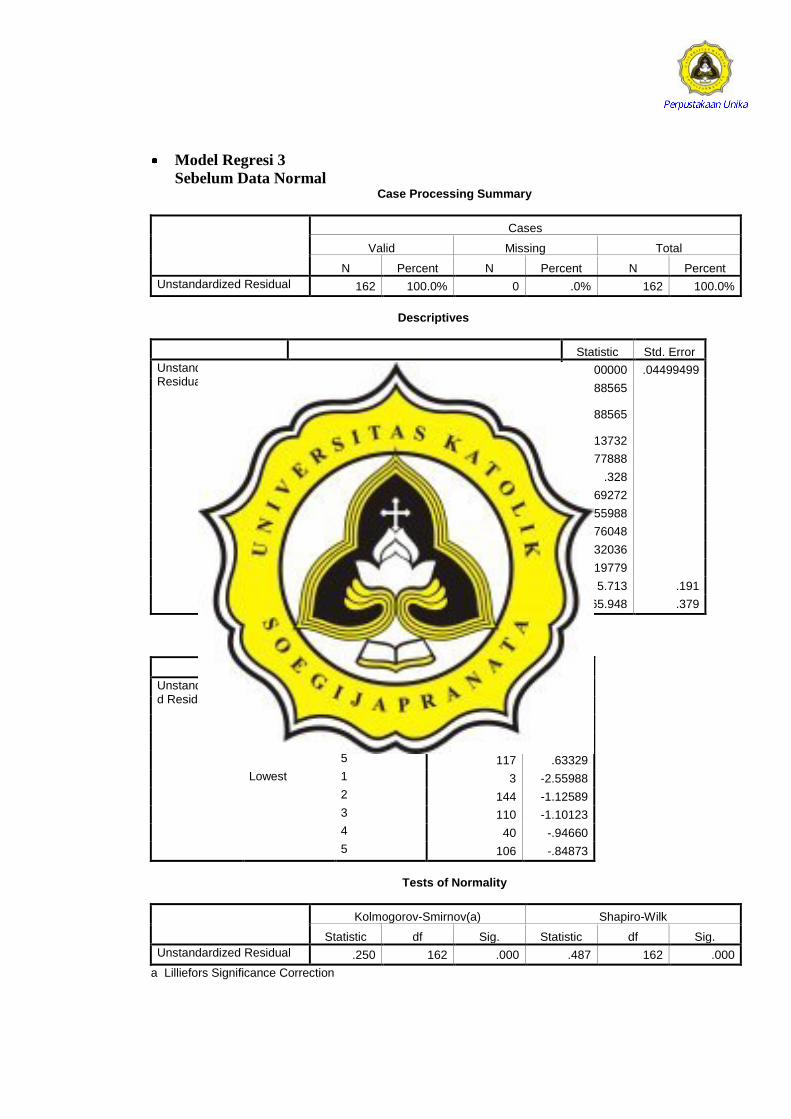
Model Regresi 3
Sebelum Data Normal Case Processing Summary
Cases
Valid Missing Total
N Percent N Percent N Percent
Unstandardized Residual 162 100.0% 0 .0% 162 100.0%
Descriptives
Statistic Std. Error
Unstandardized Residual
Mean .0000000 .04499499
95% Confidence Interval for Mean
Lower Bound -.0888565
Upper Bound .0888565
5% Trimmed Mean -.0113732
Median .0177888
Variance .328
Std. Deviation .57269272
Minimum -2.55988
Maximum 5.76048
Range 8.32036
Interquartile Range .19779
Skewness 5.713 .191
Kurtosis 65.948 .379
Extreme Values
Case Number Value
Unstandardized Residual
Highest 1 71 5.76048
2 91 .89965
3 148 .77794
4 53 .63888
5 117 .63329
Lowest 1 3 -2.55988
2 144 -1.12589
3 110 -1.10123
4 40 -.94660
5 106 -.84873
Tests of Normality
Kolmogorov-Smirnov(a) Shapiro-Wilk
Statistic df Sig. Statistic df Sig.
Unstandardized Residual .250 162 .000 .487 162 .000
a Lilliefors Significance Correction

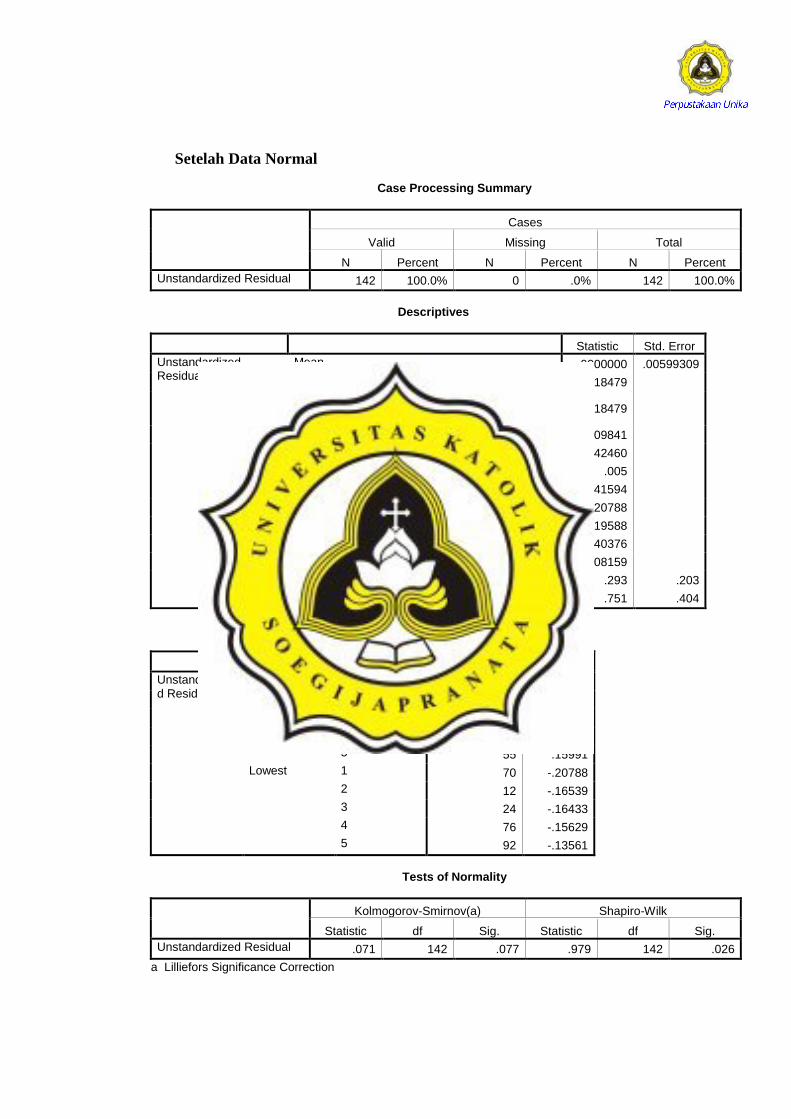
Setelah Data Normal Case Processing Summary
Cases
Valid Missing Total
N Percent N Percent N Percent
Unstandardized Residual 125 100.0% 0 .0% 125 100.0%
Descriptives
Statistic Std. Error
Unstandardized Residual
Mean .0000000 .00446626
95% Confidence Interval for Mean
Lower Bound -.0088400
Upper Bound .0088400
5% Trimmed Mean -.0015450
Median -.0049272
Variance .002
Std. Deviation .04993427
Minimum -.08993
Maximum .12344
Range .21337
Interquartile Range .07164
Skewness .468 .217
Kurtosis -.414 .430
Extreme Values
Case Number Value
Unstandardized Residual
Highest 1 91 .12344
2 57 .11993
3 105 .11199
4 35 .10913
5 73 .10118
Lowest 1 85 -.08993
2 86 -.08667
3 66 -.08633
4 103 -.08177
5 63 -.08142
Tests of Normality
Kolmogorov-Smirnov(a) Shapiro-Wilk
Statistic df Sig. Statistic df Sig.
Unstandardized Residual .078 125 .062 .972 125 .011
a Lilliefors Significance Correction

Model Regresi 4
Sebelum Data Normal Case Processing Summary
Cases
Valid Missing Total
N Percent N Percent N Percent
Unstandardized Residual 162 100.0% 0 .0% 162 100.0%
Descriptives
Statistic Std. Error
Unstandardized Residual
Mean .0000000 .04483949
95% Confidence Interval for Mean
Lower Bound -.0885494
Upper Bound .0885494
5% Trimmed Mean -.0139635
Median .0145710
Variance .326
Std. Deviation .57071351
Minimum -2.59270
Maximum 5.72756
Range 8.32027
Interquartile Range .21084
Skewness 5.673 .191
Kurtosis 65.485 .379
Extreme Values
Case Number Value
Unstandardized Residual
Highest 1 71 5.72756
2 91 .87181
3 148 .80525
4 129 .68822
5 53 .66614
Lowest 1 3 -2.59270
2 110 -1.07799
3 144 -.98262
4 40 -.95201
5 106 -.82923
Tests of Normality
Kolmogorov-Smirnov(a) Shapiro-Wilk
Statistic df Sig. Statistic df Sig.
Unstandardized Residual .252 162 .000 .491 162 .000
a Lilliefors Significance Correction
Setelah Data Normal Case Processing Summary
Cases
Valid Missing Total
N Percent N Percent N Percent
Unstandardized Residual 142 100.0% 0 .0% 142 100.0%
Descriptives
Statistic Std. Error
Unstandardized Residual
Mean .0000000 .00599309
95% Confidence Interval for Mean
Lower Bound -.0118479
Upper Bound .0118479
5% Trimmed Mean -.0009841
Median -.0042460
Variance .005
Std. Deviation .07141594
Minimum -.20788
Maximum .19588
Range .40376
Interquartile Range .08159
Skewness .293 .203
Kurtosis .751 .404
Extreme Values
Case Number Value
Unstandardized Residual
Highest 1 41 .19588
2 54 .18916
3 142 .18807
4 122 .16155
5 55 .15991
Lowest 1 70 -.20788
2 12 -.16539
3 24 -.16433
4 76 -.15629
5 92 -.13561
Tests of Normality
Kolmogorov-Smirnov(a) Shapiro-Wilk
Statistic df Sig. Statistic df Sig.
Unstandardized Residual .071 142 .077 .979 142 .026
a Lilliefors Significance Correction
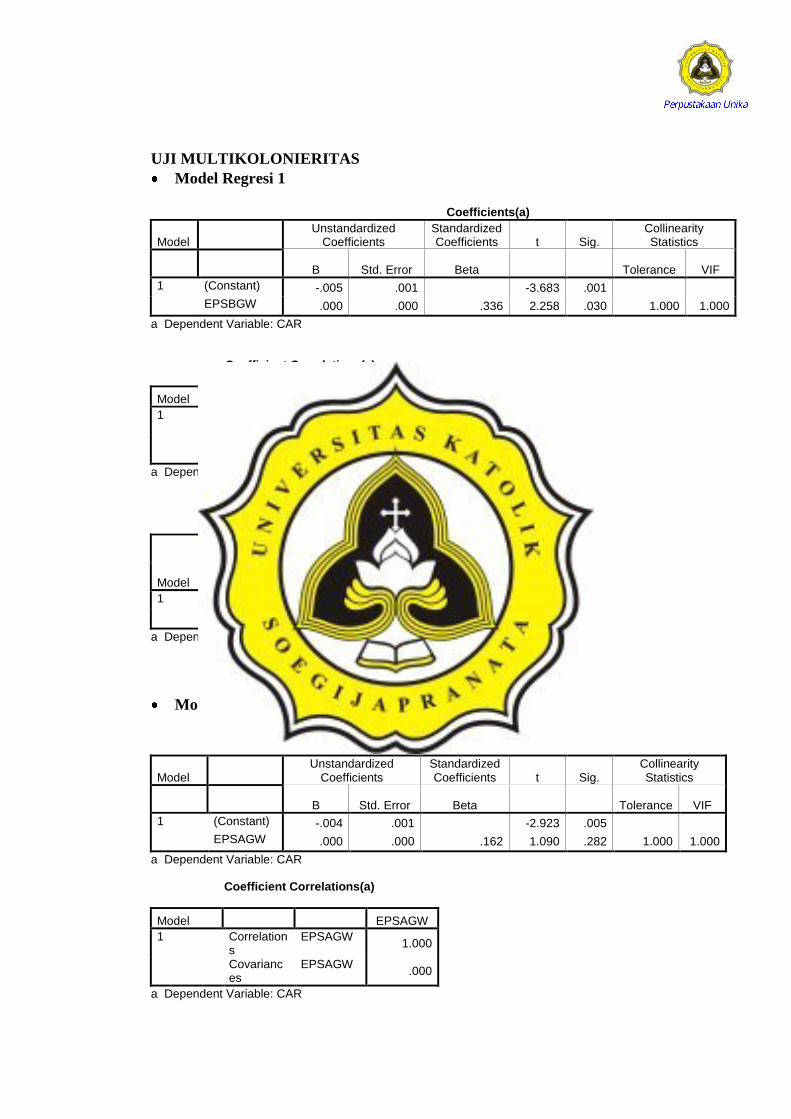
UJI MULTIKOLONIERITAS
Model Regresi 1 Coefficients(a)
Model Unstandardized
Coefficients Standardized Coefficients t Sig. Collinearity Statistics
B Std. Error Beta Tolerance VIF
1 (Constant) -.001 .005 -.178 .859
EPSBGW .000 .000 .092 1.048 .296 1.000 1.000
a Dependent Variable: CAR Coefficient Correlations(a)
Model EPSBGW
1 Correlations
EPSBGW 1.000
Covariances
EPSBGW .000
a Dependent Variable: CAR Collinearity Diagnostics(a)
Model Dimension Eigenvalue
Condition Index
Variance Proportions
(Constant) EPSBGW
1 1 1.412 1.000 .29 .29
2 .588 1.550 .71 .71
a Dependent Variable: CAR
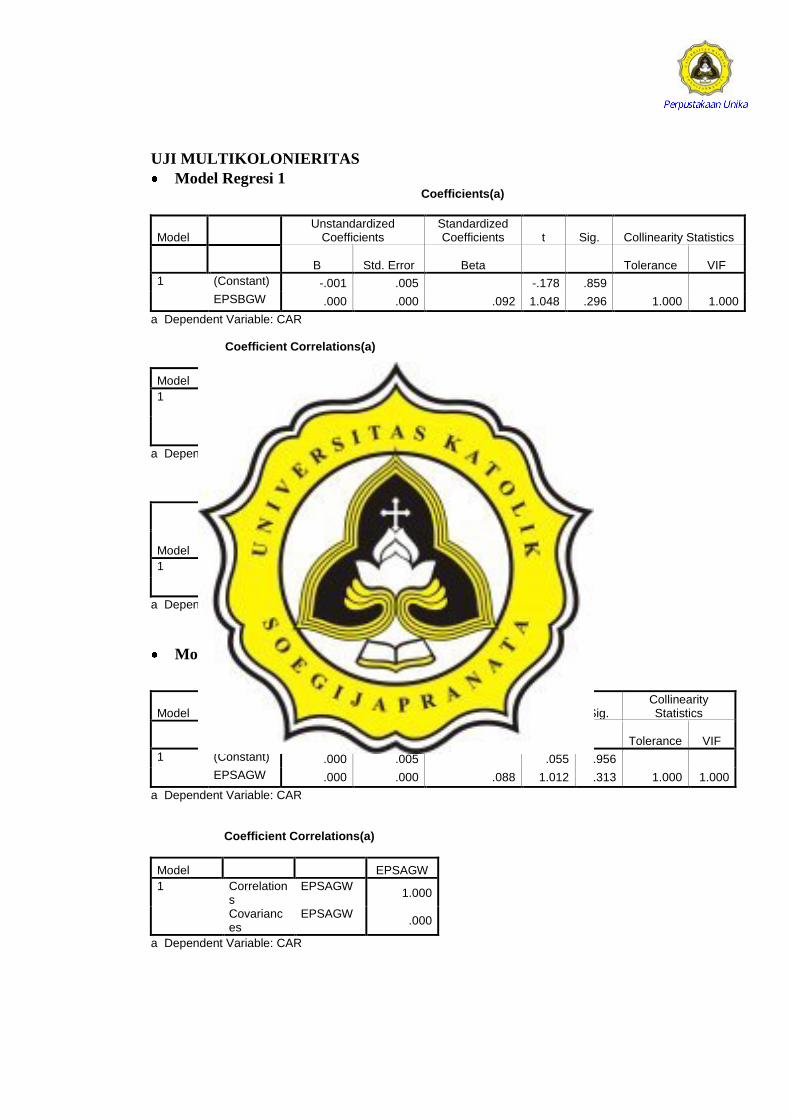
Model Regresi 2 Coefficients(a)
Model Unstandardized
Coefficients Standardized Coefficients t Sig.
Collinearity Statistics
B Std. Error Beta Tolerance VIF
1 (Constant) .000 .005 .055 .956
EPSAGW .000 .000 .088 1.012 .313 1.000 1.000
a Dependent Variable: CAR Coefficient Correlations(a)
Model EPSAGW
1 Correlations
EPSAGW 1.000
Covariances
EPSAGW .000
a Dependent Variable: CAR
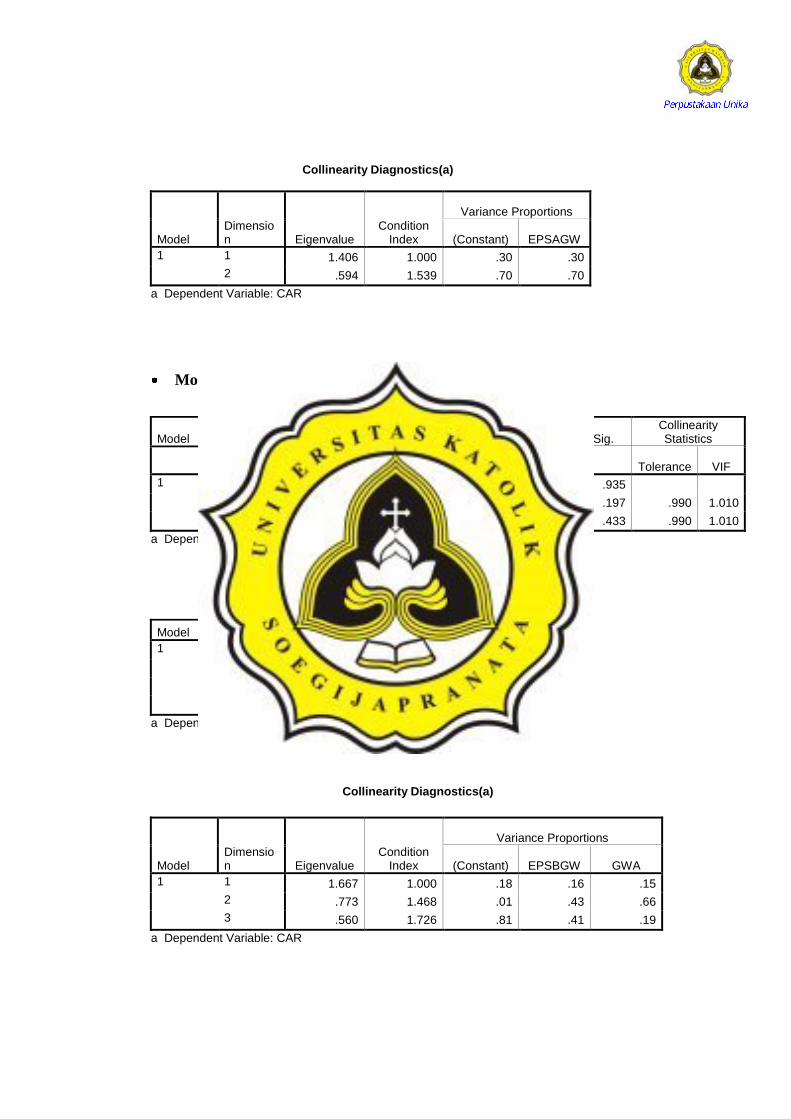
Collinearity Diagnostics(a)
Model Dimension Eigenvalue
Condition Index
Variance Proportions
(Constant) EPSAGW
1 1 1.406 1.000 .30 .30
2 .594 1.539 .70 .70
a Dependent Variable: CAR
Model Regresi 3 Coefficients(a)
Model Unstandardized
Coefficients Standardized Coefficients t Sig.
Collinearity Statistics
B Std. Error Beta Tolerance VIF
1 (Constant) .000 .005 .081 .935
EPSBGW .000 .000 .117 1.298 .197 .990 1.010
GWA .000 .000 -.071 -.787 .433 .990 1.010
a Dependent Variable: CAR
Coefficient Correlations(a)
Model GWA EPSBGW
1 Correlations
GWA 1.000 -.099
EPSBGW -.099 1.000
Covariances
GWA .000 .000
EPSBGW .000 .000
a Dependent Variable: CAR
Collinearity Diagnostics(a)
Model Dimension Eigenvalue
Condition Index
Variance Proportions
(Constant) EPSBGW GWA
1 1 1.667 1.000 .18 .16 .15
2 .773 1.468 .01 .43 .66
3 .560 1.726 .81 .41 .19
a Dependent Variable: CAR
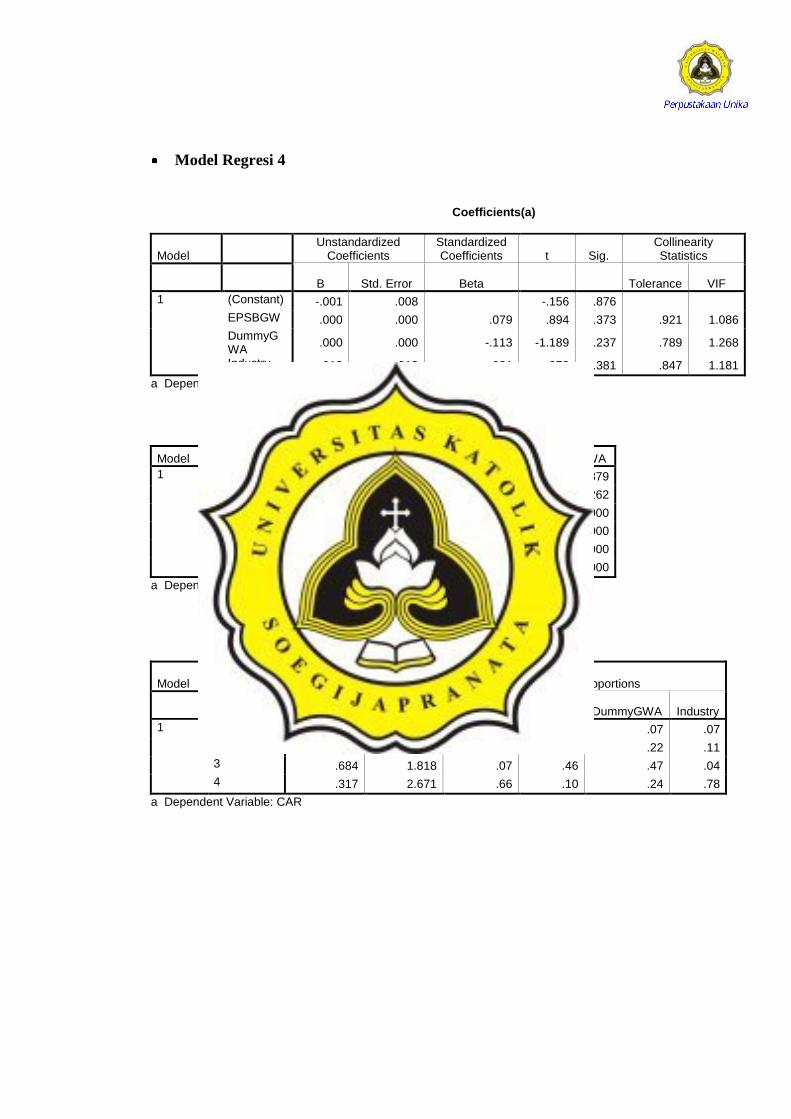
Model Regresi 4
Coefficients(a)
Model Unstandardized
Coefficients Standardized Coefficients t Sig.
Collinearity Statistics
B Std. Error Beta Tolerance VIF
1 (Constant) -.001 .008 -.156 .876
EPSBGW .000 .000 .079 .894 .373 .921 1.086
DummyGWA
.000 .000 -.113 -1.189 .237 .789 1.268
Industry .012 .013 .081 .878 .381 .847 1.181
a Dependent Variable: CAR Coefficient Correlations(a)
Model Industry EPSBGW DummyGWA
1 Correlations Industry 1.000 .005 -.379
EPSBGW .005 1.000 -.262
DummyGWA -.379 -.262 1.000
Covariances Industry .000 .000 .000
EPSBGW .000 .000 .000
DummyGWA .000 .000 .000
a Dependent Variable: CAR Collinearity Diagnostics(a)
Model Dimension Eigenvalue Condition
Index Variance Proportions
(Constant) EPSBGW DummyGWA Industry
1 1 2.260 1.000 .07 .07 .07 .07
2 .739 1.748 .20 .37 .22 .11
3 .684 1.818 .07 .46 .47 .04
4 .317 2.671 .66 .10 .24 .78
a Dependent Variable: CAR

UJI HETEROKEDASTISITAS
Model Regresi 1 Variables Entered/Removed(b)
Model Variables Entered
Variables Removed Method
1 EPSBGW(a) . Enter
a All requested variables entered. b Dependent Variable: AbsRes Model Summary
Model R R Square Adjusted R Square Std. Error of the Estimate
1 .095(a) .009 .001 .03243
a Predictors: (Constant), EPSBGW ANOVA(b)
Model Sum of Squares df Mean Square F Sig.
1 Regression .001 1 .001 1.177 .280(a)
Residual .137 130 .001
Total .138 131
a Predictors: (Constant), EPSBGW b Dependent Variable: AbsRes Coefficients(a)
Model Unstandardized
Coefficients Standardized Coefficients t Sig.
B Std. Error Beta
1 (Constant) .046 .003 14.933 .000
EPSBGW .000 .000 -.095 -1.085 .280
a Dependent Variable: AbsRes
Model Regresi 2
Variables Entered/Removed(b)
Model Variables Entered
Variables Removed Method
1 EPSAGW(a) . Enter
a All requested variables entered. b Dependent Variable: AbsRes Model Summary
Model R R Square Adjusted R Square Std. Error of the Estimate
1 .093(a) .009 .001 .03359
a Predictors: (Constant), EPSAGW
ANOVA(b)
Model Sum of
Squares df Mean Square F Sig.
1 Regression .001 1 .001 1.151 .285(a)
Residual .148 131 .001
Total .149 132
a Predictors: (Constant), EPSAGW b Dependent Variable: AbsRes Coefficients(a)
Model Unstandardized
Coefficients Standardized Coefficients t Sig.
B Std. Error Beta
1 (Constant) .047 .003 14.808 .000
EPSAGW .000 .000 -.093 -1.073 .285
a Dependent Variable: AbsRes
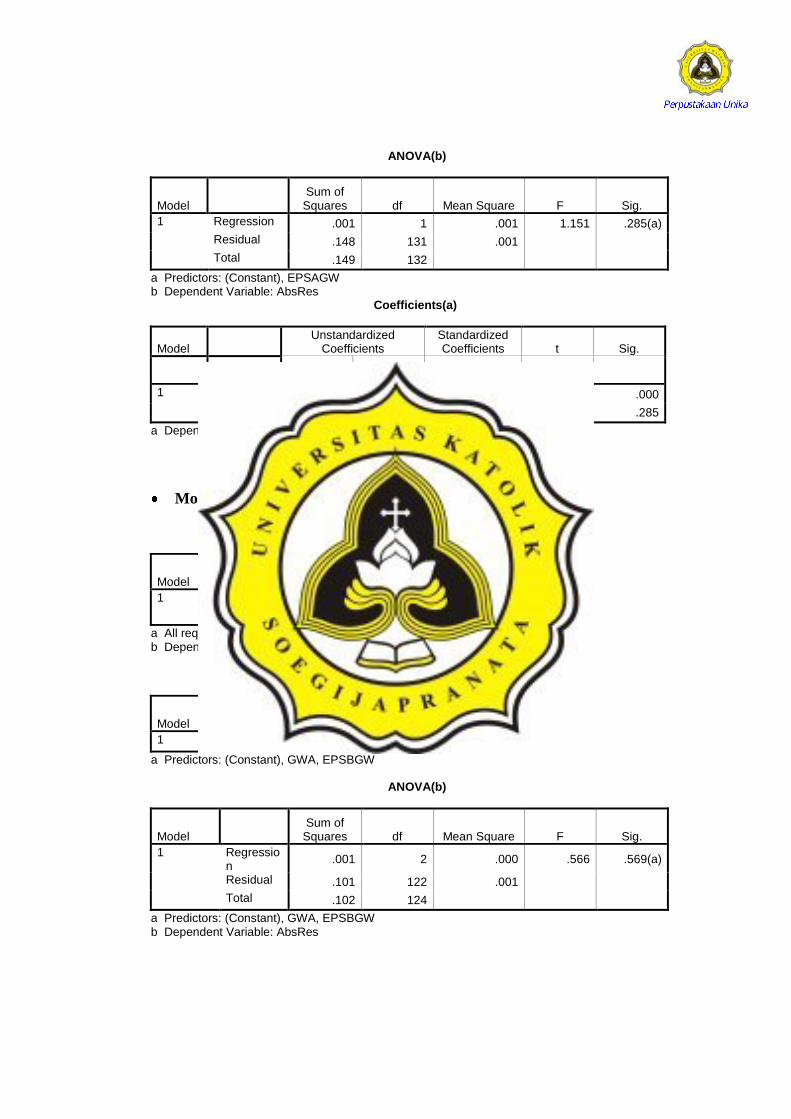
Model Regresi 3
Variables Entered/Removed(b)
Model Variables Entered Variables Removed Method
1 GWA, EPSBGW(a) . Enter
a All requested variables entered. b Dependent Variable: AbsRes Model Summary
Model R R Square Adjusted R
Square Std. Error of the Estimate
1 .096(a) .009 -.007 .02872
a Predictors: (Constant), GWA, EPSBGW ANOVA(b)
Model Sum of
Squares df Mean Square F Sig.
1 Regression
.001 2 .000 .566 .569(a)
Residual .101 122 .001
Total .102 124
a Predictors: (Constant), GWA, EPSBGW b Dependent Variable: AbsRes
Coefficients(a)
Model
Unstandardized Coefficients
Standardized Coefficients
t Sig. B Std. Error Beta
1 (Constant)
.042 .003 14.214 .000
EPSBGW .000 .000 -.096 -1.064 .290
GWA .000 .000 .012 .132 .895
a Dependent Variable: AbsRes
Model Regresi 4
Variables Entered/Removed(b)
Model Variables Entered Variables Removed Method
1 Industry, EPSBGW, DummyGWA(a) . Enter
a All requested variables entered. b Dependent Variable: AbsRes Model Summary
Model R R Square Adjusted R
Square Std. Error of the Estimate
1 .201(a) .040 .019 .04639697
a Predictors: (Constant), Industry, EPSBGW, DummyGWA ANOVA(b)
Model Sum of
Squares df Mean Square F Sig.
1 Regression
.012 3 .004 1.934 .127(a)
Residual .297 138 .002
Total .310 141
a Predictors: (Constant), Industry, EPSBGW, DummyGWA b Dependent Variable: AbsRes Coefficients(a)
Model
Unstandardized Coefficients
Standardized Coefficients
t Sig. B Std. Error Beta
1 (Constant) .060 .005 11.542 .000
EPSBGW .000 .000 -.142 -1.633 .105
DummyGWA
.000 .000 -.072 -.765 .446
Industry -.006 .009 -.063 -.691 .491
a Dependent Variable: AbsRes
UJI AUTOKORELASI
Model Regresi 1 Model Summary(b)
Model R R Square Adjusted R
Square Std. Error of the Estimate Durbin-Watson
1 .092(a) .008 .001 .0557372 2.110
a Predictors: (Constant), EPSBGW b Dependent Variable: CAR
Model Regresi 2 Model Summary(b)
Model R R Square Adjusted R
Square Std. Error of the Estimate Durbin-Watson
1 .088(a) .008 .000 .0571757 2.079
a Predictors: (Constant), EPSAGW b Dependent Variable: CAR
Model Regresi 3 Model Summary(b)
Model R R Square Adjusted R
Square Std. Error of the Estimate Durbin-Watson
1 .131(a) .017 .001 .0503419 2.015
a Predictors: (Constant), GWA, EPSBGW b Dependent Variable: CAR
Model Regresi 4 Model Summary(b)
Model R R Square Adjusted R
Square Std. Error of the Estimate Durbin-Watson
1 .121(a) .015 -.007 .0721880 1.929
a Predictors: (Constant), Industry, EPSBGW, DummyGWA b Dependent Variable: CAR

LAMPIRAN 7 :
STATISTIK DESKRIPTIF -
PENGUJIAN UTAMA (KELOMPOK
DATA TEPAT TANGGAL PUBLIKASI)
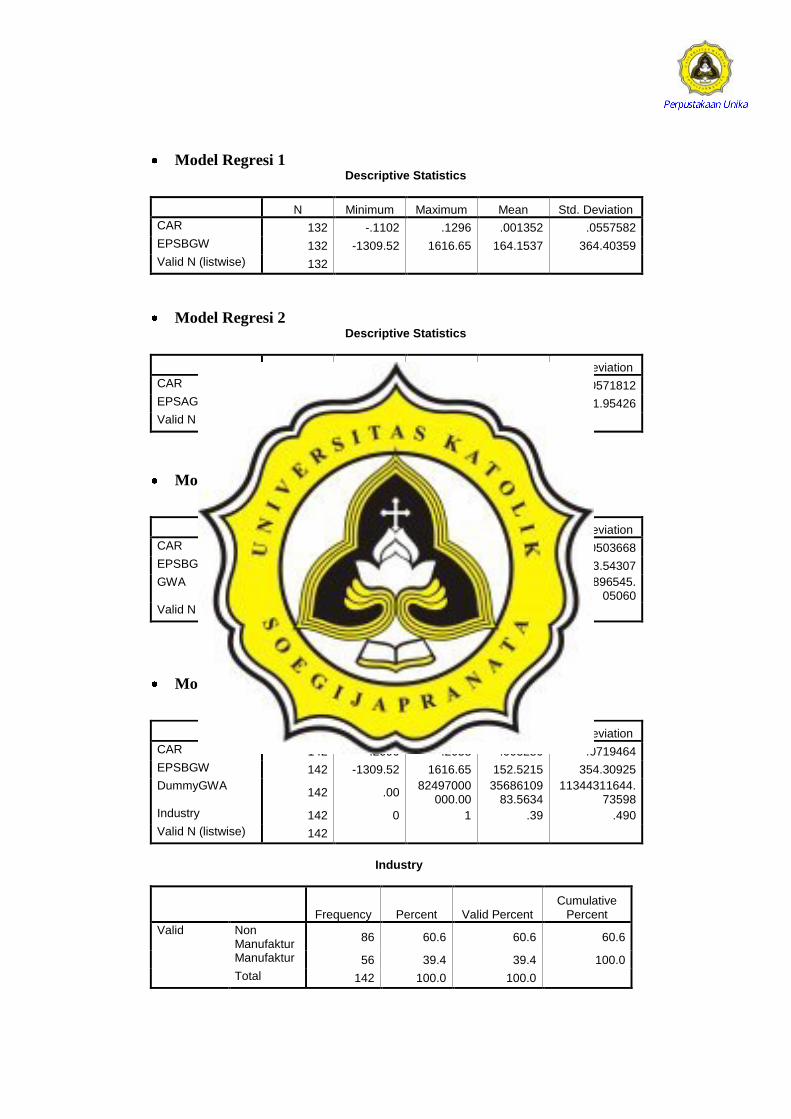
Model Regresi 1 Descriptive Statistics
N Minimum Maximum Mean Std. Deviation
CAR 132 -.1102 .1296 .001352 .0557582
EPSBGW 132 -1309.52 1616.65 164.1537 364.40359
Valid N (listwise) 132
Model Regresi 2 Descriptive Statistics
N Minimum Maximum Mean Std. Deviation
CAR 133 -.1102 .1579 .002529 .0571812
EPSAGW 133 -1312.00 1610.00 160.3347 361.95426
Valid N (listwise) 133
Model Regresi 3 Descriptive Statistics
N Minimum Maximum Mean Std. Deviation
CAR 125 -.1102 .1296 .001658 .0503668
EPSBGW 125 -1309.52 1616.65 164.9626 373.54307
GWA 125 774715.00
360233000000.00
21272301166.2080
55682896545.05060
Valid N (listwise) 125
Model Regresi 4 Descriptive Statistics
N Minimum Maximum Mean Std. Deviation
CAR 142 -.2090 .2058 .003280 .0719464
EPSBGW 142 -1309.52 1616.65 152.5215 354.30925
DummyGWA 142 .00
82497000000.00
3568610983.5634
11344311644.73598
Industry 142 0 1 .39 .490
Valid N (listwise) 142
Industry
Frequency Percent Valid Percent Cumulative
Percent
Valid Non Manufaktur
86 60.6 60.6 60.6
Manufaktur 56 39.4 39.4 100.0
Total 142 100.0 100.0

LAMPIRAN 8 :
MODEL REGRESI 1 - PENGUJIAN
UTAMA (KELOMPOK DATA TEPAT
TANGGAL PUBLIKASI)
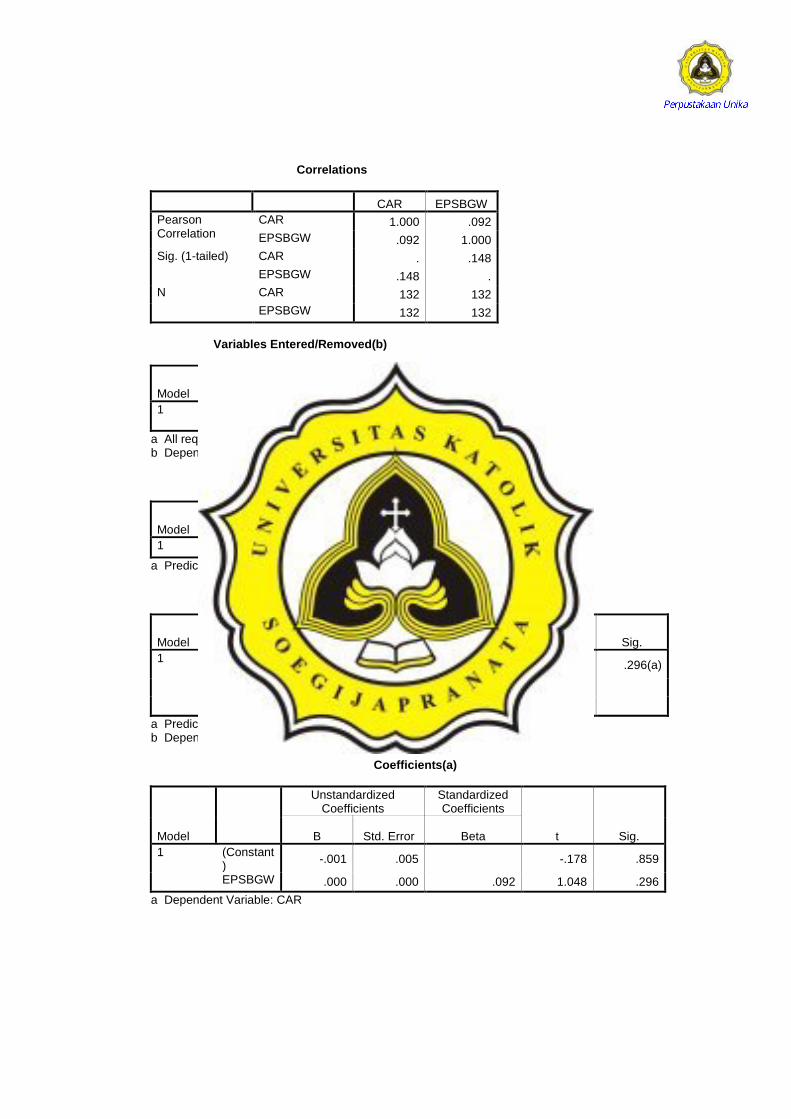
Correlations
CAR EPSBGW
Pearson Correlation
CAR 1.000 .092
EPSBGW .092 1.000
Sig. (1-tailed) CAR . .148
EPSBGW .148 .
N CAR 132 132
EPSBGW 132 132
Variables Entered/Removed(b)
Model Variables Entered
Variables Removed Method
1 EPSBGW(a)
. Enter
a All requested variables entered. b Dependent Variable: CAR Model Summary
Model R R Square Adjusted R
Square Std. Error of the Estimate
1 .092(a) .008 .001 .0557372
a Predictors: (Constant), EPSBGW ANOVA(b)
Model Sum of
Squares df Mean Square F Sig.
1 Regression
.003 1 .003 1.099 .296(a)
Residual .404 130 .003
Total .407 131
a Predictors: (Constant), EPSBGW b Dependent Variable: CAR Coefficients(a)
Model
Unstandardized Coefficients
Standardized Coefficients
t Sig. B Std. Error Beta
1 (Constant)
-.001 .005 -.178 .859
EPSBGW .000 .000 .092 1.048 .296
a Dependent Variable: CAR

LAMPIRAN 9 :
MODEL REGRESI 2 - PENGUJIAN
UTAMA (KELOMPOK DATA TEPAT
TANGGAL PUBLIKASI)
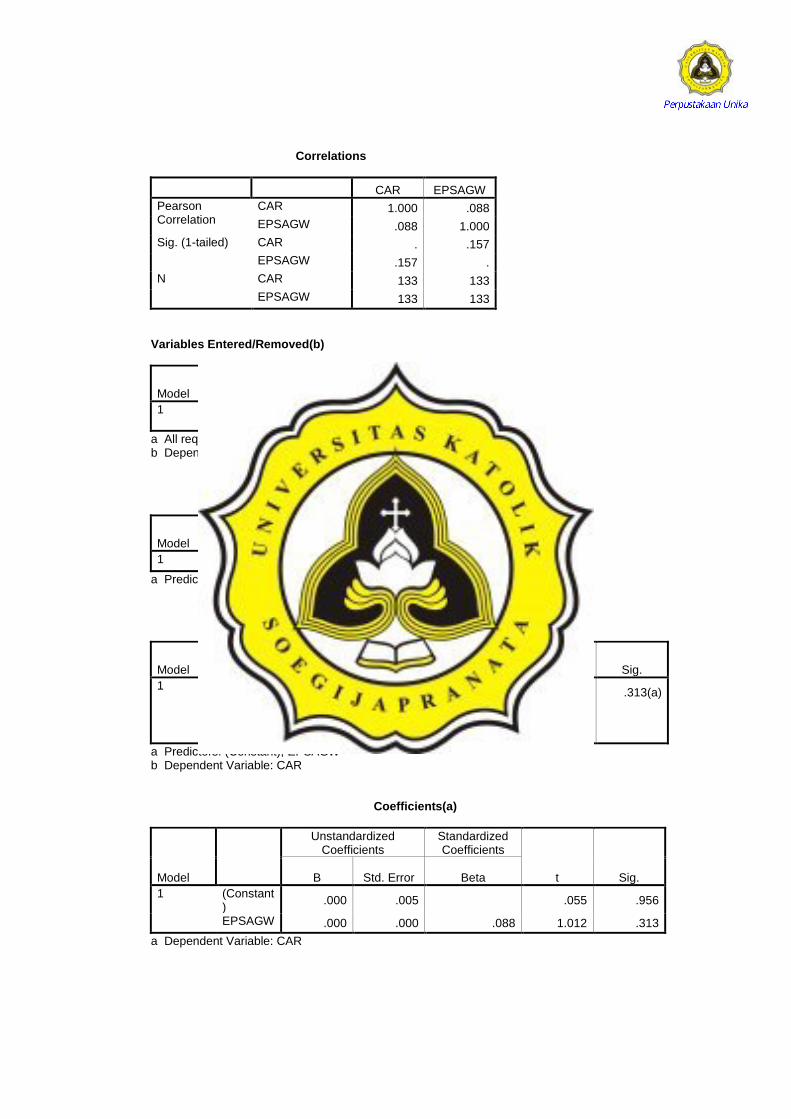
Correlations
CAR EPSAGW
Pearson Correlation
CAR 1.000 .088
EPSAGW .088 1.000
Sig. (1-tailed) CAR . .157
EPSAGW .157 .
N CAR 133 133
EPSAGW 133 133
Variables Entered/Removed(b)
Model Variables Entered
Variables Removed Method
1 EPSAGW(a)
. Enter
a All requested variables entered. b Dependent Variable: CAR Model Summary
Model R R Square Adjusted R
Square Std. Error of the Estimate
1 .088(a) .008 .000 .0571757
a Predictors: (Constant), EPSAGW ANOVA(b)
Model Sum of
Squares df Mean Square F Sig.
1 Regression
.003 1 .003 1.025 .313(a)
Residual .428 131 .003
Total .432 132
a Predictors: (Constant), EPSAGW b Dependent Variable: CAR Coefficients(a)
Model
Unstandardized Coefficients
Standardized Coefficients
t Sig. B Std. Error Beta
1 (Constant)
.000 .005 .055 .956
EPSAGW .000 .000 .088 1.012 .313
a Dependent Variable: CAR

LAMPIRAN 10 :
MODEL REGRESI 3 - PENGUJIAN
UTAMA (KELOMPOK DATA TEPAT
TANGGAL PUBLIKASI)
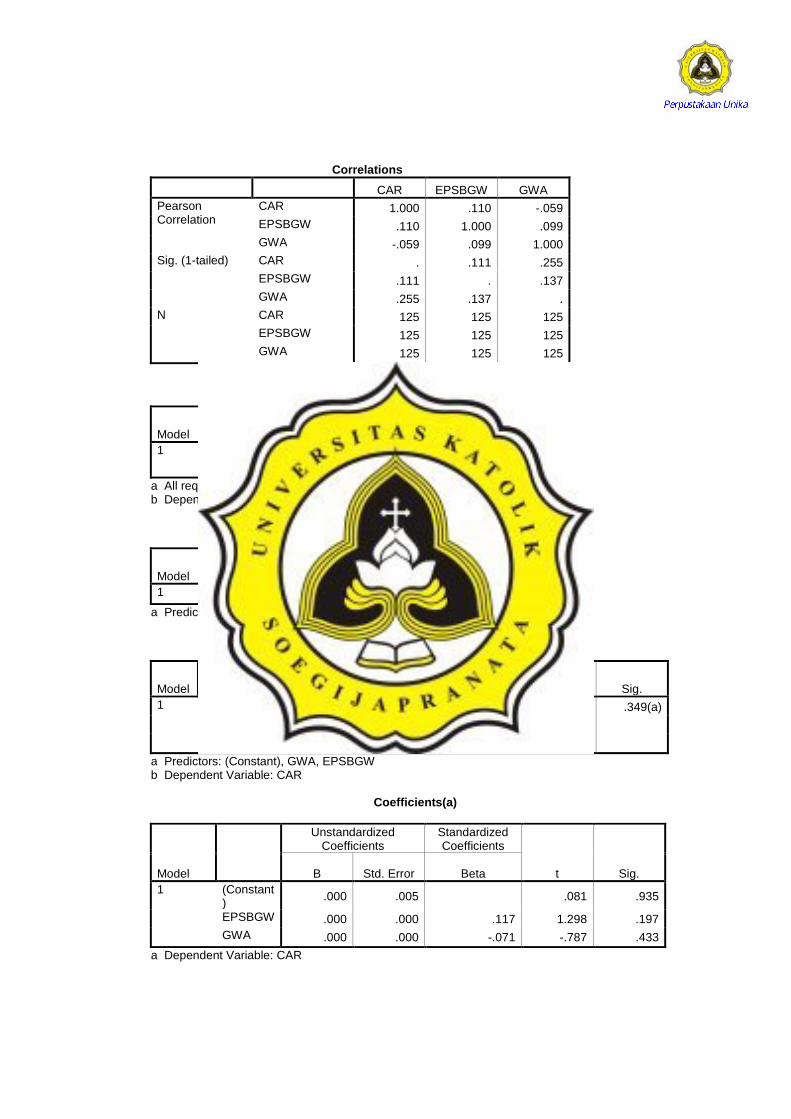
Correlations
CAR EPSBGW GWA
Pearson Correlation
CAR 1.000 .110 -.059
EPSBGW .110 1.000 .099
GWA -.059 .099 1.000
Sig. (1-tailed) CAR . .111 .255
EPSBGW .111 . .137
GWA .255 .137 .
N CAR 125 125 125
EPSBGW 125 125 125
GWA 125 125 125
Variables Entered/Removed(b)
Model Variables Entered Variables Removed Method
1 GWA, EPSBGW(a) . Enter
a All requested variables entered. b Dependent Variable: CAR Model Summary
Model R R Square Adjusted R
Square Std. Error of the Estimate
1 .131(a) .017 .001 .0503419
a Predictors: (Constant), GWA, EPSBGW ANOVA(b)
Model Sum of
Squares df Mean Square F Sig.
1 Regression .005 2 .003 1.061 .349(a)
Residual .309 122 .003
Total .315 124
a Predictors: (Constant), GWA, EPSBGW b Dependent Variable: CAR Coefficients(a)
Model
Unstandardized Coefficients
Standardized Coefficients
t Sig. B Std. Error Beta
1 (Constant)
.000 .005 .081 .935
EPSBGW .000 .000 .117 1.298 .197
GWA .000 .000 -.071 -.787 .433
a Dependent Variable: CAR

LAMPIRAN 11 :
MODEL REGRESI 4 - PENGUJIAN
UTAMA (KELOMPOK DATA TEPAT
TANGGAL PUBLIKASI)
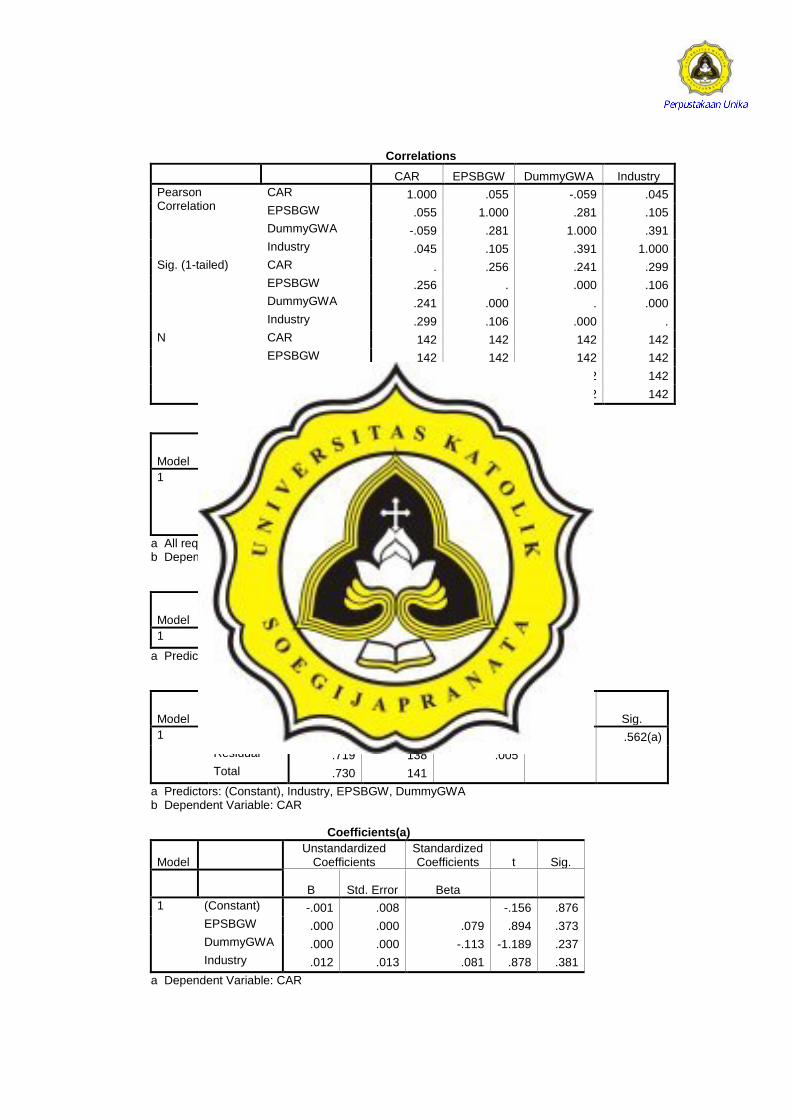
Correlations
CAR EPSBGW DummyGWA Industry
Pearson Correlation
CAR 1.000 .055 -.059 .045
EPSBGW .055 1.000 .281 .105
DummyGWA -.059 .281 1.000 .391
Industry .045 .105 .391 1.000
Sig. (1-tailed) CAR . .256 .241 .299
EPSBGW .256 . .000 .106
DummyGWA .241 .000 . .000
Industry .299 .106 .000 .
N CAR 142 142 142 142
EPSBGW 142 142 142 142
DummyGWA 142 142 142 142
Industry 142 142 142 142
Variables Entered/Removed(b)
Model Variables Entered
Variables Removed Method
1 Industry, EPSBGW,
DummyGWA(a)
. Enter
a All requested variables entered. b Dependent Variable: CAR Model Summary
Model R R Square Adjusted R
Square Std. Error of the Estimate
1 .121(a) .015 -.007 .0721880
a Predictors: (Constant), Industry, EPSBGW, DummyGWA ANOVA(b)
Model Sum of
Squares df Mean Square F Sig.
1 Regression .011 3 .004 .686 .562(a)
Residual .719 138 .005
Total .730 141
a Predictors: (Constant), Industry, EPSBGW, DummyGWA b Dependent Variable: CAR Coefficients(a)
Model Unstandardized
Coefficients Standardized Coefficients t Sig.
B Std. Error Beta
1 (Constant) -.001 .008 -.156 .876
EPSBGW .000 .000 .079 .894 .373
DummyGWA .000 .000 -.113 -1.189 .237
Industry .012 .013 .081 .878 .381
a Dependent Variable: CAR

LAMPIRAN 12 :
DAFTAR PERHITUNGAN
CUMULATIVE ABNORMAL RETURN
(CAR) – KELOMPOK DATA
GABUNGAN
2005-2009

LAMPIRAN 13 :
DAFTAR PERHITUNGAN GWA,
EPSAGW, EPSBGW – KELOMPOK
DATA GABUNGAN
2005-2009

LAMPIRAN 14 :
UJI ASUMSI KLASIK - PENGUJIAN
TAMBAHAN (KELOMPOK DATA
GABUNGAN)

UJI NORMALITAS
Model Regresi 1
Sebelum Data Normal Case Processing Summary
Cases
Valid Missing Total
N Percent N Percent N Percent
Unstandardized Residual 332 100.0% 0 .0% 332 100.0%
Descriptives
Statistic Std. Error
Unstandardized Residual
Mean .0000000 .02686733
95% Confidence Interval for Mean
Lower Bound -.0528523
Upper Bound .0528523
5% Trimmed Mean -.0266184
Median -.0345442
Variance .240
Std. Deviation .48954607
Minimum -1.50847
Maximum 7.34666
Range 8.85513
Interquartile Range .13673
Skewness 10.757 .134
Kurtosis 157.496 .267
Extreme Values
Case Number Value
Unstandardized Residual
Highest 1 116 7.34666
2 258 2.89531
3 325 1.07052
4 147 .84741
5 277 .65551
Lowest 1 257 -1.50847
2 180 -1.28607
3 4 -1.01271
4 67 -.97925
5 60 -.80213
Tests of Normality
Kolmogorov-Smirnov(a) Shapiro-Wilk
Statistic df Sig. Statistic df Sig.
Unstandardized Residual .278 332 .000 .339 332 .000
a Lilliefors Significance Correction

Setelah Data Normal
Case Processing Summary
Cases
Valid Missing Total
N Percent N Percent N Percent
Unstandardized Residual 42 100.0% 0 .0% 42 100.0%
Descriptives
Statistic Std. Error
Unstandardized Residual
Mean .0000000 .00108056
95% Confidence Interval for Mean
Lower Bound -.0021822
Upper Bound .0021822
5% Trimmed Mean .0000161
Median .0009539
Variance .000
Std. Deviation .00700285
Minimum -.01070
Maximum .01042
Range .02112
Interquartile Range .01299
Skewness -.166 .365
Kurtosis -1.308 .717
Extreme Values
Case Number Value
Unstandardized Residual
Highest 1 8 .01042
2 10 .01017
3 41 .01002
4 3 .00976
5 12 .00942
Lowest 1 37 -.01070
2 24 -.01047
3 17 -.01037
4 29 -.01036
5 28 -.01023
Tests of Normality
Kolmogorov-Smirnov(a) Shapiro-Wilk
Statistic df Sig. Statistic df Sig.
Unstandardized Residual .124 42 .105 .923 42 .008
a Lilliefors Significance Correction

Model Regresi 2
Sebelum Data Normal Case Processing Summary
Cases
Valid Missing Total
N Percent N Percent N Percent
Unstandardized Residual 332 100.0% 0 .0% 332 100.0%
Descriptives
Statistic Std. Error
Unstandardized Residual
Mean .0000000 .02684243
95% Confidence Interval for Mean
Lower Bound -.0528033
Upper Bound .0528033
5% Trimmed Mean -.0264214
Median -.0344304
Variance .239
Std. Deviation .48909241
Minimum -1.53431
Maximum 7.32860
Range 8.86291
Interquartile Range .13593
Skewness 10.702 .134
Kurtosis 156.591 .267
Extreme Values
Case Number Value
Unstandardized Residual
Highest 1 116 7.32860
2 258 2.89486
3 325 1.06949
4 147 .84648
5 277 .65578
Lowest 1 257 -1.53431
2 180 -1.30825
3 4 -1.03031
4 67 -.97903
5 60 -.81575
Tests of Normality
Kolmogorov-Smirnov(a) Shapiro-Wilk
Statistic df Sig. Statistic df Sig.
Unstandardized Residual .277 332 .000 .339 332 .000
a Lilliefors Significance Correction
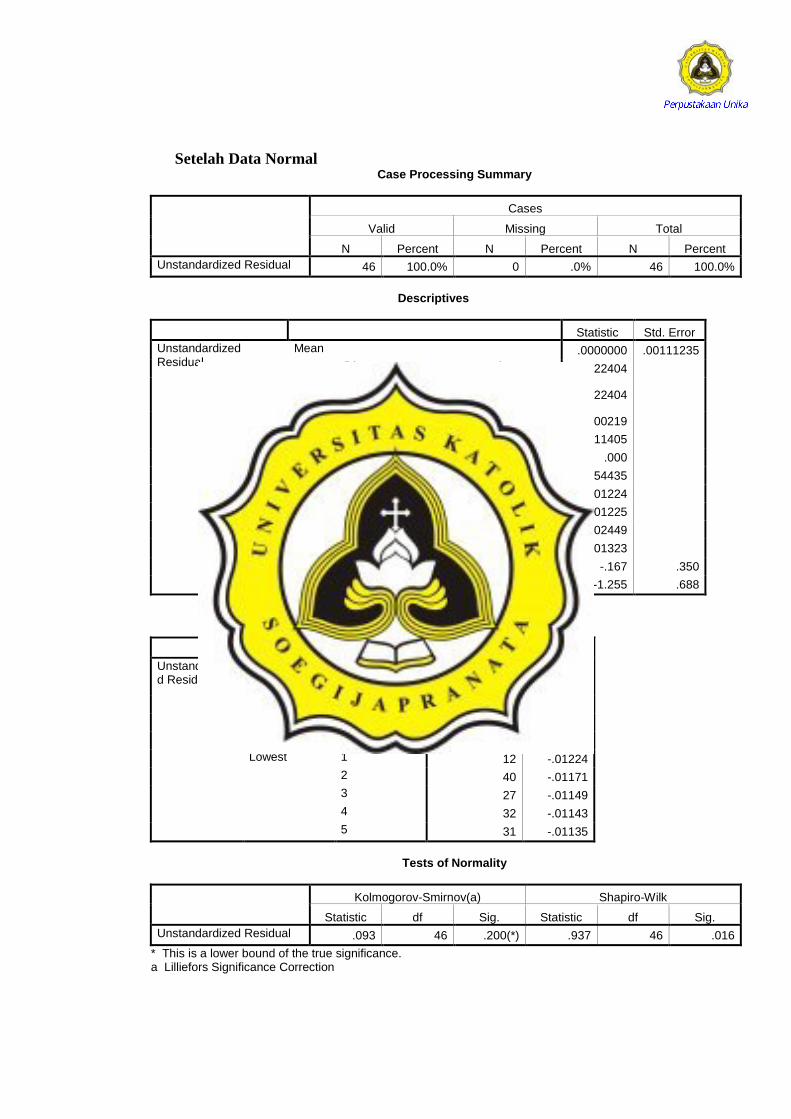
Setelah Data Normal Case Processing Summary
Cases
Valid Missing Total
N Percent N Percent N Percent
Unstandardized Residual 46 100.0% 0 .0% 46 100.0%
Descriptives
Statistic Std. Error
Unstandardized Residual
Mean .0000000 .00111235
95% Confidence Interval for Mean
Lower Bound -.0022404
Upper Bound .0022404
5% Trimmed Mean .0000219
Median .0011405
Variance .000
Std. Deviation .00754435
Minimum -.01224
Maximum .01225
Range .02449
Interquartile Range .01323
Skewness -.167 .350
Kurtosis -1.255 .688
Extreme Values
Case Number Value
Unstandardized Residual
Highest 1 37 .01225
2 13 .01097
3 46 .01090
4 3 .00968
5 5 .00946
Lowest 1 12 -.01224
2 40 -.01171
3 27 -.01149
4 32 -.01143
5 31 -.01135
Tests of Normality
Kolmogorov-Smirnov(a) Shapiro-Wilk
Statistic df Sig. Statistic df Sig.
Unstandardized Residual .093 46 .200(*) .937 46 .016
* This is a lower bound of the true significance. a Lilliefors Significance Correction
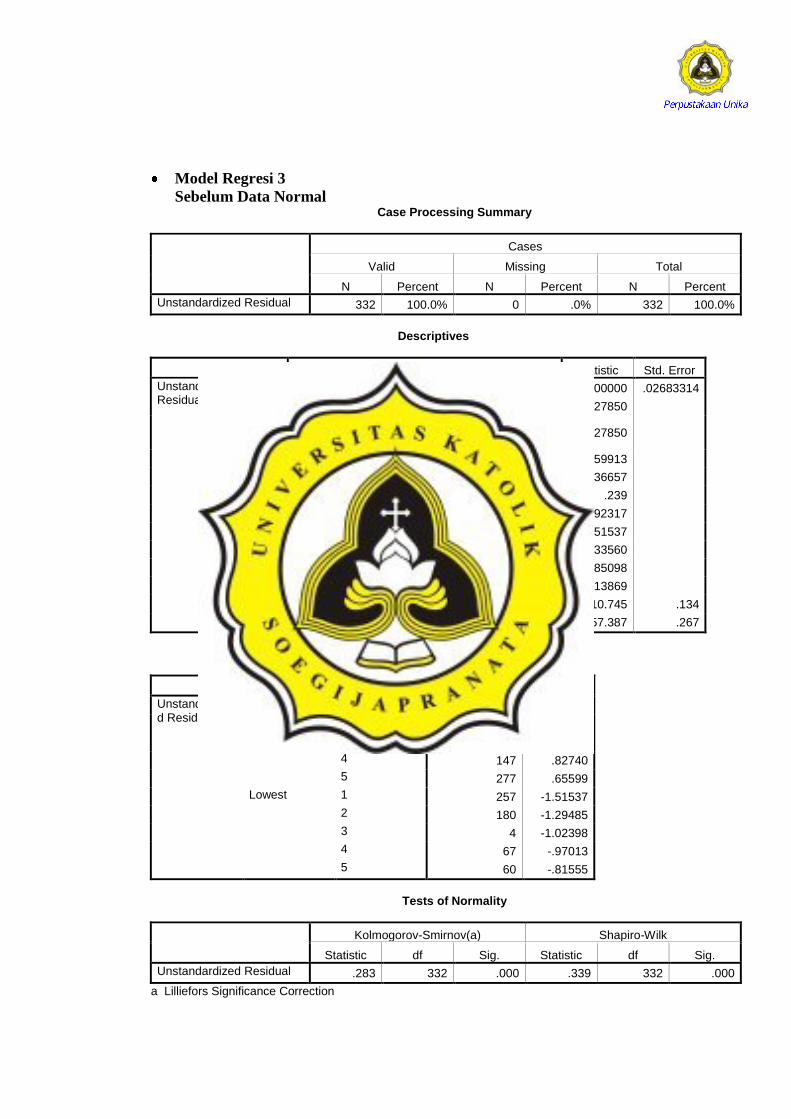
Model Regresi 3
Sebelum Data Normal Case Processing Summary
Cases
Valid Missing Total
N Percent N Percent N Percent
Unstandardized Residual 332 100.0% 0 .0% 332 100.0%
Descriptives
Statistic Std. Error
Unstandardized Residual
Mean .0000000 .02683314
95% Confidence Interval for Mean
Lower Bound -.0527850
Upper Bound .0527850
5% Trimmed Mean -.0259913
Median -.0336657
Variance .239
Std. Deviation .48892317
Minimum -1.51537
Maximum 7.33560
Range 8.85098
Interquartile Range .13869
Skewness 10.745 .134
Kurtosis 157.387 .267
Extreme Values
Case Number Value
Unstandardized Residual
Highest 1 116 7.33560
2 258 2.89643
3 325 1.07142
4 147 .82740
5 277 .65599
Lowest 1 257 -1.51537
2 180 -1.29485
3 4 -1.02398
4 67 -.97013
5 60 -.81555
Tests of Normality
Kolmogorov-Smirnov(a) Shapiro-Wilk
Statistic df Sig. Statistic df Sig.
Unstandardized Residual .283 332 .000 .339 332 .000
a Lilliefors Significance Correction

Setelah Data Normal Case Processing Summary
Cases
Valid Missing Total
N Percent N Percent N Percent
Unstandardized Residual 50 100.0% 0 .0% 50 100.0%
Descriptives
Statistic Std. Error
Unstandardized Residual
Mean .0000000 .00108063
95% Confidence Interval for Mean
Lower Bound -.0021716
Upper Bound .0021716
5% Trimmed Mean -.0000179
Median .0009580
Variance .000
Std. Deviation .00764122
Minimum -.01199
Maximum .01296
Range .02496
Interquartile Range .01535
Skewness -.121 .337
Kurtosis -1.316 .662
Extreme Values
Case Number Value
Unstandardized Residual
Highest 1 30 .01296
2 12 .01132
3 50 .01127
4 5 .00996
5 9 .00980
Lowest 1 39 -.01199
2 15 -.01159
3 29 -.01104
4 35 -.01095
5 44 -.01093
Tests of Normality
Kolmogorov-Smirnov(a) Shapiro-Wilk
Statistic df Sig. Statistic df Sig.
Unstandardized Residual .122 50 .059 .931 50 .006
a Lilliefors Significance Correction

Model Regresi 4
Sebelum Data Normal Case Processing Summary
Cases
Valid Missing Total
N Percent N Percent N Percent
Unstandardized Residual 332 100.0% 0 .0% 332 100.0%
Descriptives
Statistic Std. Error
Unstandardized Residual
Mean .0000000 .02682313
95% Confidence Interval for Mean
Lower Bound -.0527653
Upper Bound .0527653
5% Trimmed Mean -.0265318
Median -.0326203
Variance .239
Std. Deviation .48874072
Minimum -1.52069
Maximum 7.32820
Range 8.84888
Interquartile Range .13618
Skewness 10.731 .134
Kurtosis 157.044 .267
Extreme Values
Case Number Value
Unstandardized Residual
Highest 1 116 7.32820
2 258 2.90377
3 325 1.07929
4 147 .81600
5 277 .66376
Lowest 1 257 -1.52069
2 180 -1.30111
3 4 -1.03150
4 67 -.96998
5 60 -.82415
Tests of Normality
Kolmogorov-Smirnov(a) Shapiro-Wilk
Statistic df Sig. Statistic df Sig.
Unstandardized Residual .280 332 .000 .339 332 .000
a Lilliefors Significance Correction

Setelah Data Normal Case Processing Summary
Cases
Valid Missing Total
N Percent N Percent N Percent
Unstandardized Residual 43 100.0% 0 .0% 43 100.0%
Descriptives
Statistic Std. Error
Unstandardized Residual
Mean .0000000 .00102305
95% Confidence Interval for Mean
Lower Bound -.0020646
Upper Bound .0020646
5% Trimmed Mean .0000019
Median .0011740
Variance .000
Std. Deviation .00670858
Minimum -.01152
Maximum .01085
Range .02237
Interquartile Range .01123
Skewness -.249 .361
Kurtosis -1.112 .709
Extreme Values
Case Number Value
Unstandardized Residual
Highest 1 9 .01085
2 5 .01084
3 42 .01031
4 12 .00809
5 31 .00790
Lowest 1 8 -.01152
2 38 -.01028
3 25 -.01004
4 43 -.01003
5 30 -.00989
Tests of Normality
Kolmogorov-Smirnov(a) Shapiro-Wilk
Statistic df Sig. Statistic df Sig.
Unstandardized Residual .111 43 .200(*) .936 43 .018
* This is a lower bound of the true significance. a Lilliefors Significance Correction
UJI MULTIKOLONIERITAS
Model Regresi 1
Coefficients(a)
Model Unstandardized
Coefficients Standardized Coefficients t Sig.
Collinearity Statistics
B Std. Error Beta Tolerance VIF
1 (Constant) -.005 .001 -3.683 .001
EPSBGW .000 .000 .336 2.258 .030 1.000 1.000
a Dependent Variable: CAR Coefficient Correlations(a)
Model EPSBGW
1 Correlations
EPSBGW 1.000
Covariances
EPSBGW .000
a Dependent Variable: CAR Collinearity Diagnostics(a)
Model Dimension Eigenvalue
Condition Index
Variance Proportions
(Constant) EPSBGW
1 1 1.462 1.000 .27 .27
2 .538 1.648 .73 .73
a Dependent Variable: CAR
Model Regresi 2 Coefficients(a)
Model Unstandardized
Coefficients Standardized Coefficients t Sig.
Collinearity Statistics
B Std. Error Beta Tolerance VIF
1 (Constant) -.004 .001 -2.923 .005
EPSAGW .000 .000 .162 1.090 .282 1.000 1.000
a Dependent Variable: CAR Coefficient Correlations(a)
Model EPSAGW
1 Correlations
EPSAGW 1.000
Covariances
EPSAGW .000
a Dependent Variable: CAR
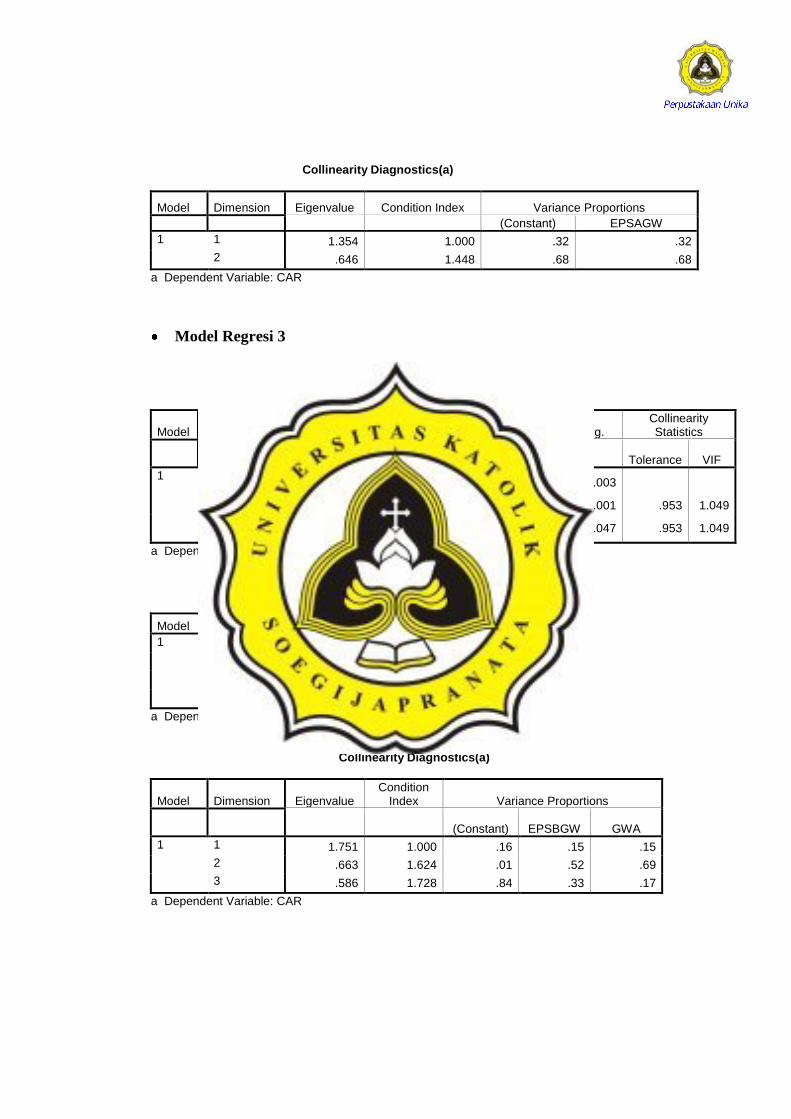
Collinearity Diagnostics(a)
Model Dimension Eigenvalue Condition Index Variance Proportions
(Constant) EPSAGW
1 1 1.354 1.000 .32 .32
2 .646 1.448 .68 .68
a Dependent Variable: CAR
Model Regresi 3
Coefficients(a)
Model Unstandardized
Coefficients Standardized Coefficients t Sig.
Collinearity Statistics
B Std. Error Beta Tolerance VIF
1 (Constant) -.004 .001
-3.114
.003
EPSBGW .000 .000 .475 3.653 .001 .953 1.049
GWA .000 .000 -.265
-2.039
.047 .953 1.049
a Dependent Variable: CAR Coefficient Correlations(a)
Model GWA EPSBGW
1 Correlations
GWA 1.000 -.216
EPSBGW -.216 1.000
Covariances
GWA .000 .000
EPSBGW .000 .000
a Dependent Variable: CAR Collinearity Diagnostics(a)
Model Dimension Eigenvalue Condition
Index Variance Proportions
(Constant) EPSBGW GWA
1 1 1.751 1.000 .16 .15 .15
2 .663 1.624 .01 .52 .69
3 .586 1.728 .84 .33 .17
a Dependent Variable: CAR
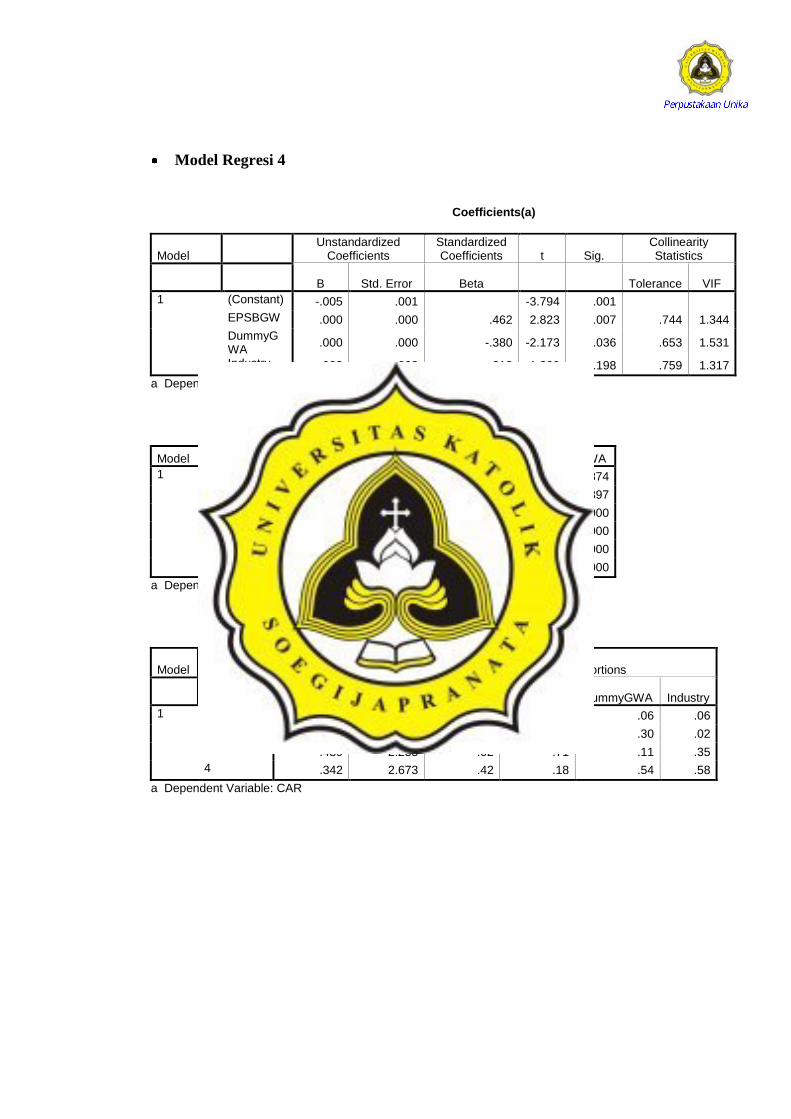
Model Regresi 4
Coefficients(a)
Model Unstandardized
Coefficients Standardized Coefficients t Sig.
Collinearity Statistics
B Std. Error Beta Tolerance VIF
1 (Constant) -.005 .001 -3.794 .001
EPSBGW .000 .000 .462 2.823 .007 .744 1.344
DummyGWA
.000 .000 -.380 -2.173 .036 .653 1.531
Industry .003 .003 .212 1.309 .198 .759 1.317
a Dependent Variable: CAR Coefficient Correlations(a)
Model Industry EPSBGW DummyGWA
1 Correlations Industry 1.000 -.142 -.374
EPSBGW -.142 1.000 -.397
DummyGWA -.374 -.397 1.000
Covariances Industry .000 .000 .000
EPSBGW .000 .000 .000
DummyGWA .000 .000 .000
a Dependent Variable: CAR Collinearity Diagnostics(a)
Model Dimension Eigenvalue Condition
Index Variance Proportions
(Constant) EPSBGW DummyGWA Industry
1 1 2.445 1.000 .06 .06 .06 .06
2 .724 1.838 .50 .05 .30 .02
3 .489 2.235 .02 .71 .11 .35
4 .342 2.673 .42 .18 .54 .58
a Dependent Variable: CAR

UJI HETEROKEDASTISITAS
Model Regresi 1 Variables Entered/Removed(b)
Model Variables Entered Variables Removed Method
1 EPSBGW(a) . Enter
a All requested variables entered. b Dependent Variable: AbsRes Model Summary
Model R R Square Adjusted R Square Std. Error of the Estimate
1 .021(a) .000 -.025 .00352
a Predictors: (Constant), EPSBGW ANOVA(b)
Model Sum of Squares df Mean Square F Sig.
1 Regression .000 1 .000 .018 .895(a)
Residual .000 40 .000
Total .000 41
a Predictors: (Constant), EPSBGW b Dependent Variable: AbsRes Coefficients(a)
Model Unstandardized
Coefficients Standardized Coefficients t Sig.
B Std. Error Beta
1 (Constant) .006 .001 9.855 .000
EPSBGW .000 .000 -.021 -.133 .895
a Dependent Variable: AbsRes
Model Regresi 2
Variables Entered/Removed(b)
Model Variables Entered Variables Removed Method
1 EPSAGW(a) . Enter
a All requested variables entered. b Dependent Variable: AbsRes Model Summary
Model R R Square Adjusted R Square Std. Error of the Estimate
1 .049(a) .002 -.020 .00384
a Predictors: (Constant), EPSAGW
ANOVA(b)
Model Sum of Squares df Mean Square F Sig.
1 Regression .000 1 .000 .107 .745(a)
Residual .001 44 .000
Total .001 45
a Predictors: (Constant), EPSAGW b Dependent Variable: AbsRes Coefficients(a)
Model Unstandardized
Coefficients Standardized Coefficients t Sig.
B Std. Error Beta
1 (Constant) .006 .001 10.519 .000
EPSAGW .000 .000 .049 .327 .745
a Dependent Variable: AbsRes
Model Regresi 3
Variables Entered/Removed(b)
Model Variables Entered Variables Removed Method
1 GWA, EPSBGW(a) . Enter
a All requested variables entered. b Dependent Variable: AbsRes Model Summary
Model R R Square Adjusted R Square Std. Error of the Estimate
1 .236(a) .055 .015 .00377
a Predictors: (Constant), GWA, EPSBGW ANOVA(b)
Model Sum of Squares df Mean Square F Sig.
1 Regression .000 2 .000 1.380 .261(a)
Residual .001 47 .000
Total .001 49
a Predictors: (Constant), GWA, EPSBGW b Dependent Variable: AbsRes
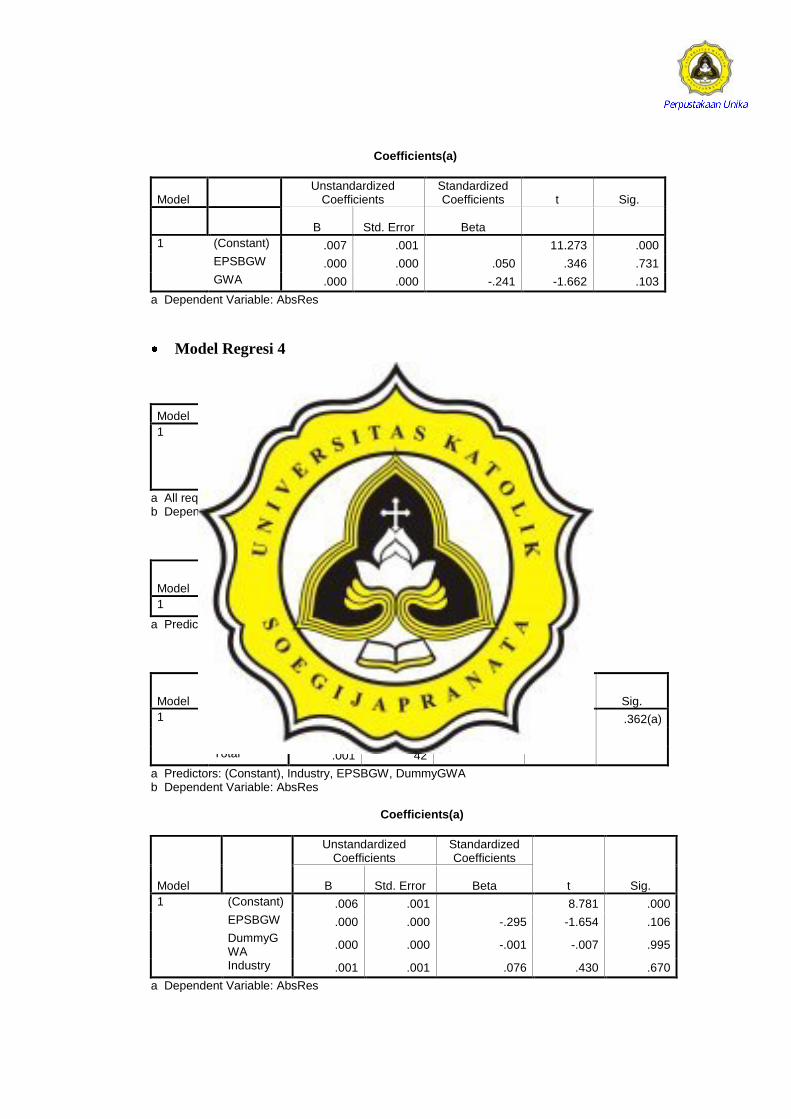
Coefficients(a)
Model Unstandardized
Coefficients Standardized Coefficients t Sig.
B Std. Error Beta
1 (Constant) .007 .001 11.273 .000
EPSBGW .000 .000 .050 .346 .731
GWA .000 .000 -.241 -1.662 .103
a Dependent Variable: AbsRes
Model Regresi 4
Variables Entered/Removed(b)
Model Variables Entered Variables Removed Method
1
Industry, EPSBGW, DummyGWA(a)
. Enter
a All requested variables entered. b Dependent Variable: AbsRes Model Summary
Model R R Square Adjusted R
Square Std. Error of the Estimate
1 .279(a) .078 .007 .00359
a Predictors: (Constant), Industry, EPSBGW, DummyGWA ANOVA(b)
Model Sum of
Squares df Mean Square F Sig.
1 Regression .000 3 .000 1.096 .362(a)
Residual .001 39 .000
Total .001 42
a Predictors: (Constant), Industry, EPSBGW, DummyGWA b Dependent Variable: AbsRes Coefficients(a)
Model
Unstandardized Coefficients
Standardized Coefficients
t Sig. B Std. Error Beta
1 (Constant) .006 .001 8.781 .000
EPSBGW .000 .000 -.295 -1.654 .106
DummyGWA
.000 .000 -.001 -.007 .995
Industry .001 .001 .076 .430 .670
a Dependent Variable: AbsRes

UJI AUTOKORELASI
Model Regresi 1 Model Summary(b)
Model R R Square Adjusted R
Square Std. Error of the Estimate Durbin-Watson
1 .336(a) .113 .091 .0070898 1.901
a Predictors: (Constant), EPSBGW b Dependent Variable: CAR
Model Regresi 2 Model Summary(b)
Model R R Square Adjusted R
Square Std. Error of the Estimate Durbin-Watson
1 .162(a) .026 .004 .0076296 1.999
a Predictors: (Constant), EPSAGW b Dependent Variable: CAR
Model Regresi 3 Model Summary(b)
Model R R Square Adjusted R
Square Std. Error of the Estimate Durbin-Watson
1 .492(a) .242 .209 .0078021 2.346
a Predictors: (Constant), GWA, EPSBGW b Dependent Variable: CAR
Model Regresi 4 Model Summary(b)
Model R R Square Adjusted R
Square Std. Error of the Estimate Durbin-Watson
1 .471(a) .221 .162 .0069618 1.877
a Predictors: (Constant), Industry, EPSBGW, DummyGWA b Dependent Variable: CAR

LAMPIRAN 15 :
STATISTIK DESKRIPTIF -
PENGUJIAN TAMBAHAN
(KELOMPOK DATA GABUNGAN)
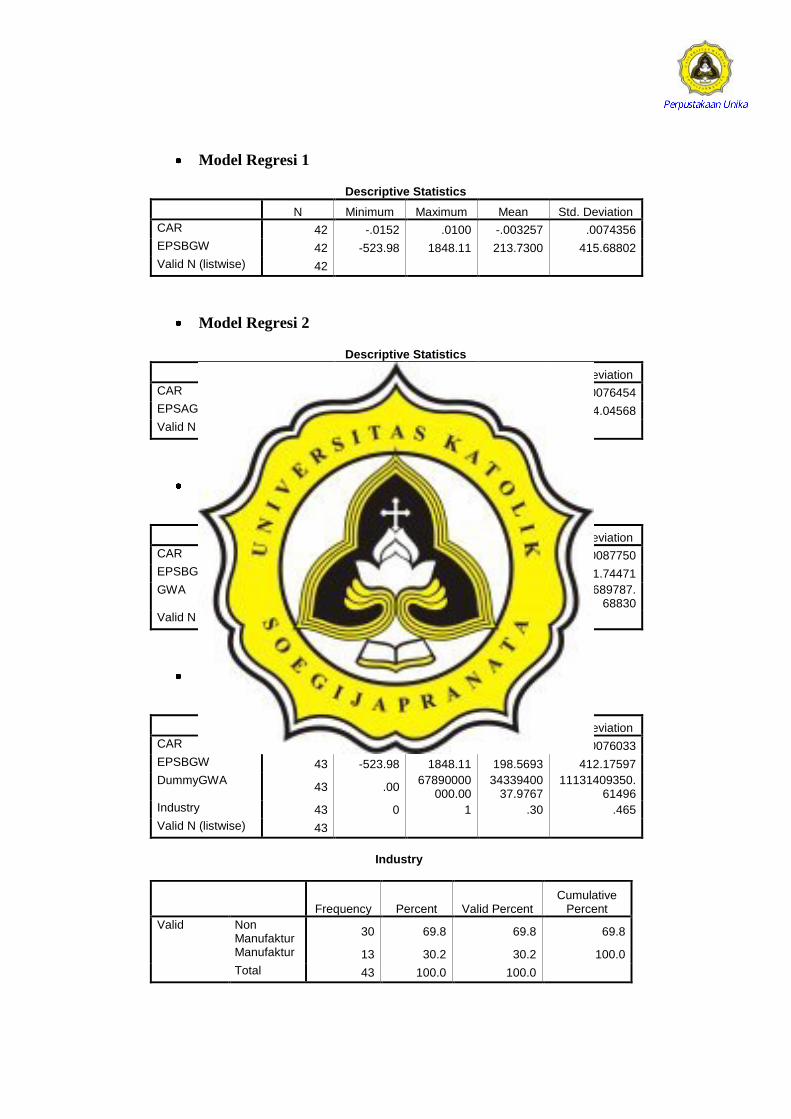
Model Regresi 1
Descriptive Statistics
N Minimum Maximum Mean Std. Deviation
CAR 42 -.0152 .0100 -.003257 .0074356
EPSBGW 42 -523.98 1848.11 213.7300 415.68802
Valid N (listwise) 42
Model Regresi 2
Descriptive Statistics
N Minimum Maximum Mean Std. Deviation
CAR 46 -.0159 .0100 -.003052 .0076454
EPSAGW 46 -1095.50 1348.00 136.4274 364.04568
Valid N (listwise) 46
Model Regresi 3
Descriptive Statistics
N Minimum Maximum Mean Std. Deviation
CAR 50 -.0160 .0254 -.003082 .0087750
EPSBGW 50 -1095.10 2276.76 230.2814 531.74471
GWA 50 972709.00
284270056600.00
21837934562.9200
52588689787.68830
Valid N (listwise) 50
Model Regresi 4
Descriptive Statistics
N Minimum Maximum Mean Std. Deviation
CAR 43 -.0159 .0100 -.003123 .0076033
EPSBGW 43 -523.98 1848.11 198.5693 412.17597
DummyGWA 43 .00
67890000000.00
3433940037.9767
11131409350.61496
Industry 43 0 1 .30 .465
Valid N (listwise) 43
Industry
Frequency Percent Valid Percent Cumulative
Percent
Valid Non Manufaktur
30 69.8 69.8 69.8
Manufaktur 13 30.2 30.2 100.0
Total 43 100.0 100.0

LAMPIRAN 16 :
MODEL REGRESI 1 - PENGUJIAN
TAMBAHAN (KELOMPOK
GABUNGAN)
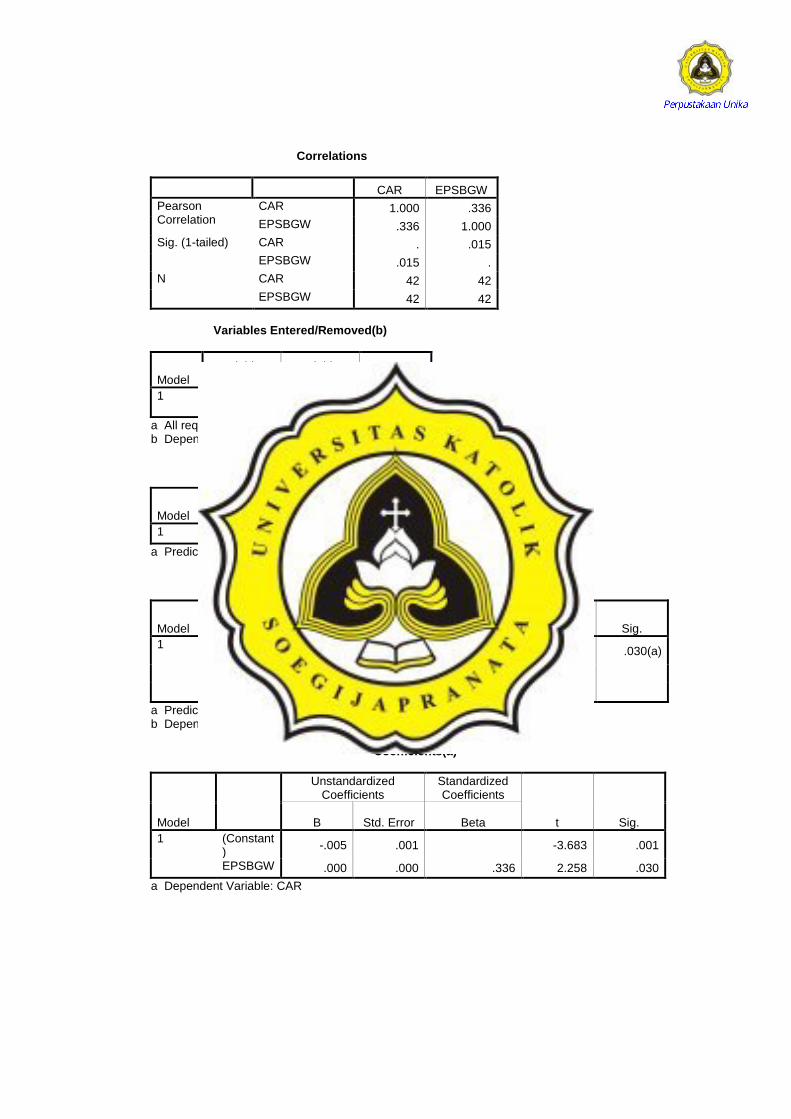
Correlations
CAR EPSBGW
Pearson Correlation
CAR 1.000 .336
EPSBGW .336 1.000
Sig. (1-tailed) CAR . .015
EPSBGW .015 .
N CAR 42 42
EPSBGW 42 42
Variables Entered/Removed(b)
Model Variables Entered
Variables Removed Method
1 EPSBGW(a)
. Enter
a All requested variables entered. b Dependent Variable: CAR Model Summary
Model R R Square Adjusted R
Square Std. Error of the Estimate
1 .336(a) .113 .091 .0070898
a Predictors: (Constant), EPSBGW ANOVA(b)
Model Sum of
Squares df Mean Square F Sig.
1 Regression
.000 1 .000 5.097 .030(a)
Residual .002 40 .000
Total .002 41
a Predictors: (Constant), EPSBGW b Dependent Variable: CAR Coefficients(a)
Model
Unstandardized Coefficients
Standardized Coefficients
t Sig. B Std. Error Beta
1 (Constant)
-.005 .001 -3.683 .001
EPSBGW .000 .000 .336 2.258 .030
a Dependent Variable: CAR

LAMPIRAN 17 :
MODEL REGRESI 2 - PENGUJIAN
TAMBAHAN (KELOMPOK DATA
GABUNGAN)
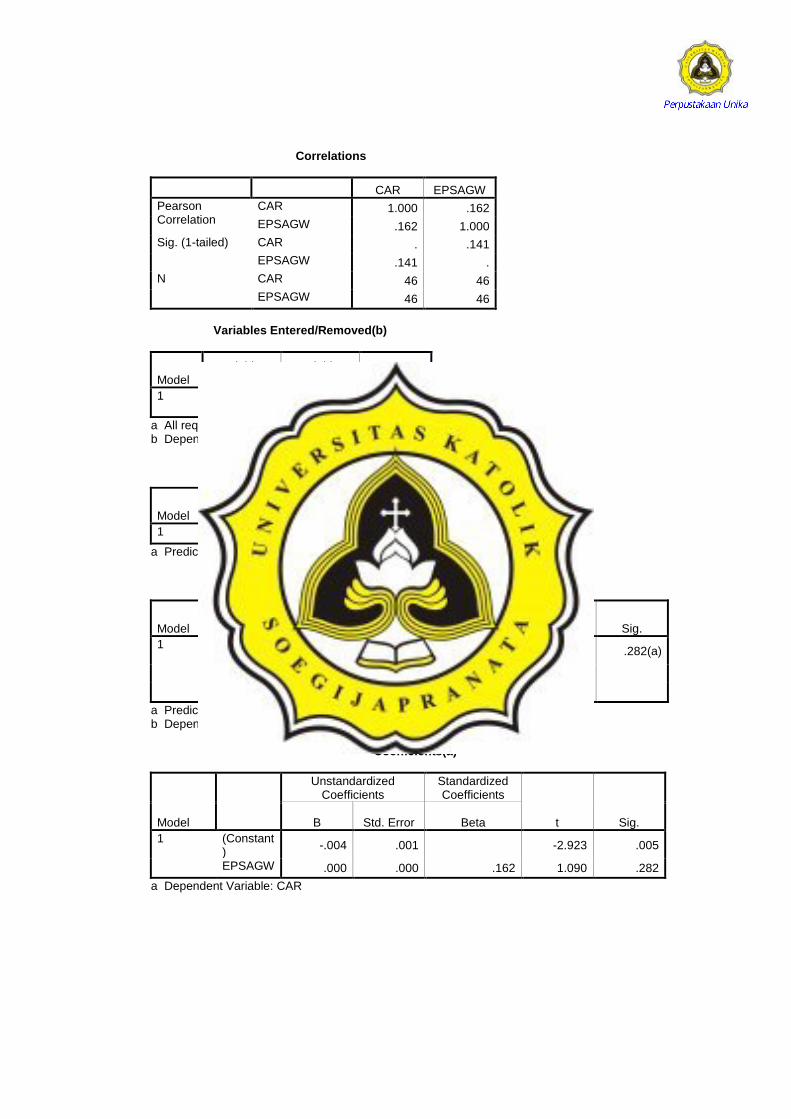
Correlations
CAR EPSAGW
Pearson Correlation
CAR 1.000 .162
EPSAGW .162 1.000
Sig. (1-tailed) CAR . .141
EPSAGW .141 .
N CAR 46 46
EPSAGW 46 46
Variables Entered/Removed(b)
Model Variables Entered
Variables Removed Method
1 EPSAGW(a)
. Enter
a All requested variables entered. b Dependent Variable: CAR Model Summary
Model R R Square Adjusted R
Square Std. Error of the Estimate
1 .162(a) .026 .004 .0076296
a Predictors: (Constant), EPSAGW ANOVA(b)
Model Sum of
Squares df Mean Square F Sig.
1 Regression
.000 1 .000 1.187 .282(a)
Residual .003 44 .000
Total .003 45
a Predictors: (Constant), EPSAGW b Dependent Variable: CAR Coefficients(a)
Model
Unstandardized Coefficients
Standardized Coefficients
t Sig. B Std. Error Beta
1 (Constant)
-.004 .001 -2.923 .005
EPSAGW .000 .000 .162 1.090 .282
a Dependent Variable: CAR

LAMPIRAN 18 :
MODEL REGRESI 3 - PENGUJIAN
TAMBAHAN (KELOMPOK DATA
GABUNGAN)

Correlations
CAR EPSBGW GWA
Pearson Correlation
CAR 1.000 .418 -.163
EPSBGW .418 1.000 .216
GWA -.163 .216 1.000
Sig. (1-tailed) CAR . .001 .129
EPSBGW .001 . .066
GWA .129 .066 .
N CAR 50 50 50
EPSBGW 50 50 50
GWA 50 50 50
Variables Entered/Removed(b)
Model Variables Entered
Variables Removed Method
1 GWA, EPSBGW(a
) . Enter
a All requested variables entered. b Dependent Variable: CAR Model Summary
Model R R Square Adjusted R
Square Std. Error of the Estimate
1 .492(a) .242 .209 .0078021
a Predictors: (Constant), GWA, EPSBGW ANOVA(b)
Model Sum of
Squares df Mean Square F Sig.
1 Regression
.001 2 .000 7.491 .001(a)
Residual .003 47 .000
Total .004 49
a Predictors: (Constant), GWA, EPSBGW b Dependent Variable: CAR Coefficients(a)
Model Unstandardized
Coefficients Standardized Coefficients t Sig.
B Std. Error Beta
1 (Constant)
-.004 .001 -3.114 .003
EPSBGW .000 .000 .475 3.653 .001
GWA .000 .000 -.265 -2.039 .047
a Dependent Variable: CAR

LAMPIRAN 19 :
MODEL REGRESI 4 - PENGUJIAN
TAMBAHAN (KELOMPOK DATA
GABUNGAN)
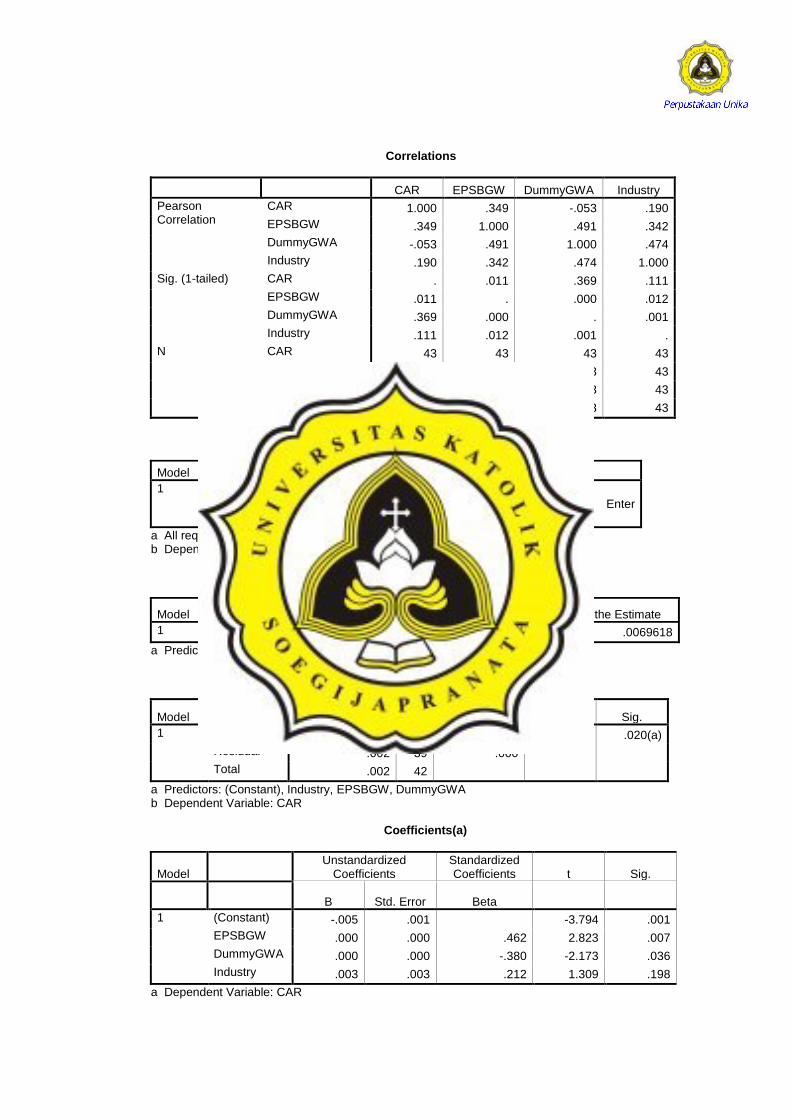
Correlations
CAR EPSBGW DummyGWA Industry
Pearson Correlation
CAR 1.000 .349 -.053 .190
EPSBGW .349 1.000 .491 .342
DummyGWA -.053 .491 1.000 .474
Industry .190 .342 .474 1.000
Sig. (1-tailed) CAR . .011 .369 .111
EPSBGW .011 . .000 .012
DummyGWA .369 .000 . .001
Industry .111 .012 .001 .
N CAR 43 43 43 43
EPSBGW 43 43 43 43
DummyGWA 43 43 43 43
Industry 43 43 43 43
Variables Entered/Removed(b)
Model Variables Entered Variables Removed Method
1 Industry, EPSBGW,
DummyGWA(a) . Enter
a All requested variables entered. b Dependent Variable: CAR Model Summary
Model R R Square Adjusted R Square Std. Error of the Estimate
1 .471(a) .221 .162 .0069618
a Predictors: (Constant), Industry, EPSBGW, DummyGWA ANOVA(b)
Model Sum of Squares df Mean Square F Sig.
1 Regression .001 3 .000 3.699 .020(a)
Residual .002 39 .000
Total .002 42
a Predictors: (Constant), Industry, EPSBGW, DummyGWA b Dependent Variable: CAR Coefficients(a)
Model Unstandardized
Coefficients Standardized Coefficients t Sig.
B Std. Error Beta
1 (Constant) -.005 .001 -3.794 .001
EPSBGW .000 .000 .462 2.823 .007
DummyGWA .000 .000 -.380 -2.173 .036
Industry .003 .003 .212 1.309 .198
a Dependent Variable: CAR