kuesioner penelitian - repository.unika.ac.idrepository.unika.ac.id/14967/8/12.60.0221 gabriela...
TRANSCRIPT

67
KUESIONER PENELITIAN
Dengan hormat,
Dalam rangka memenuhi tugas akhir sebagai mahasiswi jurusan Akuntansi
Fakultas Ekonomi dan Bisnis di Universitas Katolik Soegijapranata Semarang,
saya melakukan penelitian dengan judul ”Faktor-faktor yang Mempengaruhi
Penggunaan Mobile Banking. Sehubungan dengan adanya penelitian tersebut,
saya mohon partisipasi Bapak/Ibu/Saudara/i untuk menjadi responden dalam
penelitian ini. Data-data yang saya peroleh akan saya jaga kerahasiaannya dan
semata-mata akan saya gunakan untuk kepentingan akademis. Atas kerjasama,
dukungan dan perhatian Bapak/Ibu/Saudara/i, saya ucapkan terimakasih.
Peneliti,
Gabriela Vianney R

68
Dibawah ini adalah daftar pertanyaan dan pernyataan–pernyataan identitas
responden dan item-item mengenai faktor-faktor penerimaaan teknologi. Untuk
itu mohon Bapak/Ibu/Saudara/i memberi tanda tick mark (√) atau silang (X) dari
setiap pernyataan berikut sesuai dengan pengalaman setelah Bapak/Ibu/Saudara/i
menggunakan Mobile Banking..
Nama / NIM : .........................
Jenis Kelamin : ( ) Laki-laki ( ) Perempuan
Jurusan : .........................
Jenjang Pendidikan : ( ) Diploma (D3)
( ) Strata1 (S1)
( ) Strata2 (S2)
Jenis Bank : ( ) Bank Central Asia (BCA)
( ) Bank BII
( ) Bank BNI
( ) Bank BRI
( ) Bank Mandiri
( ) .........................
Mohon dibaca setiap item pernyataan di bawah ini dan beri tanggapan
dengan memberikan tanda tick mark (√) atau silang (X) pada kolom jawaban
yang disediakan dengan keterangan sebagai berikut:
STS (Sangat Tidak Setuju) S (Setuju)
TS (Tidak Setuju) SS (Sangat Setuju)
N (Netral)
69
PERCEIVED USEFULLNESS
No. Keterangan STS TS RR S SS
1. Dengan menggunakan M-Banking
dapat meningkatkan efektivitas saya
dalam menyelesaikan transaksi
2. M-Banking mendukung bagian
terpenting dalam transaksi saya
3. Dengan menggunakan M-Banking
dapat membuat transaksi yang saya
lakukan menjadi lebih akurat
4. Dengan menggunakan M-Banking saya dapat mengakses berbagai
informasi terkait transaksi perbankan
saya
5. Dengan menggunakan M-Banking
dapat meningkatkan efisiensi dalam
memanfaatkan layanan perbankan
PERCEIVED EASE OF USE
No. Keterangan STS TS RR S SS
1. Saya merasakan kemudahan ketika
saya belajar menggunakan M-Banking
2. Saya merasa mudah untuk
mendapatkan apa yang saya butuhkan seperti informasi saldo,transfer antar
rekening dan pembayaran tagihan
dalam menggunakan M-Banking
3. Saya merasa jelas dan mengerti ketika menggunakan M-Banking
4. Saya merasa mudah untuk menggunakan M-Banking
5. Saya merasa menggunakan M-
Banking sangat praktis

70
Keamanan dan Privasi
No. Keterangan STS TS RR S SS
1. Menggunakan M-Banking aman
secara finansial
2. Saya percaya pada kemampuan M-
Banking untuk melindungi privasi
saya
3. Saya percaya untuk menggunakan
M-Banking
4. saya tidak khawatir tentang
keamanan M-Banking
Persepsi Risiko (Perceived Risk)
No. Keterangan STS TS RR S SS
1. Menurut saya transaksi melalui M-
Banking tidak memiliki risiko yang
tinggi
2. Orang lain akan mengetahui
informasi mengenai transaksi M-
Banking saya
3. Gangguan dalam layanan M-
Banking sangat rendah
4. Bank menjamin kebutuhan nasabah
yang melakukan transaksi melalui
M-Banking
Kemampuan Akses (Accessibility)
No. Keterangan STS TS RR S SS
1. Saya dapat menggunakan mobile banking setiap saat sepanjang hari
2. Saya dapat menggunakan mobile banking dimanapun saya berada
71
SIKAP (ATTITUDE TOWARD USING)
No. Keterangan STS TS RR S SS
1. Saya berpikir positif tentang M-
Banking
2. M-Banking merupakan sarana
positif untuk membuat kenyamanan
transaksi pengguna atau nasabah
bank
3. Implementasi M-Banking
merupakan ide yang bijaksana
4. Menggunakan M-Banking
merupakan pengalaman
menyenangkan
5. Saya merasa fasilitas M-Banking
akan lebih banyak digunakan orang
dimasa mendatang
MINAT (INTENTION TO USE)
No. Keterangan STS TS RR S SS
1. Saya berencana untuk
menggunakan fasilitas M-Banking
dengan sering
2. Saya selalu ingin mencoba untuk
menggunakan M-Banking dengan
lebih sering daripada orang awan
lainnya
3. Saya ingin selalu menggunakan M-
Banking
4. Saya berencana untuk
menggunakan M-Banking pada
setiap kali kesempatan transaksi
5. Saya merencanakan untuk
melanjutkan penggunaan M-
Banking karena membuat transaksi
lebih mudah

72
PERILAKU
No. Keterangan STS TS RR S SS
1. Dalam transaksi perbankan saya
sangat tergantung dengan
mobile banking
2. Saya melakukan berbagai macam
transaksi mengunakan mobile
banking (misal : pembayaran
kuliah,pulsa, Penarikan tunai)
3. Saya menggunakan mobile banking
karena menyediakan informasi
yang saya butuhkan selama saya
melakukan transaksi perbankan
73
HASIL SPSS
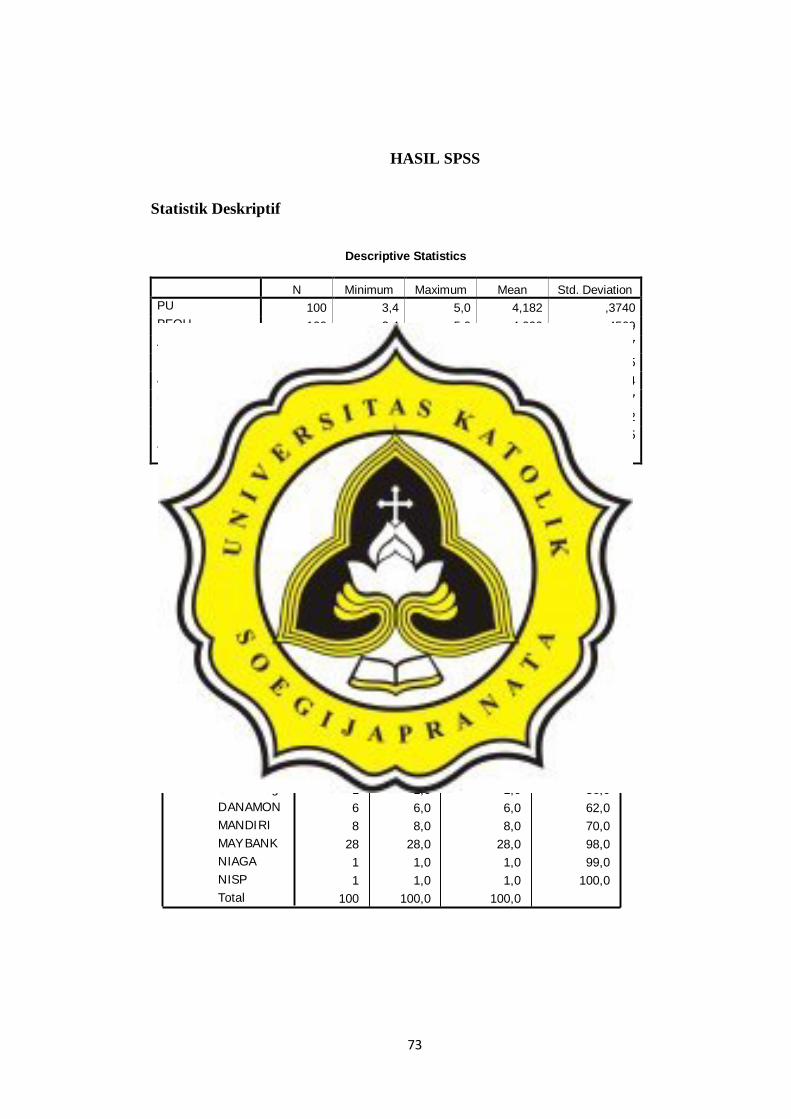
Statistik Deskriptif
Descriptive Statistics
N Minimum Maximum Mean Std. Deviation
PU 100 3,4 5,0 4,182 ,3740
PEOU 100 2,4 5,0 4,090 ,4569
AMAN 100 2,25 5,00 3,6500 ,62057
RISK 100 1,75 4,50 3,2250 ,56575
AKSES 100 2,0 5,0 3,845 ,6224
SIKAP 100 2,4 5,0 3,996 ,4557
MINAT 100 2,4 5,0 3,688 ,6092
PERILAKU 100 1,50 11,00 2,8600 1,15815
Valid N (listwise) 100
Statistics
100 100
0 0
Valid
Missing
N
Bank JenisKelamin
Bank
35 35,0 35,0 35,0
6 6,0 6,0 41,0
13 13,0 13,0 54,0
1 1,0 1,0 55,0
1 1,0 1,0 56,0
6 6,0 6,0 62,0
8 8,0 8,0 70,0
28 28,0 28,0 98,0
1 1,0 1,0 99,0
1 1,0 1,0 100,0
100 100,0 100,0
BCA
BNI
BRI
BTM
CIMB Niaga
DANAMON
MANDIRI
MAYBANK
NIAGA
NISP
Total
Valid
Frequency Percent Valid Percent
Cumulat iv e
Percent

74
Validitas dan Realibilitas
1. Perceived Usefulness
Case Processing Summary
N %
Cases Valid 100 100,0
Excluded(
a) 0 ,0
Total 100 100,0
a Listwise deletion based on all variables in the procedure.
JenisKelamin
64 64,0 64,0 64,0
36 36,0 36,0 100,0
100 100,0 100,0
Perempuan
Laki-laki
Total
Valid
Frequency Percent Valid Percent
Cumulat iv e
Percent
Reliabi lity Statistics
,673 ,676 5
Cronbach's
Alpha
Cronbach's
Alpha Based
on
Standardized
Items N of Items
Item Statistics
4,40 ,512 100
4,16 ,545 100
4,06 ,565 100
4,15 ,575 100
4,14 ,636 100
PU1
PU2
PU3
PU4
PU5
Mean Std. Dev iation N

75
2. Perceived Ease of Use
Inter-I tem Correlation Matrix
1,000 ,455 ,195 ,308 ,136
,455 1,000 ,329 ,277 ,255
,195 ,329 1,000 ,314 ,285
,308 ,277 ,314 1,000 ,384
,136 ,255 ,285 ,384 1,000
PU1
PU2
PU3
PU4
PU5
PU1 PU2 PU3 PU4 PU5
The covariance matrix is calculated and used in the analysis.
Item-Total Statistics
16,51 2,596 ,387 ,246 ,639
16,75 2,391 ,479 ,287 ,599
16,85 2,452 ,410 ,181 ,629
16,76 2,326 ,479 ,246 ,597
16,77 2,341 ,386 ,193 ,644
PU1
PU2
PU3
PU4
PU5
Scale Mean if
Item Deleted
Scale
Variance if
Item Deleted
Corrected
Item-Total
Correlation
Squared
Mult iple
Correlation
Cronbach's
Alpha if Item
Deleted
Scale Statistics
20,91 3,497 1,870 5
Mean Variance Std. Deviation N of Items
Case Processing Summary
100 100,0
0 ,0
100 100,0
Valid
Excludeda
Total
Cases
N %
Listwise deletion based on all
variables in the procedure.
a.

76
3. Keamanan dan Privasi
Reliabi lity Statistics
,784 ,783 5
Cronbach's
Alpha
Cronbach's
Alpha Based
on
Standardized
Items N of Items
Inter-I tem Correlation Matrix
1,000 ,391 ,278 ,338 ,423
,391 1,000 ,269 ,424 ,554
,278 ,269 1,000 ,531 ,381
,338 ,424 ,531 1,000 ,608
,423 ,554 ,381 ,608 1,000
PEOU1
PEOU2
PEOU3
PEOU4
PEOU5
PEOU1 PEOU2 PEOU3 PEOU4 PEOU5
The covariance matrix is calculated and used in the analy sis.
Item-Total Statistics
16,48 3,707 ,464 ,229 ,775
16,14 3,576 ,545 ,346 ,749
16,58 3,721 ,474 ,295 ,771
16,45 3,361 ,649 ,482 ,714
16,15 3,240 ,676 ,498 ,703
PEOU1
PEOU2
PEOU3
PEOU4
PEOU5
Scale Mean if
Item Deleted
Scale
Variance if
Item Deleted
Corrected
Item-Total
Correlation
Squared
Mult iple
Correlation
Cronbach's
Alpha if Item
Deleted
Scale Statistics
20,45 5,220 2,285 5
Mean Variance Std. Deviation N of Items
Case Processing Summary
100 100,0
0 ,0
100 100,0
Valid
Excludeda
Total
Cases
N %
Listwise deletion based on all
variables in the procedure.
a.

77
Inter-Item Correlation Matrix
AMAN1 AMAN2 AMAN3 AMAN4
AMAN1 1,000 ,657 ,442 ,591
AMAN2 ,657 1,000 ,623 ,652
AMAN3 ,442 ,623 1,000 ,498
AMAN4 ,591 ,652 ,498 1,000
The covariance matrix is calculated and used in the analysis.
Reliabi lity Statistics
,845 ,845 4
Cronbach's
Alpha
Cronbach's
Alpha Based
on
Standardized
Items N of Items
Item Statistics
3,66 ,728 100
3,57 ,769 100
3,84 ,677 100
3,53 ,822 100
AMAN1
AMAN2
AMAN3
AMAN4
Mean Std. Dev iation N
Item-Total Statistics
10,94 3,754 ,666 ,478 ,810
11,03 3,363 ,783 ,616 ,758
10,76 4,063 ,600 ,403 ,837
11,07 3,399 ,688 ,483 ,803
AMAN1
AMAN2
AMAN3
AMAN4
Scale Mean if
Item Deleted
Scale
Variance if
Item Deleted
Corrected
Item-Total
Correlation
Squared
Mult iple
Correlation
Cronbach's
Alpha if Item
Deleted
Scale Statistics
14,60 6,162 2,482 4
Mean Variance Std. Deviation N of Items

78
4. Perceived Risk
Case Processing Summary
100 100,0
0 ,0
100 100,0
Valid
Excludeda
Total
Cases
N %
Listwise deletion based on all
variables in the procedure.
a.
Reliabi lity Statistics
,607 ,633 4
Cronbach's
Alpha
Cronbach's
Alpha Based
on
Standardized
Items N of Items
Item Statistics
3,37 ,849 100
2,78 ,938 100
3,10 ,847 100
3,65 ,687 100
RISK1
RISK2
RISK3
RISK4
Mean Std. Dev iat ion N
Inter-Item Correlation Matrix
1,000 ,078 ,482 ,415
,078 1,000 ,092 ,161
,482 ,092 1,000 ,581
,415 ,161 ,581 1,000
RISK1
RISK2
RISK3
RISK4
RISK1 RISK2 RISK3 RISK4
The covariance matrix is calculated and used in the analysis.
79
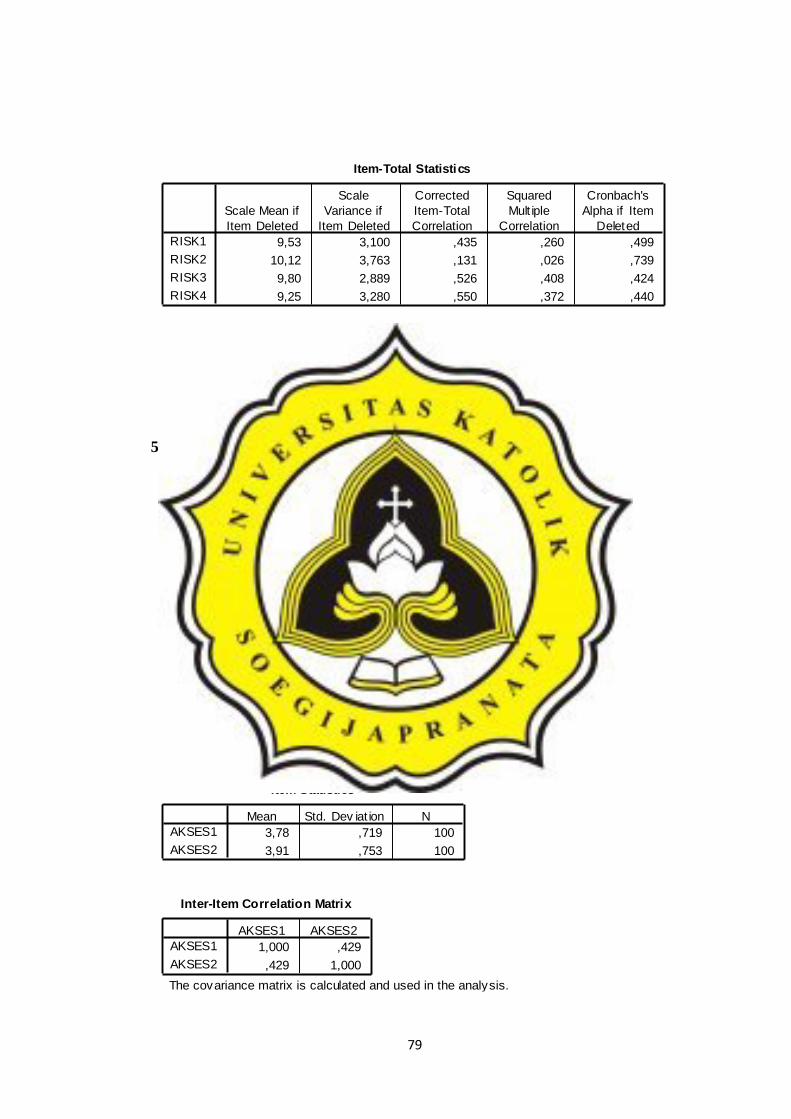
5. Kemampuan Akses (Accesibility)
Item-Total Statistics
9,53 3,100 ,435 ,260 ,499
10,12 3,763 ,131 ,026 ,739
9,80 2,889 ,526 ,408 ,424
9,25 3,280 ,550 ,372 ,440
RISK1
RISK2
RISK3
RISK4
Scale Mean if
Item Deleted
Scale
Variance if
Item Deleted
Corrected
Item-Total
Correlation
Squared
Mult iple
Correlation
Cronbach's
Alpha if Item
Deleted
Scale Statistics
12,90 5,121 2,263 4
Mean Variance Std. Deviation N of Items
Case Processing Summary
100 100,0
0 ,0
100 100,0
Valid
Excludeda
Total
Cases
N %
Listwise deletion based on all
variables in the procedure.
a.
Reliabi lity Statistics
,600 ,601 2
Cronbach's
Alpha
Cronbach's
Alpha Based
on
Standardized
Items N of Items
Item Statistics
3,78 ,719 100
3,91 ,753 100
AKSES1
AKSES2
Mean Std. Dev iat ion N
Inter-Item Correlation Matrix
1,000 ,429
,429 1,000
AKSES1
AKSES2
AKSES1 AKSES2
The covariance matrix is calculated and used in the analysis.

80
6. SIKAP
Item-Total Statistics
3,91 ,568 ,429 ,184 .a
3,78 ,517 ,429 ,184 .aAKSES1
AKSES2
Scale Mean if
Item Deleted
Scale
Variance if
Item Deleted
Corrected
Item-Total
Correlation
Squared
Mult iple
Correlation
Cronbach's
Alpha if Item
Deleted
The value is negative due to a negativ e average cov ariance among items. This
v iolates reliability model assumpt ions. You may want to check item codings.
a.
Scale Statistics
7,69 1,549 1,245 2
Mean Variance Std. Deviation N of Items
Case Processing Summary
100 100,0
0 ,0
100 100,0
Valid
Excludeda
Total
Cases
N %
Listwise deletion based on all
variables in the procedure.
a.
Reliabi lity Statistics
,751 ,758 5
Cronbach's
Alpha
Cronbach's
Alpha Based
on
Standardized
Items N of Items
Item Statistics
3,90 ,644 100
4,06 ,547 100
3,92 ,614 100
3,87 ,677 100
4,23 ,723 100
SIKAP1
SIKAP2
SIKAP3
SIKAP4
SIKAP5
Mean Std. Dev iat ion N
81
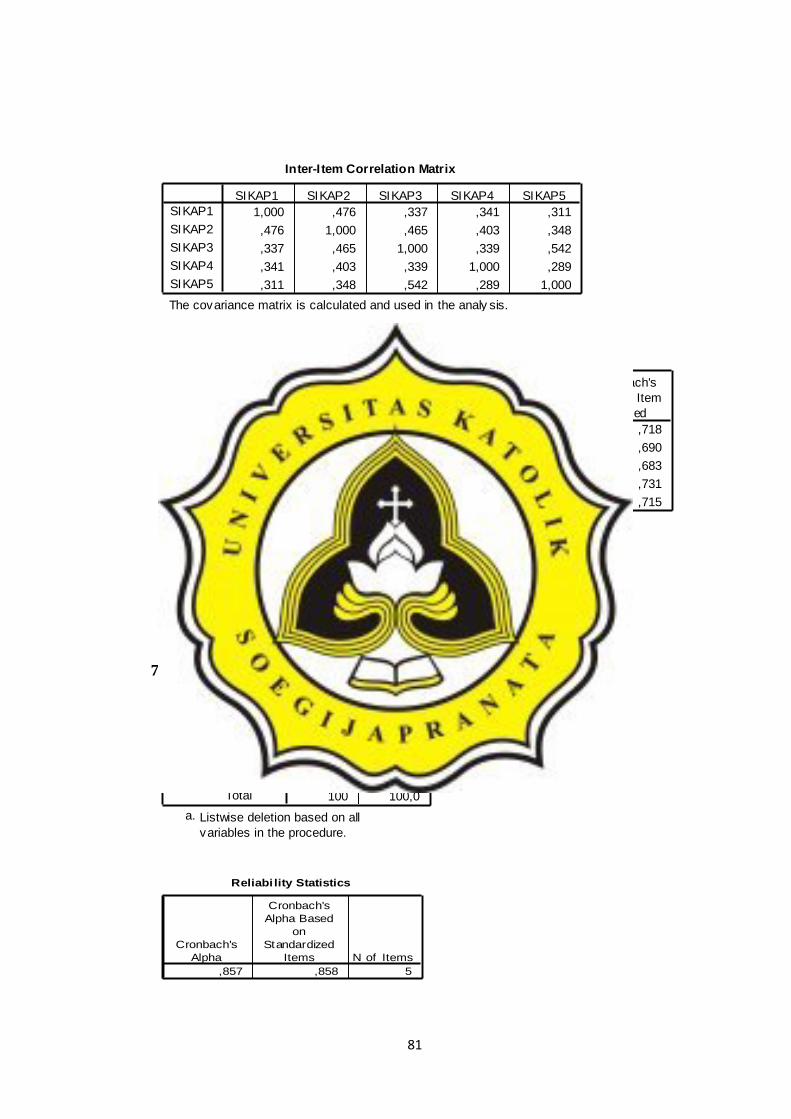
7. MINAT
Inter-I tem Correlation Matrix
1,000 ,476 ,337 ,341 ,311
,476 1,000 ,465 ,403 ,348
,337 ,465 1,000 ,339 ,542
,341 ,403 ,339 1,000 ,289
,311 ,348 ,542 ,289 1,000
SIKAP1
SIKAP2
SIKAP3
SIKAP4
SIKAP5
SIKAP1 SIKAP2 SIKAP3 SIKAP4 SIKAP5
The covariance matrix is calculated and used in the analy sis.
Item-Total Statistics
16,08 3,589 ,487 ,272 ,718
15,92 3,670 ,583 ,366 ,690
16,06 3,471 ,587 ,393 ,683
16,11 3,574 ,454 ,219 ,731
15,75 3,341 ,503 ,321 ,715
SIKAP1
SIKAP2
SIKAP3
SIKAP4
SIKAP5
Scale Mean if
Item Deleted
Scale
Variance if
Item Deleted
Corrected
Item-Total
Correlation
Squared
Mult iple
Correlation
Cronbach's
Alpha if Item
Deleted
Scale Statistics
19,98 5,192 2,278 5
Mean Variance Std. Deviation N of Items
Case Processing Summary
100 100,0
0 ,0
100 100,0
Valid
Excludeda
Total
Cases
N %
Listwise deletion based on all
variables in the procedure.
a.
Reliabi lity Statistics
,857 ,858 5
Cronbach's
Alpha
Cronbach's
Alpha Based
on
Standardized
Items N of Items

82
8. PERILAKU
Item Statistics
3,77 ,709 100
3,56 ,783 100
3,54 ,858 100
3,61 ,815 100
3,96 ,634 100
MINAT1
MINAT2
MINAT3
MINAT4
MINAT5
Mean Std. Dev iat ion N
Inter-Item Correlation Matrix
1,000 ,544 ,605 ,525 ,519
,544 1,000 ,613 ,536 ,493
,605 ,613 1,000 ,636 ,504
,525 ,536 ,636 1,000 ,497
,519 ,493 ,504 ,497 1,000
MINAT1
MINAT2
MINAT3
MINAT4
MINAT5
MINAT1 MINAT2 MINAT3 MINAT4 MINAT5
The covariance matrix is calculated and used in the analysis.
Item-Total Statistics
14,67 6,365 ,675 ,461 ,827
14,88 6,066 ,675 ,460 ,827
14,90 5,545 ,742 ,560 ,809
14,83 5,920 ,679 ,473 ,826
14,48 6,858 ,608 ,374 ,844
MINAT1
MINAT2
MINAT3
MINAT4
MINAT5
Scale Mean if
Item Deleted
Scale
Variance if
Item Deleted
Corrected
Item-Total
Correlation
Squared
Mult iple
Correlation
Cronbach's
Alpha if Item
Deleted
Scale Statistics
18,44 9,279 3,046 5
Mean Variance Std. Deviation N of Items
Case Processing Summary
100 100,0
0 ,0
100 100,0
Valid
Excludeda
Total
Cases
N %
Listwise deletion based on all
variables in the procedure.
a.
83
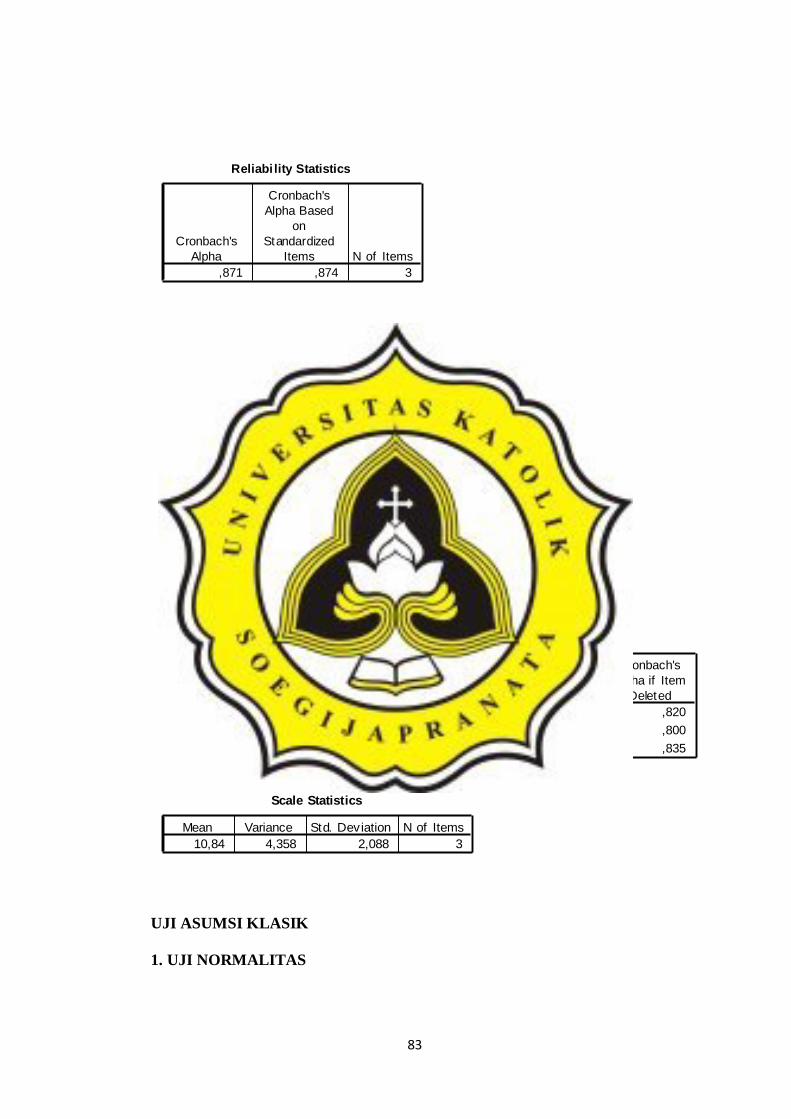
UJI ASUMSI KLASIK
1. UJI NORMALITAS
Reliabi lity Statistics
,871 ,874 3
Cronbach's
Alpha
Cronbach's
Alpha Based
on
Standardized
Items N of Items
Item Statistics
3,30 ,859 100
3,53 ,731 100
4,01 ,745 100
PERILAKU1
PERILAKU2
PERILAKU3
Mean Std. Dev iat ion N
Inter-Item Correlation Matrix
1,000 ,726 ,674
,726 1,000 ,695
,674 ,695 1,000
PERILAKU1
PERILAKU2
PERILAKU3
PERILAKU1 PERILAKU2 PERILAKU3
The covariance matrix is calculated and used in the analysis.
Item-Total Statistics
7,54 1,847 ,760 ,582 ,820
7,31 2,155 ,777 ,604 ,800
6,83 2,183 ,735 ,543 ,835
PERILAKU1
PERILAKU2
PERILAKU3
Scale Mean if
Item Deleted
Scale
Variance if
Item Deleted
Corrected
Item-Total
Correlation
Squared
Mult iple
Correlation
Cronbach's
Alpha if Item
Deleted
Scale Statistics
10,84 4,358 2,088 3
Mean Variance Std. Deviation N of Items

84
Variables Entered/Removedb
MINAT,
RISK,
PEOU,
AKSES,
AMAN, PU,
SIKAPa
. Enter
Model
1
Variables
Entered
Variables
Removed Method
All requested v ariables entered.a.
Dependent Variable: PERILAKUb.
Model Summaryb
,822a ,676 ,652 1,232
Model
1
R R Square
Adjusted
R Square
Std. Error of
the Estimate
Predictors: (Constant), MINAT, RISK, PEOU, AKSES,
AMAN, PU, SIKAP
a.
Dependent Variable: PERILAKUb.
ANOVAb
291,727 7 41,675 27,443 ,000a
139,713 92 1,519
431,440 99
Regression
Residual
Total
Model
1
Sum of
Squares df Mean Square F Sig.
Predictors: (Constant), MINAT, RISK, PEOU, AKSES, AMAN, PU, SIKAPa.
Dependent Variable: PERILAKUb.
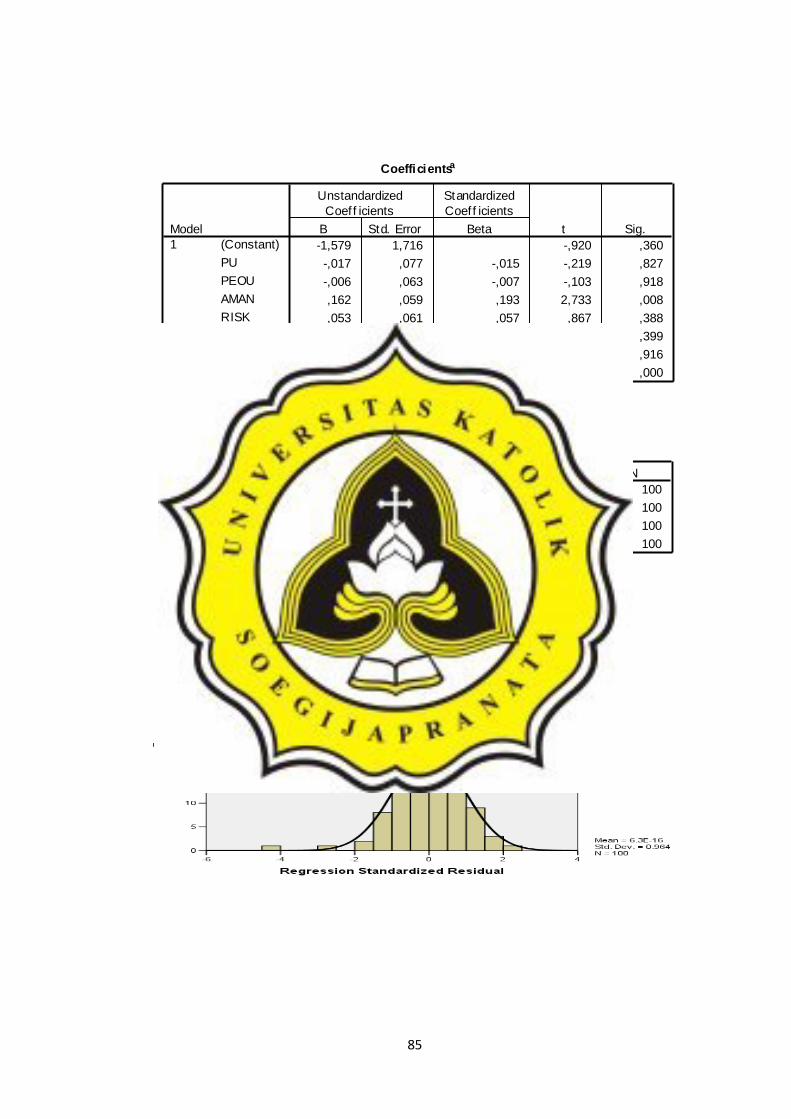
85
Coefficientsa
-1,579 1,716 -,920 ,360
-,017 ,077 -,015 -,219 ,827
-,006 ,063 -,007 -,103 ,918
,162 ,059 ,193 2,733 ,008
,053 ,061 ,057 ,867 ,388
,096 ,114 ,057 ,847 ,399
,007 ,071 ,008 ,105 ,916
,487 ,050 ,710 9,827 ,000
(Constant)
PU
PEOU
AMAN
RISK
AKSES
SIKAP
MINAT
Model
1
B Std. Error
Unstandardized
Coeff icients
Beta
Standardized
Coeff icients
t Sig.
Dependent Variable: PERILAKUa.
Residuals Statisticsa
6,56 14,58 10,84 1,717 100
-5,535 2,588 ,000 1,188 100
-2,495 2,177 ,000 1,000 100
-4,491 2,100 ,000 ,964 100
Predicted Value
Residual
Std. Predicted Value
Std. Residual
Minimum Maximum Mean Std. Dev iat ion N
Dependent Variable: PERILAKUa.

86
2. UJI HETEROSKEDASITAS
One-Sample Kolmogorov-Smirnov Test
100
,0000000
,96399841
,083
,053
-,083
,834
,490
N
Mean
Std. Dev iat ion
Normal Parametersa,b
Absolute
Positive
Negativ e
Most Extreme
Dif f erences
Kolmogorov-Smirnov Z
Asy mp. Sig. (2-tailed)
Standardized
Residual
Test distribution is Normal.a.
Calculated f rom data.b.
Variables Entered/Removedb
MINAT,
RISK,
PEOU,
AKSES,
AMAN, PU,
SIKAPa
. Enter
Model
1
Variables
Entered
Variables
Removed Method
All requested v ariables entered.a.
Dependent Variable: abs_resb.

87
Model Summaryb
,214a ,046 -,027 ,82151
Model
1
R R Square
Adjusted
R Square
Std. Error of
the Estimate
Predictors: (Constant), MINAT, RISK, PEOU, AKSES,
AMAN, PU, SIKAP
a.
Dependent Variable: abs_resb.
ANOVAb
2,969 7 ,424 ,628 ,731a
62,089 92 ,675
65,057 99
Regression
Residual
Total
Model
1
Sum of
Squares df Mean Square F Sig.
Predictors: (Constant), MINAT, RISK, PEOU, AKSES, AMAN, PU, SIKAPa.
Dependent Variable: abs_resb.
Coefficientsa
,915 1,144 ,800 ,426
-,052 ,052 -,121 -1,015 ,313
,008 ,042 ,022 ,188 ,851
-,019 ,040 -,058 -,480 ,632
-,005 ,040 -,013 -,114 ,909
,039 ,076 ,059 ,509 ,612
,076 ,047 ,215 1,620 ,109
-,033 ,033 -,123 -,995 ,323
(Constant)
PU
PEOU
AMAN
RISK
AKSES
SIKAP
MINAT
Model
1
B Std. Error
Unstandardized
Coeff icients
Beta
Standardized
Coeff icients
t Sig.
Dependent Variable: abs_resa.
Residuals Statisticsa
,4339 1,4606 ,8640 ,17317 100
-1,02510 4,42357 ,00000 ,79193 100
-2,484 3,445 ,000 1,000 100
-1,248 5,385 ,000 ,964 100
Predicted Value
Residual
Std. Predicted Value
Std. Residual
Minimum Maximum Mean Std. Dev iat ion N
Dependent Variable: abs_resa.
88
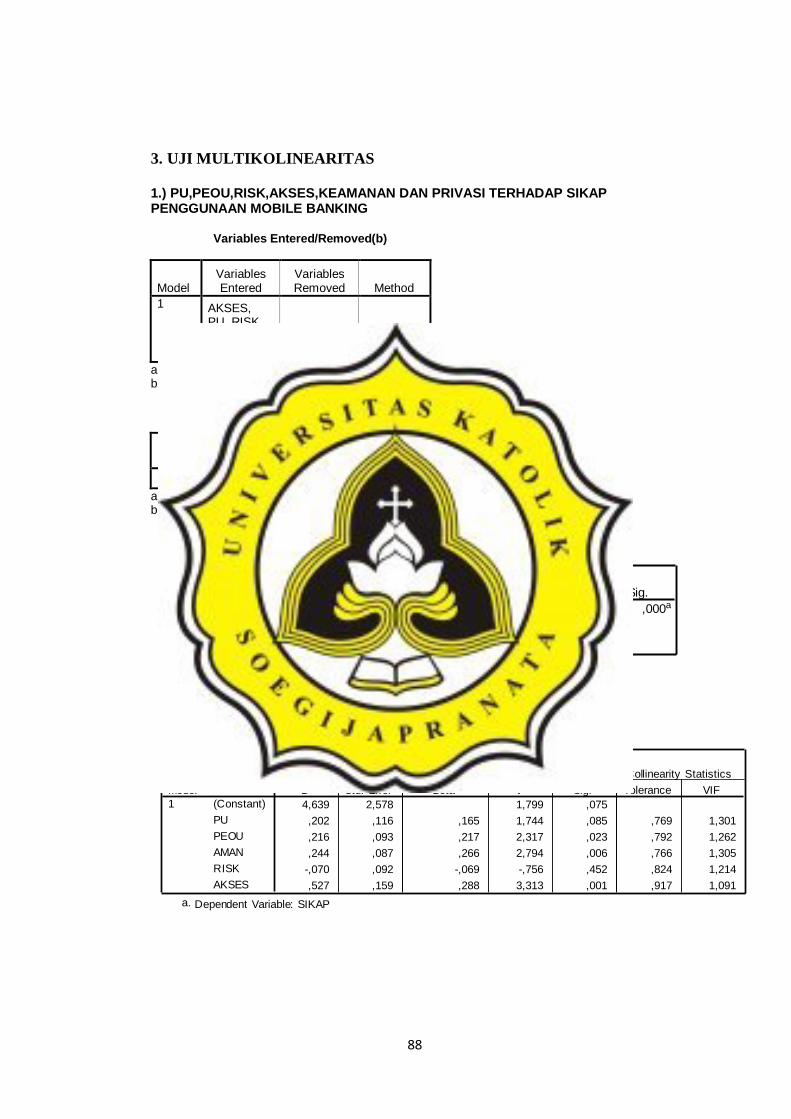
3. UJI MULTIKOLINEARITAS
1.) PU,PEOU,RISK,AKSES,KEAMANAN DAN PRIVASI TERHADAP SIKAP PENGGUNAAN MOBILE BANKING Variables Entered/Removed(b)
Model Variables Entered
Variables Removed Method
1 AKSES, PU, RISK, PEOU, AMAN(a)
. Enter
a All requested variables entered. b Dependent Variable: SIKAP Model Summary(b)
Model R R Square Adjusted R
Square Std. Error of the Estimate
1 ,591(a) ,350 ,315 1,886
a Predictors: (Constant), AKSES, PU, RISK, PEOU, AMAN b Dependent Variable: SIKAP
ANOVAb
179,689 5 35,938 10,106 ,000a
334,271 94 3,556
513,960 99
Regression
Residual
Total
Model
1
Sum of
Squares df Mean Square F Sig.
Predictors: (Constant), AKSES, PU, RISK, PEOU, AMANa.
Dependent Variable: SIKAPb.
Coefficientsa
4,639 2,578 1,799 ,075
,202 ,116 ,165 1,744 ,085 ,769 1,301
,216 ,093 ,217 2,317 ,023 ,792 1,262
,244 ,087 ,266 2,794 ,006 ,766 1,305
-,070 ,092 -,069 -,756 ,452 ,824 1,214
,527 ,159 ,288 3,313 ,001 ,917 1,091
(Constant)
PU
PEOU
AMAN
RISK
AKSES
Model
1
B Std. Error
Unstandardized
Coeff icients
Beta
Standardized
Coeff icients
t Sig. Tolerance VIF
Collinearity Statistics
Dependent Variable: SIKAPa.

89
2.) Sikap terhadap Minat Variables Entered/Removed(b)
Model Variables Entered
Variables Removed Method
1 SIKAP(a) . Enter
a All requested variables entered. b Dependent Variable: MINAT Model Summary(b)
Model R R Square Adjusted R
Square Std. Error of the Estimate
1 ,499(a) ,249 ,241 2,653
a Predictors: (Constant), SIKAP b Dependent Variable: MINAT
Coefficient Correlationsa
1,000 -,021 -,183 -,113 -,077
-,021 1,000 ,093 -,384 -,234
-,183 ,093 1,000 ,009 -,358
-,113 -,384 ,009 1,000 -,099
-,077 -,234 -,358 -,099 1,000
,025 ,000 -,003 -,002 -,001
,000 ,013 ,001 -,004 -,002
-,003 ,001 ,009 7,83E-005 -,003
-,002 -,004 7,83E-005 ,009 -,001
-,001 -,002 -,003 -,001 ,008
AKSES
PU
RISK
PEOU
AMAN
AKSES
PU
RISK
PEOU
AMAN
Correlations
Covariances
Model
1
AKSES PU RISK PEOU AMAN
Dependent Variable: SIKAPa.
Collinearity Diagnosticsa
5,928 1,000 ,00 ,00 ,00 ,00 ,00 ,00
,025 15,370 ,01 ,02 ,05 ,10 ,55 ,05
,021 16,759 ,00 ,02 ,02 ,25 ,07 ,64
,016 19,299 ,02 ,01 ,04 ,62 ,29 ,28
,006 30,323 ,16 ,20 ,89 ,00 ,02 ,00
,004 40,864 ,81 ,75 ,00 ,03 ,07 ,03
Dimension
1
2
3
4
5
6
Model
1
Eigenvalue
Condition
Index (Constant) PU PEOU AMAN RISK AKSES
Variance Proportions
Dependent Variable: SIKAPa.
90
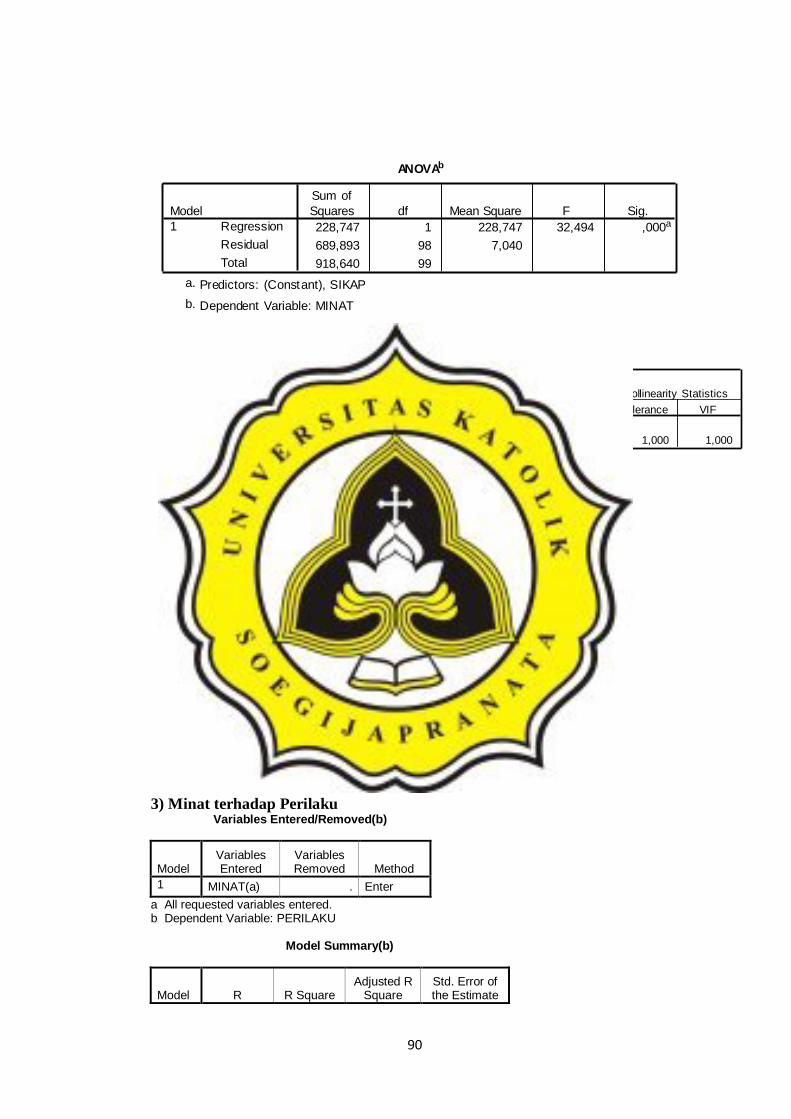
3) Minat terhadap Perilaku Variables Entered/Removed(b)
Model Variables Entered
Variables Removed Method
1 MINAT(a) . Enter
a All requested variables entered. b Dependent Variable: PERILAKU Model Summary(b)
Model R R Square Adjusted R
Square Std. Error of the Estimate
ANOVAb
228,747 1 228,747 32,494 ,000a
689,893 98 7,040
918,640 99
Regression
Residual
Total
Model
1
Sum of
Squares df Mean Square F Sig.
Predictors: (Constant), SIKAPa.
Dependent Variable: MINATb.
Coefficientsa
5,111 2,353 2,172 ,032
,667 ,117 ,499 5,700 ,000 1,000 1,000
(Constant)
SIKAP
Model
1
B Std. Error
Unstandardized
Coeff icients
Beta
Standardized
Coeff icients
t Sig. Tolerance VIF
Collinearity Statistics
Dependent Variable: MINATa.
Coefficient Correlationsa
1,000
,014
SIKAP
SIKAP
Correlations
Covariances
Model
1
SIKAP
Dependent Variable: MINATa.
Collinearity Diagnosticsa
1,994 1,000 ,00 ,00
,006 17,683 1,00 1,00
Dimension
1
2
Model
1
Eigenvalue
Condit ion
Index (Constant) SIKAP
Variance Proportions
Dependent Variable: MINATa.
91
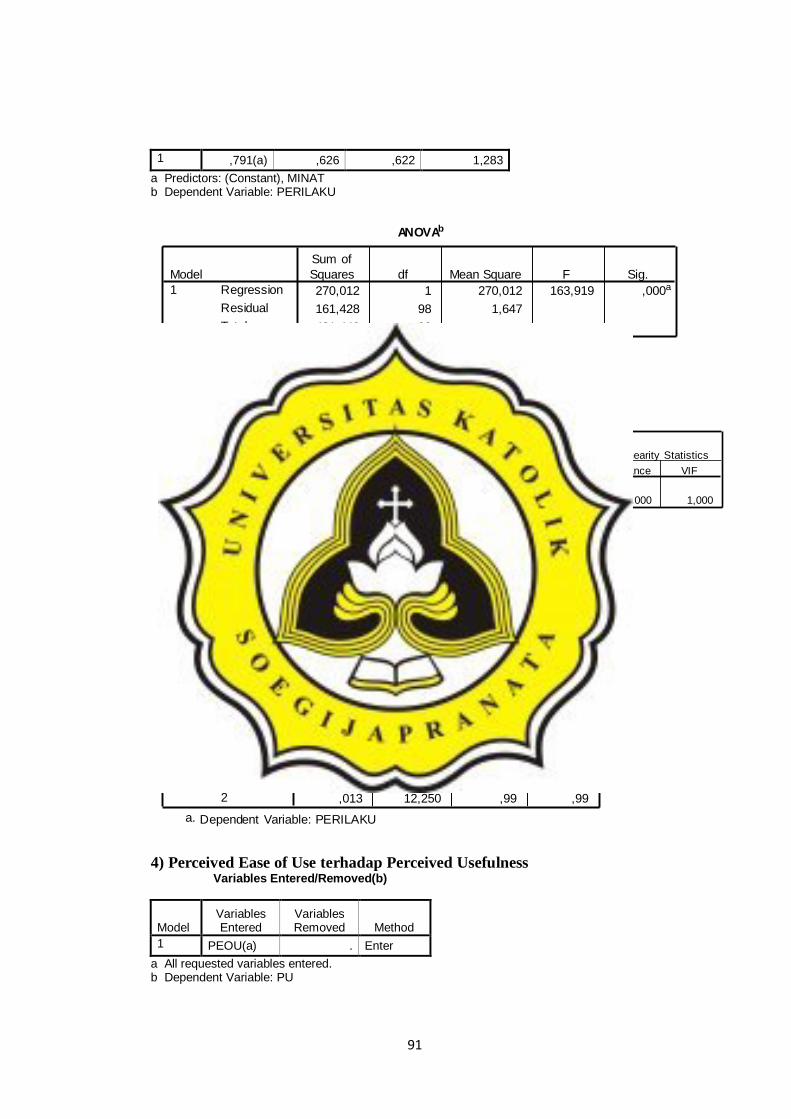
1 ,791(a) ,626 ,622 1,283
a Predictors: (Constant), MINAT b Dependent Variable: PERILAKU
4) Perceived Ease of Use terhadap Perceived Usefulness Variables Entered/Removed(b)
Model Variables Entered
Variables Removed Method
1 PEOU(a) . Enter
a All requested variables entered. b Dependent Variable: PU
ANOVAb
270,012 1 270,012 163,919 ,000a
161,428 98 1,647
431,440 99
Regression
Residual
Total
Model
1
Sum of
Squares df Mean Square F Sig.
Predictors: (Constant), MINATa.
Dependent Variable: PERILAKUb.
Coefficientsa
,843 ,791 1,065 ,289
,542 ,042 ,791 12,803 ,000 1,000 1,000
(Constant)
MINAT
Model
1
B Std. Error
Unstandardized
Coeff icients
Beta
Standardized
Coeff icients
t Sig. Tolerance VIF
Collinearity Statistics
Dependent Variable: PERILAKUa.
Coefficient Correlationsa
1,000
,002
MINAT
MINAT
Correlations
Covariances
Model
1
MINAT
Dependent Variable: PERILAKUa.
Collinearity Diagnosticsa
1,987 1,000 ,01 ,01
,013 12,250 ,99 ,99
Dimension
1
2
Model
1
Eigenvalue
Condit ion
Index (Constant) MINAT
Variance Proportions
Dependent Variable: PERILAKUa.
92
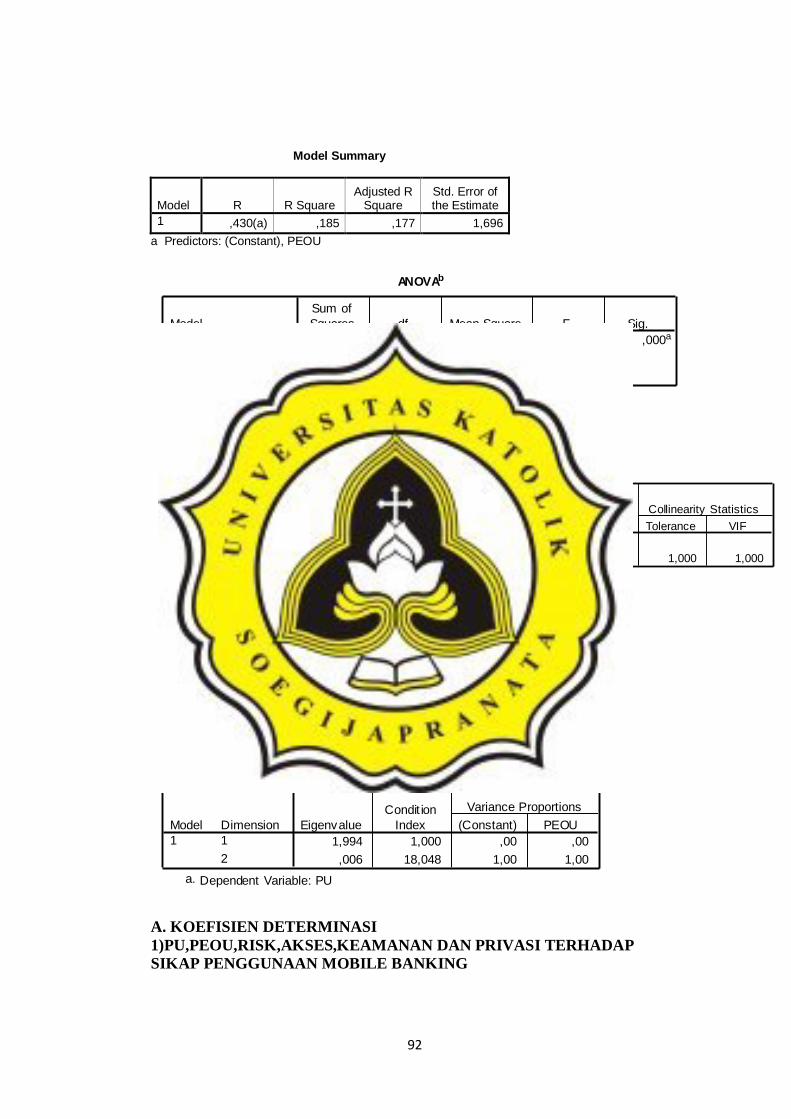
Model Summary
Model R R Square Adjusted R
Square Std. Error of the Estimate
1 ,430(a) ,185 ,177 1,696
a Predictors: (Constant), PEOU
A. KOEFISIEN DETERMINASI
1)PU,PEOU,RISK,AKSES,KEAMANAN DAN PRIVASI TERHADAP
SIKAP PENGGUNAAN MOBILE BANKING
ANOVAb
64,136 1 64,136 22,284 ,000a
282,054 98 2,878
346,190 99
Regression
Residual
Total
Model
1
Sum of
Squares df Mean Square F Sig.
Predictors: (Constant), PEOUa.
Dependent Variable: PUb.
Coefficientsa
13,706 1,536 8,925 ,000
,352 ,075 ,430 4,721 ,000 1,000 1,000
(Constant)
PEOU
Model
1
B Std. Error
Unstandardized
Coeff icients
Beta
Standardized
Coeff icients
t Sig. Tolerance VIF
Collinearity Statistics
Dependent Variable: PUa.
Coefficient Correlationsa
1,000
,006
PEOU
PEOU
Correlations
Covariances
Model
1
PEOU
Dependent Variable: PUa.
Collinearity Diagnosticsa
1,994 1,000 ,00 ,00
,006 18,048 1,00 1,00
Dimension
1
2
Model
1
Eigenvalue
Condit ion
Index (Constant) PEOU
Variance Proportions
Dependent Variable: PUa.

93
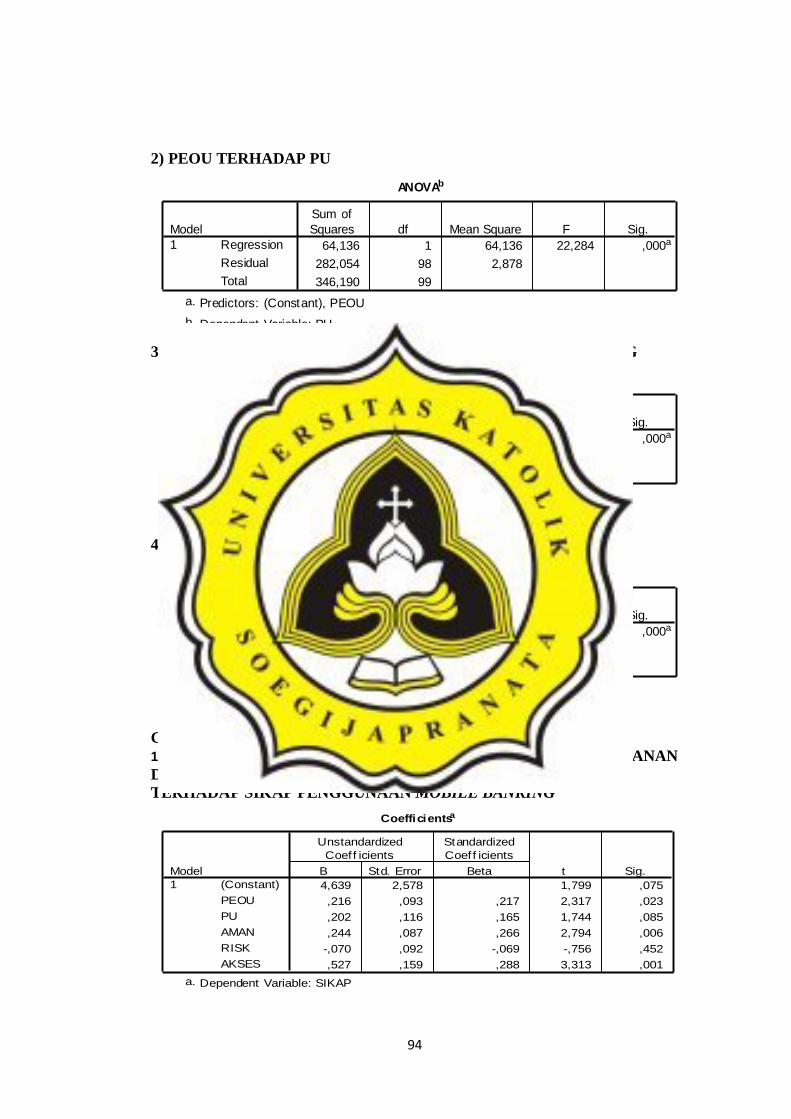
2) PEOU TERHADAP PU
3) SIKAP TERHADAP MINAT PENGGUNAAN MOBILE BANKING
4) MINAT TERHADAP PENGGUNAAN MOBILE BANKING
B. MODEL FIT
1)PU,PEOU,RISK,AKSES,KEAMANAN DAN PRIVASI TERHADAP
SIKAP PENGGUNAAN MOBILE BANKING
Model Summary
,591a ,350 ,315 1,886
Model
1
R R Square
Adjusted
R Square
Std. Error of
the Est imate
Predictors: (Constant), AKSES, PU, RISK, PEOU, AMANa.
Model Summary
,430a ,185 ,177 1,696
Model
1
R R Square
Adjusted
R Square
Std. Error of
the Estimate
Predictors: (Constant), PEOUa.
Model Summary
,499a ,249 ,241 2,653
Model
1
R R Square
Adjusted
R Square
Std. Error of
the Estimate
Predictors: (Constant), SIKAPa.
Model Summary
,791a ,626 ,622 1,283
Model
1
R R Square
Adjusted
R Square
Std. Error of
the Estimate
Predictors: (Constant), MINATa.
ANOVAb
179,689 5 35,938 10,106 ,000a
334,271 94 3,556
513,960 99
Regression
Residual
Total
Model
1
Sum of
Squares df Mean Square F Sig.
Predictors: (Constant), AKSES, PU, RISK, PEOU, AMANa.
Dependent Variable: SIKAPb.
94
2) PEOU TERHADAP PU
3) SIKAP TERHADAP MINAT PENGGUNAAN MOBILE BANKING
4) MINAT TERHADAP PENGGUNAAN MOBILE BANKING
C. UJI HIPOTESIS
1.) PERCEIVED USEFULNESS, PERCEIVED EASE OF USE, KEAMANAN
DAN PRIVASI, PERSEPSI RISIKO, DAN KEMAMPUAN AKSES
TERHADAP SIKAP PENGGUNAAN MOBILE BANKING
ANOVAb
64,136 1 64,136 22,284 ,000a
282,054 98 2,878
346,190 99
Regression
Residual
Total
Model
1
Sum of
Squares df Mean Square F Sig.
Predictors: (Constant), PEOUa.
Dependent Variable: PUb.
ANOVAb
228,747 1 228,747 32,494 ,000a
689,893 98 7,040
918,640 99
Regression
Residual
Total
Model
1
Sum of
Squares df Mean Square F Sig.
Predictors: (Constant), SIKAPa.
Dependent Variable: MINATb.
ANOVAb
270,012 1 270,012 163,919 ,000a
161,428 98 1,647
431,440 99
Regression
Residual
Total
Model
1
Sum of
Squares df Mean Square F Sig.
Predictors: (Constant), MINATa.
Dependent Variable: PERILAKUb.
Coefficientsa
4,639 2,578 1,799 ,075
,216 ,093 ,217 2,317 ,023
,202 ,116 ,165 1,744 ,085
,244 ,087 ,266 2,794 ,006
-,070 ,092 -,069 -,756 ,452
,527 ,159 ,288 3,313 ,001
(Constant)
PEOU
PU
AMAN
RISK
AKSES
Model
1
B Std. Error
Unstandardized
Coeff icients
Beta
Standardized
Coeff icients
t Sig.
Dependent Variable: SIKAPa.

95
2.) PERCEIVED EASE OF USE TERHADAP PERCEIVED USEFULNESS
3.) SIKAP TERHADAP MINAT PENGGUNAAN MOBILE BANKING
4. MINAT TERHADAP PERILAKU PENGGUNAAN MOBILE BANKING
Coefficientsa
13,706 1,536 8,925 ,000
,352 ,075 ,430 4,721 ,000
(Constant)
PEOU
Model
1
B Std. Error
Unstandardized
Coeff icients
Beta
Standardized
Coeff icients
t Sig.
Dependent Variable: PUa.
Coefficientsa
5,111 2,353 2,172 ,032
,667 ,117 ,499 5,700 ,000
(Constant)
SIKAP
Model
1
B Std. Error
Unstandardized
Coeff icients
Beta
Standardized
Coeff icients
t Sig.
Dependent Variable: MINATa.
Coefficientsa
,843 ,791 1,065 ,289
,542 ,042 ,791 12,803 ,000
(Constant)
MINAT
Model
1
B Std. Error
Unstandardized
Coeff icients
Beta
Standardized
Coeff icients
t Sig.
Dependent Variable: PERILAKUa.