endline monitoring report, volume 2: …prioritaspendidikan.org/file/usaid_prioritas_vol_2...smp...
TRANSCRIPT
USAID Prioritizing Reform, Innovation, and Opportunities for Reaching Indonesia’s Teachers, Administrators, and Students (USAID PRIORITAS)
ENDLINE MONITORING REPORT, VOLUME 2: Assessing the Impact of the USAID PRIORITAS Program on Student Performance in Bahasa Indonesia, Mathematics, and Science
June 2017 This publication was produced for review by the United States Agency for International Development. It was prepared by RTI International.
USAID Prioritizing Reform, Innovation, and Opportunities for Reaching Indonesia’s Teachers, Administrators, and Students (USAID PRIORITAS)
ENDLINE MONITORING REPORT, VOLUME 2: Assessing the Impact of the USAID PRIORITAS Program on Student Performance in Bahasa Indonesia, Mathematics, and Science Contract AID-497-C-12-00003 Prepared for USAID/Indonesia Prepared by
RTI International* 3040 Cornwallis Road Post Office Box 12194 Research Triangle Park, NC 27709-2194
*RTI International is a trade name of Research Triangle Institute.
The authors’ views expressed in this publication do not necessarily reflect the views of the United States Agency for International Development or the United States Government.
Assessing the Impact of the USAID PRIORITAS Program on Student Performance iii
TABLE OF CONTENTS LIST OF TABLES ................................................................................................................... IV
LIST OF FIGURES .................................................................................................................. V
LIST OF ACRONYMS, ABBREVIATIONS, AND TERMS ................................................ VI
BACKGROUND ....................................................................................................................... 1 THE USAID PRIORITAS PROGRAM .................................................................................................................... 1 PROJECT MONITORING AND EVALUATION ......................................................................................................... 2 ASSESSMENT PROGRAM OUTLINE ......................................................................................................................... 3 PRESENTATION OF THE TEST RESULTS ................................................................................................................. 5
1 OVERVIEW AND SUMMARY OF THE TEST RESULTS ........................................... 7 1.1 TEST IMPLEMENTATION ...................................................................................................................... 7 1.2 HOW THE RESULTS ARE PRESENTED ................................................................................................ 8 1.3 SUMMARY OF RESULTS IN PRIMARY SCHOOLS (SD AND MI) ........................................................ 9 1.4 SUMMARY OF RESULTS IN JUNIOR SECONDARY SCHOOLS (SMPS AND MTS) ......................... 12 1.5 HOW USAID PRIORITAS HAS ADDRESSED THE ISSUES ............................................................ 14
2 ASSESSMENT OF STUDENTS IN PRIMARY SCHOOLS ........................................ 17 2.2 BAHASA INDONESIA GRADE 4 ......................................................................................................... 17
2.2.1 Introduction ........................................................................................................................................................ 17 2.2.2 Reading ............................................................................................................................................................... 18 2.2.3 Writing ................................................................................................................................................................ 21
2.3 MATHEMATICS TEST GRADE 4 ......................................................................................................... 24 2.3.1 Introduction ........................................................................................................................................................ 24 2.3.2 The Results ........................................................................................................................................................ 25
2.4 SCIENCE TEST GRADE 5 .................................................................................................................... 27 2.4.1 Introduction ........................................................................................................................................................ 27 2.4.2 The Results ........................................................................................................................................................ 28
3 ASSESSMENT OF STUDENTS IN JUNIOR SECONDARY SCHOOLS ................. 32 3.2 BAHASA INDONESIA GRADE 8 ......................................................................................................... 32
3.2.1 Introduction ........................................................................................................................................................ 32 3.2.2 The Results of Reading Test ......................................................................................................................... 33 3.2.3 Writing ................................................................................................................................................................ 35
3.3 MATHEMATICS TEST GRADE 8 ......................................................................................................... 39 3.3.1 Introduction ........................................................................................................................................................ 39 3.3.2 The Results ........................................................................................................................................................ 40
3.4 SCIENCE TEST GRADE 8 .................................................................................................................... 43 3.4.1 Introduction ........................................................................................................................................................ 43 3.4.2 The Results ........................................................................................................................................................ 43
ANNEX 1: AVERAGE TEST SCORES BY SCHOOL AND DISTRICT ........................... 47
ANNEX 2: COMPARISON BETWEEN USAID PRIORITAS AND PREVIOUS PROJECTS ON THESE TESTS ............................................................................................ 77
ANNEX 3: CRITERIA FOR MARKING THE GRADE 4 WRITING TEST ....................... 83
ANNEX 4: SUMMARY OF THE TESTS AND THEIR DEVELOPMENT ......................... 84
iv Assessing the Impact of the USAID PRIORITAS Program on Student Performance
LIST OF TABLES Table 1: Number of Partner Schools in 50 Districts .......................................................................................... 1
Table 2: Overview of Monitoring Rounds for Cohort 1, 2, and 3 Partner District Schools .................... 2
Table 3: School Grade Levels and Subjects Assessed, by School Type ......................................................... 4
Table 4: Implementation Times for Student Testing in Three Cohorts ........................................................ 5
Table 5: Total Number of Sampled Primary Schools Participating in Student Assessment ...................... 7
Table 6: Total Number of Sampled Junior Secondary Schools Participating in Student Assessment..... 8
Table 7: Total Number of Primary School Students Taking the Tests .......................................................... 9
Table 8: Summary of Grade 4 Reading Test Results in Primary Schools ...................................................... 9
Table 9: Summary of Grade 4 Writing Test Results in Primary Schools .................................................... 10
Table 10: Summary of Grade 4 Mathematics Test Results in Primary Schools ......................................... 10
Table 11: Summary of Grade 5 Science Test Results in Primary Schools .................................................. 11
Table 12: Summary of Reading Test Results in Junior Secondary Schools ................................................. 12
Table 13: Summary of Writing Test Results in Junior Secondary Schools ................................................. 12
Table 14: Summary of Mathematics Test Results in Junior Secondary Schools ........................................ 13
Table 15: Summary of Science Test Results in Junior Secondary Schools .................................................. 13
Table 16: Total Number of Sampled Primary Schools Participating in Student Assessment ................. 17
Table 17: Number of Primary School Students Tested in Reading and Writing, by Background Variables ...................................................................................................................................................................... 17
Table 18: Average Reading Scores of Grade 4 Students, by Background Variables ................................. 19
Table 19: Average Scores of Grade 4 Reading Test, by Section ................................................................... 20
Table 20: Average Scores of Grade 4 Students’ Writing Test, by Background Variables....................... 22
Table 21: Percentage Scores for Elements of Written Work in Grade 4 Writing Test ......................... 22
Table 22: Number of Grade 4 Students Tested in Mathematics, by Background Variables ................... 24
Table 23: Average Scores of Grade 4 Students’ Mathematics Test, by Background Variables .............. 25
Table 24: Percentage Scores for Correct Answers of Grade 4 Mathematics Test .................................. 27
Table 25: Number of Grade 5 Students Tested in Science, by Background Variables ............................ 28
Table 26: Average Scores of Grade 5 Students’ Science Test, by Background Variables ....................... 29
Table 27: Average Scores of Grade 5 Science Test, by Section .................................................................... 30
Table 28: Most Difficult Science Test Questions for Grade 5 Students to Answer ................................ 31
Table 29: Average Scores of 20 Grade 5 Science Test Questions ............................................................... 31
Table 30: Total Number of Sampled Junior Secondary Schools Participating in Student Assessment 32
Table 31: Number of Grade 8 Students Tested in Reading and Writing, by Background Variables .... 33
Table 32: Average Scores of Grade 8 Students’ Reading Test, by Background Variables ...................... 34
Table 33: Average Scores of Three Sections of Grade 8 Reading Test ...................................................... 34
Table 34: Average Scores of Grade 8 Students’ Writing Test, by Background Variables....................... 36
Table 35: Percentage Scores for Elements of Written Work of Grade 8 Writing Test ......................... 37
Table 36: Number of Grade 8 Students Taking Mathematics Test .............................................................. 40
Table 37: Average Scores of Grade 8 Students’ Mathematics Test, by Background Variables .............. 41
Assessing the Impact of the USAID PRIORITAS Program on Student Performance v
Table 38: Most Difficult Mathematics Test Questions for Grade 8 Students to Answer ....................... 42
Table 39: Analysis of Grade 8 Mathematics Test Scores, by Question ....................................................... 42
Table 40: Number of Grade 8 Students Taking Science Test ........................................................................ 43
Table 41: Average Scores of Grade 8 Students’ Science Test, by Background Variables ....................... 44
Table 42: Average Scores of Grade 8 Science Test, by Section .................................................................... 45
Table 43: Most Difficult Science Test Questions for Grade 8 Students to Answer ................................ 46
Table 44: Analysis of Grade 8 Science Test Scores, by Question ................................................................ 46
LIST OF FIGURES Figure 1: Average Scores of Grade 4 Reading Test, by Cohort and Treatment Group ......................... 18
Figure 2: Average Scores of Reading Comprehension Test, by Quartile ................................................... 20
Figure 3: Average Scores of Grade 4 Writing Test, by Cohort and Treatment Group ......................... 21
Figure 4: Average Scores of Grade 4 Writing Test, by Quartile .................................................................. 24
Figure 5: Average Scores of Grade 4 Mathematics Test, by Cohort and Treatment Group ................ 25
Figure 6: Average Scores of Grade 4 Mathematics Test, by Quartile ......................................................... 26
Figure 7: Average Scores of Grade 5 Science Test, by Cohort and Treatment Group .......................... 28
Figure 8: Average Scores of Grade 5 Science Test, by Quartile ................................................................... 30
Figure 9: Average Scores of Grade 8 Reading Test, by Cohort and Treatment Group ......................... 33
Figure 10: Average Scores of Grade 8 Reading Test, by Quartile ................................................................ 35
Figure 11: Average Scores of Grade 8 Writing Test, by Cohort and Treatment Group ....................... 36
Figure 12: Average Scores of Grade 8 Writing Test, by Quartile ................................................................ 39
Figure 13: Average Scores of Grade 8 Mathematics Test, by Cohort and Treatment Group .............. 40
Figure 14: Average Scores of Grade 8 Mathematics Test, by Quartile ....................................................... 41
Figure 15: Average Scores of Grade 8 Science Test, by Cohort and Treatment Group ........................ 44
Figure 16: Average Scores of Grade 8 Science Test, by Quartile ................................................................. 45
vi Assessing the Impact of the USAID PRIORITAS Program on Student Performance
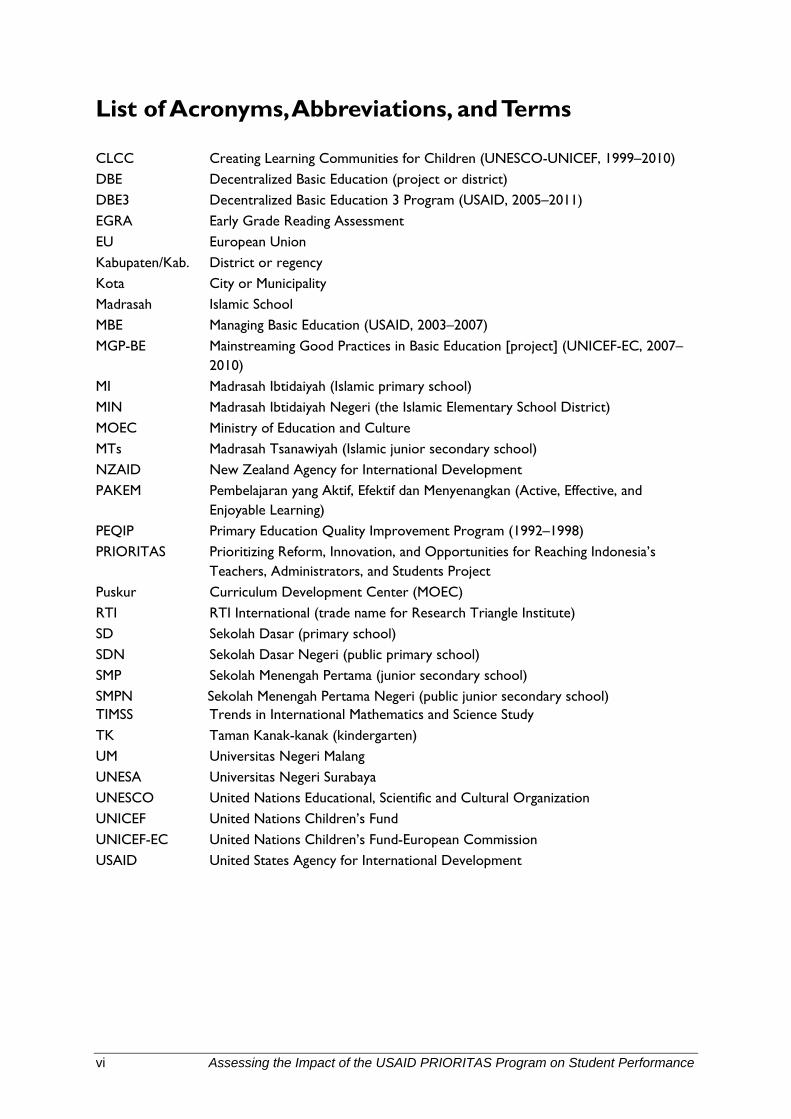
List of Acronyms, Abbreviations, and Terms CLCC Creating Learning Communities for Children (UNESCO-UNICEF, 1999–2010) DBE Decentralized Basic Education (project or district) DBE3 Decentralized Basic Education 3 Program (USAID, 2005–2011) EGRA Early Grade Reading Assessment EU European Union Kabupaten/Kab. District or regency Kota City or Municipality Madrasah Islamic School MBE Managing Basic Education (USAID, 2003–2007) MGP-BE Mainstreaming Good Practices in Basic Education [project] (UNICEF-EC, 2007–
2010) MI Madrasah Ibtidaiyah (Islamic primary school) MIN Madrasah Ibtidaiyah Negeri (the Islamic Elementary School District) MOEC Ministry of Education and Culture MTs Madrasah Tsanawiyah (Islamic junior secondary school) NZAID New Zealand Agency for International Development PAKEM Pembelajaran yang Aktif, Efektif dan Menyenangkan (Active, Effective, and
Enjoyable Learning) PEQIP Primary Education Quality Improvement Program (1992–1998) PRIORITAS Prioritizing Reform, Innovation, and Opportunities for Reaching Indonesia’s
Teachers, Administrators, and Students Project Puskur Curriculum Development Center (MOEC) RTI RTI International (trade name for Research Triangle Institute) SD Sekolah Dasar (primary school) SDN Sekolah Dasar Negeri (public primary school) SMP Sekolah Menengah Pertama (junior secondary school) SMPN Sekolah Menengah Pertama Negeri (public junior secondary school) TIMSS Trends in International Mathematics and Science Study TK Taman Kanak-kanak (kindergarten) UM Universitas Negeri Malang UNESA Universitas Negeri Surabaya UNESCO United Nations Educational, Scientific and Cultural Organization UNICEF United Nations Children’s Fund UNICEF-EC United Nations Children’s Fund-European Commission USAID United States Agency for International Development
Assessing the Impact of the USAID PRIORITAS Program on Student Performance 1
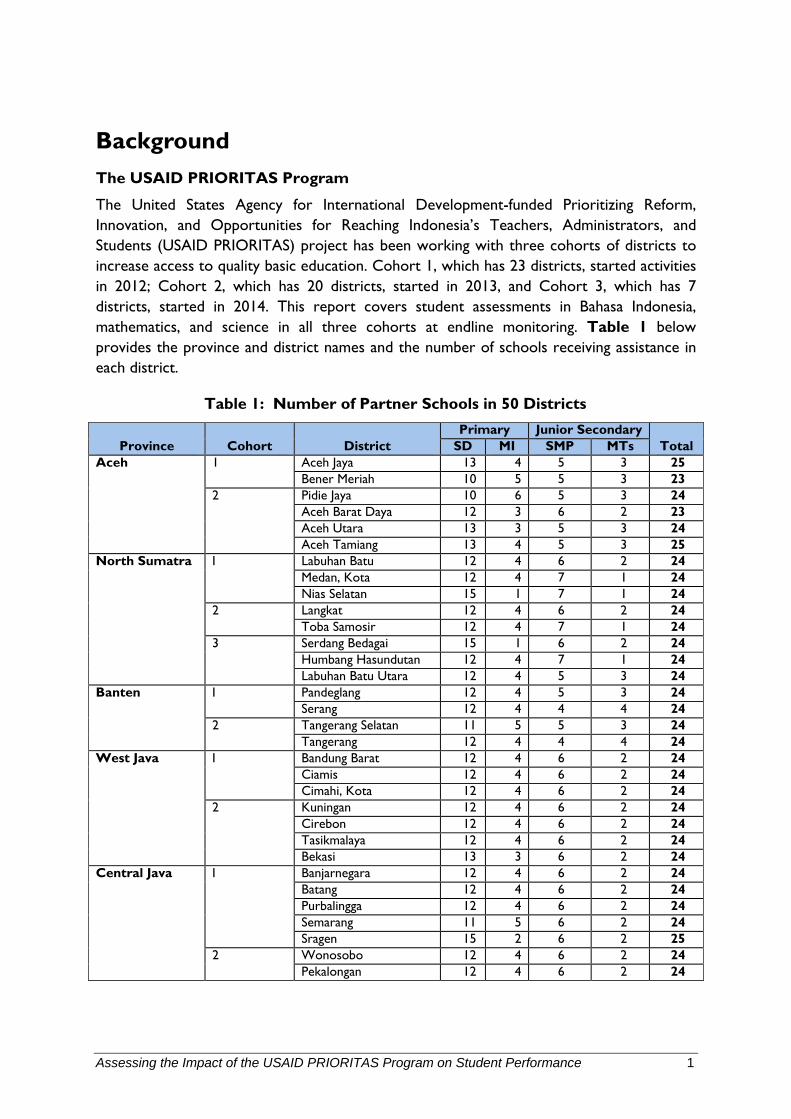
Background The USAID PRIORITAS Program
The United States Agency for International Development-funded Prioritizing Reform, Innovation, and Opportunities for Reaching Indonesia’s Teachers, Administrators, and Students (USAID PRIORITAS) project has been working with three cohorts of districts to increase access to quality basic education. Cohort 1, which has 23 districts, started activities in 2012; Cohort 2, which has 20 districts, started in 2013, and Cohort 3, which has 7 districts, started in 2014. This report covers student assessments in Bahasa Indonesia, mathematics, and science in all three cohorts at endline monitoring. Table 1 below provides the province and district names and the number of schools receiving assistance in each district.
Table 1: Number of Partner Schools in 50 Districts
Province Cohort District Primary Junior Secondary
Total SD MI SMP MTs Aceh 1 Aceh Jaya 13 4 5 3 25
Bener Meriah 10 5 5 3 23 2 Pidie Jaya 10 6 5 3 24
Aceh Barat Daya 12 3 6 2 23 Aceh Utara 13 3 5 3 24 Aceh Tamiang 13 4 5 3 25
North Sumatra I Labuhan Batu 12 4 6 2 24 Medan, Kota 12 4 7 1 24 Nias Selatan 15 1 7 1 24
2 Langkat 12 4 6 2 24 Toba Samosir 12 4 7 1 24
3 Serdang Bedagai 15 1 6 2 24 Humbang Hasundutan 12 4 7 1 24 Labuhan Batu Utara 12 4 5 3 24
Banten I Pandeglang 12 4 5 3 24 Serang 12 4 4 4 24
2 Tangerang Selatan 11 5 5 3 24 Tangerang 12 4 4 4 24
West Java I Bandung Barat 12 4 6 2 24 Ciamis 12 4 6 2 24 Cimahi, Kota 12 4 6 2 24
2 Kuningan 12 4 6 2 24 Cirebon 12 4 6 2 24 Tasikmalaya 12 4 6 2 24 Bekasi 13 3 6 2 24
Central Java I Banjarnegara 12 4 6 2 24 Batang 12 4 6 2 24 Purbalingga 12 4 6 2 24 Semarang 11 5 6 2 24 Sragen 15 2 6 2 25
2 Wonosobo 12 4 6 2 24 Pekalongan 12 4 6 2 24
2 Assessing the Impact of the USAID PRIORITAS Program on Student Performance
Province Cohort District Primary Junior Secondary
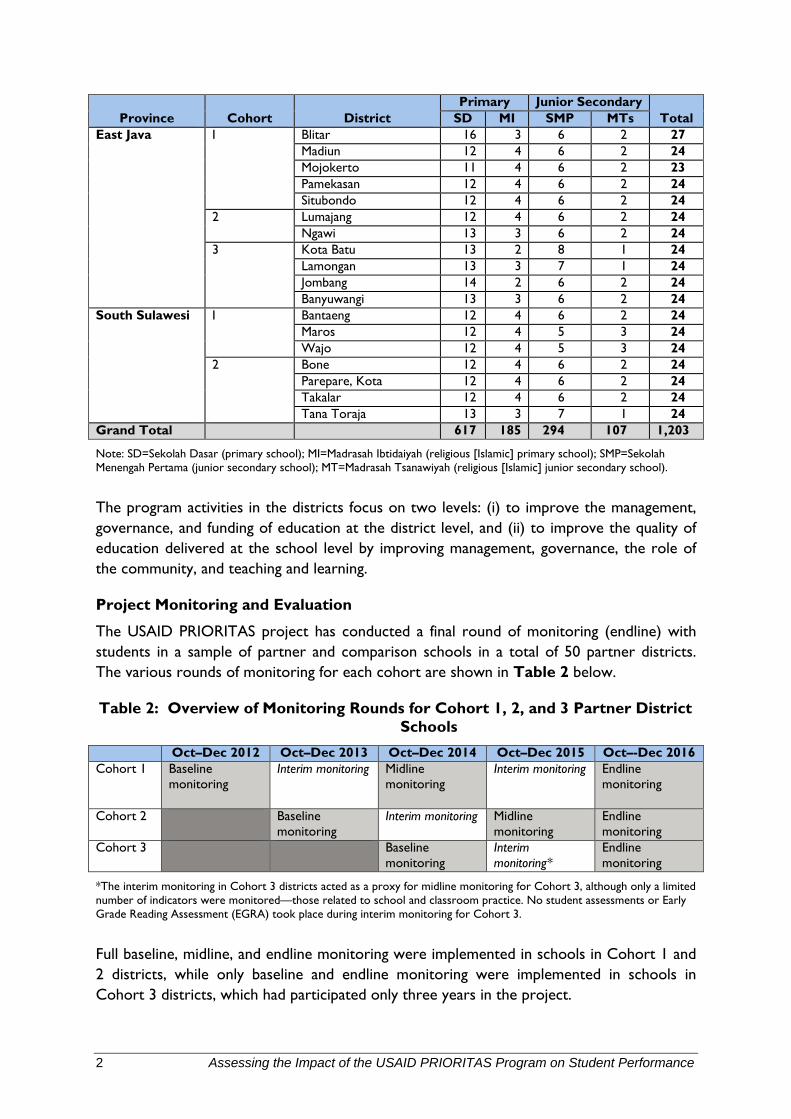
Total SD MI SMP MTs East Java I Blitar 16 3 6 2 27
Madiun 12 4 6 2 24 Mojokerto 11 4 6 2 23 Pamekasan 12 4 6 2 24 Situbondo 12 4 6 2 24
2 Lumajang 12 4 6 2 24 Ngawi 13 3 6 2 24
3 Kota Batu 13 2 8 1 24 Lamongan 13 3 7 1 24 Jombang 14 2 6 2 24 Banyuwangi 13 3 6 2 24
South Sulawesi I Bantaeng 12 4 6 2 24 Maros 12 4 5 3 24 Wajo 12 4 5 3 24
2 Bone 12 4 6 2 24 Parepare, Kota 12 4 6 2 24 Takalar 12 4 6 2 24 Tana Toraja 13 3 7 1 24
Grand Total 617 185 294 107 1,203
Note: SD=Sekolah Dasar (primary school); MI=Madrasah Ibtidaiyah (religious [Islamic] primary school); SMP=Sekolah Menengah Pertama (junior secondary school); MT=Madrasah Tsanawiyah (religious [Islamic] junior secondary school).
The program activities in the districts focus on two levels: (i) to improve the management, governance, and funding of education at the district level, and (ii) to improve the quality of education delivered at the school level by improving management, governance, the role of the community, and teaching and learning.
Project Monitoring and Evaluation
The USAID PRIORITAS project has conducted a final round of monitoring (endline) with students in a sample of partner and comparison schools in a total of 50 partner districts. The various rounds of monitoring for each cohort are shown in Table 2 below.
Table 2: Overview of Monitoring Rounds for Cohort 1, 2, and 3 Partner District Schools
Oct–Dec 2012 Oct–Dec 2013 Oct–Dec 2014 Oct–Dec 2015 Oct–-Dec 2016 Cohort 1 Baseline
monitoring Interim monitoring Midline
monitoring Interim monitoring Endline
monitoring
Cohort 2 Baseline monitoring
Interim monitoring Midline monitoring
Endline monitoring
Cohort 3 Baseline monitoring
Interim monitoring*
Endline monitoring
*The interim monitoring in Cohort 3 districts acted as a proxy for midline monitoring for Cohort 3, although only a limited number of indicators were monitored—those related to school and classroom practice. No student assessments or Early Grade Reading Assessment (EGRA) took place during interim monitoring for Cohort 3.
Full baseline, midline, and endline monitoring were implemented in schools in Cohort 1 and 2 districts, while only baseline and endline monitoring were implemented in schools in Cohort 3 districts, which had participated only three years in the project.
Assessing the Impact of the USAID PRIORITAS Program on Student Performance 3
Each of these baseline, midline, and endline rounds of monitoring (shaded in light gray in Table 2) included school and classroom observations and interviews; student assessments in Bahasa Indonesia, mathematics, and science; and an Early Grade Reading Assessment (EGRA) for grade 3 students.
In the years between these rounds of monitoring, “interim monitoring” took place that consisted of only school and classroom observations and interviews and did not include student assessments and EGRA. Because no complete midline monitoring for Cohort 3 districts took place, data from the Cohort 3 interim monitoring for 2015, which was confined to school and classroom observation and interviews, is included in Table 2 as midline monitoring.
The objectives of the various monitoring activities were to (1) assess needs at the start of the project, (2) support the design of specific project interventions, and (3) to collect partner and baseline data for each of the indicators against which the impact of project interventions was measured.
School baseline monitoring data was collected for 13 project custom indicators. The monitoring in the following years collected the same information from the same schools as those surveyed during the baseline collection to assess the changes that had taken place over the years.
This report, which focuses on indicators concerned with student assessment in Bahasa Indonesia, mathematics, and science, presents and compares the results of each of the rounds of assessment at the school level. By comparing the collected monitoring data, it is possible to assess the changes that have taken place in the years of project implementation and the extent to which these changes could be attributed to project intervention. Project and local government staff jointly conducted the assessments.
The USAID PRIORITAS monitoring findings are reported in three volumes:
• Volume 1: Assessing the Impact of the USAID PRIORITAS Program on Schools in Cohort 1, 2, and 3 Districts
• Volume 2: Assessing the Impact of the USAID PRIORITAS Program on Student Performance in Bahasa Indonesia, Mathematics, and Science (for primary and junior secondary schools) in the Cohort 1, 2, and 3 Districts
• Volume 3: An Assessment of Early Grade Reading (EGRA)—How Well Children Are Reading in USAID PRIORITAS Districts (Cohort 1, 2, and 3).
This report volume (Volume 2) presents the student assessment results in Bahasa Indonesia, mathematics, and science for primary and junior secondary schools in the Cohort 1, 2, and 3 districts.
Assessment Program Outline
The ultimate success of the USAID PRIORITAS program must be assessed in terms of its impact on students through improved quality of teaching and learning. However, student performance and performance assessment is complex, because it involves the elements of knowledge and understanding, skills, and attitudes. The Indonesian national school examination and semi-annual tests are limited mainly to testing or factual recall of
4 Assessing the Impact of the USAID PRIORITAS Program on Student Performance
knowledge, and in many cases, are not comparable from year to year or between different geographic areas. USAID PRIORITAS has, therefore, undertaken its own student performance assessment, which is matched to the objectives of the USAID PRIORITAS teacher training program and the government’s competency-based curriculum.
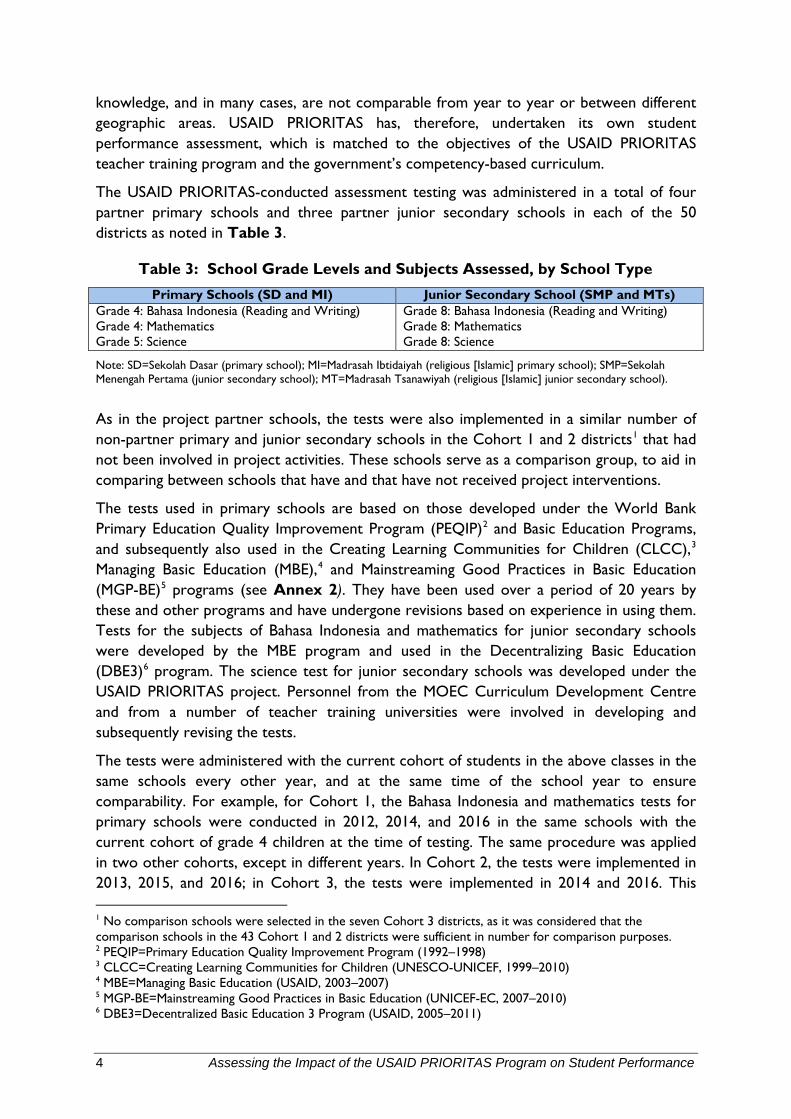
The USAID PRIORITAS-conducted assessment testing was administered in a total of four partner primary schools and three partner junior secondary schools in each of the 50 districts as noted in Table 3.
Table 3: School Grade Levels and Subjects Assessed, by School Type Primary Schools (SD and MI) Junior Secondary School (SMP and MTs)
Grade 4: Bahasa Indonesia (Reading and Writing) Grade 4: Mathematics Grade 5: Science
Grade 8: Bahasa Indonesia (Reading and Writing) Grade 8: Mathematics Grade 8: Science
Note: SD=Sekolah Dasar (primary school); MI=Madrasah Ibtidaiyah (religious [Islamic] primary school); SMP=Sekolah Menengah Pertama (junior secondary school); MT=Madrasah Tsanawiyah (religious [Islamic] junior secondary school).
As in the project partner schools, the tests were also implemented in a similar number of non-partner primary and junior secondary schools in the Cohort 1 and 2 districts1 that had not been involved in project activities. These schools serve as a comparison group, to aid in comparing between schools that have and that have not received project interventions.
The tests used in primary schools are based on those developed under the World Bank Primary Education Quality Improvement Program (PEQIP)2 and Basic Education Programs, and subsequently also used in the Creating Learning Communities for Children (CLCC),3 Managing Basic Education (MBE),4 and Mainstreaming Good Practices in Basic Education (MGP-BE)5 programs (see Annex 2). They have been used over a period of 20 years by these and other programs and have undergone revisions based on experience in using them. Tests for the subjects of Bahasa Indonesia and mathematics for junior secondary schools were developed by the MBE program and used in the Decentralizing Basic Education (DBE3)6 program. The science test for junior secondary schools was developed under the USAID PRIORITAS project. Personnel from the MOEC Curriculum Development Centre and from a number of teacher training universities were involved in developing and subsequently revising the tests.
The tests were administered with the current cohort of students in the above classes in the same schools every other year, and at the same time of the school year to ensure comparability. For example, for Cohort 1, the Bahasa Indonesia and mathematics tests for primary schools were conducted in 2012, 2014, and 2016 in the same schools with the current cohort of grade 4 children at the time of testing. The same procedure was applied in two other cohorts, except in different years. In Cohort 2, the tests were implemented in 2013, 2015, and 2016; in Cohort 3, the tests were implemented in 2014 and 2016. This 1 No comparison schools were selected in the seven Cohort 3 districts, as it was considered that the comparison schools in the 43 Cohort 1 and 2 districts were sufficient in number for comparison purposes. 2 PEQIP=Primary Education Quality Improvement Program (1992–1998) 3 CLCC=Creating Learning Communities for Children (UNESCO-UNICEF, 1999–2010) 4 MBE=Managing Basic Education (USAID, 2003–2007) 5 MGP-BE=Mainstreaming Good Practices in Basic Education (UNICEF-EC, 2007–2010) 6 DBE3=Decentralized Basic Education 3 Program (USAID, 2005–2011)
Assessing the Impact of the USAID PRIORITAS Program on Student Performance 5
report presents the summary of the three rounds of tests in Cohort 1 and Cohort 2 and two rounds of tests in Cohort 3. The report is intended to identify changes in students’ performance since baseline, and midline and by endline of project monitoring.
The tests also provide some evidence of the impact of the USAID PRIORITAS teacher-training program, as reflected in the development of student competencies. Tests help to measure a range of competencies and use a number of different techniques, including traditional multiple-choice questions, open-ended questions, and essay questions in the language tests. All tests are compatible with the current government curriculum. More details about the tests are provided in a matrix in Annex 4.
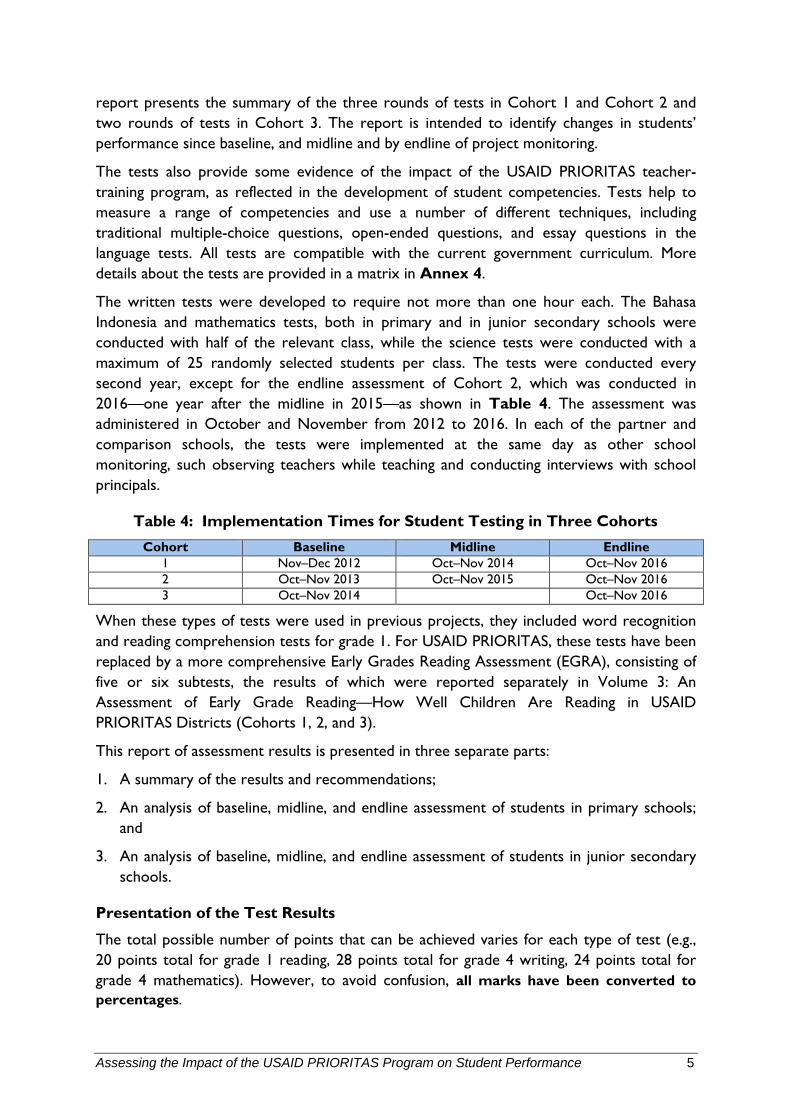
The written tests were developed to require not more than one hour each. The Bahasa Indonesia and mathematics tests, both in primary and in junior secondary schools were conducted with half of the relevant class, while the science tests were conducted with a maximum of 25 randomly selected students per class. The tests were conducted every second year, except for the endline assessment of Cohort 2, which was conducted in 2016—one year after the midline in 2015—as shown in Table 4. The assessment was administered in October and November from 2012 to 2016. In each of the partner and comparison schools, the tests were implemented at the same day as other school monitoring, such observing teachers while teaching and conducting interviews with school principals.
Table 4: Implementation Times for Student Testing in Three Cohorts Cohort Baseline Midline Endline
1 Nov–Dec 2012 Oct–Nov 2014 Oct–Nov 2016 2 Oct–Nov 2013 Oct–Nov 2015 Oct–Nov 2016 3 Oct–Nov 2014 Oct–Nov 2016
When these types of tests were used in previous projects, they included word recognition and reading comprehension tests for grade 1. For USAID PRIORITAS, these tests have been replaced by a more comprehensive Early Grades Reading Assessment (EGRA), consisting of five or six subtests, the results of which were reported separately in Volume 3: An Assessment of Early Grade Reading—How Well Children Are Reading in USAID PRIORITAS Districts (Cohorts 1, 2, and 3).
This report of assessment results is presented in three separate parts:
1. A summary of the results and recommendations;
2. An analysis of baseline, midline, and endline assessment of students in primary schools; and
3. An analysis of baseline, midline, and endline assessment of students in junior secondary schools.
Presentation of the Test Results
The total possible number of points that can be achieved varies for each type of test (e.g., 20 points total for grade 1 reading, 28 points total for grade 4 writing, 24 points total for grade 4 mathematics). However, to avoid confusion, all marks have been converted to percentages.
6 Assessing the Impact of the USAID PRIORITAS Program on Student Performance
In calculating the scores, two types of questions must be considered. The first type is a multiple-choice question, for which the answer has only two values: either 1 for the correct answer, or 0 for the wrong answer. If five students in a class of 20 can answer a question correctly, it will be reported as “25% of students could answer the question.”
The second type of question has multiple answers, where each answer can have a different score, depending on how complete an answer is provided. For example, the first question of the Grade 5 Science Test Section B asks students to find three signs in a provided picture that a boat is traveling in a certain direction. The student who can identify at least three signs scores 3, two signs score 2, one sign scores 1, and no signs scores zero. In a class of 10 students, the highest possible score is 10 x 3 = 30. If the actual total score of the students is 12, the average percentage of the (correct) students’ answer for this question is (12 ÷ 30) x 100 = 40%. This does not mean that 40% of the students answer correctly, rather it means that the students could achieve 40% of the highest possible score for the question. In this report, such a result is called “the percentage of correct answers.”
This method of scoring for the second type of question can be applied in the same way to multiple-choice questions as described above. If five students in a class of 20correctly answer a question, it is reported that “the question has 25% correct answers.”
Copies of the tests have not been included with this report, to avoid their inadvertent dissemination to schools, which would make their further use unreliable.
Assessing the Impact of the USAID PRIORITAS Program on Student Performance 7
1 Overview and Summary of the Test Results 1.1 Test Implementation
Assessment tests were administered in 50 districts in all three cohorts. In Cohort 1, the first round of tests was administered between November 15 and December 5, 2012, in primary and junior secondary schools in each of the 23 USAID PRIORITAS partner districts that had joined the USAID PRIORITAS program in 2012. In Cohort 2, the first test was conducted in 20 partner districts between October and November 2013. In Cohort 3, the first test was conducted in seven partner districts between October and November 2014.
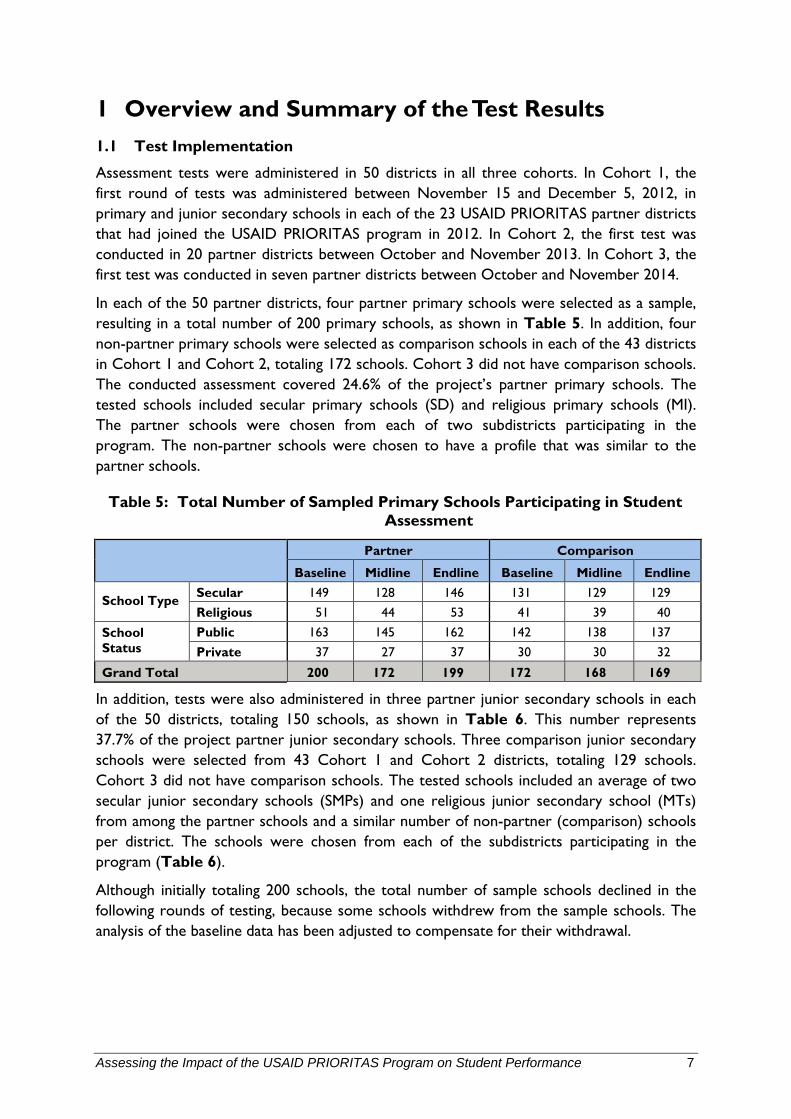
In each of the 50 partner districts, four partner primary schools were selected as a sample, resulting in a total number of 200 primary schools, as shown in Table 5. In addition, four non-partner primary schools were selected as comparison schools in each of the 43 districts in Cohort 1 and Cohort 2, totaling 172 schools. Cohort 3 did not have comparison schools. The conducted assessment covered 24.6% of the project’s partner primary schools. The tested schools included secular primary schools (SD) and religious primary schools (MI). The partner schools were chosen from each of two subdistricts participating in the program. The non-partner schools were chosen to have a profile that was similar to the partner schools.
Table 5: Total Number of Sampled Primary Schools Participating in Student Assessment
Partner Comparison
Baseline Midline Endline Baseline Midline Endline
School Type Secular 149 128 146 131 129 129 Religious 51 44 53 41 39 40
School Status
Public 163 145 162 142 138 137 Private 37 27 37 30 30 32
Grand Total 200 172 199 172 168 169
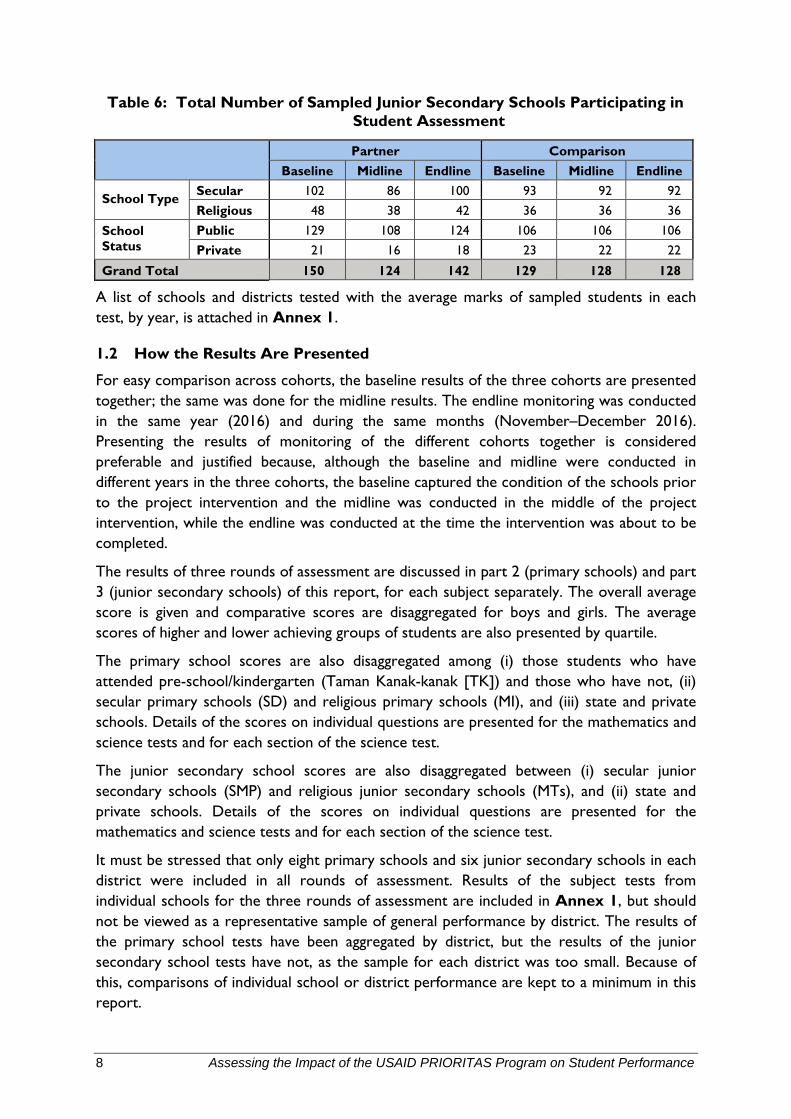
In addition, tests were also administered in three partner junior secondary schools in each of the 50 districts, totaling 150 schools, as shown in Table 6. This number represents 37.7% of the project partner junior secondary schools. Three comparison junior secondary schools were selected from 43 Cohort 1 and Cohort 2 districts, totaling 129 schools. Cohort 3 did not have comparison schools. The tested schools included an average of two secular junior secondary schools (SMPs) and one religious junior secondary school (MTs) from among the partner schools and a similar number of non-partner (comparison) schools per district. The schools were chosen from each of the subdistricts participating in the program (Table 6).
Although initially totaling 200 schools, the total number of sample schools declined in the following rounds of testing, because some schools withdrew from the sample schools. The analysis of the baseline data has been adjusted to compensate for their withdrawal.
8 Assessing the Impact of the USAID PRIORITAS Program on Student Performance
Table 6: Total Number of Sampled Junior Secondary Schools Participating in Student Assessment
Partner Comparison
Baseline Midline Endline Baseline Midline Endline
School Type Secular 102 86 100 93 92 92 Religious 48 38 42 36 36 36
School Status
Public 129 108 124 106 106 106 Private 21 16 18 23 22 22
Grand Total 150 124 142 129 128 128
A list of schools and districts tested with the average marks of sampled students in each test, by year, is attached in Annex 1.
1.2 How the Results Are Presented
For easy comparison across cohorts, the baseline results of the three cohorts are presented together; the same was done for the midline results. The endline monitoring was conducted in the same year (2016) and during the same months (November–December 2016). Presenting the results of monitoring of the different cohorts together is considered preferable and justified because, although the baseline and midline were conducted in different years in the three cohorts, the baseline captured the condition of the schools prior to the project intervention and the midline was conducted in the middle of the project intervention, while the endline was conducted at the time the intervention was about to be completed.
The results of three rounds of assessment are discussed in part 2 (primary schools) and part 3 (junior secondary schools) of this report, for each subject separately. The overall average score is given and comparative scores are disaggregated for boys and girls. The average scores of higher and lower achieving groups of students are also presented by quartile.
The primary school scores are also disaggregated among (i) those students who have attended pre-school/kindergarten (Taman Kanak-kanak [TK]) and those who have not, (ii) secular primary schools (SD) and religious primary schools (MI), and (iii) state and private schools. Details of the scores on individual questions are presented for the mathematics and science tests and for each section of the science test.
The junior secondary school scores are also disaggregated between (i) secular junior secondary schools (SMP) and religious junior secondary schools (MTs), and (ii) state and private schools. Details of the scores on individual questions are presented for the mathematics and science tests and for each section of the science test.
It must be stressed that only eight primary schools and six junior secondary schools in each district were included in all rounds of assessment. Results of the subject tests from individual schools for the three rounds of assessment are included in Annex 1, but should not be viewed as a representative sample of general performance by district. The results of the primary school tests have been aggregated by district, but the results of the junior secondary school tests have not, as the sample for each district was too small. Because of this, comparisons of individual school or district performance are kept to a minimum in this report.
Assessing the Impact of the USAID PRIORITAS Program on Student Performance 9
1.3 Summary of Results in Primary Schools (SD and MI)
Through the 50 districts, 200 partner primary schools (149 secular primary schools and 51 religious primary schools) and 172 comparison primary schools (132 secular primary schools and 40 religious primary schools) were tested. Table 7 presents the total number of students tested. The number in the midline was lower because Cohort 3 district schools had only baseline and endline assessments, given their shorter time implementing USAID PRIORITAS. The number of students in comparison schools was also lower than in partner schools because Cohort 3 did not have comparison schools.
Table 7: Total Number of Primary School Students Taking the Tests
Test Partner Schools Comparison Schools
Baseline Midline Endline Baseline Midline Endline Bahasa Indonesia
3043 2536 2858 2580 2453 2415
Mathematics 3062 2562 2888 2566 2476 2369 Science 2935 3182 3725 2515 2999 3130
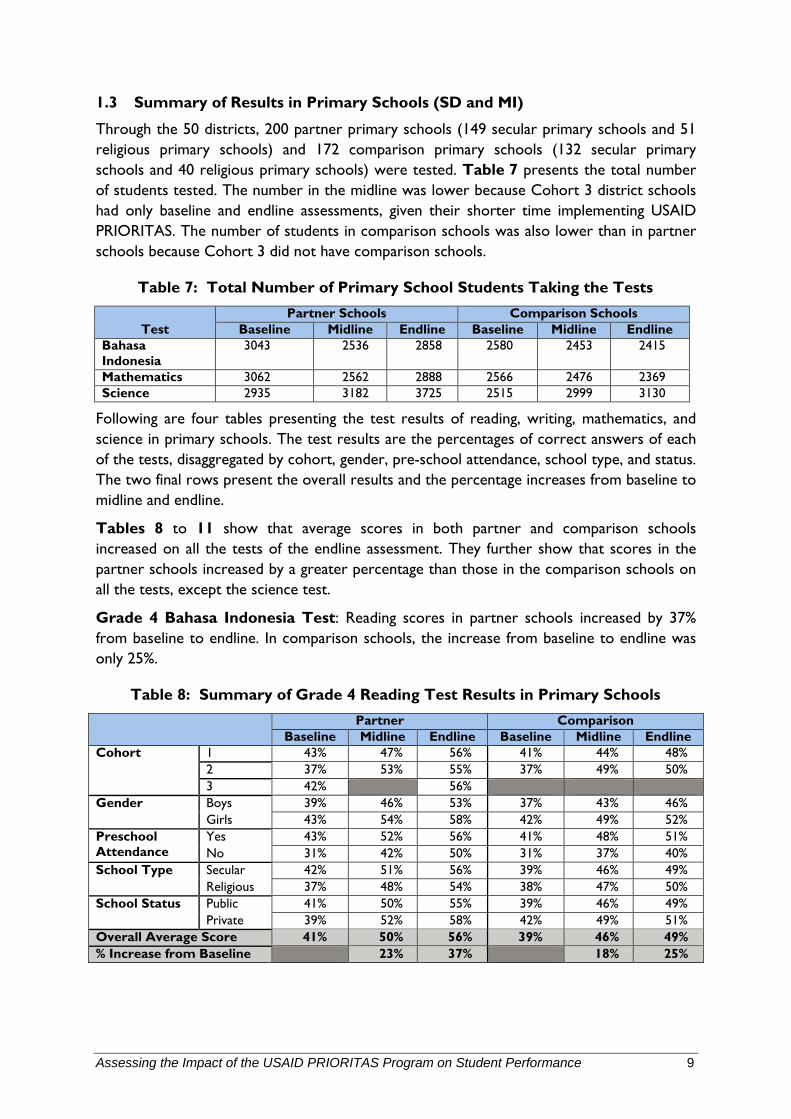
Following are four tables presenting the test results of reading, writing, mathematics, and science in primary schools. The test results are the percentages of correct answers of each of the tests, disaggregated by cohort, gender, pre-school attendance, school type, and status. The two final rows present the overall results and the percentage increases from baseline to midline and endline.
Tables 8 to 11 show that average scores in both partner and comparison schools increased on all the tests of the endline assessment. They further show that scores in the partner schools increased by a greater percentage than those in the comparison schools on all the tests, except the science test.
Grade 4 Bahasa Indonesia Test: Reading scores in partner schools increased by 37% from baseline to endline. In comparison schools, the increase from baseline to endline was only 25%.
Table 8: Summary of Grade 4 Reading Test Results in Primary Schools
Partner Comparison Baseline Midline Endline Baseline Midline Endline
Cohort 1 43% 47% 56% 41% 44% 48% 2 37% 53% 55% 37% 49% 50% 3 42% 56%
Gender Boys 39% 46% 53% 37% 43% 46% Girls 43% 54% 58% 42% 49% 52%
Preschool Attendance
Yes 43% 52% 56% 41% 48% 51% No 31% 42% 50% 31% 37% 40%
School Type Secular 42% 51% 56% 39% 46% 49% Religious 37% 48% 54% 38% 47% 50%
School Status Public 41% 50% 55% 39% 46% 49% Private 39% 52% 58% 42% 49% 51%
Overall Average Score 41% 50% 56% 39% 46% 49% % Increase from Baseline 23% 37% 18% 25%
10 Assessing the Impact of the USAID PRIORITAS Program on Student Performance
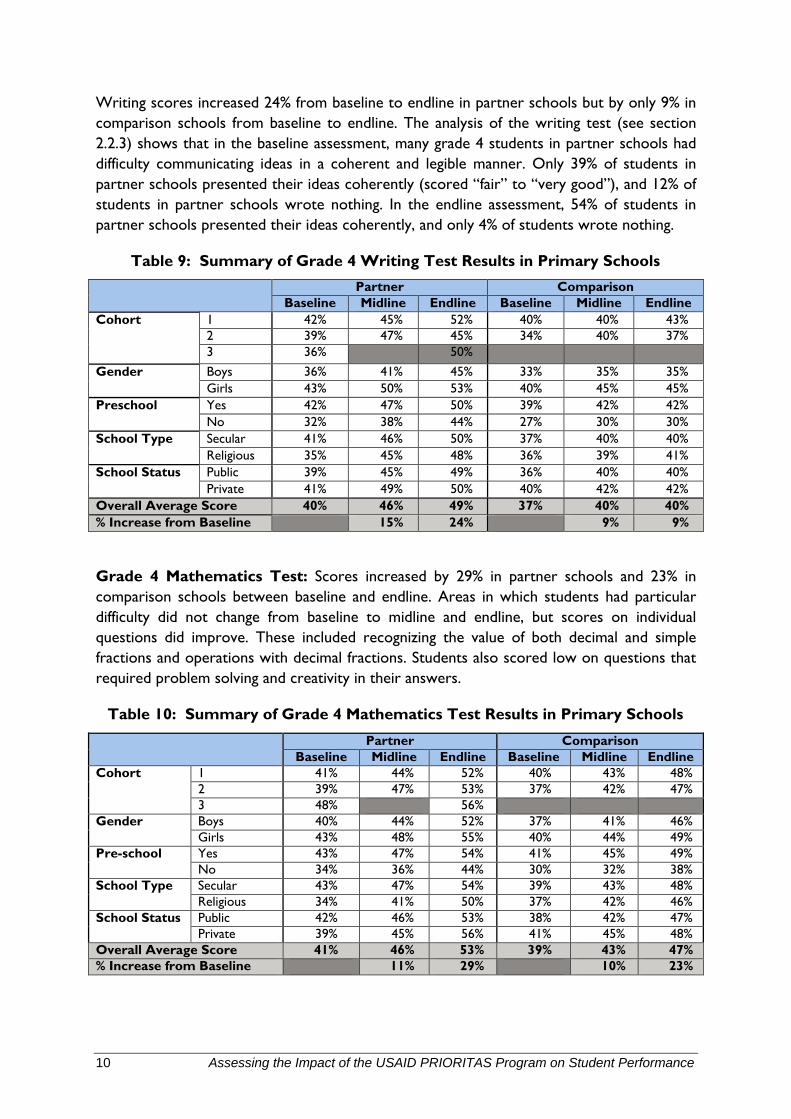
Writing scores increased 24% from baseline to endline in partner schools but by only 9% in comparison schools from baseline to endline. The analysis of the writing test (see section 2.2.3) shows that in the baseline assessment, many grade 4 students in partner schools had difficulty communicating ideas in a coherent and legible manner. Only 39% of students in partner schools presented their ideas coherently (scored “fair” to “very good”), and 12% of students in partner schools wrote nothing. In the endline assessment, 54% of students in partner schools presented their ideas coherently, and only 4% of students wrote nothing.
Table 9: Summary of Grade 4 Writing Test Results in Primary Schools
Partner Comparison Baseline Midline Endline Baseline Midline Endline
Cohort 1 42% 45% 52% 40% 40% 43% 2 39% 47% 45% 34% 40% 37% 3 36% 50%
Gender Boys 36% 41% 45% 33% 35% 35% Girls 43% 50% 53% 40% 45% 45%
Preschool Yes 42% 47% 50% 39% 42% 42% No 32% 38% 44% 27% 30% 30%
School Type Secular 41% 46% 50% 37% 40% 40% Religious 35% 45% 48% 36% 39% 41%
School Status Public 39% 45% 49% 36% 40% 40% Private 41% 49% 50% 40% 42% 42%
Overall Average Score 40% 46% 49% 37% 40% 40% % Increase from Baseline 15% 24% 9% 9%
Grade 4 Mathematics Test: Scores increased by 29% in partner schools and 23% in comparison schools between baseline and endline. Areas in which students had particular difficulty did not change from baseline to midline and endline, but scores on individual questions did improve. These included recognizing the value of both decimal and simple fractions and operations with decimal fractions. Students also scored low on questions that required problem solving and creativity in their answers.
Table 10: Summary of Grade 4 Mathematics Test Results in Primary Schools
Partner Comparison
Baseline Midline Endline Baseline Midline Endline Cohort 1 41% 44% 52% 40% 43% 48%
2 39% 47% 53% 37% 42% 47% 3 48% 56%
Gender Boys 40% 44% 52% 37% 41% 46% Girls 43% 48% 55% 40% 44% 49%
Pre-school Yes 43% 47% 54% 41% 45% 49% No 34% 36% 44% 30% 32% 38%
School Type Secular 43% 47% 54% 39% 43% 48% Religious 34% 41% 50% 37% 42% 46%
School Status Public 42% 46% 53% 38% 42% 47% Private 39% 45% 56% 41% 45% 48%
Overall Average Score 41% 46% 53% 39% 43% 47% % Increase from Baseline 11% 29% 10% 23%
Assessing the Impact of the USAID PRIORITAS Program on Student Performance 11
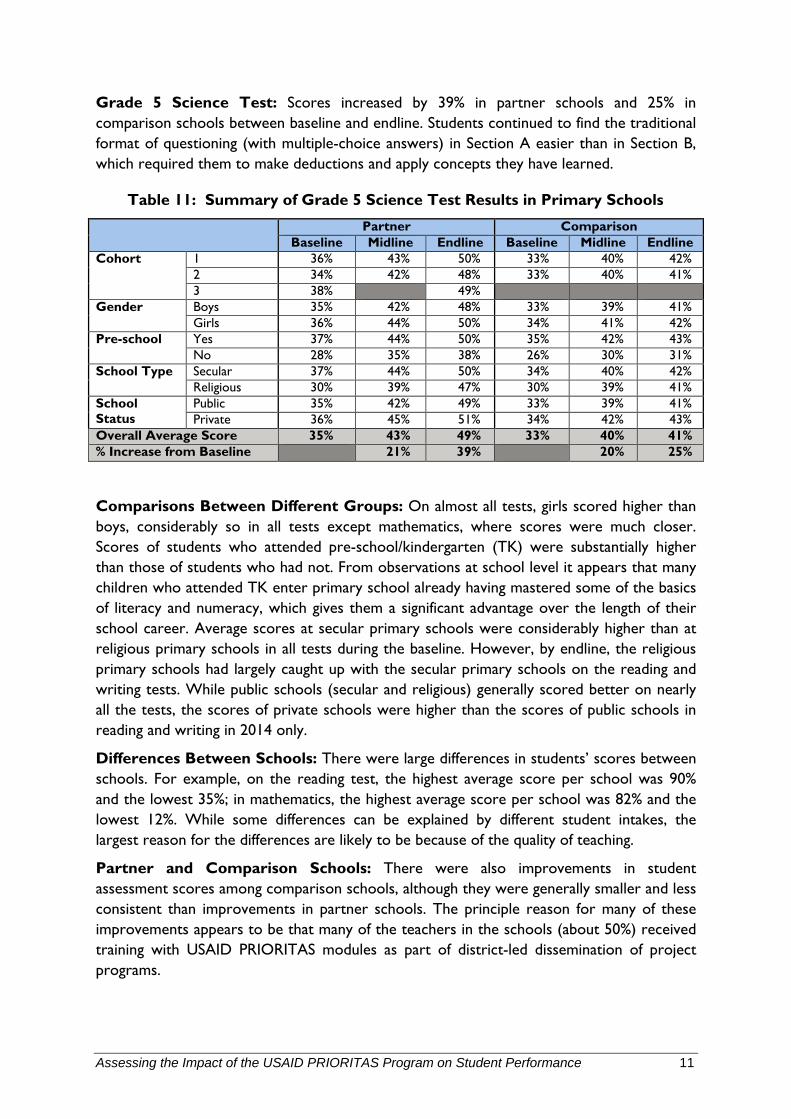
Grade 5 Science Test: Scores increased by 39% in partner schools and 25% in comparison schools between baseline and endline. Students continued to find the traditional format of questioning (with multiple-choice answers) in Section A easier than in Section B, which required them to make deductions and apply concepts they have learned.
Table 11: Summary of Grade 5 Science Test Results in Primary Schools
Partner Comparison
Baseline Midline Endline Baseline Midline Endline Cohort 1 36% 43% 50% 33% 40% 42%
2 34% 42% 48% 33% 40% 41% 3 38% 49%
Gender Boys 35% 42% 48% 33% 39% 41% Girls 36% 44% 50% 34% 41% 42%
Pre-school Yes 37% 44% 50% 35% 42% 43% No 28% 35% 38% 26% 30% 31%
School Type Secular 37% 44% 50% 34% 40% 42% Religious 30% 39% 47% 30% 39% 41%
School Status
Public 35% 42% 49% 33% 39% 41% Private 36% 45% 51% 34% 42% 43%
Overall Average Score 35% 43% 49% 33% 40% 41% % Increase from Baseline 21% 39% 20% 25%
Comparisons Between Different Groups: On almost all tests, girls scored higher than boys, considerably so in all tests except mathematics, where scores were much closer. Scores of students who attended pre-school/kindergarten (TK) were substantially higher than those of students who had not. From observations at school level it appears that many children who attended TK enter primary school already having mastered some of the basics of literacy and numeracy, which gives them a significant advantage over the length of their school career. Average scores at secular primary schools were considerably higher than at religious primary schools in all tests during the baseline. However, by endline, the religious primary schools had largely caught up with the secular primary schools on the reading and writing tests. While public schools (secular and religious) generally scored better on nearly all the tests, the scores of private schools were higher than the scores of public schools in reading and writing in 2014 only.
Differences Between Schools: There were large differences in students’ scores between schools. For example, on the reading test, the highest average score per school was 90% and the lowest 35%; in mathematics, the highest average score per school was 82% and the lowest 12%. While some differences can be explained by different student intakes, the largest reason for the differences are likely to be because of the quality of teaching.
Partner and Comparison Schools: There were also improvements in student assessment scores among comparison schools, although they were generally smaller and less consistent than improvements in partner schools. The principle reason for many of these improvements appears to be that many of the teachers in the schools (about 50%) received training with USAID PRIORITAS modules as part of district-led dissemination of project programs.
12 Assessing the Impact of the USAID PRIORITAS Program on Student Performance
A table comparing the results from the USAID PRIORITAS, MGP-BE, and MBE programs is presented in Annex 2.
1.4 Summary of Results in Junior Secondary Schools (SMPs and MTs)
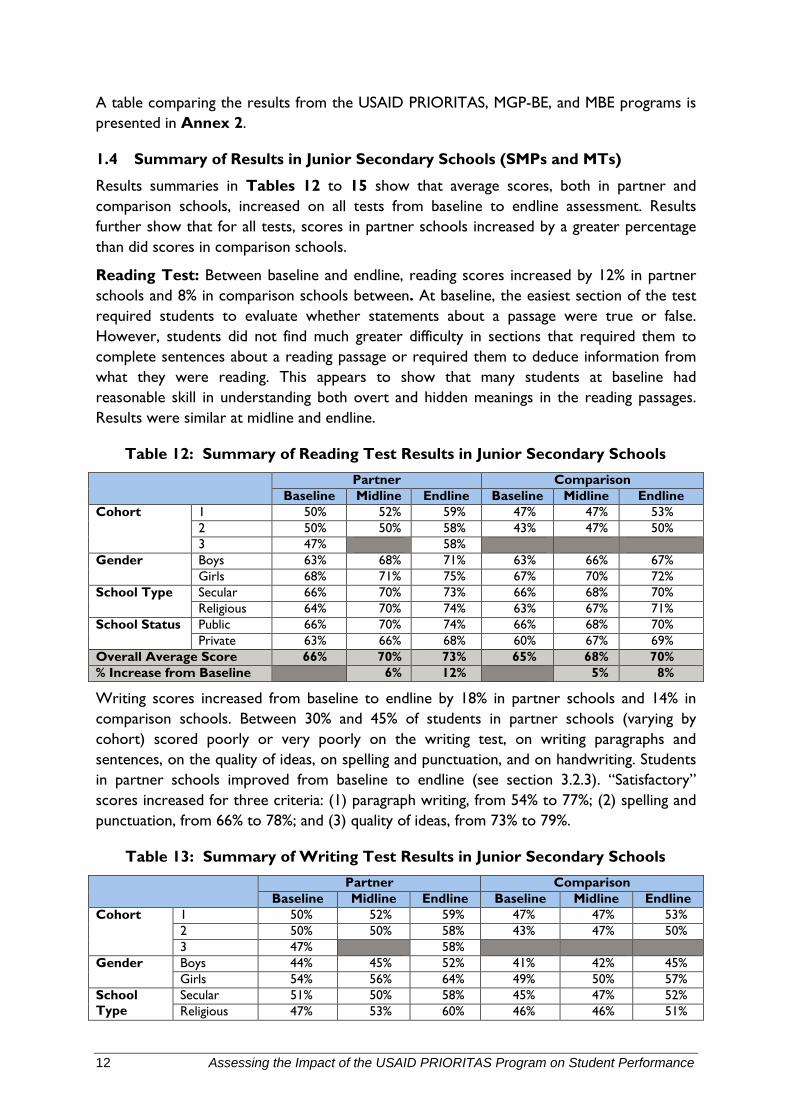
Results summaries in Tables 12 to 15 show that average scores, both in partner and comparison schools, increased on all tests from baseline to endline assessment. Results further show that for all tests, scores in partner schools increased by a greater percentage than did scores in comparison schools.
Reading Test: Between baseline and endline, reading scores increased by 12% in partner schools and 8% in comparison schools between. At baseline, the easiest section of the test required students to evaluate whether statements about a passage were true or false. However, students did not find much greater difficulty in sections that required them to complete sentences about a reading passage or required them to deduce information from what they were reading. This appears to show that many students at baseline had reasonable skill in understanding both overt and hidden meanings in the reading passages. Results were similar at midline and endline.
Table 12: Summary of Reading Test Results in Junior Secondary Schools
Partner Comparison Baseline Midline Endline Baseline Midline Endline
Cohort 1 50% 52% 59% 47% 47% 53% 2 50% 50% 58% 43% 47% 50% 3 47% 58%
Gender Boys 63% 68% 71% 63% 66% 67% Girls 68% 71% 75% 67% 70% 72%
School Type Secular 66% 70% 73% 66% 68% 70% Religious 64% 70% 74% 63% 67% 71%
School Status Public 66% 70% 74% 66% 68% 70% Private 63% 66% 68% 60% 67% 69%
Overall Average Score 66% 70% 73% 65% 68% 70% % Increase from Baseline 6% 12% 5% 8%
Writing scores increased from baseline to endline by 18% in partner schools and 14% in comparison schools. Between 30% and 45% of students in partner schools (varying by cohort) scored poorly or very poorly on the writing test, on writing paragraphs and sentences, on the quality of ideas, on spelling and punctuation, and on handwriting. Students in partner schools improved from baseline to endline (see section 3.2.3). “Satisfactory” scores increased for three criteria: (1) paragraph writing, from 54% to 77%; (2) spelling and punctuation, from 66% to 78%; and (3) quality of ideas, from 73% to 79%.
Table 13: Summary of Writing Test Results in Junior Secondary Schools
Partner Comparison Baseline Midline Endline Baseline Midline Endline
Cohort 1 50% 52% 59% 47% 47% 53% 2 50% 50% 58% 43% 47% 50% 3 47% 58%
Gender Boys 44% 45% 52% 41% 42% 45% Girls 54% 56% 64% 49% 50% 57%
School Type
Secular 51% 50% 58% 45% 47% 52% Religious 47% 53% 60% 46% 46% 51%
Assessing the Impact of the USAID PRIORITAS Program on Student Performance 13
Partner Comparison Baseline Midline Endline Baseline Midline Endline
School Status
Public 50% 51% 59% 45% 47% 52% Private 44% 48% 52% 45% 47% 50%
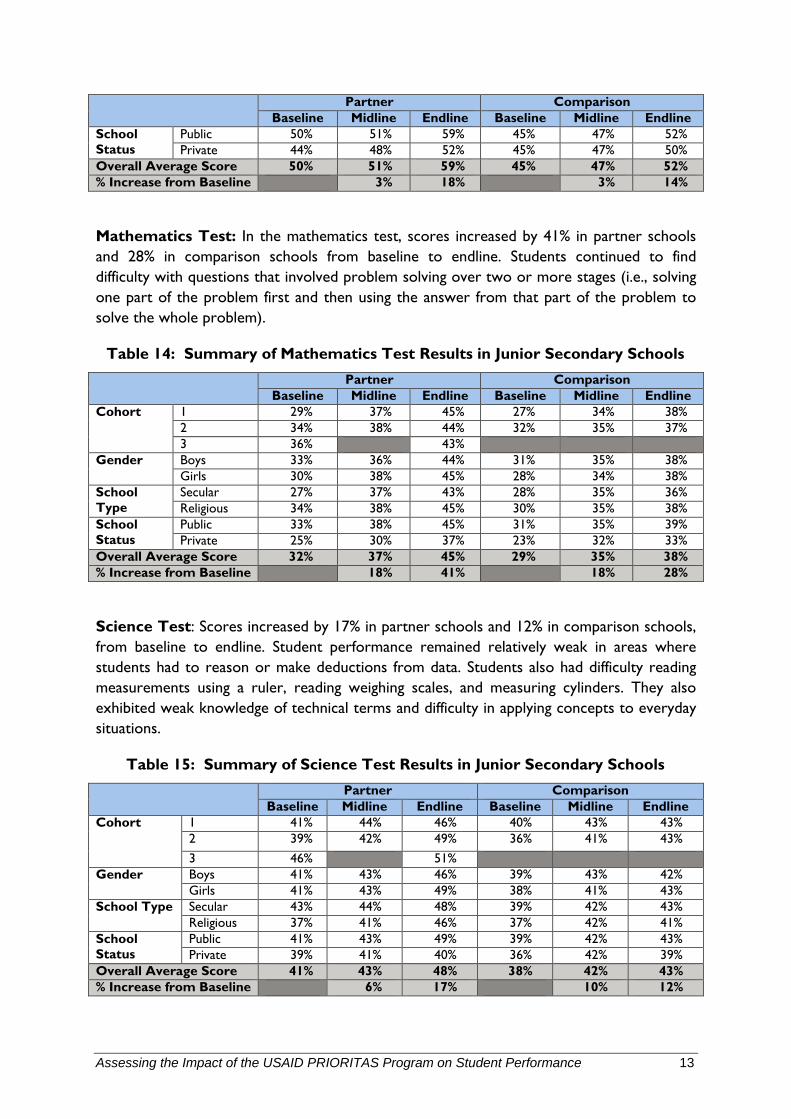
Overall Average Score 50% 51% 59% 45% 47% 52% % Increase from Baseline 3% 18% 3% 14%
Mathematics Test: In the mathematics test, scores increased by 41% in partner schools and 28% in comparison schools from baseline to endline. Students continued to find difficulty with questions that involved problem solving over two or more stages (i.e., solving one part of the problem first and then using the answer from that part of the problem to solve the whole problem).
Table 14: Summary of Mathematics Test Results in Junior Secondary Schools
Partner Comparison Baseline Midline Endline Baseline Midline Endline
Cohort 1 29% 37% 45% 27% 34% 38% 2 34% 38% 44% 32% 35% 37% 3 36% 43%
Gender Boys 33% 36% 44% 31% 35% 38% Girls 30% 38% 45% 28% 34% 38%
School Type
Secular 27% 37% 43% 28% 35% 36% Religious 34% 38% 45% 30% 35% 38%
School Status
Public 33% 38% 45% 31% 35% 39% Private 25% 30% 37% 23% 32% 33%
Overall Average Score 32% 37% 45% 29% 35% 38% % Increase from Baseline 18% 41% 18% 28%
Science Test: Scores increased by 17% in partner schools and 12% in comparison schools, from baseline to endline. Student performance remained relatively weak in areas where students had to reason or make deductions from data. Students also had difficulty reading measurements using a ruler, reading weighing scales, and measuring cylinders. They also exhibited weak knowledge of technical terms and difficulty in applying concepts to everyday situations.
Table 15: Summary of Science Test Results in Junior Secondary Schools
Partner Comparison Baseline Midline Endline Baseline Midline Endline
Cohort 1 41% 44% 46% 40% 43% 43% 2 39% 42% 49% 36% 41% 43% 3 46% 51%
Gender Boys 41% 43% 46% 39% 43% 42% Girls 41% 43% 49% 38% 41% 43%
School Type Secular 43% 44% 48% 39% 42% 43% Religious 37% 41% 46% 37% 42% 41%
School Status
Public 41% 43% 49% 39% 42% 43% Private 39% 41% 40% 36% 42% 39%
Overall Average Score 41% 43% 48% 38% 42% 43% % Increase from Baseline 6% 17% 10% 12%
14 Assessing the Impact of the USAID PRIORITAS Program on Student Performance
Comparisons Between Different Groups: Girls performed considerably better than boys in the Bahasa Indonesia reading and writing tests and slightly better in the mathematics test. In partner schools, they also overtook boys on the science test by endline. There was no great difference in performance between students from secular and religious junior secondary schools, except in writing in religious schools, where scores showed a marked increase over 2012 and were considerably higher than in secular schools. It should be noted that most of the religious junior secondary schools participating in USAID PRIORITAS are public schools, which are relatively well resourced.
Differences Between Schools: There were wide differences in average scores between schools in every subject, indicating that students are learning much better in some schools than in others. In some cases, there were mitigating social and economic circumstances. However, it is noticeable that some schools perform relatively well in one subject and poorly or very poorly in another (see Annex 1 for a complete list of school scores). This suggests variable quality in the teaching at the same school.
Partner and Comparison Schools: As was seen in the primary school results, there were also improvements in student assessment scores in comparison schools, although they were generally smaller and less consistent than improvements in partner schools. The principle reason for many of these improvements appears to be that many of the teachers in the schools (about 50%) received training with USAID PRIORITAS modules as part of district-led dissemination of project programs.
1.5 How USAID PRIORITAS Has Addressed the Issues
The implications of and recommendations from the baseline student assessments have been addressed through USAID PRIORITAS teacher and management training.
A. General
• USAID PRIORITAS has built on lessons learned from previous programs. These lessons demonstrate the need to link improved teaching to other system improvements at school and district level, including improved school management, increased community support for schools, and improved support and management from district governments.
• Government policy stresses the use of Active, Joyful, Creative, and Effective Learning (better known by its Indonesian acronym—PAKEM) as its preferred teaching approach. USAID PRIORITAS teacher training has supported this. However, this teacher training has also sought to identify specific weaknesses in the teaching of the various subjects and to help teachers develop strategies and methodologies to address these weaknesses. These are explained in more detail below.
B. Bahasa Indonesia
• It was evident from the baseline tests that many grade 4 children in USAID PRIORITAS schools have difficulty comprehending what they read and communicating ideas in a coherent and legible manner. From observations in many schools around the country, it is clear that language teaching focuses too narrowly on the mechanics of reading (often “barking” at print), and writing is confined largely to copying words and sentences or filling in words in sentences.
Assessing the Impact of the USAID PRIORITAS Program on Student Performance 15
• In line with the competency-based curriculum, Bahasa Indonesia teacher training has focused on developing students’ language skills. Teachers have been trained to
− Give their students opportunities to write for a variety of purposes, including reporting facts and events, writing instructions, and expressing their feelings and opinions.
− Give students the opportunity to read for different purposes, including for enjoyment, to find information, and to reflect on and report on what they have read.
− Help their students develop speaking and listening skills by giving the students the opportunity to discuss a variety of issues and problems. Speaking and listening are generally linked to reading and writing activities, with students being invited to discuss and comment on what they read and to discuss ideas before they begin to write. Students are also encouraged to read and give feedback on each other’s work.
− Pay attention to handwriting, spelling, and punctuation, which must be taught regularly and systematically. This includes encouraging students to re-read their own writing and correct spelling, punctuation, and other errors.
C. Mathematics
• The baseline mathematics test results at both primary and junior secondary levels demonstrated the difficulties students have in coping with a number of basic concepts and in using mathematics to solve everyday problems. Based on classroom observations, many teachers have a poor understanding of the concepts they are teaching and tend to teach rules and procedures for doing mathematical operations rather than cultivate an understanding of the concepts. As a result, students have difficulty applying the concepts and using mathematics as a tool for solving problems.
• USAID PRIORITAS training for teachers has focused on:
− Helping both teachers and students gain an understanding of mathematical concepts, especially by relating concepts to real situations in areas such as number, measurement, geometry, and graphical representation.
− Encouraging teachers to adopt “problem solving” approaches to teaching mathematics, which also encourage creativity and develop understanding. These approaches can include asking students to think of a variety of answers to open-ended problems, or to make up their own questions for other students to answer, and asking students to make up a variety of questions that will result in the same answer (e.g., How many questions can you make with the answer “20”? How many different shapes can you make with an area of 24cm2?)
− Specific topics that teachers have found difficult to teach, including topics related to fractions, decimals, and shape.
D. Science
• The baseline science test results at both primary and junior secondary levels demonstrated the difficulty many students have in understanding and applying many scientific concepts. Based on observations of teaching practices, science teaching focuses too much on the memorization of rules and concepts and too little on developing understanding and applying concepts. Too little practical work takes place to support
16 Assessing the Impact of the USAID PRIORITAS Program on Student Performance
science teaching. Students spend much of their time memorizing information from books rather than developing scientific skills such as measuring, observing real phenomena, data analysis, making hypotheses, and drawing conclusions.
• USAID PRIORITAS teacher training has focused on:
− Developing students’ scientific skills based on the observation of the real environment and doing experiments to investigate natural phenomena.
− Teaching students to make systematic reports on the experimental and observational work they undertake.
− Promoting simple technology activities to encourage students to apply scientific concepts in real situations.
− Developing ways to teach topics that teachers consider “difficult.”
Assessing the Impact of the USAID PRIORITAS Program on Student Performance 17
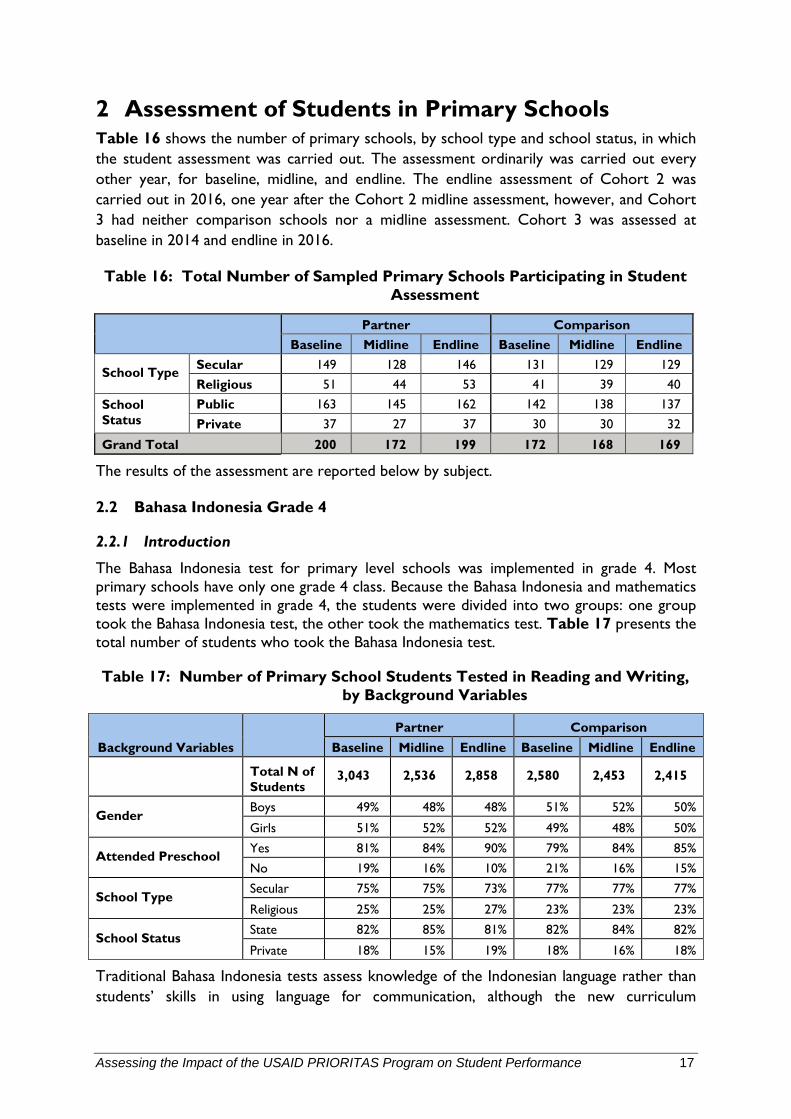
2 Assessment of Students in Primary Schools Table 16 shows the number of primary schools, by school type and school status, in which the student assessment was carried out. The assessment ordinarily was carried out every other year, for baseline, midline, and endline. The endline assessment of Cohort 2 was carried out in 2016, one year after the Cohort 2 midline assessment, however, and Cohort 3 had neither comparison schools nor a midline assessment. Cohort 3 was assessed at baseline in 2014 and endline in 2016.
Table 16: Total Number of Sampled Primary Schools Participating in Student Assessment
Partner Comparison
Baseline Midline Endline Baseline Midline Endline
School Type Secular 149 128 146 131 129 129 Religious 51 44 53 41 39 40
School Status
Public 163 145 162 142 138 137 Private 37 27 37 30 30 32
Grand Total 200 172 199 172 168 169
The results of the assessment are reported below by subject.
2.2 Bahasa Indonesia Grade 4
2.2.1 Introduction
The Bahasa Indonesia test for primary level schools was implemented in grade 4. Most primary schools have only one grade 4 class. Because the Bahasa Indonesia and mathematics tests were implemented in grade 4, the students were divided into two groups: one group took the Bahasa Indonesia test, the other took the mathematics test. Table 17 presents the total number of students who took the Bahasa Indonesia test.
Table 17: Number of Primary School Students Tested in Reading and Writing, by Background Variables
Background Variables
Partner Comparison Baseline Midline Endline Baseline Midline Endline
Total N of Students
3,043 2,536 2,858 2,580 2,453 2,415
Gender Boys 49% 48% 48% 51% 52% 50%
Girls 51% 52% 52% 49% 48% 50%
Attended Preschool Yes 81% 84% 90% 79% 84% 85%
No 19% 16% 10% 21% 16% 15%
School Type Secular 75% 75% 73% 77% 77% 77%
Religious 25% 25% 27% 23% 23% 23%
School Status State 82% 85% 81% 82% 84% 82%
Private 18% 15% 19% 18% 16% 18%
Traditional Bahasa Indonesia tests assess knowledge of the Indonesian language rather than students’ skills in using language for communication, although the new curriculum
18 Assessing the Impact of the USAID PRIORITAS Program on Student Performance
emphasizes the development of all four language skills. The USAID PRIORITAS Bahasa Indonesia test focused on skills and was divided into two parts. The first part, reading comprehension, tests students’ ability to read an extended piece of writing with understanding. The second part, story writing, tests students’ ability to extract ideas from a picture and, using their imagination, to produce a story based on that picture. The final score for writing was a composite of five scores for the different skills of handwriting, spelling, punctuation, length of the written piece, and the quality of language used.
2.2.2 Reading
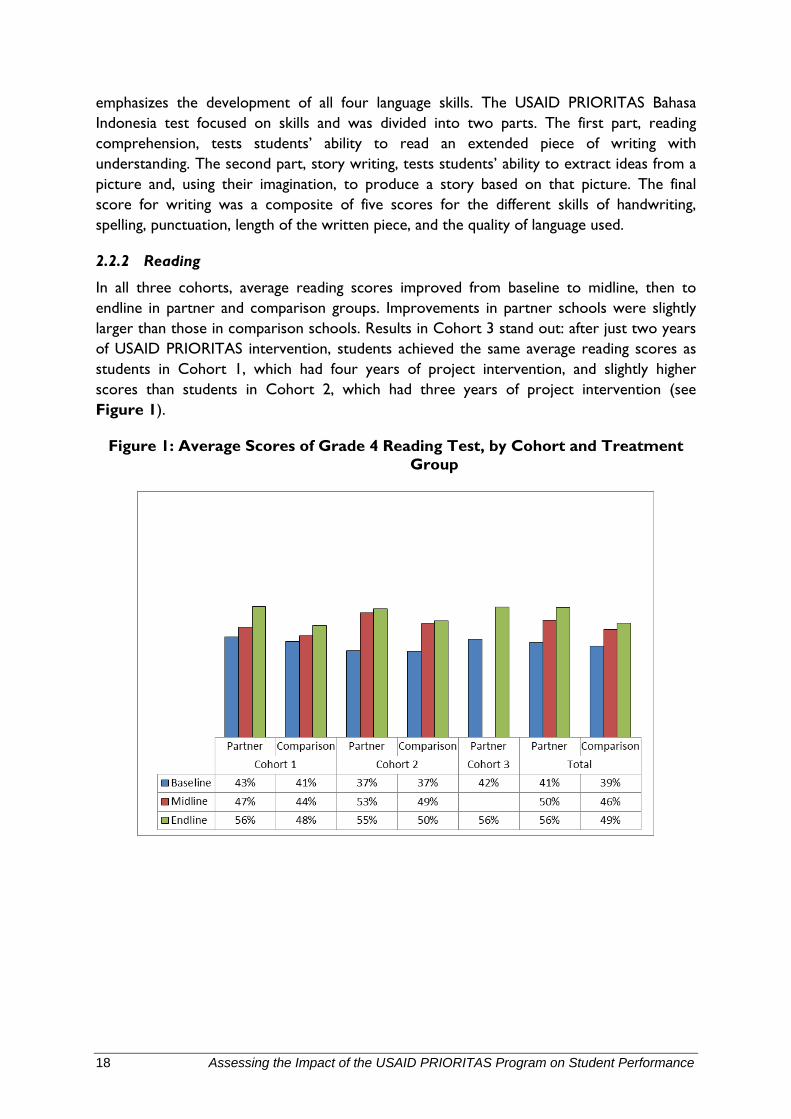
In all three cohorts, average reading scores improved from baseline to midline, then to endline in partner and comparison groups. Improvements in partner schools were slightly larger than those in comparison schools. Results in Cohort 3 stand out: after just two years of USAID PRIORITAS intervention, students achieved the same average reading scores as students in Cohort 1, which had four years of project intervention, and slightly higher scores than students in Cohort 2, which had three years of project intervention (see Figure 1).
Figure 1: Average Scores of Grade 4 Reading Test, by Cohort and Treatment Group
Assessing the Impact of the USAID PRIORITAS Program on Student Performance 19
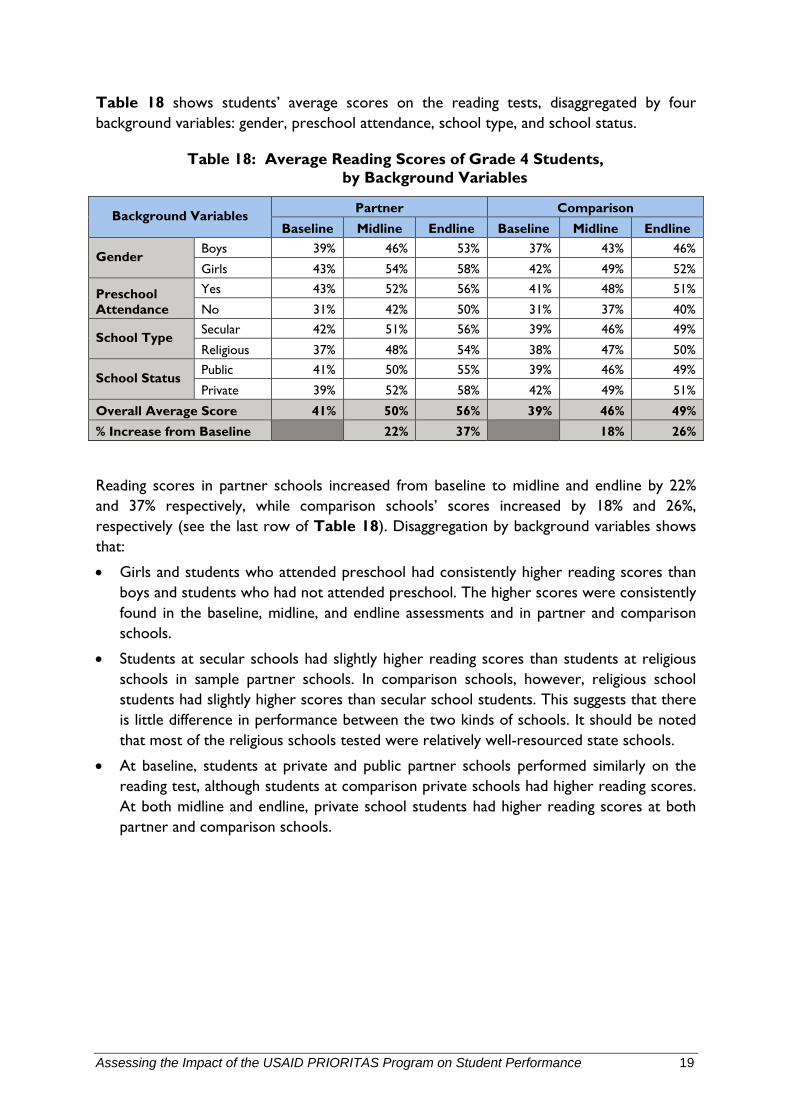
Table 18 shows students’ average scores on the reading tests, disaggregated by four background variables: gender, preschool attendance, school type, and school status.
Table 18: Average Reading Scores of Grade 4 Students, by Background Variables
Background Variables Partner Comparison Baseline Midline Endline Baseline Midline Endline
Gender Boys 39% 46% 53% 37% 43% 46%
Girls 43% 54% 58% 42% 49% 52%
Preschool Attendance
Yes 43% 52% 56% 41% 48% 51%
No 31% 42% 50% 31% 37% 40%
School Type Secular 42% 51% 56% 39% 46% 49%
Religious 37% 48% 54% 38% 47% 50%
School Status Public 41% 50% 55% 39% 46% 49%
Private 39% 52% 58% 42% 49% 51%
Overall Average Score 41% 50% 56% 39% 46% 49% % Increase from Baseline 22% 37% 18% 26%
Reading scores in partner schools increased from baseline to midline and endline by 22% and 37% respectively, while comparison schools’ scores increased by 18% and 26%, respectively (see the last row of Table 18). Disaggregation by background variables shows that:
• Girls and students who attended preschool had consistently higher reading scores than boys and students who had not attended preschool. The higher scores were consistently found in the baseline, midline, and endline assessments and in partner and comparison schools.
• Students at secular schools had slightly higher reading scores than students at religious schools in sample partner schools. In comparison schools, however, religious school students had slightly higher scores than secular school students. This suggests that there is little difference in performance between the two kinds of schools. It should be noted that most of the religious schools tested were relatively well-resourced state schools.
• At baseline, students at private and public partner schools performed similarly on the reading test, although students at comparison private schools had higher reading scores. At both midline and endline, private school students had higher reading scores at both partner and comparison schools.
20 Assessing the Impact of the USAID PRIORITAS Program on Student Performance
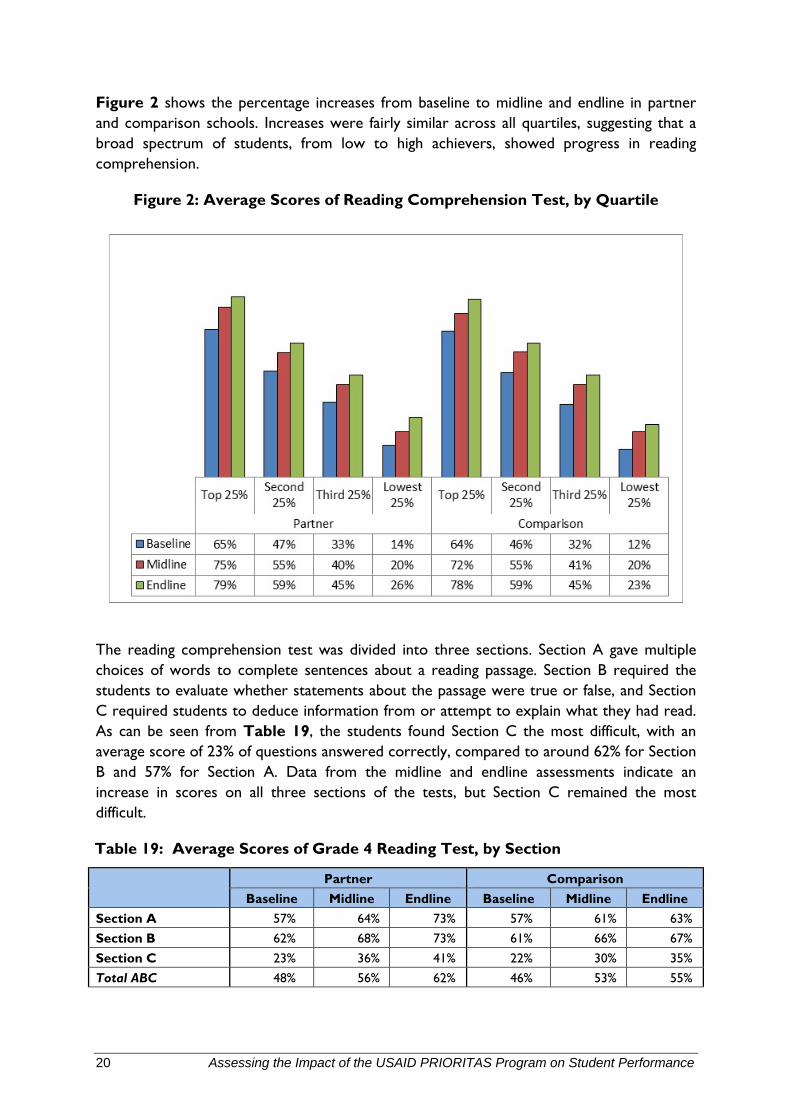
Figure 2 shows the percentage increases from baseline to midline and endline in partner and comparison schools. Increases were fairly similar across all quartiles, suggesting that a broad spectrum of students, from low to high achievers, showed progress in reading comprehension.
Figure 2: Average Scores of Reading Comprehension Test, by Quartile
The reading comprehension test was divided into three sections. Section A gave multiple choices of words to complete sentences about a reading passage. Section B required the students to evaluate whether statements about the passage were true or false, and Section C required students to deduce information from or attempt to explain what they had read. As can be seen from Table 19, the students found Section C the most difficult, with an average score of 23% of questions answered correctly, compared to around 62% for Section B and 57% for Section A. Data from the midline and endline assessments indicate an increase in scores on all three sections of the tests, but Section C remained the most difficult.
Table 19: Average Scores of Grade 4 Reading Test, by Section
Partner Comparison
Baseline Midline Endline Baseline Midline Endline Section A 57% 64% 73% 57% 61% 63% Section B 62% 68% 73% 61% 66% 67% Section C 23% 36% 41% 22% 30% 35% Total ABC 48% 56% 62% 46% 53% 55%
Assessing the Impact of the USAID PRIORITAS Program on Student Performance 21
2.2.3 Writing
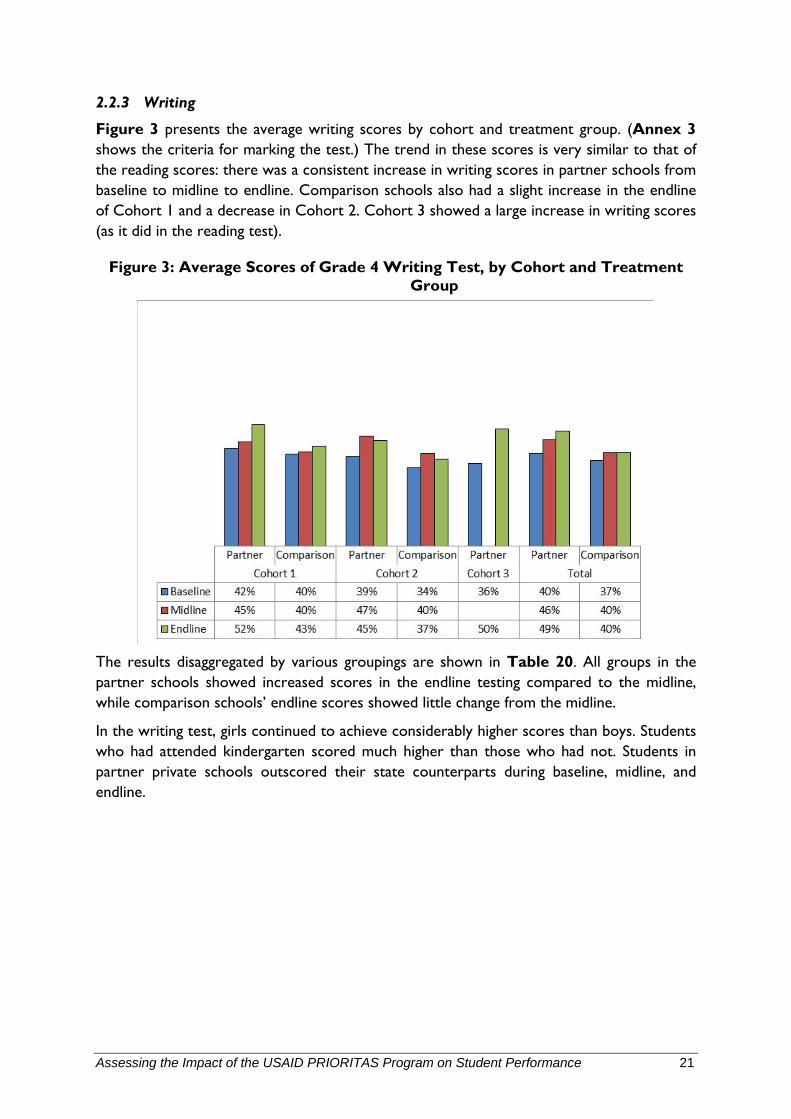
Figure 3 presents the average writing scores by cohort and treatment group. (Annex 3 shows the criteria for marking the test.) The trend in these scores is very similar to that of the reading scores: there was a consistent increase in writing scores in partner schools from baseline to midline to endline. Comparison schools also had a slight increase in the endline of Cohort 1 and a decrease in Cohort 2. Cohort 3 showed a large increase in writing scores (as it did in the reading test).
Figure 3: Average Scores of Grade 4 Writing Test, by Cohort and Treatment Group
The results disaggregated by various groupings are shown in Table 20. All groups in the partner schools showed increased scores in the endline testing compared to the midline, while comparison schools’ endline scores showed little change from the midline.
In the writing test, girls continued to achieve considerably higher scores than boys. Students who had attended kindergarten scored much higher than those who had not. Students in partner private schools outscored their state counterparts during baseline, midline, and endline.
22 Assessing the Impact of the USAID PRIORITAS Program on Student Performance
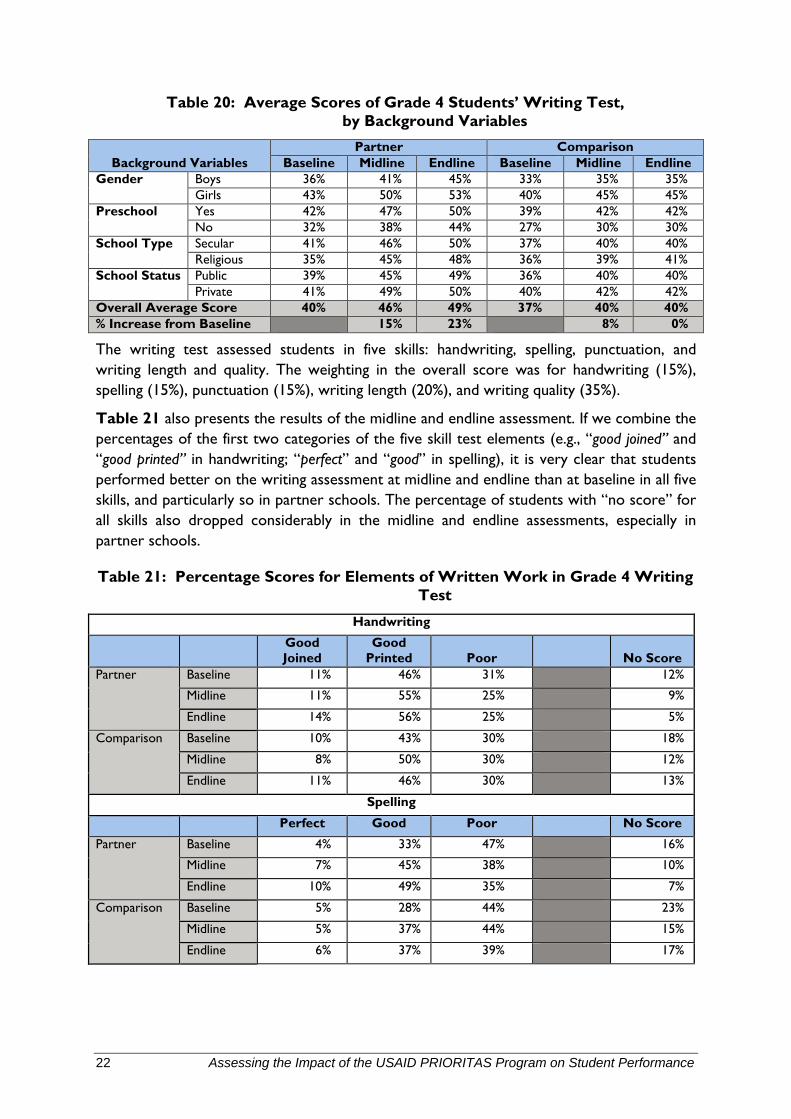
Table 20: Average Scores of Grade 4 Students’ Writing Test, by Background Variables
Background Variables Partner Comparison
Baseline Midline Endline Baseline Midline Endline Gender Boys 36% 41% 45% 33% 35% 35%
Girls 43% 50% 53% 40% 45% 45% Preschool Yes 42% 47% 50% 39% 42% 42%
No 32% 38% 44% 27% 30% 30% School Type Secular 41% 46% 50% 37% 40% 40%
Religious 35% 45% 48% 36% 39% 41% School Status Public 39% 45% 49% 36% 40% 40%
Private 41% 49% 50% 40% 42% 42% Overall Average Score 40% 46% 49% 37% 40% 40% % Increase from Baseline 15% 23% 8% 0%
The writing test assessed students in five skills: handwriting, spelling, punctuation, and writing length and quality. The weighting in the overall score was for handwriting (15%), spelling (15%), punctuation (15%), writing length (20%), and writing quality (35%).
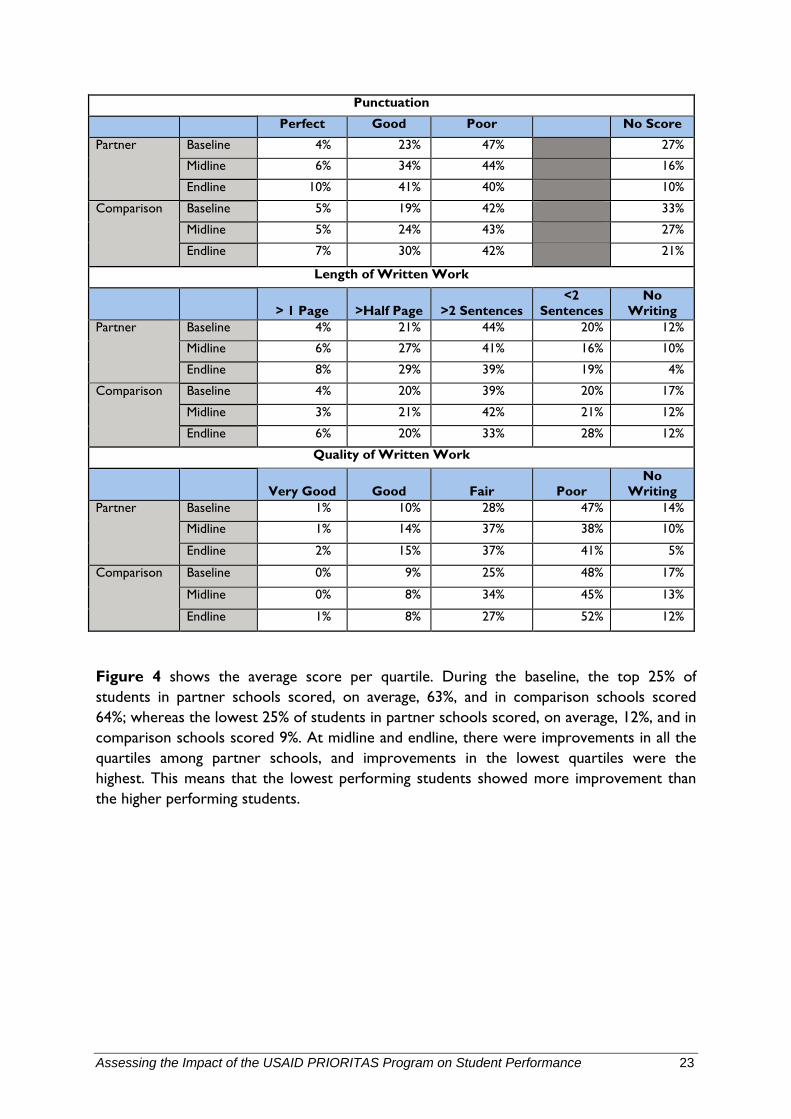
Table 21 also presents the results of the midline and endline assessment. If we combine the percentages of the first two categories of the five skill test elements (e.g., “good joined” and “good printed” in handwriting; “perfect” and “good” in spelling), it is very clear that students performed better on the writing assessment at midline and endline than at baseline in all five skills, and particularly so in partner schools. The percentage of students with “no score” for all skills also dropped considerably in the midline and endline assessments, especially in partner schools.
Table 21: Percentage Scores for Elements of Written Work in Grade 4 Writing Test
Handwriting
Good Joined
Good Printed Poor
No Score
Partner Baseline 11% 46% 31% 12%
Midline 11% 55% 25% 9%
Endline 14% 56% 25% 5%
Comparison Baseline 10% 43% 30% 18%
Midline 8% 50% 30% 12%
Endline 11% 46% 30% 13%
Spelling
Perfect Good Poor No Score
Partner Baseline 4% 33% 47% 16%
Midline 7% 45% 38% 10%
Endline 10% 49% 35% 7%
Comparison Baseline 5% 28% 44% 23%
Midline 5% 37% 44% 15%
Endline 6% 37% 39% 17%
Assessing the Impact of the USAID PRIORITAS Program on Student Performance 23
Punctuation
Perfect Good Poor No Score
Partner Baseline 4% 23% 47% 27%
Midline 6% 34% 44% 16%
Endline 10% 41% 40% 10%
Comparison Baseline 5% 19% 42% 33%
Midline 5% 24% 43% 27%
Endline 7% 30% 42% 21%
Length of Written Work
> 1 Page >Half Page >2 Sentences <2
Sentences No
Writing Partner Baseline 4% 21% 44% 20% 12%
Midline 6% 27% 41% 16% 10%
Endline 8% 29% 39% 19% 4%
Comparison Baseline 4% 20% 39% 20% 17%
Midline 3% 21% 42% 21% 12%
Endline 6% 20% 33% 28% 12%
Quality of Written Work
Very Good Good Fair Poor No
Writing Partner Baseline 1% 10% 28% 47% 14%
Midline 1% 14% 37% 38% 10%
Endline 2% 15% 37% 41% 5%
Comparison Baseline 0% 9% 25% 48% 17%
Midline 0% 8% 34% 45% 13%
Endline 1% 8% 27% 52% 12%
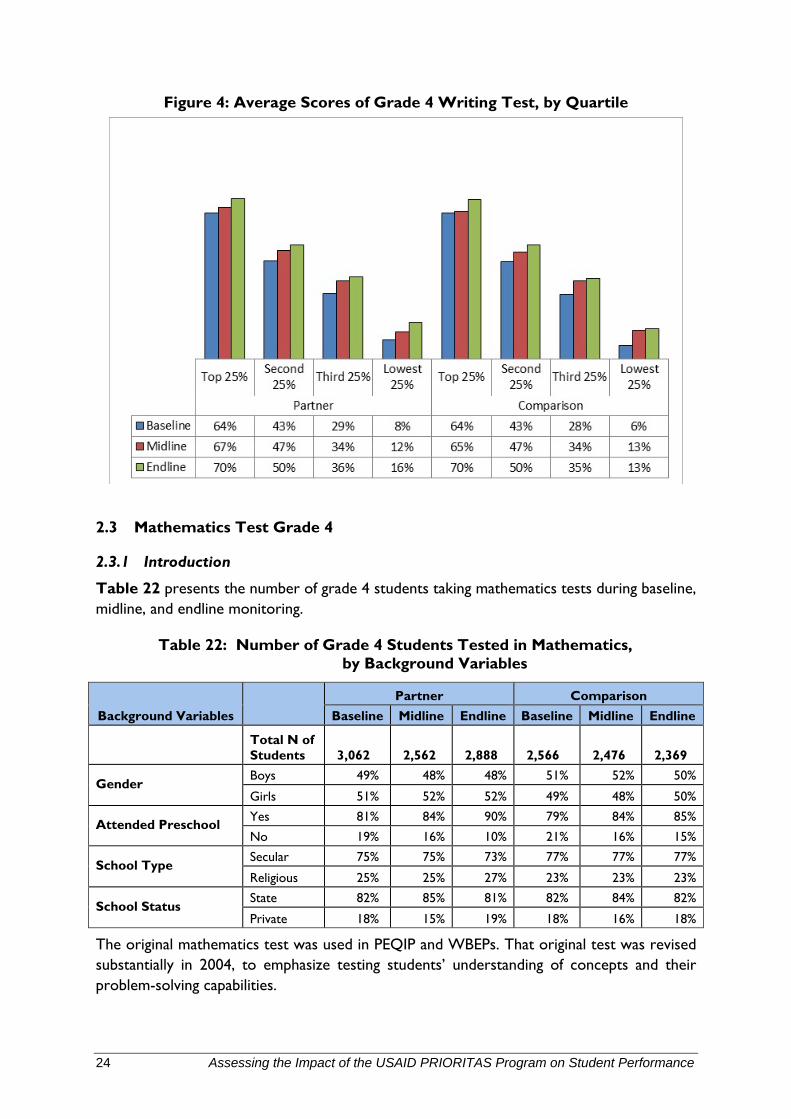
Figure 4 shows the average score per quartile. During the baseline, the top 25% of students in partner schools scored, on average, 63%, and in comparison schools scored 64%; whereas the lowest 25% of students in partner schools scored, on average, 12%, and in comparison schools scored 9%. At midline and endline, there were improvements in all the quartiles among partner schools, and improvements in the lowest quartiles were the highest. This means that the lowest performing students showed more improvement than the higher performing students.
24 Assessing the Impact of the USAID PRIORITAS Program on Student Performance
Figure 4: Average Scores of Grade 4 Writing Test, by Quartile
2.3 Mathematics Test Grade 4
2.3.1 Introduction
Table 22 presents the number of grade 4 students taking mathematics tests during baseline, midline, and endline monitoring.
Table 22: Number of Grade 4 Students Tested in Mathematics, by Background Variables
Background Variables
Partner Comparison Baseline Midline Endline Baseline Midline Endline
Total N of Students 3,062 2,562 2,888 2,566 2,476 2,369
Gender Boys 49% 48% 48% 51% 52% 50%
Girls 51% 52% 52% 49% 48% 50%
Attended Preschool Yes 81% 84% 90% 79% 84% 85%
No 19% 16% 10% 21% 16% 15%
School Type Secular 75% 75% 73% 77% 77% 77%
Religious 25% 25% 27% 23% 23% 23%
School Status State 82% 85% 81% 82% 84% 82%
Private 18% 15% 19% 18% 16% 18%
The original mathematics test was used in PEQIP and WBEPs. That original test was revised substantially in 2004, to emphasize testing students’ understanding of concepts and their problem-solving capabilities.
Assessing the Impact of the USAID PRIORITAS Program on Student Performance 25
2.3.2 The Results
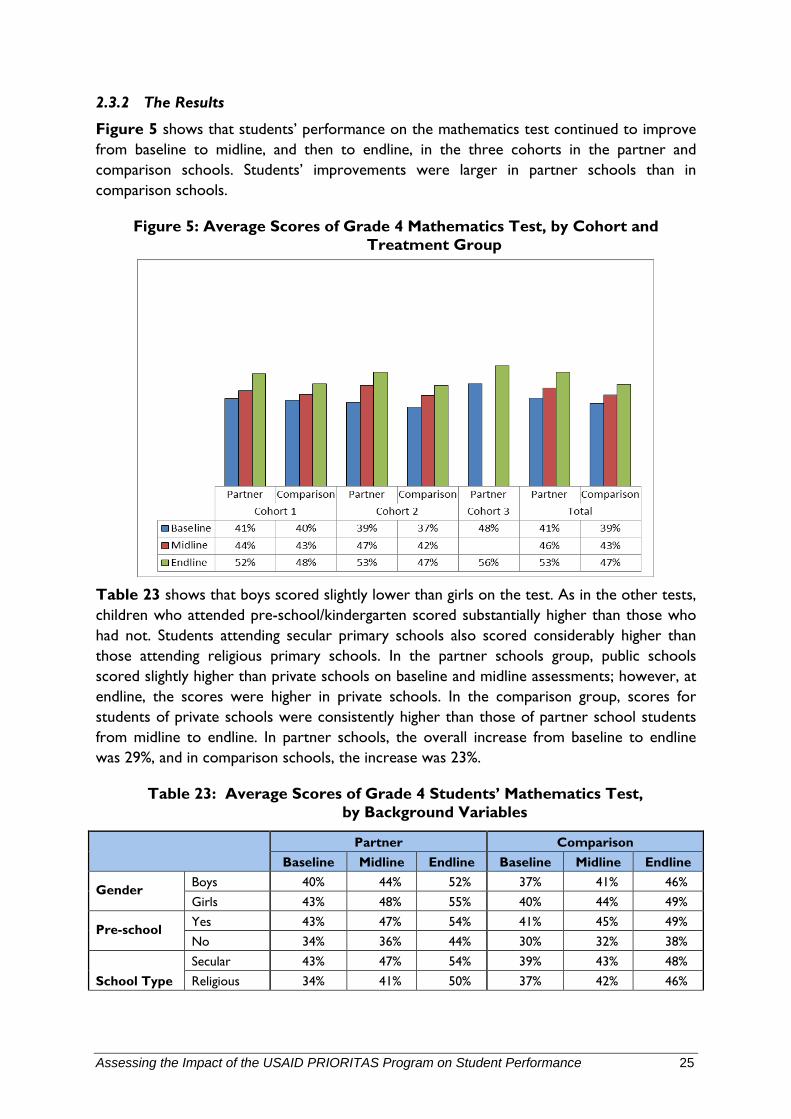
Figure 5 shows that students’ performance on the mathematics test continued to improve from baseline to midline, and then to endline, in the three cohorts in the partner and comparison schools. Students’ improvements were larger in partner schools than in comparison schools.
Figure 5: Average Scores of Grade 4 Mathematics Test, by Cohort and Treatment Group
Table 23 shows that boys scored slightly lower than girls on the test. As in the other tests, children who attended pre-school/kindergarten scored substantially higher than those who had not. Students attending secular primary schools also scored considerably higher than those attending religious primary schools. In the partner schools group, public schools scored slightly higher than private schools on baseline and midline assessments; however, at endline, the scores were higher in private schools. In the comparison group, scores for students of private schools were consistently higher than those of partner school students from midline to endline. In partner schools, the overall increase from baseline to endline was 29%, and in comparison schools, the increase was 23%.
Table 23: Average Scores of Grade 4 Students’ Mathematics Test, by Background Variables
Partner Comparison Baseline Midline Endline Baseline Midline Endline
Gender Boys 40% 44% 52% 37% 41% 46% Girls 43% 48% 55% 40% 44% 49%
Pre-school Yes 43% 47% 54% 41% 45% 49% No 34% 36% 44% 30% 32% 38%
School Type Secular 43% 47% 54% 39% 43% 48% Religious 34% 41% 50% 37% 42% 46%
26 Assessing the Impact of the USAID PRIORITAS Program on Student Performance
Partner Comparison Baseline Midline Endline Baseline Midline Endline
School Status
Public 42% 46% 53% 38% 42% 47% Private 39% 45% 56% 41% 45% 48%
Overall Average Score 41% 46% 53% 39% 43% 47% % Increase from Baseline
11% 29%
10% 23%
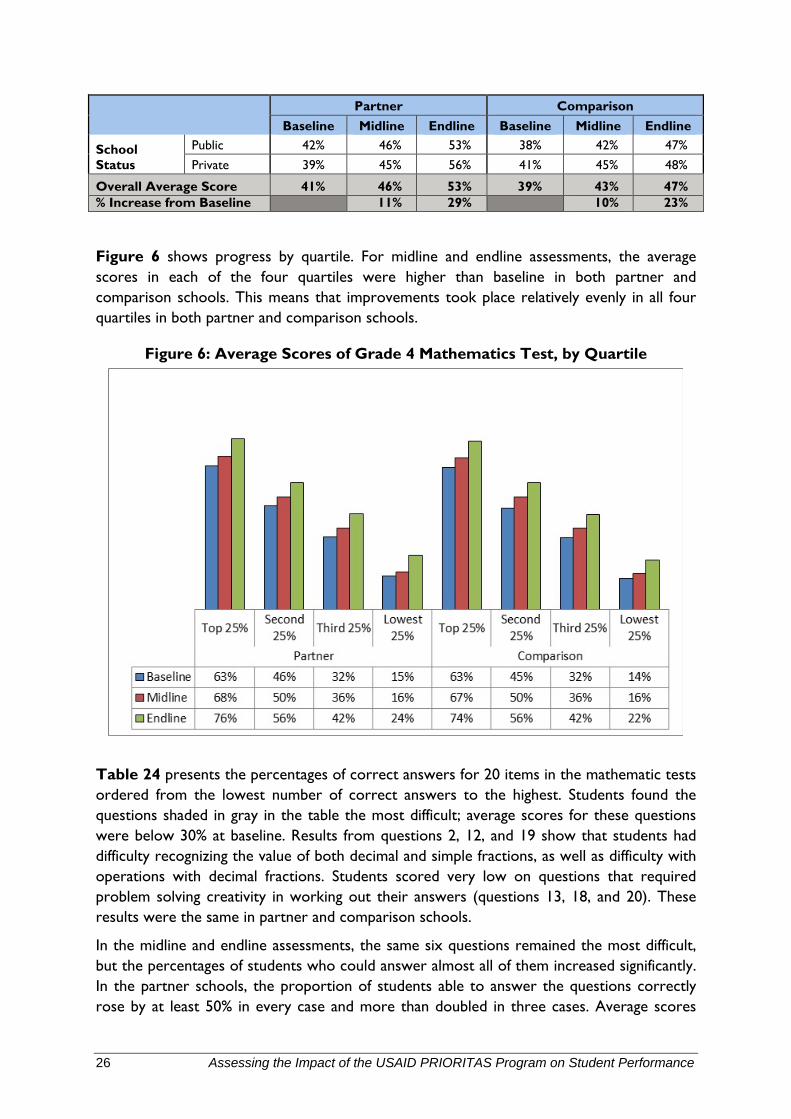
Figure 6 shows progress by quartile. For midline and endline assessments, the average scores in each of the four quartiles were higher than baseline in both partner and comparison schools. This means that improvements took place relatively evenly in all four quartiles in both partner and comparison schools.
Figure 6: Average Scores of Grade 4 Mathematics Test, by Quartile
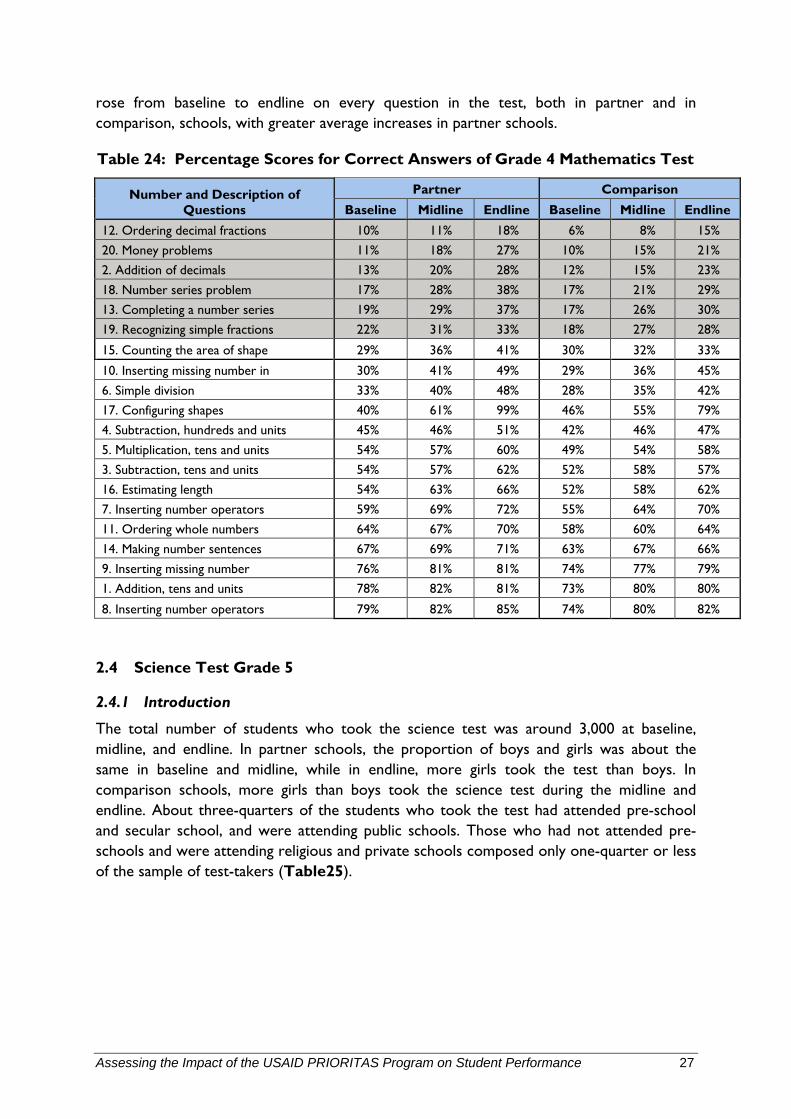
Table 24 presents the percentages of correct answers for 20 items in the mathematic tests ordered from the lowest number of correct answers to the highest. Students found the questions shaded in gray in the table the most difficult; average scores for these questions were below 30% at baseline. Results from questions 2, 12, and 19 show that students had difficulty recognizing the value of both decimal and simple fractions, as well as difficulty with operations with decimal fractions. Students scored very low on questions that required problem solving creativity in working out their answers (questions 13, 18, and 20). These results were the same in partner and comparison schools.
In the midline and endline assessments, the same six questions remained the most difficult, but the percentages of students who could answer almost all of them increased significantly. In the partner schools, the proportion of students able to answer the questions correctly rose by at least 50% in every case and more than doubled in three cases. Average scores
Assessing the Impact of the USAID PRIORITAS Program on Student Performance 27
rose from baseline to endline on every question in the test, both in partner and in comparison, schools, with greater average increases in partner schools.
Table 24: Percentage Scores for Correct Answers of Grade 4 Mathematics Test
Number and Description of Questions
Partner Comparison Baseline Midline Endline Baseline Midline Endline
12. Ordering decimal fractions 10% 11% 18% 6% 8% 15% 20. Money problems 11% 18% 27% 10% 15% 21% 2. Addition of decimals 13% 20% 28% 12% 15% 23% 18. Number series problem 17% 28% 38% 17% 21% 29% 13. Completing a number series 19% 29% 37% 17% 26% 30% 19. Recognizing simple fractions 22% 31% 33% 18% 27% 28%
15. Counting the area of shape 29% 36% 41% 30% 32% 33%
10. Inserting missing number in 30% 41% 49% 29% 36% 45% 6. Simple division 33% 40% 48% 28% 35% 42% 17. Configuring shapes 40% 61% 99% 46% 55% 79% 4. Subtraction, hundreds and units 45% 46% 51% 42% 46% 47% 5. Multiplication, tens and units 54% 57% 60% 49% 54% 58% 3. Subtraction, tens and units 54% 57% 62% 52% 58% 57% 16. Estimating length 54% 63% 66% 52% 58% 62% 7. Inserting number operators 59% 69% 72% 55% 64% 70% 11. Ordering whole numbers 64% 67% 70% 58% 60% 64% 14. Making number sentences 67% 69% 71% 63% 67% 66% 9. Inserting missing number 76% 81% 81% 74% 77% 79% 1. Addition, tens and units 78% 82% 81% 73% 80% 80%
8. Inserting number operators 79% 82% 85% 74% 80% 82%
2.4 Science Test Grade 5
2.4.1 Introduction
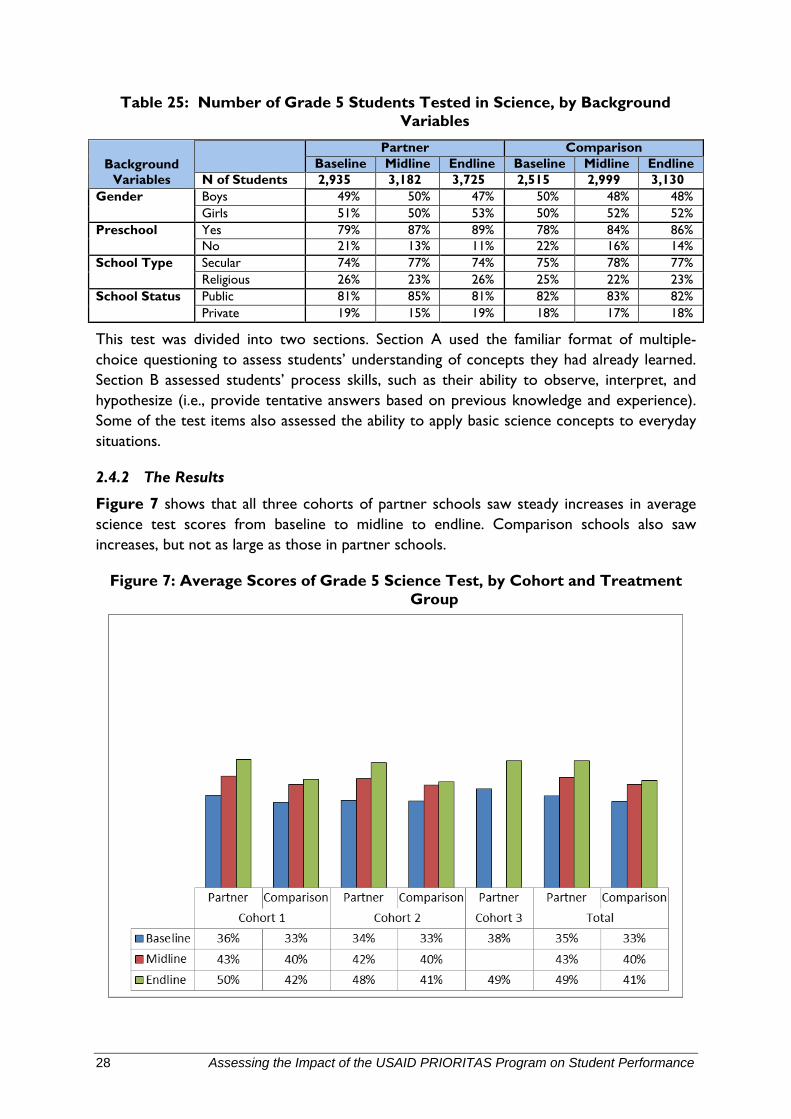
The total number of students who took the science test was around 3,000 at baseline, midline, and endline. In partner schools, the proportion of boys and girls was about the same in baseline and midline, while in endline, more girls took the test than boys. In comparison schools, more girls than boys took the science test during the midline and endline. About three-quarters of the students who took the test had attended pre-school and secular school, and were attending public schools. Those who had not attended pre-schools and were attending religious and private schools composed only one-quarter or less of the sample of test-takers (Table25).
28 Assessing the Impact of the USAID PRIORITAS Program on Student Performance
Table 25: Number of Grade 5 Students Tested in Science, by Background Variables
Background Variables
Partner Comparison Baseline Midline Endline Baseline Midline Endline
N of Students 2,935 3,182 3,725 2,515 2,999 3,130 Gender Boys 49% 50% 47% 50% 48% 48%
Girls 51% 50% 53% 50% 52% 52% Preschool Yes 79% 87% 89% 78% 84% 86%
No 21% 13% 11% 22% 16% 14% School Type Secular 74% 77% 74% 75% 78% 77%
Religious 26% 23% 26% 25% 22% 23% School Status Public 81% 85% 81% 82% 83% 82%
Private 19% 15% 19% 18% 17% 18%
This test was divided into two sections. Section A used the familiar format of multiple-choice questioning to assess students’ understanding of concepts they had already learned. Section B assessed students’ process skills, such as their ability to observe, interpret, and hypothesize (i.e., provide tentative answers based on previous knowledge and experience). Some of the test items also assessed the ability to apply basic science concepts to everyday situations.
2.4.2 The Results
Figure 7 shows that all three cohorts of partner schools saw steady increases in average science test scores from baseline to midline to endline. Comparison schools also saw increases, but not as large as those in partner schools.
Figure 7: Average Scores of Grade 5 Science Test, by Cohort and Treatment Group
Assessing the Impact of the USAID PRIORITAS Program on Student Performance 29
Table 26 shows that at baseline, the overall average score on the science test was 35% for students at partner schools and 33% for students at comparison schools. Boys scored slightly lower than girls on the test. As in the other tests, children who attended pre-school/kindergarten scored substantially higher than those who had not. Students attending secular primary schools also scored considerably higher than those attending religious primary schools, and students at public schools scored higher, both among partner schools and comparison schools.
By endline, students’ average score on the science test was 49% at partner schools and 41% at comparison schools (an increase of about 39% for partner and 25% for comparison schools). Endline results disaggregated for gender, etc., show the same trends as the overall averages.
Table 26: Average Scores of Grade 5 Students’ Science Test, by Background Variables
Background Variables Row Labels
Partner Comparison Baseline Midline Endline Baseline Midline Endline
Gender Boys 35% 42% 48% 33% 39% 41% Girls 36% 44% 50% 34% 41% 42%
Pre-school Yes 37% 44% 50% 35% 42% 43% No 28% 35% 38% 26% 30% 31%
School Type Secular 37% 44% 50% 34% 40% 42% Religious 30% 39% 47% 30% 39% 41%
School Status Public 35% 42% 49% 33% 39% 41% Private 36% 45% 51% 34% 42% 43%
Overall Average Score 35% 43% 49% 33% 40% 41% % Increase from Baseline 21% 39% 20% 25%
Figure 8 shows that students’ average scores increased in all four quartiles. All quartiles contributed to the increase of average scores at midline and endline, and the lowest quartile of students showed greater improvement than the others relative to their baseline scores.
30 Assessing the Impact of the USAID PRIORITAS Program on Student Performance
Figure 8: Average Scores of Grade 5 Science Test, by Quartile
As can be seen from Table 27 below, in the baseline assessment, students found the traditional format of questioning (with multiple-choice answers) in Section A much easier than Section B. In Section A, they scored an average of 44% (partner schools) and 43% (comparison schools). In Section B, where they scored an average of 32% and 29%, respectively, they were required to make deductions and apply concepts that they had learned. At midline and endline, students in partner schools still found the traditional format of questioning easier than making deductions and applying concepts, but the difference between the two sections was reduced (12% in baseline, 6% in midline, 4% in endline). Some narrowing of the gap also took place in the comparison schools (14% in baseline, 9% in midline, 8% in endline), but less than in the partner schools.
Table 27: Average Scores of Grade 5 Science Test, by Section
Partner Comparison Baseline Midline Endline Baseline Midline Endline
Average of Section A 44% 47% 52% 43% 46% 47% Average of Section B 32% 41% 48% 29% 37% 39%
Tables 28 and 29 show the average percentage of correct answers to individual questions. Students found the six questions, with average scores below 30% in the baseline test, shown in Table 28 the most difficult, probably because they had to interpret data and give open-ended answers, i.e., there were no multiple-choice answers from which to select. There were considerable increases in the scores on these questions from baseline to endline, especially in the partner schools, suggesting that students were getting better at interpreting data and answering open-ended questions.
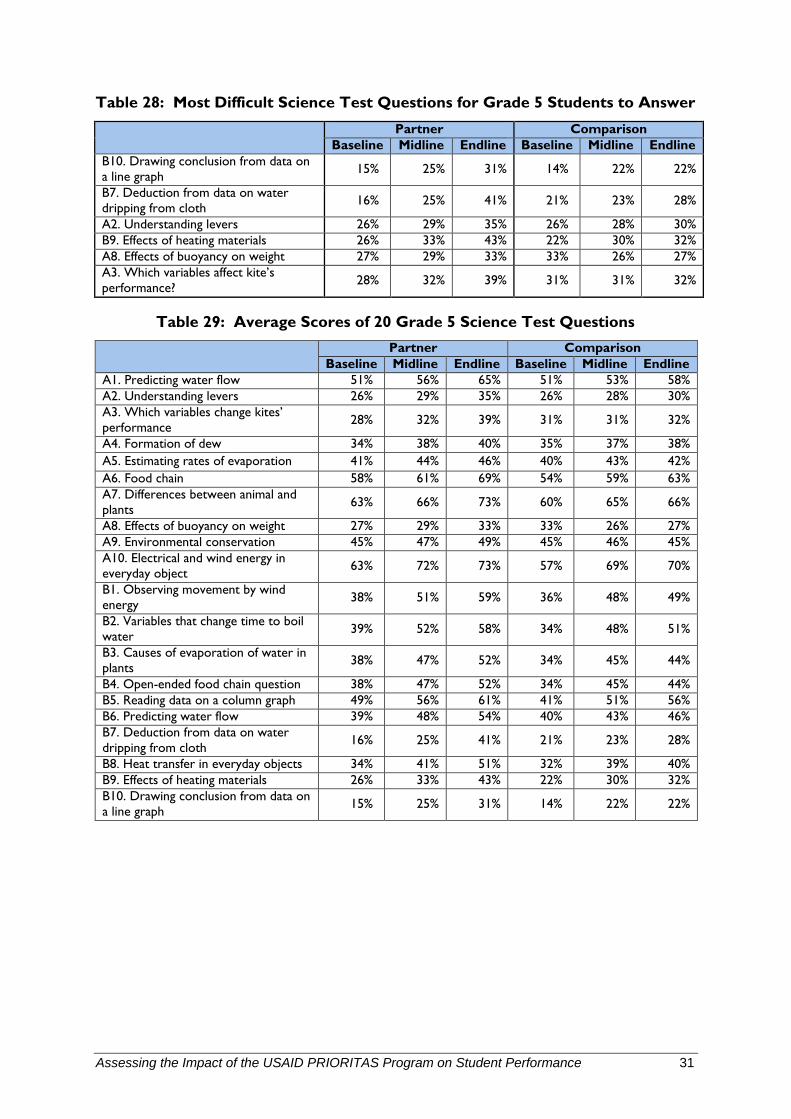
Assessing the Impact of the USAID PRIORITAS Program on Student Performance 31
Table 28: Most Difficult Science Test Questions for Grade 5 Students to Answer
Partner Comparison Baseline Midline Endline Baseline Midline Endline
B10. Drawing conclusion from data on a line graph 15% 25% 31% 14% 22% 22%
B7. Deduction from data on water dripping from cloth 16% 25% 41% 21% 23% 28%
A2. Understanding levers 26% 29% 35% 26% 28% 30% B9. Effects of heating materials 26% 33% 43% 22% 30% 32% A8. Effects of buoyancy on weight 27% 29% 33% 33% 26% 27% A3. Which variables affect kite’s performance? 28% 32% 39% 31% 31% 32%
Table 29: Average Scores of 20 Grade 5 Science Test Questions
Partner Comparison
Baseline Midline Endline Baseline Midline Endline A1. Predicting water flow 51% 56% 65% 51% 53% 58% A2. Understanding levers 26% 29% 35% 26% 28% 30% A3. Which variables change kites’ performance 28% 32% 39% 31% 31% 32%
A4. Formation of dew 34% 38% 40% 35% 37% 38% A5. Estimating rates of evaporation 41% 44% 46% 40% 43% 42% A6. Food chain 58% 61% 69% 54% 59% 63% A7. Differences between animal and plants 63% 66% 73% 60% 65% 66%
A8. Effects of buoyancy on weight 27% 29% 33% 33% 26% 27% A9. Environmental conservation 45% 47% 49% 45% 46% 45% A10. Electrical and wind energy in everyday object 63% 72% 73% 57% 69% 70%
B1. Observing movement by wind energy 38% 51% 59% 36% 48% 49%
B2. Variables that change time to boil water 39% 52% 58% 34% 48% 51%
B3. Causes of evaporation of water in plants 38% 47% 52% 34% 45% 44%
B4. Open-ended food chain question 38% 47% 52% 34% 45% 44% B5. Reading data on a column graph 49% 56% 61% 41% 51% 56% B6. Predicting water flow 39% 48% 54% 40% 43% 46% B7. Deduction from data on water dripping from cloth 16% 25% 41% 21% 23% 28%
B8. Heat transfer in everyday objects 34% 41% 51% 32% 39% 40% B9. Effects of heating materials 26% 33% 43% 22% 30% 32% B10. Drawing conclusion from data on a line graph 15% 25% 31% 14% 22% 22%
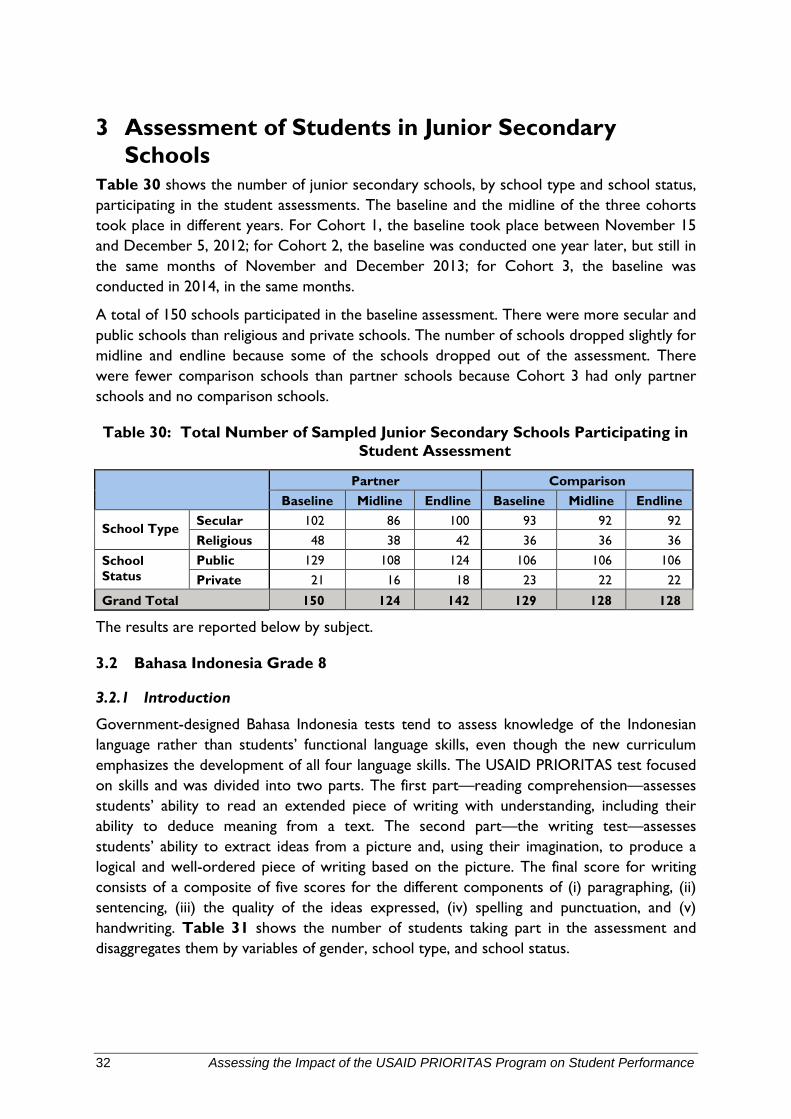
32 Assessing the Impact of the USAID PRIORITAS Program on Student Performance
3 Assessment of Students in Junior Secondary Schools
Table 30 shows the number of junior secondary schools, by school type and school status, participating in the student assessments. The baseline and the midline of the three cohorts took place in different years. For Cohort 1, the baseline took place between November 15 and December 5, 2012; for Cohort 2, the baseline was conducted one year later, but still in the same months of November and December 2013; for Cohort 3, the baseline was conducted in 2014, in the same months.
A total of 150 schools participated in the baseline assessment. There were more secular and public schools than religious and private schools. The number of schools dropped slightly for midline and endline because some of the schools dropped out of the assessment. There were fewer comparison schools than partner schools because Cohort 3 had only partner schools and no comparison schools.
Table 30: Total Number of Sampled Junior Secondary Schools Participating in Student Assessment
Partner Comparison
Baseline Midline Endline Baseline Midline Endline
School Type Secular 102 86 100 93 92 92 Religious 48 38 42 36 36 36
School Status
Public 129 108 124 106 106 106 Private 21 16 18 23 22 22
Grand Total 150 124 142 129 128 128
The results are reported below by subject.
3.2 Bahasa Indonesia Grade 8
3.2.1 Introduction
Government-designed Bahasa Indonesia tests tend to assess knowledge of the Indonesian language rather than students’ functional language skills, even though the new curriculum emphasizes the development of all four language skills. The USAID PRIORITAS test focused on skills and was divided into two parts. The first part—reading comprehension—assesses students’ ability to read an extended piece of writing with understanding, including their ability to deduce meaning from a text. The second part—the writing test—assesses students’ ability to extract ideas from a picture and, using their imagination, to produce a logical and well-ordered piece of writing based on the picture. The final score for writing consists of a composite of five scores for the different components of (i) paragraphing, (ii) sentencing, (iii) the quality of the ideas expressed, (iv) spelling and punctuation, and (v) handwriting. Table 31 shows the number of students taking part in the assessment and disaggregates them by variables of gender, school type, and school status.
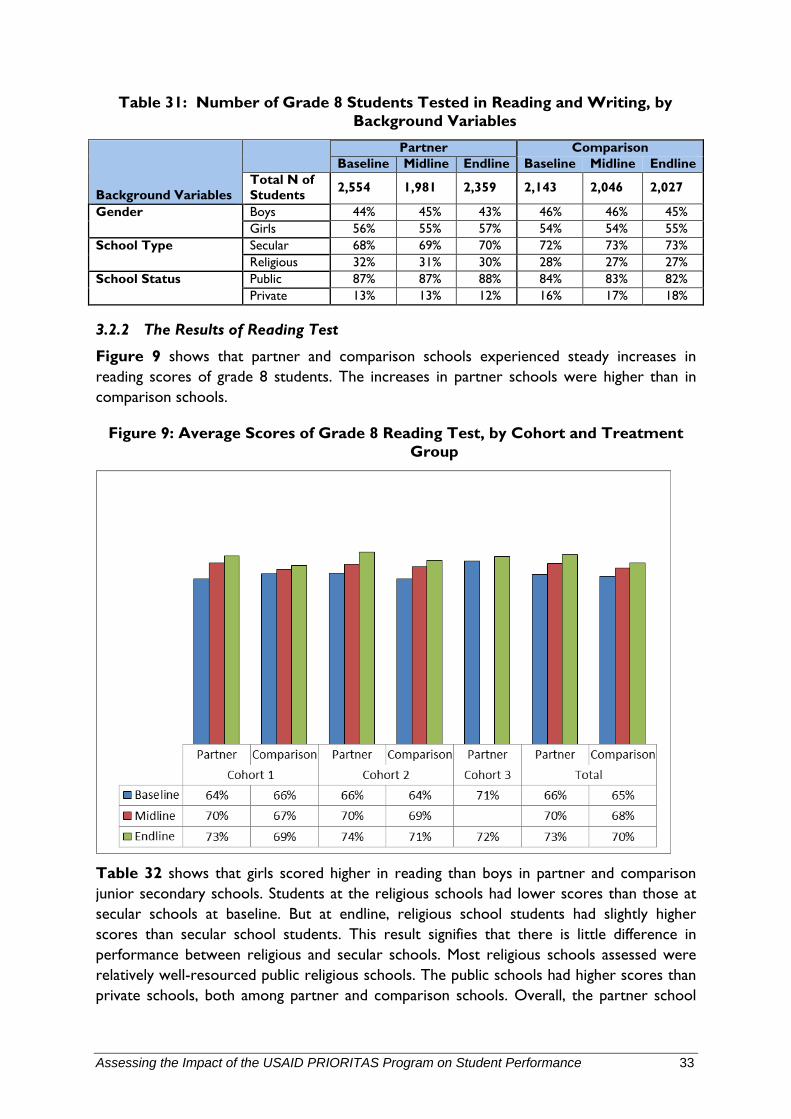
Assessing the Impact of the USAID PRIORITAS Program on Student Performance 33
Table 31: Number of Grade 8 Students Tested in Reading and Writing, by Background Variables
Background Variables
Partner Comparison Baseline Midline Endline Baseline Midline Endline
Total N of Students 2,554 1,981 2,359 2,143 2,046 2,027
Gender Boys 44% 45% 43% 46% 46% 45% Girls 56% 55% 57% 54% 54% 55%
School Type Secular 68% 69% 70% 72% 73% 73% Religious 32% 31% 30% 28% 27% 27%
School Status Public 87% 87% 88% 84% 83% 82% Private 13% 13% 12% 16% 17% 18%
3.2.2 The Results of Reading Test
Figure 9 shows that partner and comparison schools experienced steady increases in reading scores of grade 8 students. The increases in partner schools were higher than in comparison schools.
Figure 9: Average Scores of Grade 8 Reading Test, by Cohort and Treatment Group
Table 32 shows that girls scored higher in reading than boys in partner and comparison junior secondary schools. Students at the religious schools had lower scores than those at secular schools at baseline. But at endline, religious school students had slightly higher scores than secular school students. This result signifies that there is little difference in performance between religious and secular schools. Most religious schools assessed were relatively well-resourced public religious schools. The public schools had higher scores than private schools, both among partner and comparison schools. Overall, the partner school
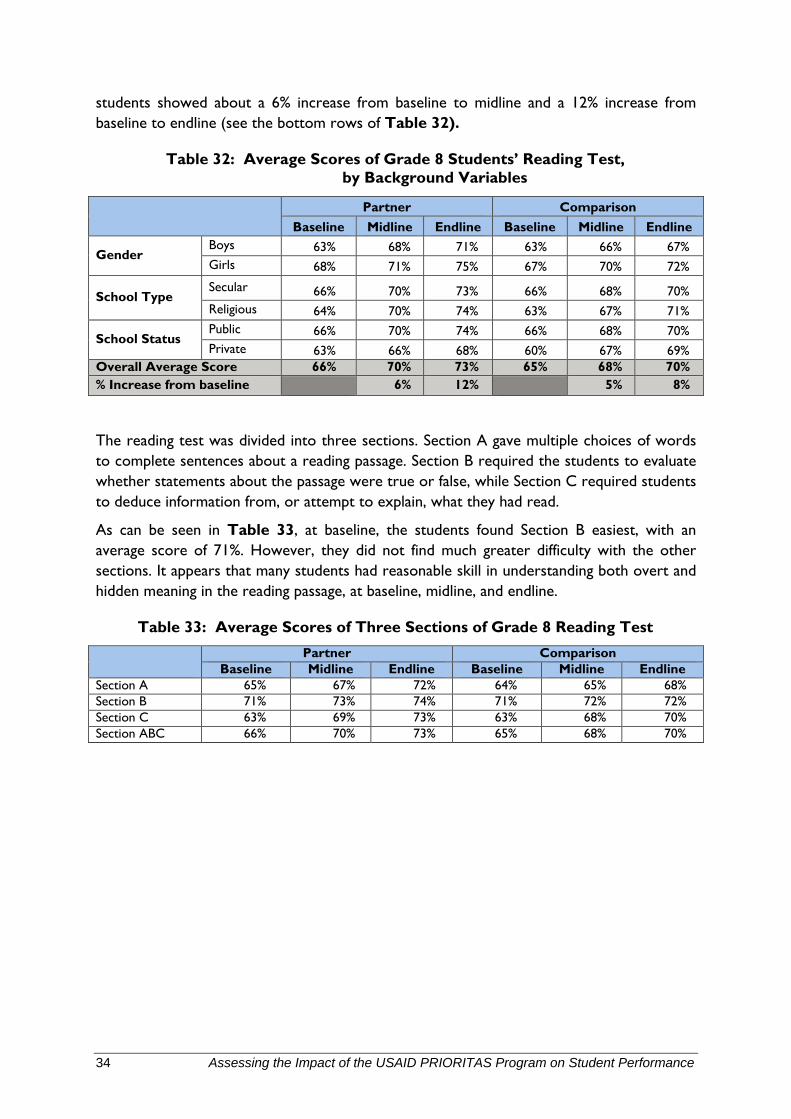
34 Assessing the Impact of the USAID PRIORITAS Program on Student Performance
students showed about a 6% increase from baseline to midline and a 12% increase from baseline to endline (see the bottom rows of Table 32).
Table 32: Average Scores of Grade 8 Students’ Reading Test, by Background Variables
Partner Comparison Baseline Midline Endline Baseline Midline Endline
Gender Boys 63% 68% 71% 63% 66% 67% Girls 68% 71% 75% 67% 70% 72%
School Type Secular 66% 70% 73% 66% 68% 70% Religious 64% 70% 74% 63% 67% 71%
School Status Public 66% 70% 74% 66% 68% 70% Private 63% 66% 68% 60% 67% 69%
Overall Average Score 66% 70% 73% 65% 68% 70% % Increase from baseline 6% 12% 5% 8%
The reading test was divided into three sections. Section A gave multiple choices of words to complete sentences about a reading passage. Section B required the students to evaluate whether statements about the passage were true or false, while Section C required students to deduce information from, or attempt to explain, what they had read.
As can be seen in Table 33, at baseline, the students found Section B easiest, with an average score of 71%. However, they did not find much greater difficulty with the other sections. It appears that many students had reasonable skill in understanding both overt and hidden meaning in the reading passage, at baseline, midline, and endline.
Table 33: Average Scores of Three Sections of Grade 8 Reading Test
Partner Comparison
Baseline Midline Endline Baseline Midline Endline Section A 65% 67% 72% 64% 65% 68% Section B 71% 73% 74% 71% 72% 72% Section C 63% 69% 73% 63% 68% 70% Section ABC 66% 70% 73% 65% 68% 70%
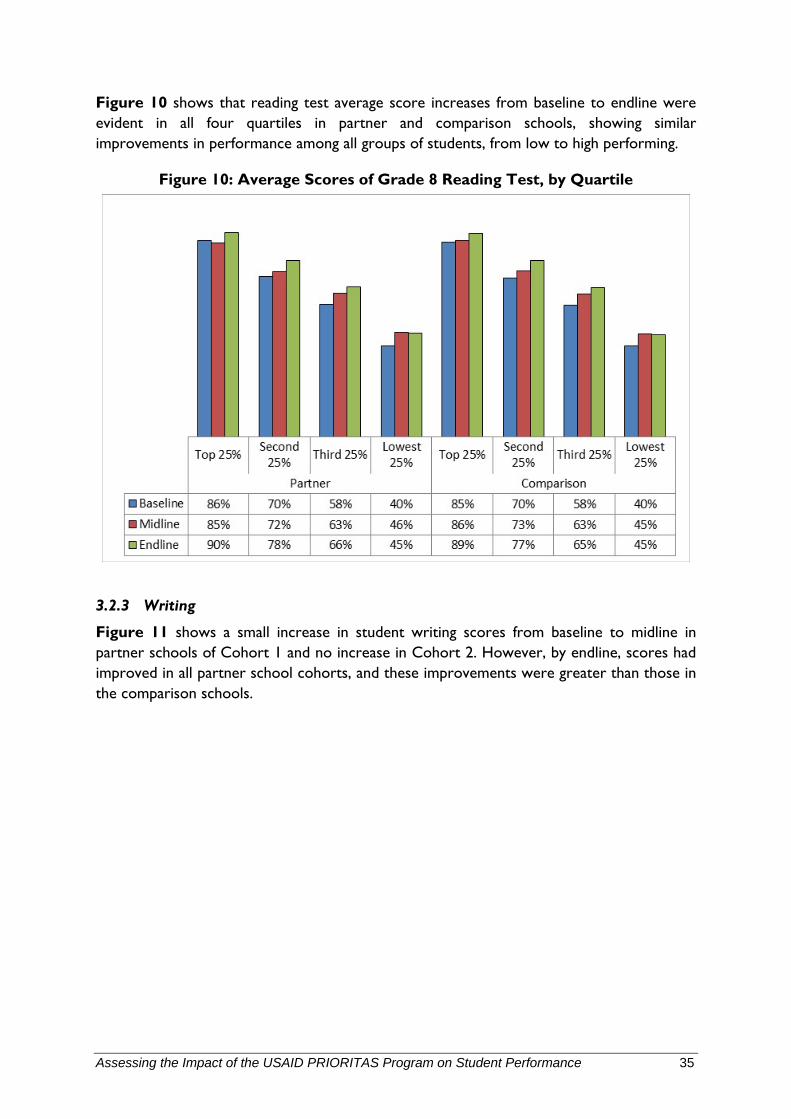
Assessing the Impact of the USAID PRIORITAS Program on Student Performance 35
Figure 10 shows that reading test average score increases from baseline to endline were evident in all four quartiles in partner and comparison schools, showing similar improvements in performance among all groups of students, from low to high performing.
Figure 10: Average Scores of Grade 8 Reading Test, by Quartile
3.2.3 Writing
Figure 11 shows a small increase in student writing scores from baseline to midline in partner schools of Cohort 1 and no increase in Cohort 2. However, by endline, scores had improved in all partner school cohorts, and these improvements were greater than those in the comparison schools.
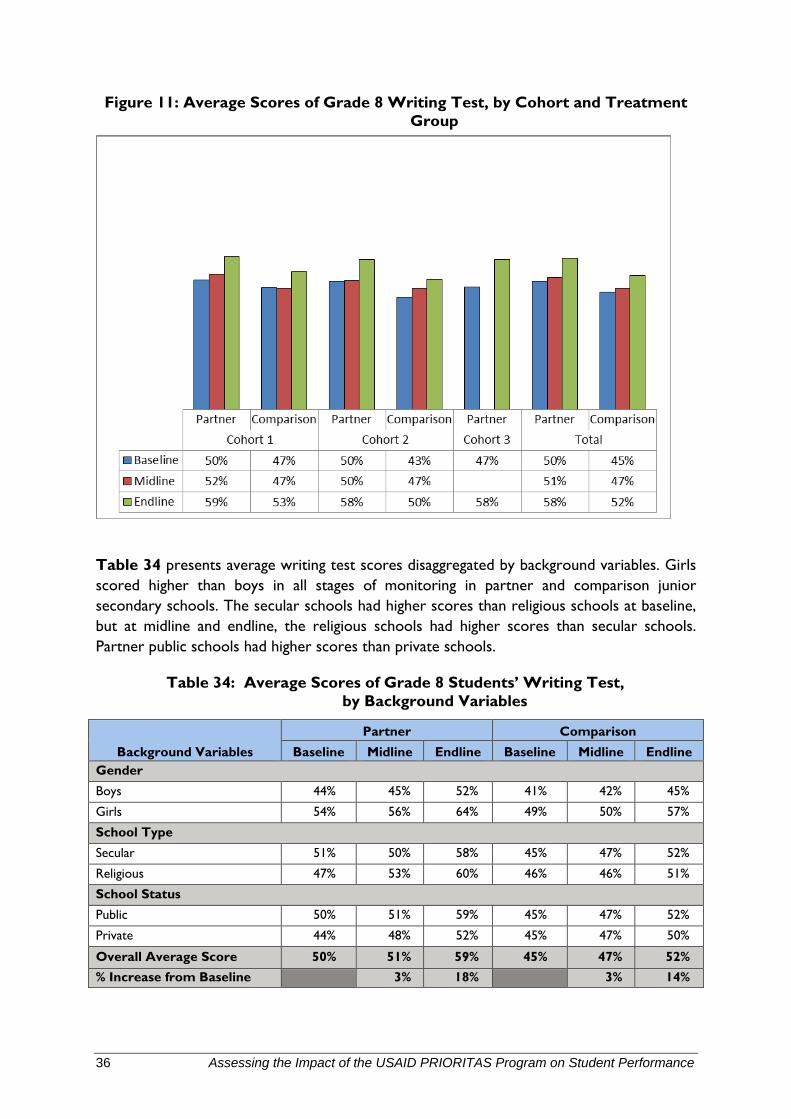
36 Assessing the Impact of the USAID PRIORITAS Program on Student Performance
Figure 11: Average Scores of Grade 8 Writing Test, by Cohort and Treatment Group
Table 34 presents average writing test scores disaggregated by background variables. Girls scored higher than boys in all stages of monitoring in partner and comparison junior secondary schools. The secular schools had higher scores than religious schools at baseline, but at midline and endline, the religious schools had higher scores than secular schools. Partner public schools had higher scores than private schools.
Table 34: Average Scores of Grade 8 Students’ Writing Test, by Background Variables
Background Variables Partner Comparison
Baseline Midline Endline Baseline Midline Endline Gender Boys 44% 45% 52% 41% 42% 45%
Girls 54% 56% 64% 49% 50% 57%
School Type Secular 51% 50% 58% 45% 47% 52%
Religious 47% 53% 60% 46% 46% 51%
School Status Public 50% 51% 59% 45% 47% 52%
Private 44% 48% 52% 45% 47% 50%
Overall Average Score 50% 51% 59% 45% 47% 52% % Increase from Baseline 3% 18% 3% 14%
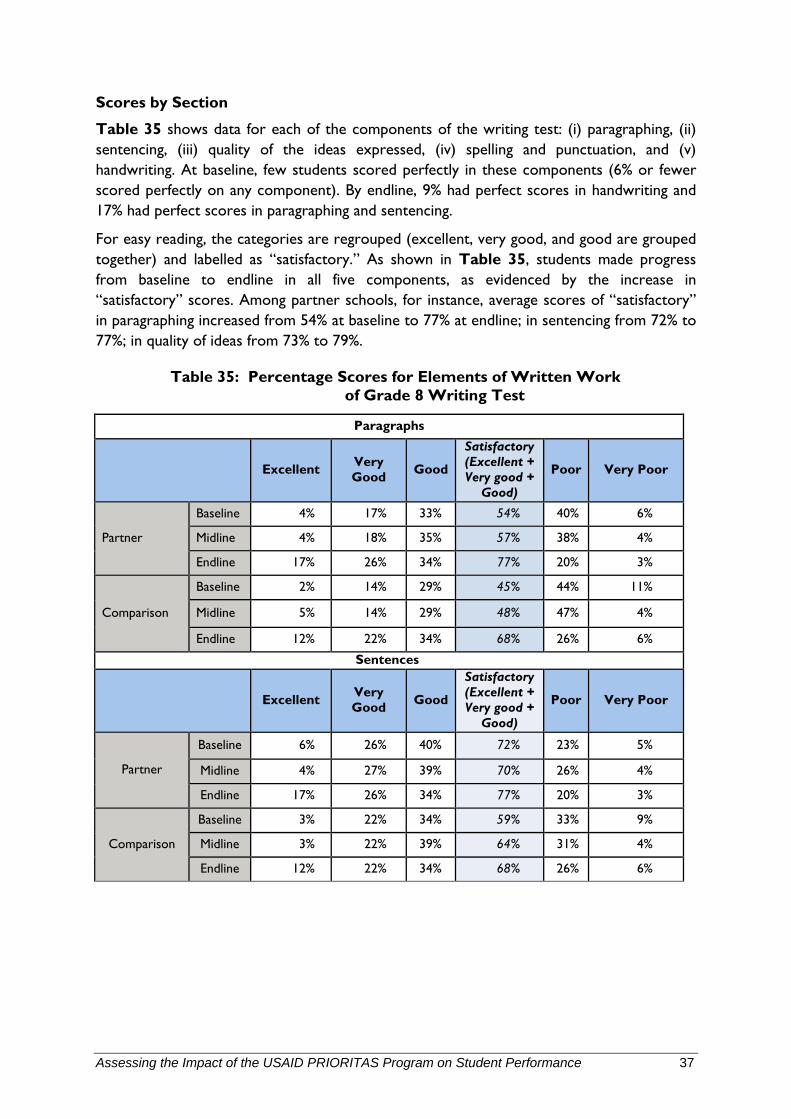
Assessing the Impact of the USAID PRIORITAS Program on Student Performance 37
Scores by Section
Table 35 shows data for each of the components of the writing test: (i) paragraphing, (ii) sentencing, (iii) quality of the ideas expressed, (iv) spelling and punctuation, and (v) handwriting. At baseline, few students scored perfectly in these components (6% or fewer scored perfectly on any component). By endline, 9% had perfect scores in handwriting and 17% had perfect scores in paragraphing and sentencing.
For easy reading, the categories are regrouped (excellent, very good, and good are grouped together) and labelled as “satisfactory.” As shown in Table 35, students made progress from baseline to endline in all five components, as evidenced by the increase in “satisfactory” scores. Among partner schools, for instance, average scores of “satisfactory” in paragraphing increased from 54% at baseline to 77% at endline; in sentencing from 72% to 77%; in quality of ideas from 73% to 79%.
Table 35: Percentage Scores for Elements of Written Work of Grade 8 Writing Test
Paragraphs
Excellent Very Good Good
Satisfactory (Excellent + Very good +
Good)
Poor Very Poor
Partner
Baseline 4% 17% 33% 54% 40% 6%
Midline 4% 18% 35% 57% 38% 4%
Endline 17% 26% 34% 77% 20% 3%
Comparison
Baseline 2% 14% 29% 45% 44% 11%
Midline 5% 14% 29% 48% 47% 4%
Endline 12% 22% 34% 68% 26% 6%
Sentences
Excellent Very Good Good
Satisfactory (Excellent + Very good +
Good)
Poor Very Poor
Partner
Baseline 6% 26% 40% 72% 23% 5%
Midline 4% 27% 39% 70% 26% 4%
Endline 17% 26% 34% 77% 20% 3%
Comparison
Baseline 3% 22% 34% 59% 33% 9%
Midline 3% 22% 39% 64% 31% 4%
Endline 12% 22% 34% 68% 26% 6%
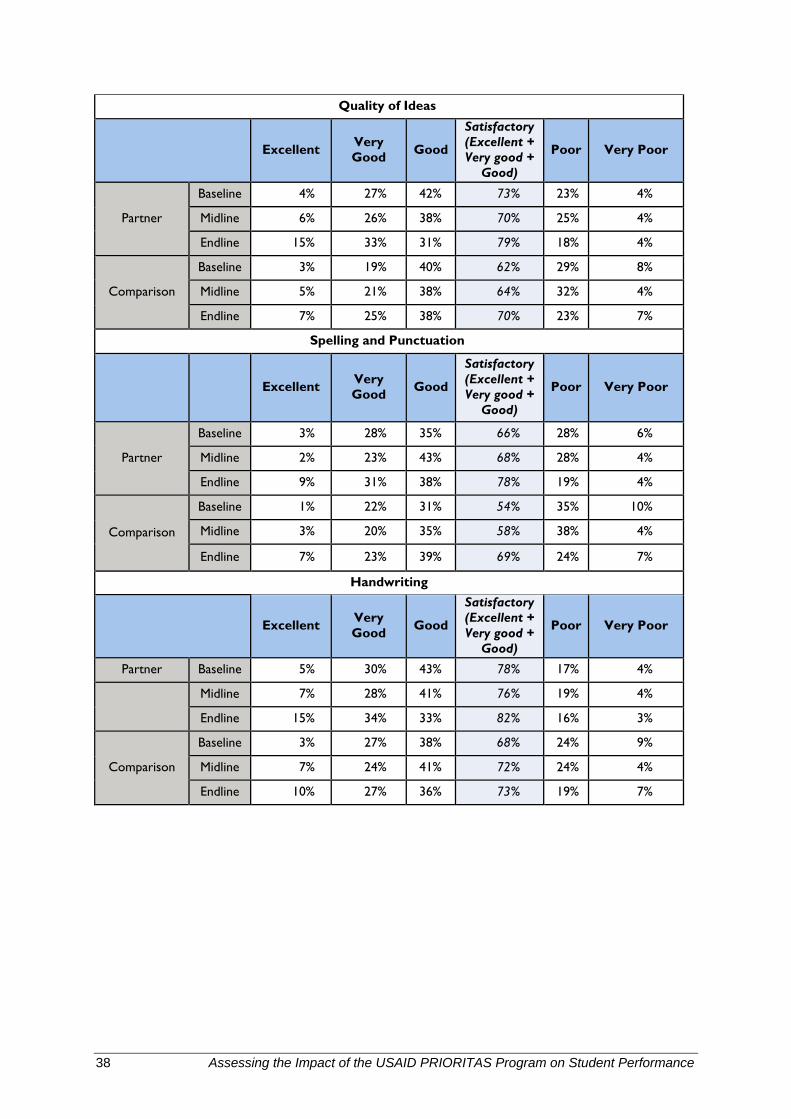
38 Assessing the Impact of the USAID PRIORITAS Program on Student Performance
Quality of Ideas
Excellent Very Good Good
Satisfactory (Excellent + Very good +
Good)
Poor Very Poor
Partner
Baseline 4% 27% 42% 73% 23% 4%
Midline 6% 26% 38% 70% 25% 4%
Endline 15% 33% 31% 79% 18% 4%
Comparison
Baseline 3% 19% 40% 62% 29% 8%
Midline 5% 21% 38% 64% 32% 4%
Endline 7% 25% 38% 70% 23% 7%
Spelling and Punctuation
Excellent Very Good Good
Satisfactory (Excellent + Very good +
Good)
Poor Very Poor
Partner
Baseline 3% 28% 35% 66% 28% 6%
Midline 2% 23% 43% 68% 28% 4%
Endline 9% 31% 38% 78% 19% 4%
Comparison
Baseline 1% 22% 31% 54% 35% 10%
Midline 3% 20% 35% 58% 38% 4%
Endline 7% 23% 39% 69% 24% 7%
Handwriting
Excellent Very
Good Good
Satisfactory (Excellent + Very good +
Good)
Poor Very Poor
Partner Baseline 5% 30% 43% 78% 17% 4%
Midline 7% 28% 41% 76% 19% 4%
Endline 15% 34% 33% 82% 16% 3%
Comparison
Baseline 3% 27% 38% 68% 24% 9%
Midline 7% 24% 41% 72% 24% 4%
Endline 10% 27% 36% 73% 19% 7%
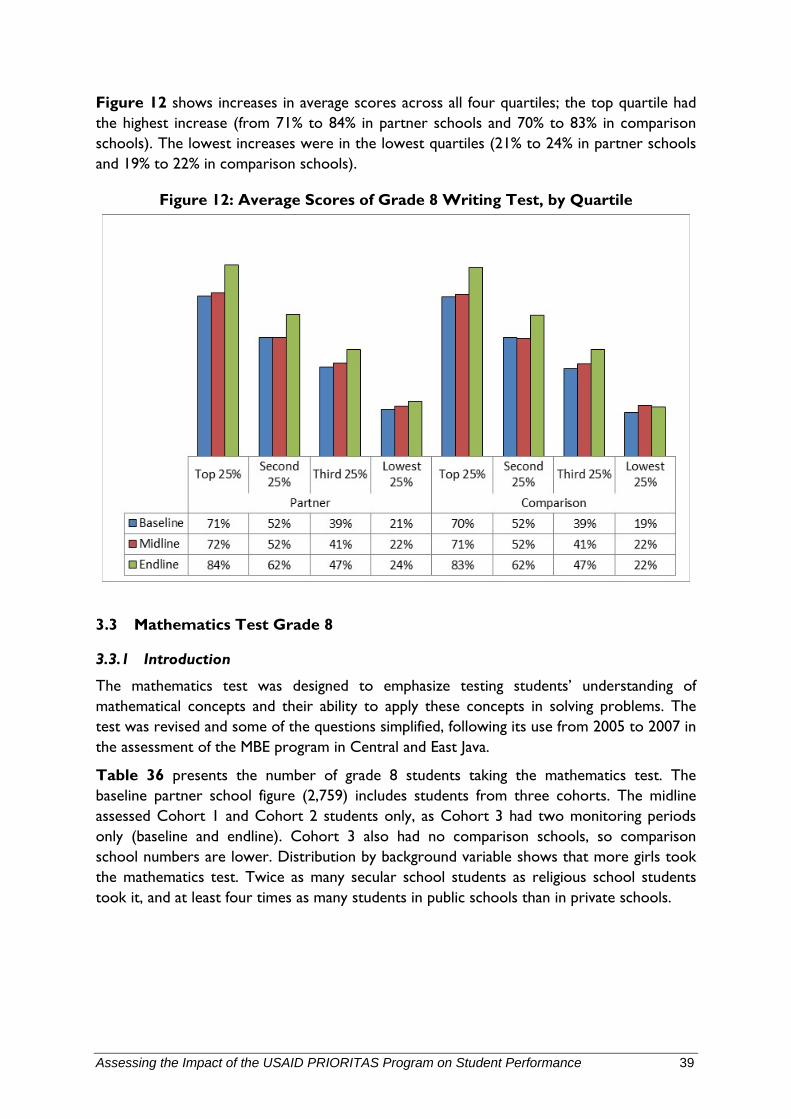
Assessing the Impact of the USAID PRIORITAS Program on Student Performance 39
Figure 12 shows increases in average scores across all four quartiles; the top quartile had the highest increase (from 71% to 84% in partner schools and 70% to 83% in comparison schools). The lowest increases were in the lowest quartiles (21% to 24% in partner schools and 19% to 22% in comparison schools).
Figure 12: Average Scores of Grade 8 Writing Test, by Quartile
3.3 Mathematics Test Grade 8
3.3.1 Introduction
The mathematics test was designed to emphasize testing students’ understanding of mathematical concepts and their ability to apply these concepts in solving problems. The test was revised and some of the questions simplified, following its use from 2005 to 2007 in the assessment of the MBE program in Central and East Java.
Table 36 presents the number of grade 8 students taking the mathematics test. The baseline partner school figure (2,759) includes students from three cohorts. The midline assessed Cohort 1 and Cohort 2 students only, as Cohort 3 had two monitoring periods only (baseline and endline). Cohort 3 also had no comparison schools, so comparison school numbers are lower. Distribution by background variable shows that more girls took the mathematics test. Twice as many secular school students as religious school students took it, and at least four times as many students in public schools than in private schools.
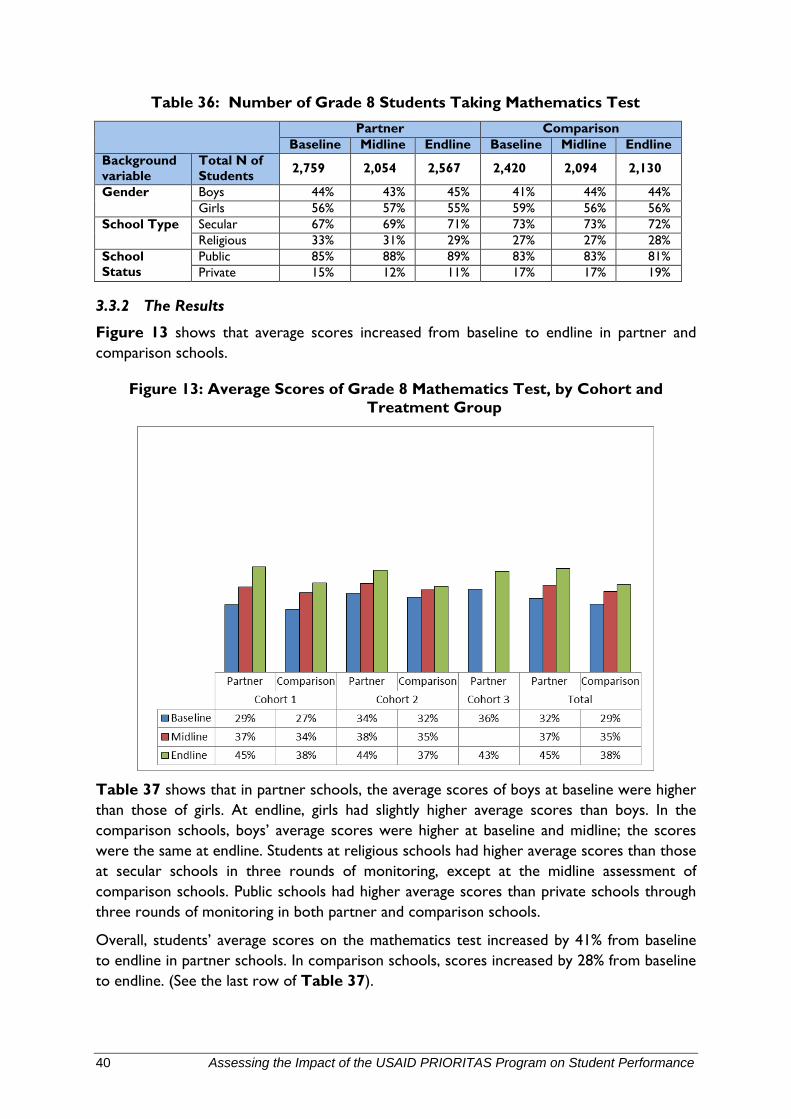
40 Assessing the Impact of the USAID PRIORITAS Program on Student Performance
Table 36: Number of Grade 8 Students Taking Mathematics Test
Partner Comparison Baseline Midline Endline Baseline Midline Endline
Background variable
Total N of Students 2,759 2,054 2,567 2,420 2,094 2,130
Gender Boys 44% 43% 45% 41% 44% 44% Girls 56% 57% 55% 59% 56% 56%
School Type Secular 67% 69% 71% 73% 73% 72% Religious 33% 31% 29% 27% 27% 28%
School Status
Public 85% 88% 89% 83% 83% 81% Private 15% 12% 11% 17% 17% 19%
3.3.2 The Results
Figure 13 shows that average scores increased from baseline to endline in partner and comparison schools.
Figure 13: Average Scores of Grade 8 Mathematics Test, by Cohort and Treatment Group
Table 37 shows that in partner schools, the average scores of boys at baseline were higher than those of girls. At endline, girls had slightly higher average scores than boys. In the comparison schools, boys’ average scores were higher at baseline and midline; the scores were the same at endline. Students at religious schools had higher average scores than those at secular schools in three rounds of monitoring, except at the midline assessment of comparison schools. Public schools had higher average scores than private schools through three rounds of monitoring in both partner and comparison schools.
Overall, students’ average scores on the mathematics test increased by 41% from baseline to endline in partner schools. In comparison schools, scores increased by 28% from baseline to endline. (See the last row of Table 37).
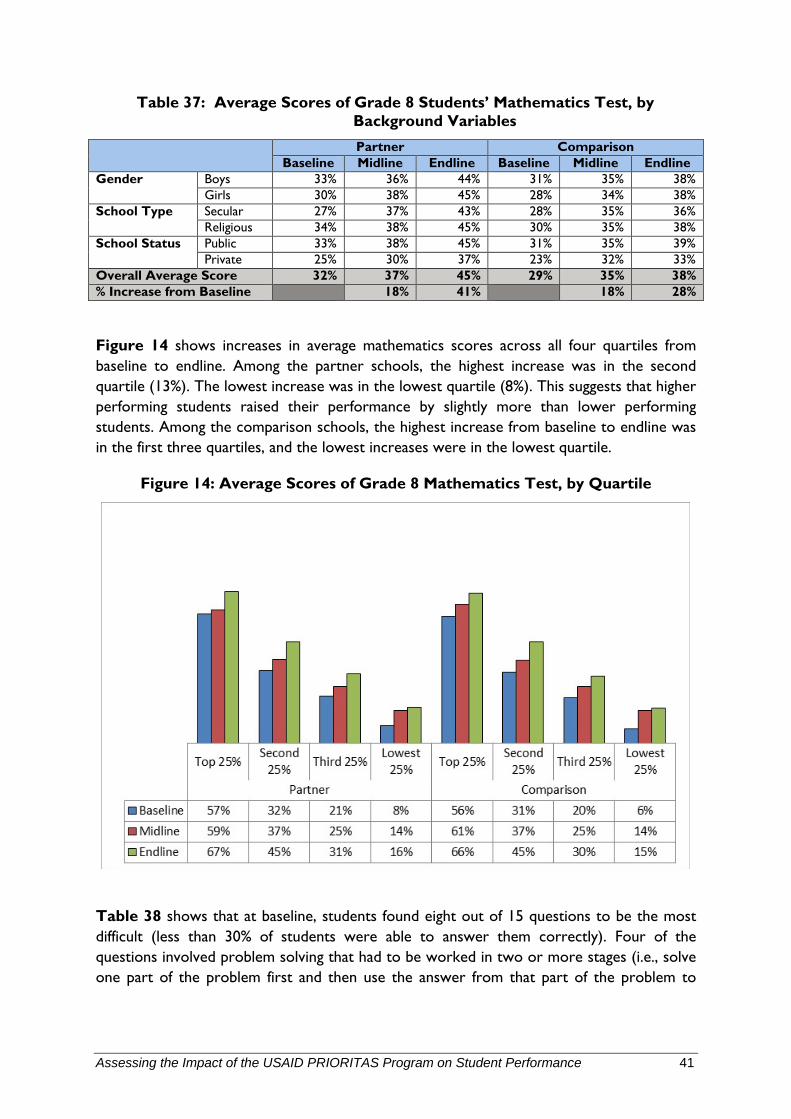
Assessing the Impact of the USAID PRIORITAS Program on Student Performance 41
Table 37: Average Scores of Grade 8 Students’ Mathematics Test, by Background Variables
Partner Comparison Baseline Midline Endline Baseline Midline Endline
Gender Boys 33% 36% 44% 31% 35% 38% Girls 30% 38% 45% 28% 34% 38%
School Type Secular 27% 37% 43% 28% 35% 36% Religious 34% 38% 45% 30% 35% 38%
School Status Public 33% 38% 45% 31% 35% 39% Private 25% 30% 37% 23% 32% 33%
Overall Average Score 32% 37% 45% 29% 35% 38% % Increase from Baseline 18% 41% 18% 28%
Figure 14 shows increases in average mathematics scores across all four quartiles from baseline to endline. Among the partner schools, the highest increase was in the second quartile (13%). The lowest increase was in the lowest quartile (8%). This suggests that higher performing students raised their performance by slightly more than lower performing students. Among the comparison schools, the highest increase from baseline to endline was in the first three quartiles, and the lowest increases were in the lowest quartile.
Figure 14: Average Scores of Grade 8 Mathematics Test, by Quartile
Table 38 shows that at baseline, students found eight out of 15 questions to be the most difficult (less than 30% of students were able to answer them correctly). Four of the questions involved problem solving that had to be worked in two or more stages (i.e., solve one part of the problem first and then use the answer from that part of the problem to
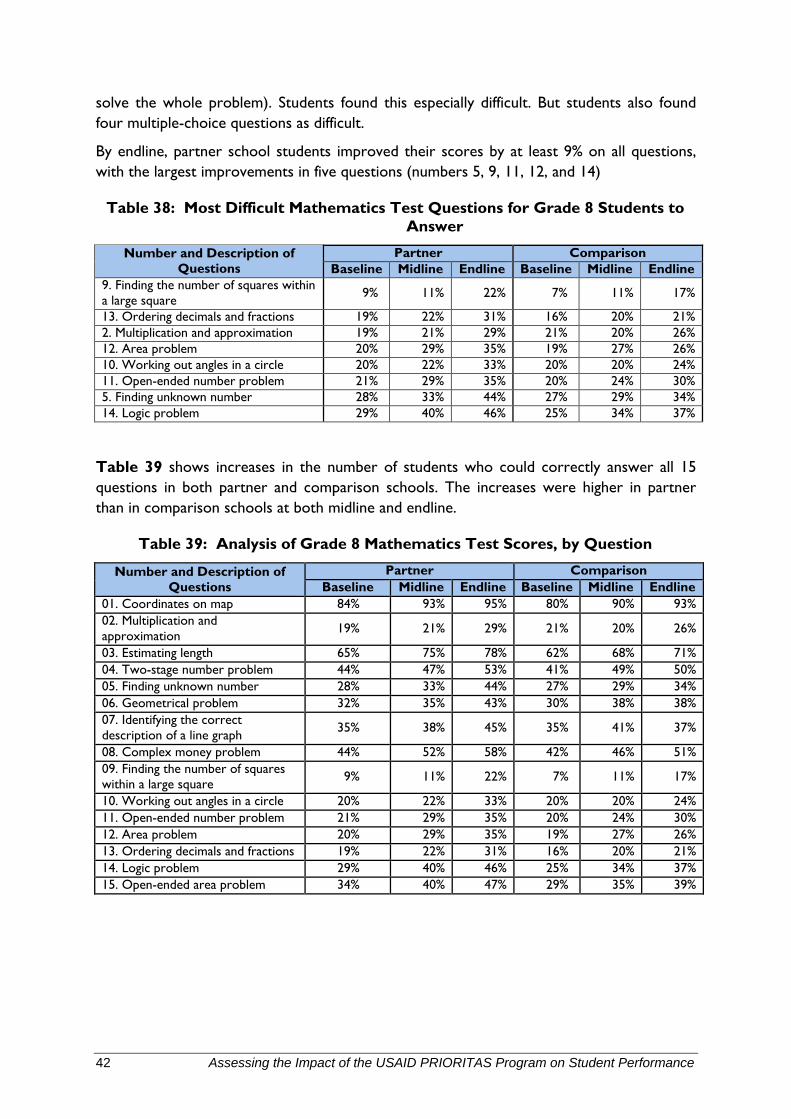
42 Assessing the Impact of the USAID PRIORITAS Program on Student Performance
solve the whole problem). Students found this especially difficult. But students also found four multiple-choice questions as difficult.
By endline, partner school students improved their scores by at least 9% on all questions, with the largest improvements in five questions (numbers 5, 9, 11, 12, and 14)
Table 38: Most Difficult Mathematics Test Questions for Grade 8 Students to Answer
Number and Description of Questions
Partner Comparison Baseline Midline Endline Baseline Midline Endline
9. Finding the number of squares within a large square 9% 11% 22% 7% 11% 17%
13. Ordering decimals and fractions 19% 22% 31% 16% 20% 21% 2. Multiplication and approximation 19% 21% 29% 21% 20% 26% 12. Area problem 20% 29% 35% 19% 27% 26% 10. Working out angles in a circle 20% 22% 33% 20% 20% 24% 11. Open-ended number problem 21% 29% 35% 20% 24% 30% 5. Finding unknown number 28% 33% 44% 27% 29% 34% 14. Logic problem 29% 40% 46% 25% 34% 37%
Table 39 shows increases in the number of students who could correctly answer all 15 questions in both partner and comparison schools. The increases were higher in partner than in comparison schools at both midline and endline.
Table 39: Analysis of Grade 8 Mathematics Test Scores, by Question
Number and Description of Questions
Partner Comparison Baseline Midline Endline Baseline Midline Endline
01. Coordinates on map 84% 93% 95% 80% 90% 93% 02. Multiplication and approximation 19% 21% 29% 21% 20% 26%
03. Estimating length 65% 75% 78% 62% 68% 71% 04. Two-stage number problem 44% 47% 53% 41% 49% 50% 05. Finding unknown number 28% 33% 44% 27% 29% 34% 06. Geometrical problem 32% 35% 43% 30% 38% 38% 07. Identifying the correct description of a line graph 35% 38% 45% 35% 41% 37%
08. Complex money problem 44% 52% 58% 42% 46% 51% 09. Finding the number of squares within a large square 9% 11% 22% 7% 11% 17%
10. Working out angles in a circle 20% 22% 33% 20% 20% 24% 11. Open-ended number problem 21% 29% 35% 20% 24% 30% 12. Area problem 20% 29% 35% 19% 27% 26% 13. Ordering decimals and fractions 19% 22% 31% 16% 20% 21% 14. Logic problem 29% 40% 46% 25% 34% 37% 15. Open-ended area problem 34% 40% 47% 29% 35% 39%
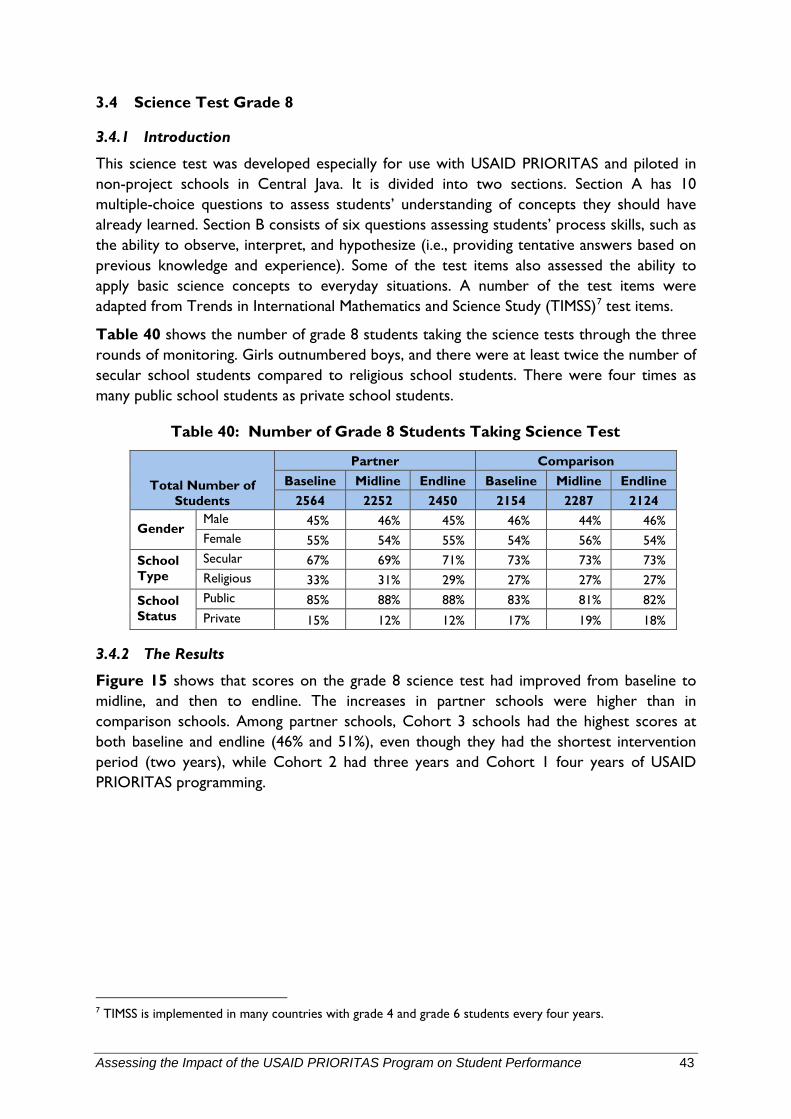
Assessing the Impact of the USAID PRIORITAS Program on Student Performance 43
3.4 Science Test Grade 8
3.4.1 Introduction
This science test was developed especially for use with USAID PRIORITAS and piloted in non-project schools in Central Java. It is divided into two sections. Section A has 10 multiple-choice questions to assess students’ understanding of concepts they should have already learned. Section B consists of six questions assessing students’ process skills, such as the ability to observe, interpret, and hypothesize (i.e., providing tentative answers based on previous knowledge and experience). Some of the test items also assessed the ability to apply basic science concepts to everyday situations. A number of the test items were adapted from Trends in International Mathematics and Science Study (TIMSS)7 test items.
Table 40 shows the number of grade 8 students taking the science tests through the three rounds of monitoring. Girls outnumbered boys, and there were at least twice the number of secular school students compared to religious school students. There were four times as many public school students as private school students.
Table 40: Number of Grade 8 Students Taking Science Test
Total Number of Students
Partner Comparison Baseline Midline Endline Baseline Midline Endline
2564 2252 2450 2154 2287 2124
Gender Male 45% 46% 45% 46% 44% 46% Female 55% 54% 55% 54% 56% 54%
School Type
Secular 67% 69% 71% 73% 73% 73% Religious 33% 31% 29% 27% 27% 27%
School Status
Public 85% 88% 88% 83% 81% 82% Private 15% 12% 12% 17% 19% 18%
3.4.2 The Results
Figure 15 shows that scores on the grade 8 science test had improved from baseline to midline, and then to endline. The increases in partner schools were higher than in comparison schools. Among partner schools, Cohort 3 schools had the highest scores at both baseline and endline (46% and 51%), even though they had the shortest intervention period (two years), while Cohort 2 had three years and Cohort 1 four years of USAID PRIORITAS programming.
7 TIMSS is implemented in many countries with grade 4 and grade 6 students every four years.
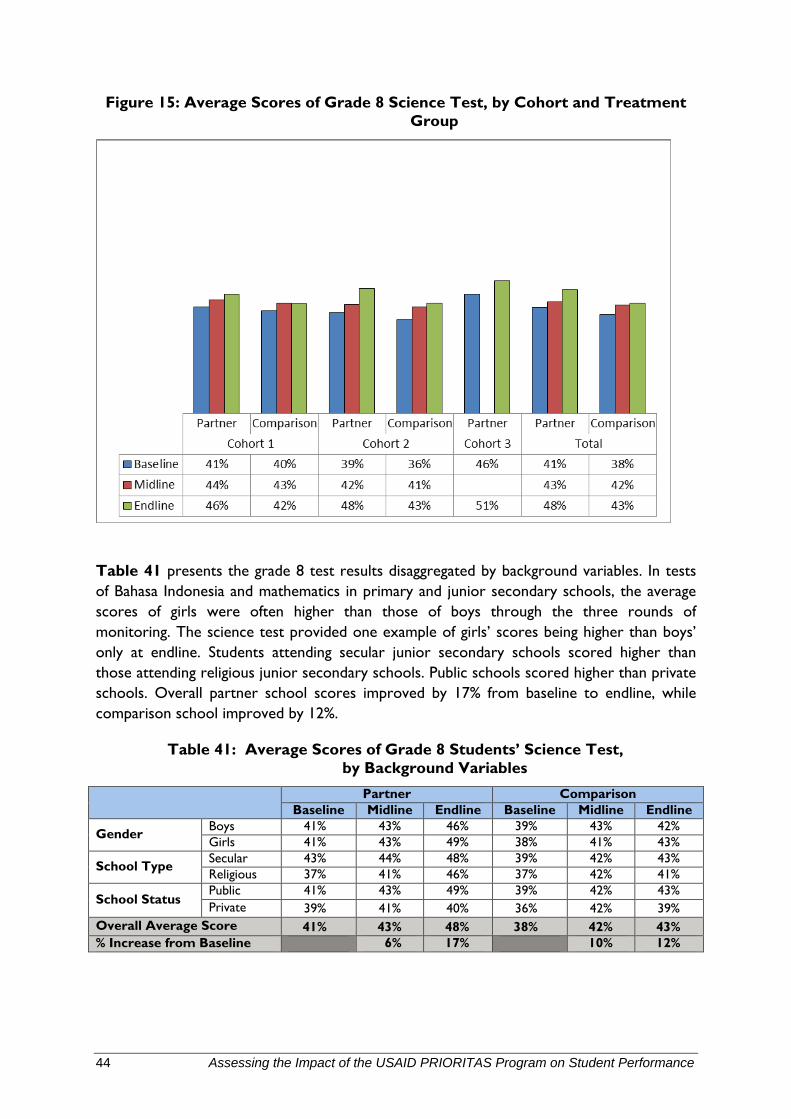
44 Assessing the Impact of the USAID PRIORITAS Program on Student Performance
Figure 15: Average Scores of Grade 8 Science Test, by Cohort and Treatment Group
Table 41 presents the grade 8 test results disaggregated by background variables. In tests of Bahasa Indonesia and mathematics in primary and junior secondary schools, the average scores of girls were often higher than those of boys through the three rounds of monitoring. The science test provided one example of girls’ scores being higher than boys’ only at endline. Students attending secular junior secondary schools scored higher than those attending religious junior secondary schools. Public schools scored higher than private schools. Overall partner school scores improved by 17% from baseline to endline, while comparison school improved by 12%.
Table 41: Average Scores of Grade 8 Students’ Science Test, by Background Variables
Partner Comparison Baseline Midline Endline Baseline Midline Endline
Gender Boys 41% 43% 46% 39% 43% 42% Girls 41% 43% 49% 38% 41% 43%
School Type Secular 43% 44% 48% 39% 42% 43% Religious 37% 41% 46% 37% 42% 41%
School Status Public 41% 43% 49% 39% 42% 43% Private 39% 41% 40% 36% 42% 39%
Overall Average Score 41% 43% 48% 38% 42% 43% % Increase from Baseline 6% 17% 10% 12%
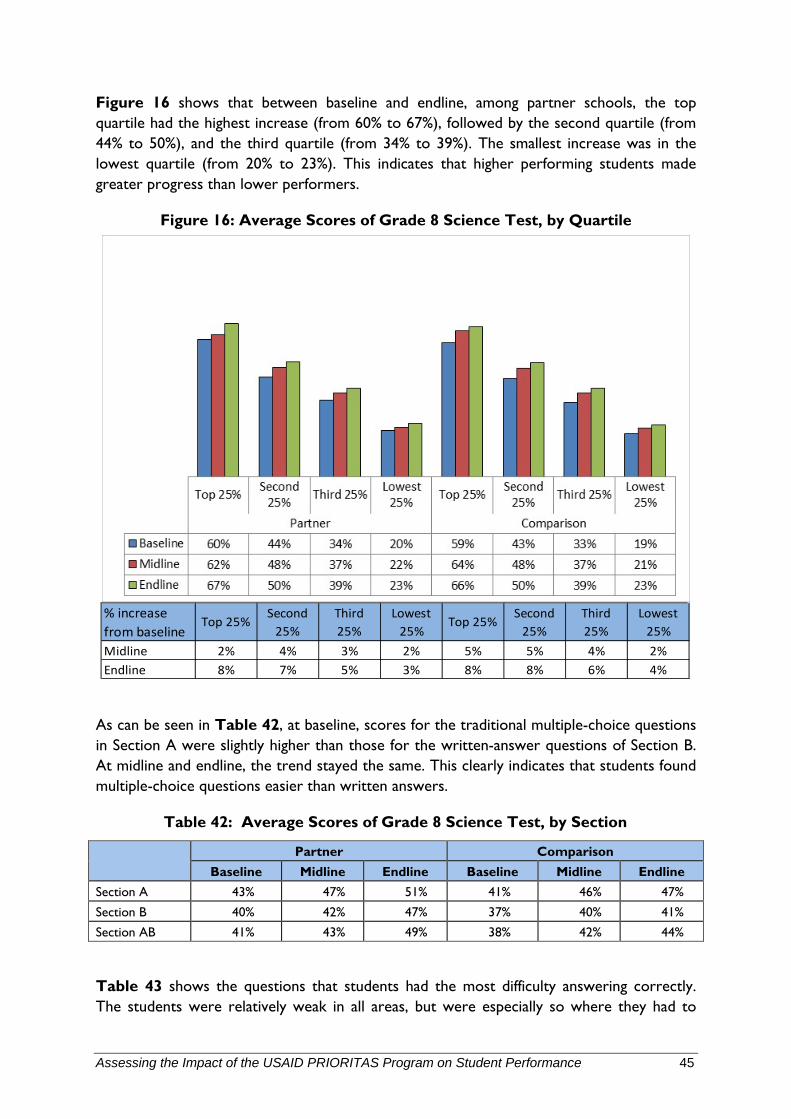
Assessing the Impact of the USAID PRIORITAS Program on Student Performance 45
Figure 16 shows that between baseline and endline, among partner schools, the top quartile had the highest increase (from 60% to 67%), followed by the second quartile (from 44% to 50%), and the third quartile (from 34% to 39%). The smallest increase was in the lowest quartile (from 20% to 23%). This indicates that higher performing students made greater progress than lower performers.
Figure 16: Average Scores of Grade 8 Science Test, by Quartile
As can be seen in Table 42, at baseline, scores for the traditional multiple-choice questions in Section A were slightly higher than those for the written-answer questions of Section B. At midline and endline, the trend stayed the same. This clearly indicates that students found multiple-choice questions easier than written answers.
Table 42: Average Scores of Grade 8 Science Test, by Section
Partner Comparison
Baseline Midline Endline Baseline Midline Endline Section A 43% 47% 51% 41% 46% 47%
Section B 40% 42% 47% 37% 40% 41%
Section AB 41% 43% 49% 38% 42% 44%
Table 43 shows the questions that students had the most difficulty answering correctly. The students were relatively weak in all areas, but were especially so where they had to
% increase from baseline
Top 25%Second
25%Third 25%
Lowest 25%
Top 25%Second
25%Third 25%
Lowest 25%
Midline 2% 4% 3% 2% 5% 5% 4% 2%Endline 8% 7% 5% 3% 8% 8% 6% 4%
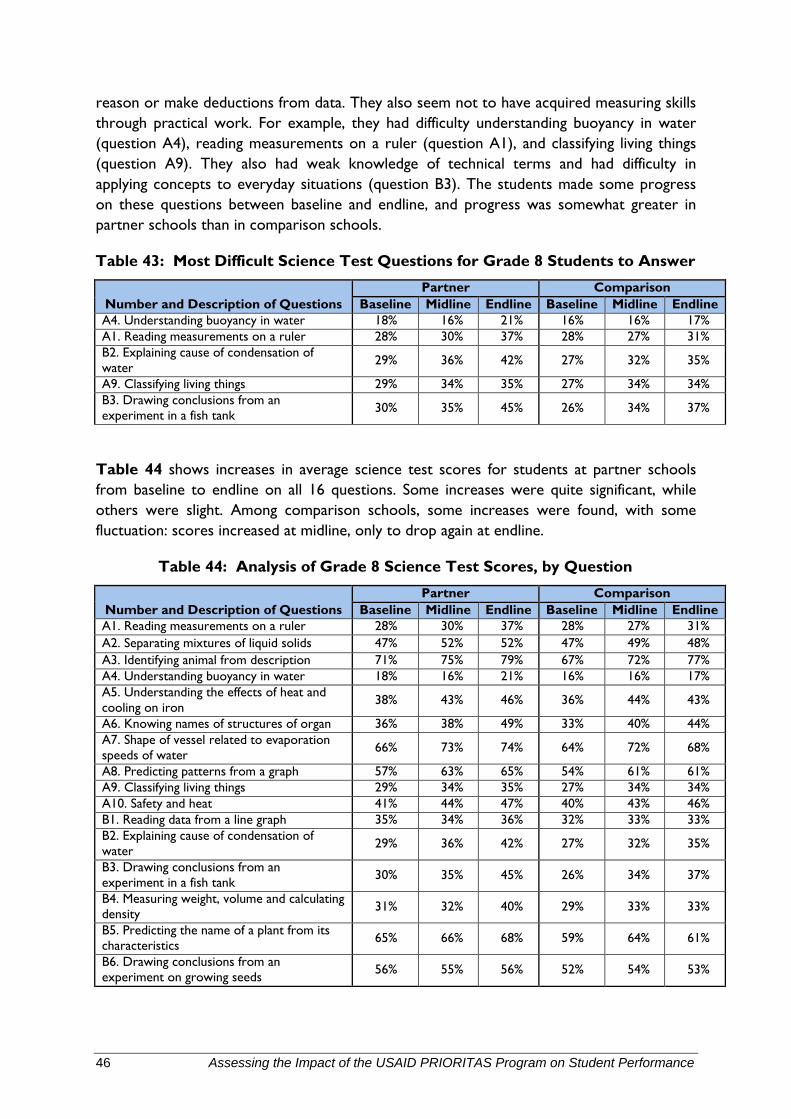
46 Assessing the Impact of the USAID PRIORITAS Program on Student Performance
reason or make deductions from data. They also seem not to have acquired measuring skills through practical work. For example, they had difficulty understanding buoyancy in water (question A4), reading measurements on a ruler (question A1), and classifying living things (question A9). They also had weak knowledge of technical terms and had difficulty in applying concepts to everyday situations (question B3). The students made some progress on these questions between baseline and endline, and progress was somewhat greater in partner schools than in comparison schools.
Table 43: Most Difficult Science Test Questions for Grade 8 Students to Answer
Number and Description of Questions Partner Comparison
Baseline Midline Endline Baseline Midline Endline A4. Understanding buoyancy in water 18% 16% 21% 16% 16% 17% A1. Reading measurements on a ruler 28% 30% 37% 28% 27% 31% B2. Explaining cause of condensation of water 29% 36% 42% 27% 32% 35%
A9. Classifying living things 29% 34% 35% 27% 34% 34% B3. Drawing conclusions from an experiment in a fish tank 30% 35% 45% 26% 34% 37%
Table 44 shows increases in average science test scores for students at partner schools from baseline to endline on all 16 questions. Some increases were quite significant, while others were slight. Among comparison schools, some increases were found, with some fluctuation: scores increased at midline, only to drop again at endline.
Table 44: Analysis of Grade 8 Science Test Scores, by Question
Number and Description of Questions Partner Comparison
Baseline Midline Endline Baseline Midline Endline A1. Reading measurements on a ruler 28% 30% 37% 28% 27% 31% A2. Separating mixtures of liquid solids 47% 52% 52% 47% 49% 48% A3. Identifying animal from description 71% 75% 79% 67% 72% 77% A4. Understanding buoyancy in water 18% 16% 21% 16% 16% 17% A5. Understanding the effects of heat and cooling on iron 38% 43% 46% 36% 44% 43%
A6. Knowing names of structures of organ 36% 38% 49% 33% 40% 44% A7. Shape of vessel related to evaporation speeds of water 66% 73% 74% 64% 72% 68%
A8. Predicting patterns from a graph 57% 63% 65% 54% 61% 61% A9. Classifying living things 29% 34% 35% 27% 34% 34% A10. Safety and heat 41% 44% 47% 40% 43% 46% B1. Reading data from a line graph 35% 34% 36% 32% 33% 33% B2. Explaining cause of condensation of water 29% 36% 42% 27% 32% 35%
B3. Drawing conclusions from an experiment in a fish tank 30% 35% 45% 26% 34% 37%
B4. Measuring weight, volume and calculating density 31% 32% 40% 29% 33% 33%
B5. Predicting the name of a plant from its characteristics 65% 66% 68% 59% 64% 61%
B6. Drawing conclusions from an experiment on growing seeds 56% 55% 56% 52% 54% 53%
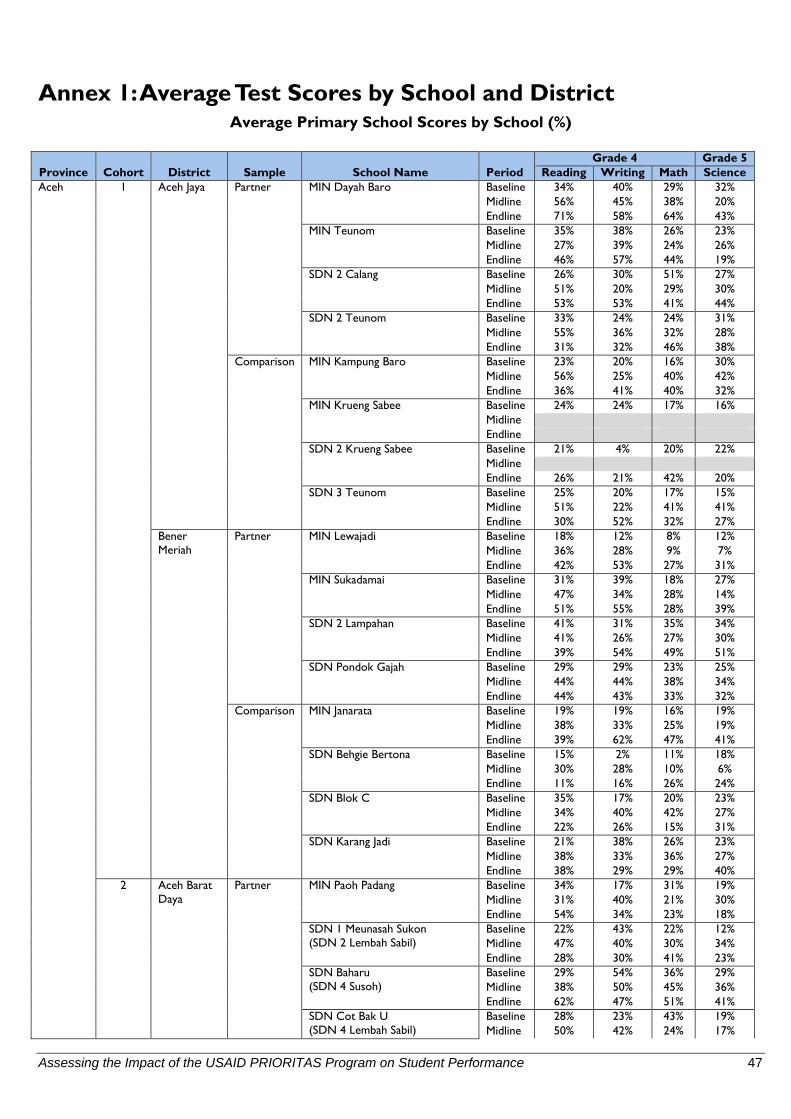
Assessing the Impact of the USAID PRIORITAS Program on Student Performance 47
Annex 1: Average Test Scores by School and District Average Primary School Scores by School (%)
Province Cohort District Sample School Name Period Grade 4 Grade 5
Reading Writing Math Science Aceh 1 Aceh Jaya Partner MIN Dayah Baro Baseline 34% 40% 29% 32%
Midline 56% 45% 38% 20% Endline 71% 58% 64% 43%
MIN Teunom Baseline 35% 38% 26% 23% Midline 27% 39% 24% 26% Endline 46% 57% 44% 19%
SDN 2 Calang Baseline 26% 30% 51% 27% Midline 51% 20% 29% 30% Endline 53% 53% 41% 44%
SDN 2 Teunom Baseline 33% 24% 24% 31% Midline 55% 36% 32% 28% Endline 31% 32% 46% 38%
Comparison MIN Kampung Baro Baseline 23% 20% 16% 30% Midline 56% 25% 40% 42% Endline 36% 41% 40% 32%
MIN Krueng Sabee Baseline 24% 24% 17% 16% Midline Endline
SDN 2 Krueng Sabee Baseline 21% 4% 20% 22% Midline Endline 26% 21% 42% 20%
SDN 3 Teunom Baseline 25% 20% 17% 15% Midline 51% 22% 41% 41% Endline 30% 52% 32% 27%
Bener Meriah
Partner MIN Lewajadi Baseline 18% 12% 8% 12% Midline 36% 28% 9% 7% Endline 42% 53% 27% 31%
MIN Sukadamai Baseline 31% 39% 18% 27% Midline 47% 34% 28% 14% Endline 51% 55% 28% 39%
SDN 2 Lampahan Baseline 41% 31% 35% 34% Midline 41% 26% 27% 30% Endline 39% 54% 49% 51%
SDN Pondok Gajah Baseline 29% 29% 23% 25% Midline 44% 44% 38% 34% Endline 44% 43% 33% 32%
Comparison MIN Janarata Baseline 19% 19% 16% 19% Midline 38% 33% 25% 19% Endline 39% 62% 47% 41%
SDN Behgie Bertona Baseline 15% 2% 11% 18% Midline 30% 28% 10% 6% Endline 11% 16% 26% 24%
SDN Blok C Baseline 35% 17% 20% 23% Midline 34% 40% 42% 27% Endline 22% 26% 15% 31%
SDN Karang Jadi Baseline 21% 38% 26% 23% Midline 38% 33% 36% 27% Endline 38% 29% 29% 40%
2 Aceh Barat Daya
Partner MIN Paoh Padang Baseline 34% 17% 31% 19% Midline 31% 40% 21% 30% Endline 54% 34% 23% 18%
SDN 1 Meunasah Sukon (SDN 2 Lembah Sabil)
Baseline 22% 43% 22% 12% Midline 47% 40% 30% 34% Endline 28% 30% 41% 23%
SDN Baharu (SDN 4 Susoh)
Baseline 29% 54% 36% 29% Midline 38% 50% 45% 36% Endline 62% 47% 51% 41%
SDN Cot Bak U (SDN 4 Lembah Sabil)
Baseline 28% 23% 43% 19% Midline 50% 42% 24% 17%
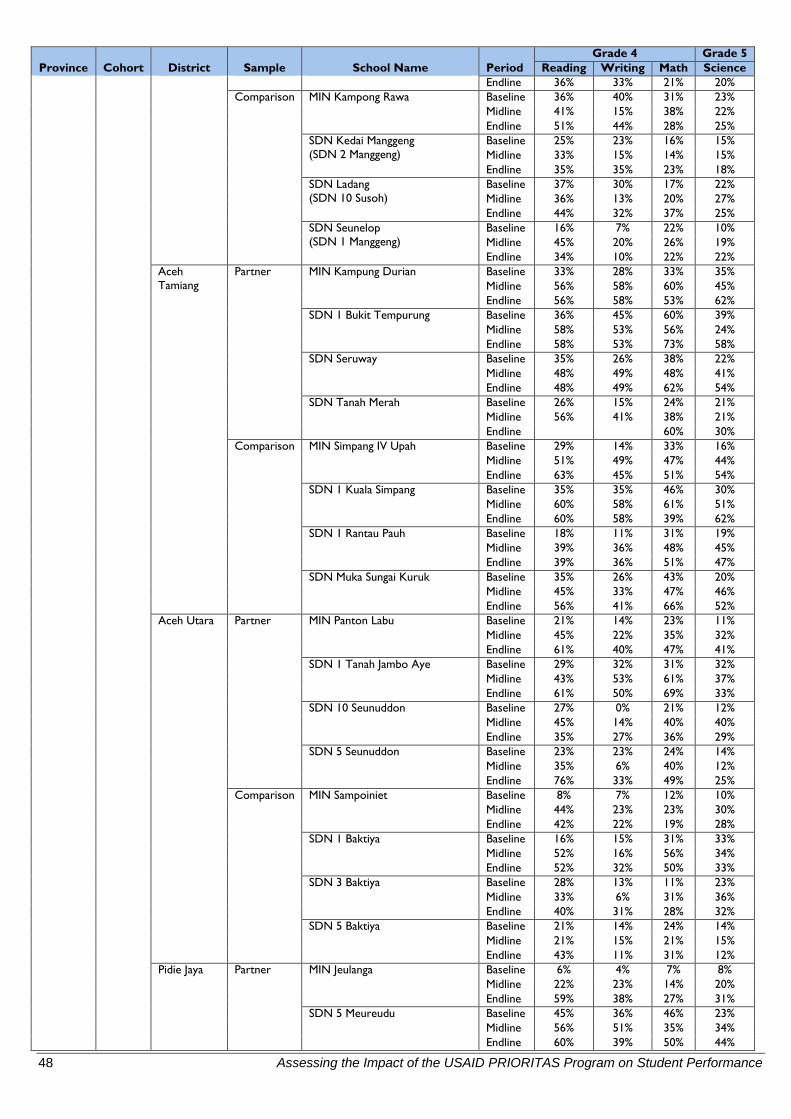
48 Assessing the Impact of the USAID PRIORITAS Program on Student Performance
Province Cohort District Sample School Name Period Grade 4 Grade 5
Reading Writing Math Science Endline 36% 33% 21% 20%
Comparison MIN Kampong Rawa Baseline 36% 40% 31% 23% Midline 41% 15% 38% 22% Endline 51% 44% 28% 25%
SDN Kedai Manggeng (SDN 2 Manggeng)
Baseline 25% 23% 16% 15% Midline 33% 15% 14% 15% Endline 35% 35% 23% 18%
SDN Ladang (SDN 10 Susoh)
Baseline 37% 30% 17% 22% Midline 36% 13% 20% 27% Endline 44% 32% 37% 25%
SDN Seunelop (SDN 1 Manggeng)
Baseline 16% 7% 22% 10% Midline 45% 20% 26% 19% Endline 34% 10% 22% 22%
Aceh Tamiang
Partner MIN Kampung Durian Baseline 33% 28% 33% 35% Midline 56% 58% 60% 45% Endline 56% 58% 53% 62%
SDN 1 Bukit Tempurung Baseline 36% 45% 60% 39% Midline 58% 53% 56% 24% Endline 58% 53% 73% 58%
SDN Seruway Baseline 35% 26% 38% 22% Midline 48% 49% 48% 41% Endline 48% 49% 62% 54%
SDN Tanah Merah Baseline 26% 15% 24% 21% Midline 56% 41% 38% 21% Endline 60% 30%
Comparison MIN Simpang IV Upah Baseline 29% 14% 33% 16% Midline 51% 49% 47% 44% Endline 63% 45% 51% 54%
SDN 1 Kuala Simpang Baseline 35% 35% 46% 30% Midline 60% 58% 61% 51% Endline 60% 58% 39% 62%
SDN 1 Rantau Pauh Baseline 18% 11% 31% 19% Midline 39% 36% 48% 45% Endline 39% 36% 51% 47%
SDN Muka Sungai Kuruk Baseline 35% 26% 43% 20% Midline 45% 33% 47% 46% Endline 56% 41% 66% 52%
Aceh Utara Partner MIN Panton Labu Baseline 21% 14% 23% 11% Midline 45% 22% 35% 32% Endline 61% 40% 47% 41% SDN 1 Tanah Jambo Aye Baseline 29% 32% 31% 32% Midline 43% 53% 61% 37% Endline 61% 50% 69% 33% SDN 10 Seunuddon Baseline 27% 0% 21% 12% Midline 45% 14% 40% 40% Endline 35% 27% 36% 29% SDN 5 Seunuddon Baseline 23% 23% 24% 14% Midline 35% 6% 40% 12% Endline 76% 33% 49% 25%
Comparison MIN Sampoiniet Baseline 8% 7% 12% 10% Midline 44% 23% 23% 30% Endline 42% 22% 19% 28% SDN 1 Baktiya Baseline 16% 15% 31% 33% Midline 52% 16% 56% 34% Endline 52% 32% 50% 33% SDN 3 Baktiya Baseline 28% 13% 11% 23%
Midline 33% 6% 31% 36% Endline 40% 31% 28% 32%
SDN 5 Baktiya Baseline 21% 14% 24% 14% Midline 21% 15% 21% 15% Endline 43% 11% 31% 12%
Pidie Jaya Partner MIN Jeulanga Baseline 6% 4% 7% 8% Midline 22% 23% 14% 20% Endline 59% 38% 27% 31%
SDN 5 Meureudu Baseline 45% 36% 46% 23% Midline 56% 51% 35% 34% Endline 60% 39% 50% 44%
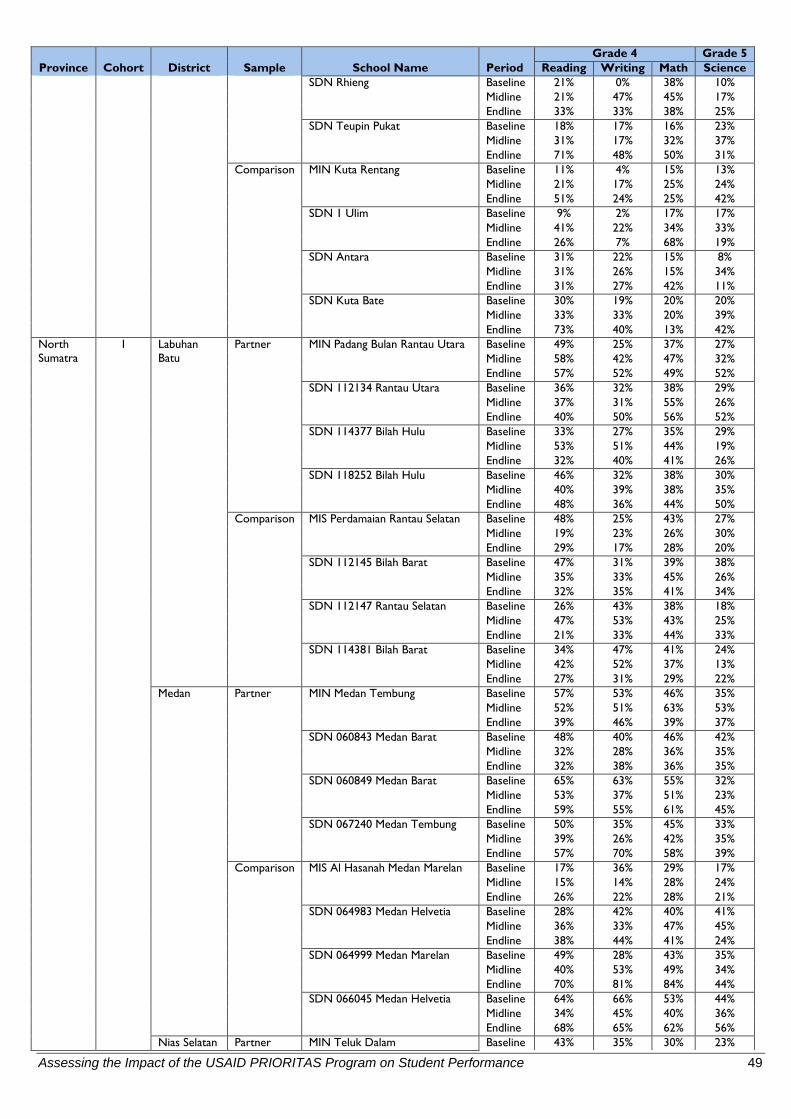
Assessing the Impact of the USAID PRIORITAS Program on Student Performance 49
Province Cohort District Sample School Name Period Grade 4 Grade 5
Reading Writing Math Science SDN Rhieng Baseline 21% 0% 38% 10%
Midline 21% 47% 45% 17% Endline 33% 33% 38% 25%
SDN Teupin Pukat Baseline 18% 17% 16% 23% Midline 31% 17% 32% 37% Endline 71% 48% 50% 31%
Comparison MIN Kuta Rentang Baseline 11% 4% 15% 13% Midline 21% 17% 25% 24% Endline 51% 24% 25% 42%
SDN 1 Ulim Baseline 9% 2% 17% 17% Midline 41% 22% 34% 33% Endline 26% 7% 68% 19%
SDN Antara Baseline 31% 22% 15% 8% Midline 31% 26% 15% 34% Endline 31% 27% 42% 11%
SDN Kuta Bate Baseline 30% 19% 20% 20% Midline 33% 33% 20% 39% Endline 73% 40% 13% 42%
North Sumatra
1 Labuhan Batu
Partner MIN Padang Bulan Rantau Utara Baseline 49% 25% 37% 27% Midline 58% 42% 47% 32% Endline 57% 52% 49% 52%
SDN 112134 Rantau Utara Baseline 36% 32% 38% 29% Midline 37% 31% 55% 26% Endline 40% 50% 56% 52%
SDN 114377 Bilah Hulu Baseline 33% 27% 35% 29% Midline 53% 51% 44% 19% Endline 32% 40% 41% 26%
SDN 118252 Bilah Hulu Baseline 46% 32% 38% 30% Midline 40% 39% 38% 35% Endline 48% 36% 44% 50%
Comparison MIS Perdamaian Rantau Selatan Baseline 48% 25% 43% 27% Midline 19% 23% 26% 30% Endline 29% 17% 28% 20%
SDN 112145 Bilah Barat Baseline 47% 31% 39% 38% Midline 35% 33% 45% 26% Endline 32% 35% 41% 34%
SDN 112147 Rantau Selatan Baseline 26% 43% 38% 18% Midline 47% 53% 43% 25% Endline 21% 33% 44% 33%
SDN 114381 Bilah Barat Baseline 34% 47% 41% 24% Midline 42% 52% 37% 13% Endline 27% 31% 29% 22%
Medan Partner MIN Medan Tembung Baseline 57% 53% 46% 35% Midline 52% 51% 63% 53% Endline 39% 46% 39% 37%
SDN 060843 Medan Barat Baseline 48% 40% 46% 42% Midline 32% 28% 36% 35% Endline 32% 38% 36% 35%
SDN 060849 Medan Barat Baseline 65% 63% 55% 32% Midline 53% 37% 51% 23% Endline 59% 55% 61% 45%
SDN 067240 Medan Tembung Baseline 50% 35% 45% 33% Midline 39% 26% 42% 35% Endline 57% 70% 58% 39%
Comparison MIS Al Hasanah Medan Marelan Baseline 17% 36% 29% 17% Midline 15% 14% 28% 24% Endline 26% 22% 28% 21%
SDN 064983 Medan Helvetia Baseline 28% 42% 40% 41% Midline 36% 33% 47% 45% Endline 38% 44% 41% 24%
SDN 064999 Medan Marelan Baseline 49% 28% 43% 35% Midline 40% 53% 49% 34% Endline 70% 81% 84% 44%
SDN 066045 Medan Helvetia Baseline 64% 66% 53% 44% Midline 34% 45% 40% 36% Endline 68% 65% 62% 56%
Nias Selatan Partner MIN Teluk Dalam Baseline 43% 35% 30% 23%
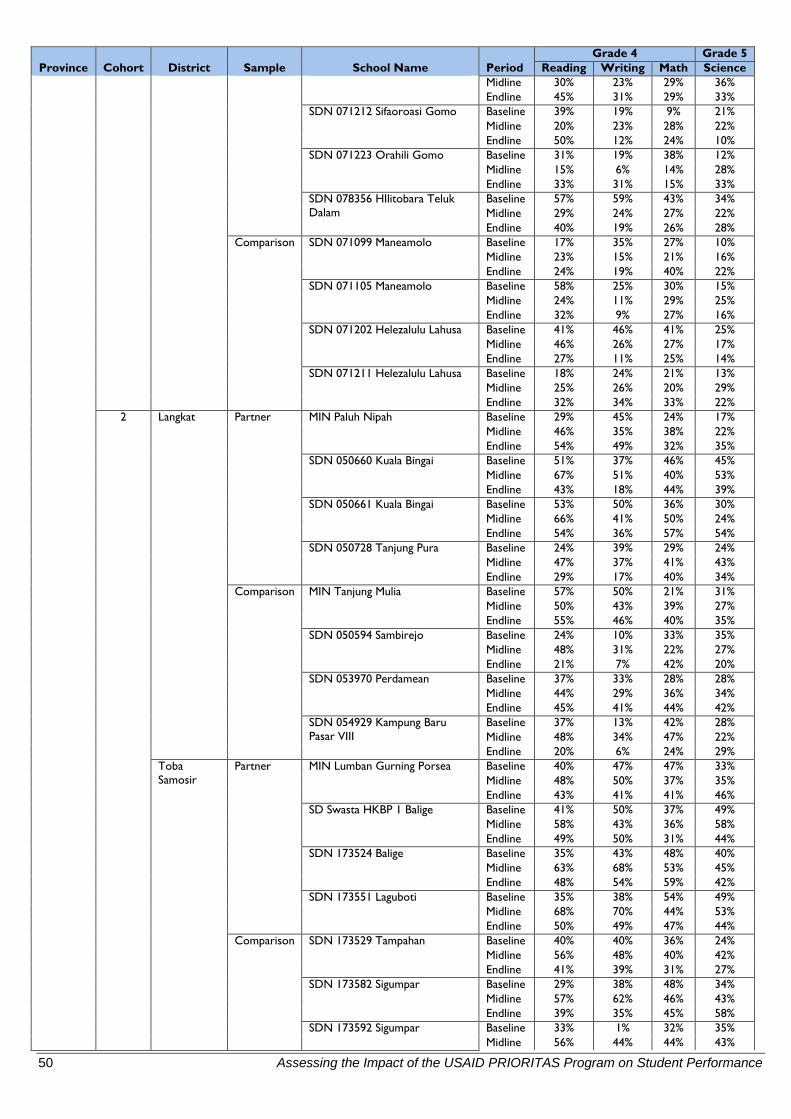
50 Assessing the Impact of the USAID PRIORITAS Program on Student Performance
Province Cohort District Sample School Name Period Grade 4 Grade 5
Reading Writing Math Science Midline 30% 23% 29% 36% Endline 45% 31% 29% 33%
SDN 071212 Sifaoroasi Gomo Baseline 39% 19% 9% 21% Midline 20% 23% 28% 22% Endline 50% 12% 24% 10%
SDN 071223 Orahili Gomo Baseline 31% 19% 38% 12% Midline 15% 6% 14% 28% Endline 33% 31% 15% 33%
SDN 078356 HIlitobara Teluk Dalam
Baseline 57% 59% 43% 34% Midline 29% 24% 27% 22% Endline 40% 19% 26% 28%
Comparison SDN 071099 Maneamolo Baseline 17% 35% 27% 10% Midline 23% 15% 21% 16% Endline 24% 19% 40% 22%
SDN 071105 Maneamolo Baseline 58% 25% 30% 15% Midline 24% 11% 29% 25% Endline 32% 9% 27% 16%
SDN 071202 Helezalulu Lahusa Baseline 41% 46% 41% 25% Midline 46% 26% 27% 17% Endline 27% 11% 25% 14%
SDN 071211 Helezalulu Lahusa Baseline 18% 24% 21% 13% Midline 25% 26% 20% 29% Endline 32% 34% 33% 22%
2 Langkat Partner MIN Paluh Nipah Baseline 29% 45% 24% 17% Midline 46% 35% 38% 22% Endline 54% 49% 32% 35%
SDN 050660 Kuala Bingai Baseline 51% 37% 46% 45% Midline 67% 51% 40% 53% Endline 43% 18% 44% 39%
SDN 050661 Kuala Bingai Baseline 53% 50% 36% 30% Midline 66% 41% 50% 24% Endline 54% 36% 57% 54%
SDN 050728 Tanjung Pura Baseline 24% 39% 29% 24% Midline 47% 37% 41% 43% Endline 29% 17% 40% 34%
Comparison MIN Tanjung Mulia Baseline 57% 50% 21% 31% Midline 50% 43% 39% 27% Endline 55% 46% 40% 35%
SDN 050594 Sambirejo Baseline 24% 10% 33% 35% Midline 48% 31% 22% 27% Endline 21% 7% 42% 20%
SDN 053970 Perdamean Baseline 37% 33% 28% 28% Midline 44% 29% 36% 34% Endline 45% 41% 44% 42%
SDN 054929 Kampung Baru Pasar VIII
Baseline 37% 13% 42% 28% Midline 48% 34% 47% 22% Endline 20% 6% 24% 29%
Toba Samosir
Partner MIN Lumban Gurning Porsea Baseline 40% 47% 47% 33% Midline 48% 50% 37% 35% Endline 43% 41% 41% 46%
SD Swasta HKBP 1 Balige Baseline 41% 50% 37% 49% Midline 58% 43% 36% 58% Endline 49% 50% 31% 44%
SDN 173524 Balige Baseline 35% 43% 48% 40% Midline 63% 68% 53% 45% Endline 48% 54% 59% 42%
SDN 173551 Laguboti Baseline 35% 38% 54% 49% Midline 68% 70% 44% 53% Endline 50% 49% 47% 44%
Comparison SDN 173529 Tampahan Baseline 40% 40% 36% 24% Midline 56% 48% 40% 42% Endline 41% 39% 31% 27%
SDN 173582 Sigumpar Baseline 29% 38% 48% 34% Midline 57% 62% 46% 43% Endline 39% 35% 45% 58%
SDN 173592 Sigumpar Baseline 33% 1% 32% 35% Midline 56% 44% 44% 43%
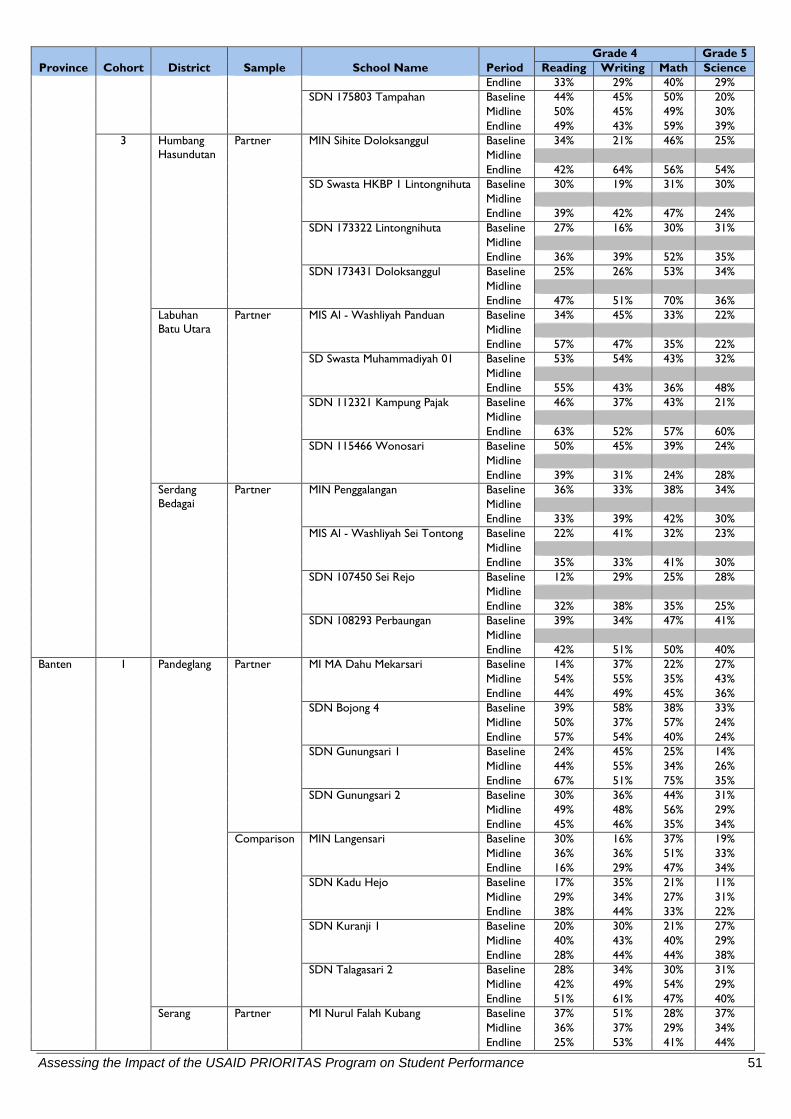
Assessing the Impact of the USAID PRIORITAS Program on Student Performance 51
Province Cohort District Sample School Name Period Grade 4 Grade 5
Reading Writing Math Science Endline 33% 29% 40% 29%
SDN 175803 Tampahan Baseline 44% 45% 50% 20% Midline 50% 45% 49% 30% Endline 49% 43% 59% 39%
3 Humbang Hasundutan
Partner MIN Sihite Doloksanggul Baseline 34% 21% 46% 25% Midline Endline 42% 64% 56% 54%
SD Swasta HKBP 1 Lintongnihuta Baseline 30% 19% 31% 30% Midline Endline 39% 42% 47% 24%
SDN 173322 Lintongnihuta Baseline 27% 16% 30% 31% Midline Endline 36% 39% 52% 35%
SDN 173431 Doloksanggul Baseline 25% 26% 53% 34% Midline Endline 47% 51% 70% 36%
Labuhan Batu Utara
Partner MIS Al - Washliyah Panduan Baseline 34% 45% 33% 22% Midline Endline 57% 47% 35% 22%
SD Swasta Muhammadiyah 01 Baseline 53% 54% 43% 32% Midline Endline 55% 43% 36% 48%
SDN 112321 Kampung Pajak Baseline 46% 37% 43% 21% Midline Endline 63% 52% 57% 60%
SDN 115466 Wonosari Baseline 50% 45% 39% 24% Midline Endline 39% 31% 24% 28%
Serdang Bedagai
Partner MIN Penggalangan Baseline 36% 33% 38% 34% Midline Endline 33% 39% 42% 30%
MIS Al - Washliyah Sei Tontong Baseline 22% 41% 32% 23% Midline Endline 35% 33% 41% 30%
SDN 107450 Sei Rejo Baseline 12% 29% 25% 28% Midline Endline 32% 38% 35% 25%
SDN 108293 Perbaungan Baseline 39% 34% 47% 41% Midline Endline 42% 51% 50% 40%
Banten 1 Pandeglang Partner MI MA Dahu Mekarsari Baseline 14% 37% 22% 27% Midline 54% 55% 35% 43% Endline 44% 49% 45% 36%
SDN Bojong 4 Baseline 39% 58% 38% 33% Midline 50% 37% 57% 24% Endline 57% 54% 40% 24%
SDN Gunungsari 1 Baseline 24% 45% 25% 14% Midline 44% 55% 34% 26% Endline 67% 51% 75% 35%
SDN Gunungsari 2 Baseline 30% 36% 44% 31% Midline 49% 48% 56% 29% Endline 45% 46% 35% 34%
Comparison MIN Langensari Baseline 30% 16% 37% 19% Midline 36% 36% 51% 33% Endline 16% 29% 47% 34%
SDN Kadu Hejo Baseline 17% 35% 21% 11% Midline 29% 34% 27% 31% Endline 38% 44% 33% 22%
SDN Kuranji 1 Baseline 20% 30% 21% 27% Midline 40% 43% 40% 29% Endline 28% 44% 44% 38%
SDN Talagasari 2 Baseline 28% 34% 30% 31% Midline 42% 49% 54% 29% Endline 51% 61% 47% 40%
Serang Partner MI Nurul Falah Kubang Baseline 37% 51% 28% 37% Midline 36% 37% 29% 34% Endline 25% 53% 41% 44%
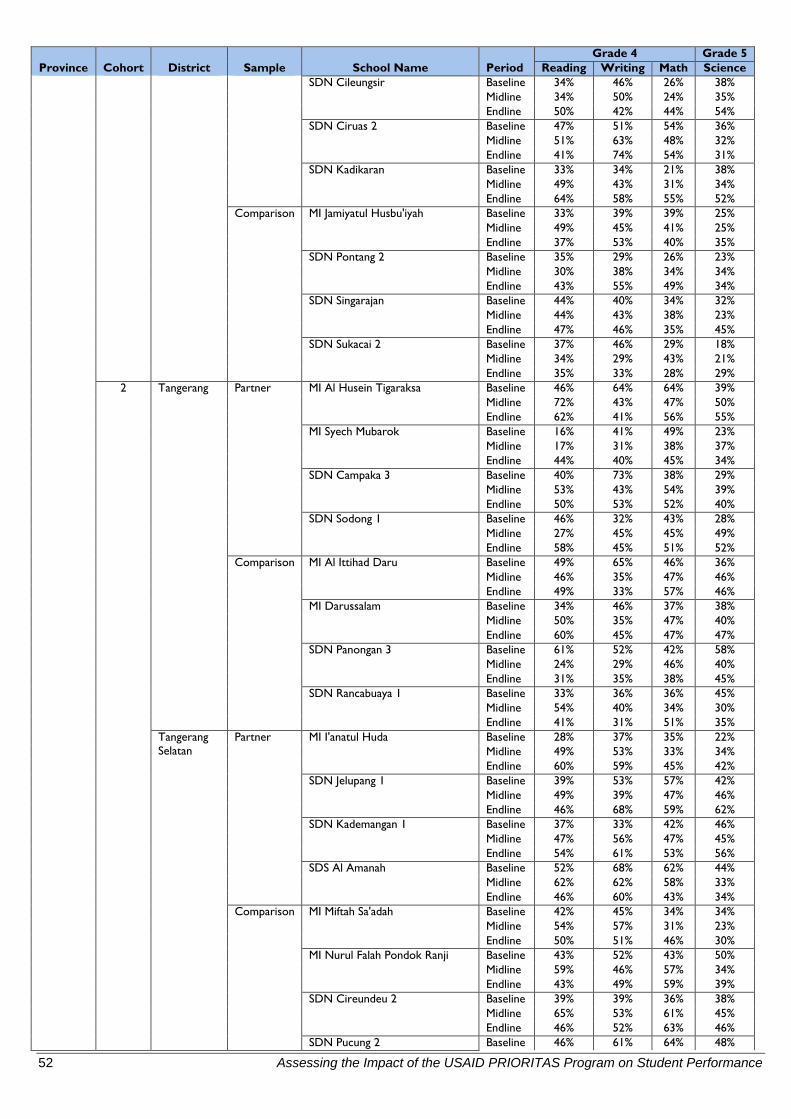
52 Assessing the Impact of the USAID PRIORITAS Program on Student Performance
Province Cohort District Sample School Name Period Grade 4 Grade 5
Reading Writing Math Science SDN Cileungsir Baseline 34% 46% 26% 38%
Midline 34% 50% 24% 35% Endline 50% 42% 44% 54%
SDN Ciruas 2 Baseline 47% 51% 54% 36% Midline 51% 63% 48% 32% Endline 41% 74% 54% 31%
SDN Kadikaran Baseline 33% 34% 21% 38% Midline 49% 43% 31% 34% Endline 64% 58% 55% 52%
Comparison MI Jamiyatul Husbu'iyah Baseline 33% 39% 39% 25% Midline 49% 45% 41% 25% Endline 37% 53% 40% 35%
SDN Pontang 2 Baseline 35% 29% 26% 23% Midline 30% 38% 34% 34% Endline 43% 55% 49% 34%
SDN Singarajan Baseline 44% 40% 34% 32% Midline 44% 43% 38% 23% Endline 47% 46% 35% 45%
SDN Sukacai 2 Baseline 37% 46% 29% 18% Midline 34% 29% 43% 21% Endline 35% 33% 28% 29%
2 Tangerang Partner MI Al Husein Tigaraksa Baseline 46% 64% 64% 39% Midline 72% 43% 47% 50% Endline 62% 41% 56% 55%
MI Syech Mubarok Baseline 16% 41% 49% 23% Midline 17% 31% 38% 37% Endline 44% 40% 45% 34%
SDN Campaka 3 Baseline 40% 73% 38% 29% Midline 53% 43% 54% 39% Endline 50% 53% 52% 40%
SDN Sodong 1 Baseline 46% 32% 43% 28% Midline 27% 45% 45% 49% Endline 58% 45% 51% 52%
Comparison MI Al Ittihad Daru Baseline 49% 65% 46% 36% Midline 46% 35% 47% 46% Endline 49% 33% 57% 46%
MI Darussalam Baseline 34% 46% 37% 38% Midline 50% 35% 47% 40% Endline 60% 45% 47% 47%
SDN Panongan 3 Baseline 61% 52% 42% 58% Midline 24% 29% 46% 40% Endline 31% 35% 38% 45%
SDN Rancabuaya 1 Baseline 33% 36% 36% 45% Midline 54% 40% 34% 30% Endline 41% 31% 51% 35%
Tangerang Selatan
Partner MI I'anatul Huda Baseline 28% 37% 35% 22% Midline 49% 53% 33% 34% Endline 60% 59% 45% 42%
SDN Jelupang 1 Baseline 39% 53% 57% 42% Midline 49% 39% 47% 46% Endline 46% 68% 59% 62%
SDN Kademangan 1 Baseline 37% 33% 42% 46% Midline 47% 56% 47% 45% Endline 54% 61% 53% 56%
SDS Al Amanah Baseline 52% 68% 62% 44% Midline 62% 62% 58% 33% Endline 46% 60% 43% 34%
Comparison MI Miftah Sa'adah Baseline 42% 45% 34% 34% Midline 54% 57% 31% 23% Endline 50% 51% 46% 30%
MI Nurul Falah Pondok Ranji Baseline 43% 52% 43% 50% Midline 59% 46% 57% 34% Endline 43% 49% 59% 39%
SDN Cireundeu 2 Baseline 39% 39% 36% 38% Midline 65% 53% 61% 45% Endline 46% 52% 63% 46%
SDN Pucung 2 Baseline 46% 61% 64% 48%
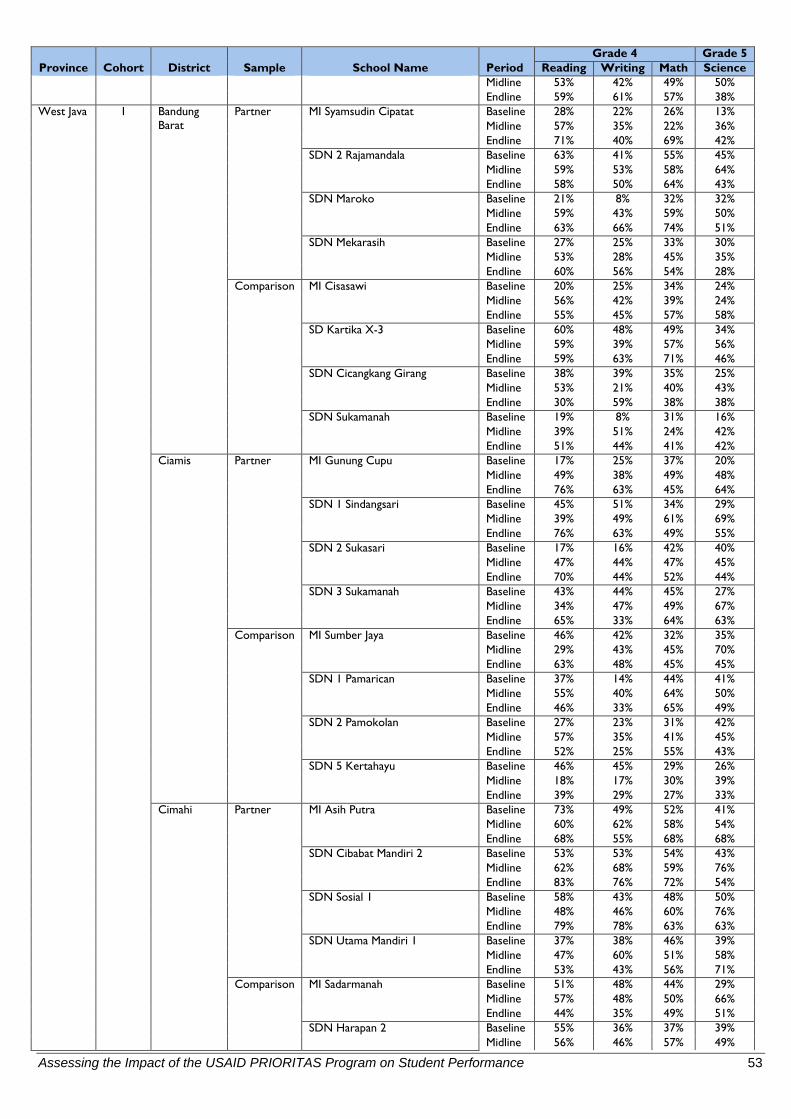
Assessing the Impact of the USAID PRIORITAS Program on Student Performance 53
Province Cohort District Sample School Name Period Grade 4 Grade 5
Reading Writing Math Science Midline 53% 42% 49% 50% Endline 59% 61% 57% 38%
West Java 1 Bandung Barat
Partner MI Syamsudin Cipatat Baseline 28% 22% 26% 13% Midline 57% 35% 22% 36% Endline 71% 40% 69% 42%
SDN 2 Rajamandala Baseline 63% 41% 55% 45% Midline 59% 53% 58% 64% Endline 58% 50% 64% 43%
SDN Maroko Baseline 21% 8% 32% 32% Midline 59% 43% 59% 50% Endline 63% 66% 74% 51%
SDN Mekarasih Baseline 27% 25% 33% 30% Midline 53% 28% 45% 35% Endline 60% 56% 54% 28%
Comparison MI Cisasawi Baseline 20% 25% 34% 24% Midline 56% 42% 39% 24% Endline 55% 45% 57% 58%
SD Kartika X-3 Baseline 60% 48% 49% 34% Midline 59% 39% 57% 56% Endline 59% 63% 71% 46%
SDN Cicangkang Girang Baseline 38% 39% 35% 25% Midline 53% 21% 40% 43% Endline 30% 59% 38% 38%
SDN Sukamanah Baseline 19% 8% 31% 16% Midline 39% 51% 24% 42% Endline 51% 44% 41% 42%
Ciamis Partner MI Gunung Cupu Baseline 17% 25% 37% 20% Midline 49% 38% 49% 48% Endline 76% 63% 45% 64%
SDN 1 Sindangsari Baseline 45% 51% 34% 29% Midline 39% 49% 61% 69% Endline 76% 63% 49% 55%
SDN 2 Sukasari Baseline 17% 16% 42% 40% Midline 47% 44% 47% 45% Endline 70% 44% 52% 44%
SDN 3 Sukamanah Baseline 43% 44% 45% 27% Midline 34% 47% 49% 67% Endline 65% 33% 64% 63%
Comparison MI Sumber Jaya Baseline 46% 42% 32% 35% Midline 29% 43% 45% 70% Endline 63% 48% 45% 45%
SDN 1 Pamarican Baseline 37% 14% 44% 41% Midline 55% 40% 64% 50% Endline 46% 33% 65% 49%
SDN 2 Pamokolan Baseline 27% 23% 31% 42% Midline 57% 35% 41% 45% Endline 52% 25% 55% 43%
SDN 5 Kertahayu Baseline 46% 45% 29% 26% Midline 18% 17% 30% 39% Endline 39% 29% 27% 33%
Cimahi Partner MI Asih Putra Baseline 73% 49% 52% 41% Midline 60% 62% 58% 54% Endline 68% 55% 68% 68%
SDN Cibabat Mandiri 2 Baseline 53% 53% 54% 43% Midline 62% 68% 59% 76% Endline 83% 76% 72% 54%
SDN Sosial 1 Baseline 58% 43% 48% 50% Midline 48% 46% 60% 76% Endline 79% 78% 63% 63%
SDN Utama Mandiri 1 Baseline 37% 38% 46% 39% Midline 47% 60% 51% 58% Endline 53% 43% 56% 71%
Comparison MI Sadarmanah Baseline 51% 48% 44% 29% Midline 57% 48% 50% 66% Endline 44% 35% 49% 51%
SDN Harapan 2 Baseline 55% 36% 37% 39% Midline 56% 46% 57% 49%
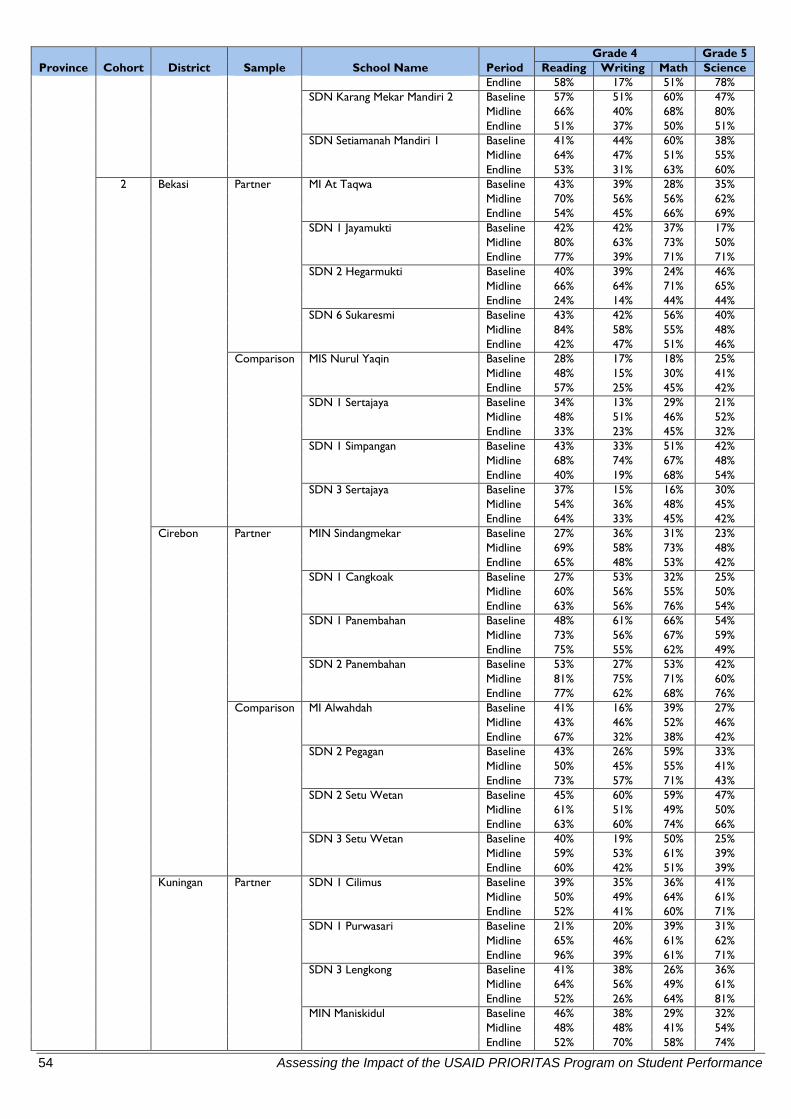
54 Assessing the Impact of the USAID PRIORITAS Program on Student Performance
Province Cohort District Sample School Name Period Grade 4 Grade 5
Reading Writing Math Science Endline 58% 17% 51% 78%
SDN Karang Mekar Mandiri 2 Baseline 57% 51% 60% 47% Midline 66% 40% 68% 80% Endline 51% 37% 50% 51%
SDN Setiamanah Mandiri 1 Baseline 41% 44% 60% 38% Midline 64% 47% 51% 55% Endline 53% 31% 63% 60%
2 Bekasi Partner MI At Taqwa Baseline 43% 39% 28% 35% Midline 70% 56% 56% 62% Endline 54% 45% 66% 69%
SDN 1 Jayamukti Baseline 42% 42% 37% 17% Midline 80% 63% 73% 50% Endline 77% 39% 71% 71%
SDN 2 Hegarmukti Baseline 40% 39% 24% 46% Midline 66% 64% 71% 65% Endline 24% 14% 44% 44%
SDN 6 Sukaresmi Baseline 43% 42% 56% 40% Midline 84% 58% 55% 48% Endline 42% 47% 51% 46%
Comparison MIS Nurul Yaqin Baseline 28% 17% 18% 25% Midline 48% 15% 30% 41% Endline 57% 25% 45% 42%
SDN 1 Sertajaya Baseline 34% 13% 29% 21% Midline 48% 51% 46% 52% Endline 33% 23% 45% 32%
SDN 1 Simpangan Baseline 43% 33% 51% 42% Midline 68% 74% 67% 48% Endline 40% 19% 68% 54%
SDN 3 Sertajaya Baseline 37% 15% 16% 30% Midline 54% 36% 48% 45% Endline 64% 33% 45% 42%
Cirebon Partner MIN Sindangmekar Baseline 27% 36% 31% 23% Midline 69% 58% 73% 48% Endline 65% 48% 53% 42%
SDN 1 Cangkoak Baseline 27% 53% 32% 25% Midline 60% 56% 55% 50% Endline 63% 56% 76% 54%
SDN 1 Panembahan Baseline 48% 61% 66% 54% Midline 73% 56% 67% 59% Endline 75% 55% 62% 49%
SDN 2 Panembahan Baseline 53% 27% 53% 42% Midline 81% 75% 71% 60% Endline 77% 62% 68% 76%
Comparison MI Alwahdah Baseline 41% 16% 39% 27% Midline 43% 46% 52% 46% Endline 67% 32% 38% 42%
SDN 2 Pegagan Baseline 43% 26% 59% 33% Midline 50% 45% 55% 41% Endline 73% 57% 71% 43%
SDN 2 Setu Wetan Baseline 45% 60% 59% 47% Midline 61% 51% 49% 50% Endline 63% 60% 74% 66%
SDN 3 Setu Wetan Baseline 40% 19% 50% 25% Midline 59% 53% 61% 39% Endline 60% 42% 51% 39%
Kuningan Partner SDN 1 Cilimus Baseline 39% 35% 36% 41% Midline 50% 49% 64% 61% Endline 52% 41% 60% 71%
SDN 1 Purwasari Baseline 21% 20% 39% 31% Midline 65% 46% 61% 62% Endline 96% 39% 61% 71%
SDN 3 Lengkong Baseline 41% 38% 26% 36% Midline 64% 56% 49% 61% Endline 52% 26% 64% 81%
MIN Maniskidul Baseline 46% 38% 29% 32% Midline 48% 48% 41% 54% Endline 52% 70% 58% 74%
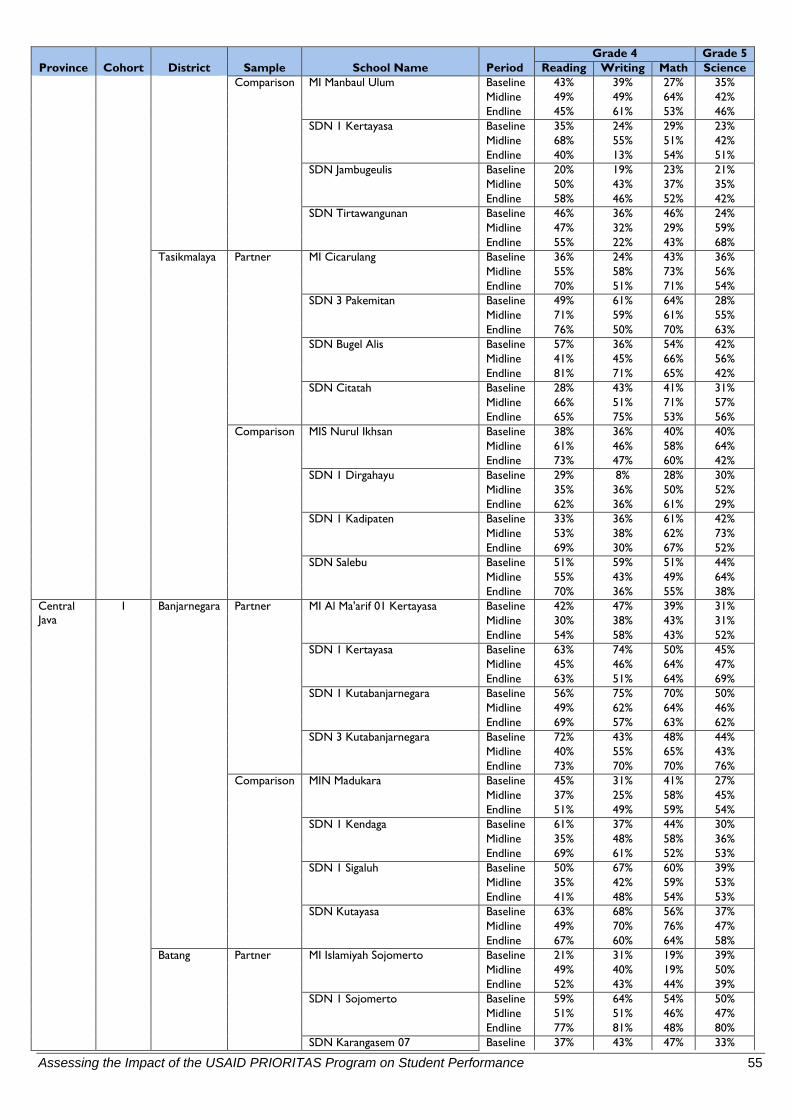
Assessing the Impact of the USAID PRIORITAS Program on Student Performance 55
Province Cohort District Sample School Name Period Grade 4 Grade 5
Reading Writing Math Science Comparison MI Manbaul Ulum Baseline 43% 39% 27% 35%
Midline 49% 49% 64% 42% Endline 45% 61% 53% 46%
SDN 1 Kertayasa Baseline 35% 24% 29% 23% Midline 68% 55% 51% 42% Endline 40% 13% 54% 51%
SDN Jambugeulis Baseline 20% 19% 23% 21% Midline 50% 43% 37% 35% Endline 58% 46% 52% 42%
SDN Tirtawangunan Baseline 46% 36% 46% 24% Midline 47% 32% 29% 59% Endline 55% 22% 43% 68%
Tasikmalaya Partner MI Cicarulang Baseline 36% 24% 43% 36% Midline 55% 58% 73% 56% Endline 70% 51% 71% 54%
SDN 3 Pakemitan Baseline 49% 61% 64% 28% Midline 71% 59% 61% 55% Endline 76% 50% 70% 63%
SDN Bugel Alis Baseline 57% 36% 54% 42% Midline 41% 45% 66% 56% Endline 81% 71% 65% 42%
SDN Citatah Baseline 28% 43% 41% 31% Midline 66% 51% 71% 57% Endline 65% 75% 53% 56%
Comparison MIS Nurul Ikhsan Baseline 38% 36% 40% 40% Midline 61% 46% 58% 64% Endline 73% 47% 60% 42%
SDN 1 Dirgahayu Baseline 29% 8% 28% 30% Midline 35% 36% 50% 52% Endline 62% 36% 61% 29%
SDN 1 Kadipaten Baseline 33% 36% 61% 42% Midline 53% 38% 62% 73% Endline 69% 30% 67% 52%
SDN Salebu Baseline 51% 59% 51% 44% Midline 55% 43% 49% 64% Endline 70% 36% 55% 38%
Central Java
1 Banjarnegara Partner MI Al Ma'arif 01 Kertayasa Baseline 42% 47% 39% 31% Midline 30% 38% 43% 31% Endline 54% 58% 43% 52%
SDN 1 Kertayasa Baseline 63% 74% 50% 45% Midline 45% 46% 64% 47% Endline 63% 51% 64% 69%
SDN 1 Kutabanjarnegara Baseline 56% 75% 70% 50% Midline 49% 62% 64% 46% Endline 69% 57% 63% 62%
SDN 3 Kutabanjarnegara Baseline 72% 43% 48% 44% Midline 40% 55% 65% 43% Endline 73% 70% 70% 76%
Comparison MIN Madukara Baseline 45% 31% 41% 27% Midline 37% 25% 58% 45% Endline 51% 49% 59% 54%
SDN 1 Kendaga Baseline 61% 37% 44% 30% Midline 35% 48% 58% 36% Endline 69% 61% 52% 53%
SDN 1 Sigaluh Baseline 50% 67% 60% 39% Midline 35% 42% 59% 53% Endline 41% 48% 54% 53%
SDN Kutayasa Baseline 63% 68% 56% 37% Midline 49% 70% 76% 47% Endline 67% 60% 64% 58%
Batang Partner MI Islamiyah Sojomerto Baseline 21% 31% 19% 39% Midline 49% 40% 19% 50% Endline 52% 43% 44% 39%
SDN 1 Sojomerto Baseline 59% 64% 54% 50% Midline 51% 51% 46% 47% Endline 77% 81% 48% 80%
SDN Karangasem 07 Baseline 37% 43% 47% 33%

56 Assessing the Impact of the USAID PRIORITAS Program on Student Performance
Province Cohort District Sample School Name Period Grade 4 Grade 5
Reading Writing Math Science Midline 70% 63% 41% 40% Endline 50% 75% 40% 68%
SDN Karangasem 12 Baseline 68% 86% 41% 27% Midline 69% 64% 46% 45% Endline 54% 57% 50% 35%
Comparison MI Rifaiyah Limpung Baseline 53% 56% 62% 42% Midline 55% 55% 37% 42% Endline 58% 62% 50% 50%
SDN 2 Tulis Baseline 34% 47% 52% 33% Midline 46% 61% 45% 46% Endline 54% 65% 40% 47%
SDN Kaliboyo 01 Baseline 57% 59% 63% 41% Midline 60% 32% 54% 40% Endline 60% 70% 71% 38%
SDN Limpung 1 Baseline 40% 66% 63% 40% Midline 65% 59% 47% 57% Endline 69% 74% 66% 64%
Purbalingga Partner MI Muhammadiyah Toyareka Baseline 46% 47% 41% 32% Midline 35% 60% 43% 31% Endline 66% 51% 86% 45%
SDN 1 Bakulan Baseline 58% 68% 48% 40% Midline 27% 49% 41% 35% Endline 56% 51% 66% 49%
SDN 1 Cipaku Baseline 40% 58% 63% 35% Midline 33% 38% 45% 45% Endline 63% 50% 65% 36%
SDN 1 Mangunegara Baseline 60% 46% 57% 50% Midline 51% 54% 47% 61% Endline 77% 66% 74% 56%
Comparison MI Muhammadiyah Gumiwang Baseline 45% 42% 55% 35% Midline 71% 41% 35% 47% Endline 47% 39% 57% 46%
SDN 1 Kejobong Baseline 59% 64% 52% 35% Midline 23% 41% 44% 51% Endline 60% 58% 61% 42%
SDN 1 Padamara Baseline 43% 56% 54% 35% Midline 28% 51% 55% 37% Endline 74% 58% 75% 44%
SDN 1 Prigi Baseline 59% 43% 50% 35% Midline 31% 48% 54% 27% Endline 63% 44% 58% 50%
Semarang Partner MI Klero Baseline 39% 58% 50% 40% Midline 58% 62% 44% 60% Endline 59% 39% 41% 49%
SDN 1 Tengaran Baseline 76% 78% 66% 60% Midline 50% 33% 68% 69% Endline 49% 66% 54% 57%
SDN Jubelan 01 Baseline 55% 47% 48% 56% Midline 54% 64% 64% 53% Endline 69% 50% 62% 57%
SDN Sumowono 02 Baseline 49% 48% 66% 61% Midline 64% 67% 64% 58% Endline 46% 67% 59% 69%
Comparison MI Darul Hikmah Cukilan 1 Baseline 43% 37% 38% 26% Midline 42% 26% 55% 63% Endline 66% 60% 61% 53%
SDN 3 Tuntang Baseline 78% 75% 63% 41% Midline 51% 46% 51% 53% Endline 52% 36% 60% 49%
SDN Bandungan 3 Baseline 55% 54% 47% 32% Midline 50% 41% 49% 57% Endline 52% 25% 52% 41%
SDN Kenteng 1 Baseline 41% 48% 53% 36% Midline 45% 47% 51% 47% Endline 54% 40% 60% 37%
Sragen Partner MI Muhammadiyah Karanganyar Baseline 60% 53% 47% 48% Midline 39% 53% 38% 28%
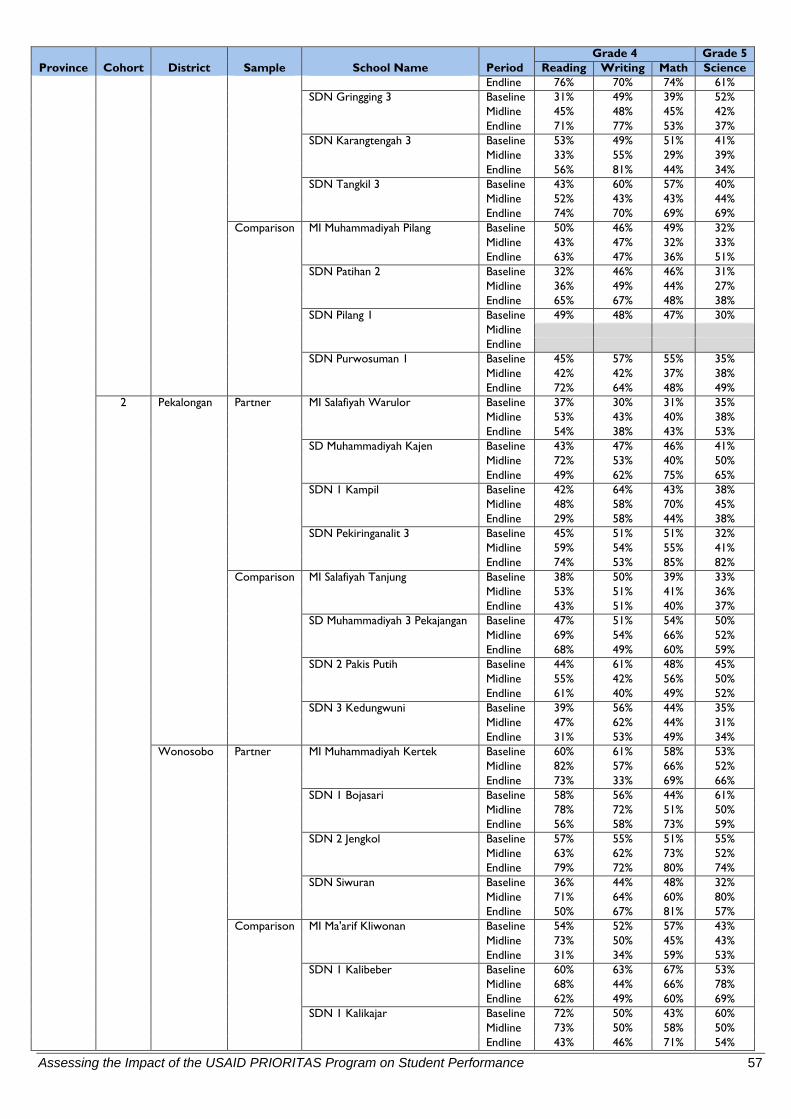
Assessing the Impact of the USAID PRIORITAS Program on Student Performance 57
Province Cohort District Sample School Name Period Grade 4 Grade 5
Reading Writing Math Science Endline 76% 70% 74% 61%
SDN Gringging 3 Baseline 31% 49% 39% 52% Midline 45% 48% 45% 42% Endline 71% 77% 53% 37%
SDN Karangtengah 3 Baseline 53% 49% 51% 41% Midline 33% 55% 29% 39% Endline 56% 81% 44% 34%
SDN Tangkil 3 Baseline 43% 60% 57% 40% Midline 52% 43% 43% 44% Endline 74% 70% 69% 69%
Comparison MI Muhammadiyah Pilang Baseline 50% 46% 49% 32% Midline 43% 47% 32% 33% Endline 63% 47% 36% 51%
SDN Patihan 2 Baseline 32% 46% 46% 31% Midline 36% 49% 44% 27% Endline 65% 67% 48% 38%
SDN Pilang 1 Baseline 49% 48% 47% 30% Midline Endline
SDN Purwosuman 1 Baseline 45% 57% 55% 35% Midline 42% 42% 37% 38% Endline 72% 64% 48% 49%
2 Pekalongan Partner MI Salafiyah Warulor Baseline 37% 30% 31% 35% Midline 53% 43% 40% 38% Endline 54% 38% 43% 53%
SD Muhammadiyah Kajen Baseline 43% 47% 46% 41% Midline 72% 53% 40% 50% Endline 49% 62% 75% 65%
SDN 1 Kampil Baseline 42% 64% 43% 38% Midline 48% 58% 70% 45% Endline 29% 58% 44% 38%
SDN Pekiringanalit 3 Baseline 45% 51% 51% 32% Midline 59% 54% 55% 41% Endline 74% 53% 85% 82%
Comparison MI Salafiyah Tanjung Baseline 38% 50% 39% 33% Midline 53% 51% 41% 36% Endline 43% 51% 40% 37%
SD Muhammadiyah 3 Pekajangan Baseline 47% 51% 54% 50% Midline 69% 54% 66% 52% Endline 68% 49% 60% 59%
SDN 2 Pakis Putih Baseline 44% 61% 48% 45% Midline 55% 42% 56% 50% Endline 61% 40% 49% 52%
SDN 3 Kedungwuni Baseline 39% 56% 44% 35% Midline 47% 62% 44% 31% Endline 31% 53% 49% 34%
Wonosobo Partner MI Muhammadiyah Kertek Baseline 60% 61% 58% 53% Midline 82% 57% 66% 52% Endline 73% 33% 69% 66%
SDN 1 Bojasari Baseline 58% 56% 44% 61% Midline 78% 72% 51% 50% Endline 56% 58% 73% 59%
SDN 2 Jengkol Baseline 57% 55% 51% 55% Midline 63% 62% 73% 52% Endline 79% 72% 80% 74%
SDN Siwuran Baseline 36% 44% 48% 32% Midline 71% 64% 60% 80% Endline 50% 67% 81% 57%
Comparison MI Ma'arif Kliwonan Baseline 54% 52% 57% 43% Midline 73% 50% 45% 43% Endline 31% 34% 59% 53%
SDN 1 Kalibeber Baseline 60% 63% 67% 53% Midline 68% 44% 66% 78% Endline 62% 49% 60% 69%
SDN 1 Kalikajar Baseline 72% 50% 43% 60% Midline 73% 50% 58% 50% Endline 43% 46% 71% 54%
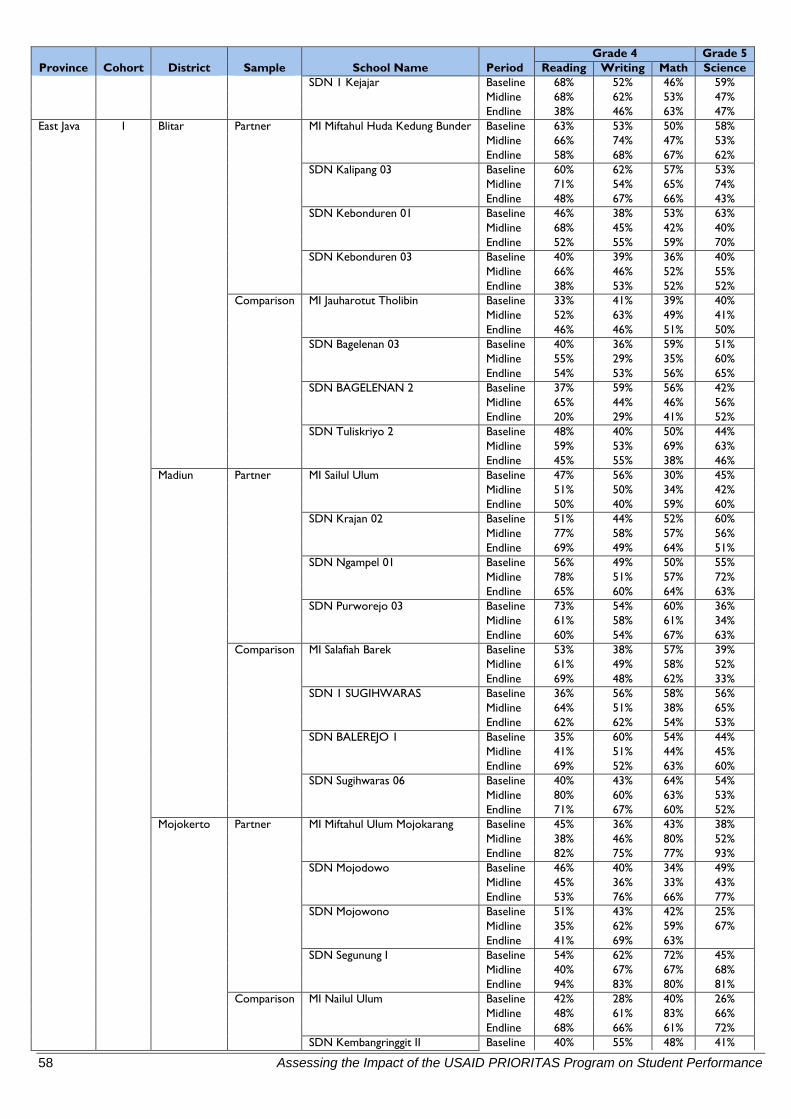
58 Assessing the Impact of the USAID PRIORITAS Program on Student Performance
Province Cohort District Sample School Name Period Grade 4 Grade 5
Reading Writing Math Science SDN 1 Kejajar Baseline 68% 52% 46% 59%
Midline 68% 62% 53% 47% Endline 38% 46% 63% 47%
East Java 1 Blitar Partner MI Miftahul Huda Kedung Bunder Baseline 63% 53% 50% 58% Midline 66% 74% 47% 53% Endline 58% 68% 67% 62%
SDN Kalipang 03 Baseline 60% 62% 57% 53% Midline 71% 54% 65% 74% Endline 48% 67% 66% 43%
SDN Kebonduren 01 Baseline 46% 38% 53% 63% Midline 68% 45% 42% 40% Endline 52% 55% 59% 70%
SDN Kebonduren 03 Baseline 40% 39% 36% 40% Midline 66% 46% 52% 55% Endline 38% 53% 52% 52%
Comparison MI Jauharotut Tholibin Baseline 33% 41% 39% 40% Midline 52% 63% 49% 41% Endline 46% 46% 51% 50%
SDN Bagelenan 03 Baseline 40% 36% 59% 51% Midline 55% 29% 35% 60% Endline 54% 53% 56% 65%
SDN BAGELENAN 2 Baseline 37% 59% 56% 42% Midline 65% 44% 46% 56% Endline 20% 29% 41% 52%
SDN Tuliskriyo 2 Baseline 48% 40% 50% 44% Midline 59% 53% 69% 63% Endline 45% 55% 38% 46%
Madiun Partner MI Sailul Ulum Baseline 47% 56% 30% 45% Midline 51% 50% 34% 42% Endline 50% 40% 59% 60%
SDN Krajan 02 Baseline 51% 44% 52% 60% Midline 77% 58% 57% 56% Endline 69% 49% 64% 51%
SDN Ngampel 01 Baseline 56% 49% 50% 55% Midline 78% 51% 57% 72% Endline 65% 60% 64% 63%
SDN Purworejo 03 Baseline 73% 54% 60% 36% Midline 61% 58% 61% 34% Endline 60% 54% 67% 63%
Comparison MI Salafiah Barek Baseline 53% 38% 57% 39% Midline 61% 49% 58% 52% Endline 69% 48% 62% 33%
SDN 1 SUGIHWARAS Baseline 36% 56% 58% 56% Midline 64% 51% 38% 65% Endline 62% 62% 54% 53%
SDN BALEREJO 1 Baseline 35% 60% 54% 44% Midline 41% 51% 44% 45% Endline 69% 52% 63% 60%
SDN Sugihwaras 06 Baseline 40% 43% 64% 54% Midline 80% 60% 63% 53% Endline 71% 67% 60% 52%
Mojokerto Partner MI Miftahul Ulum Mojokarang Baseline 45% 36% 43% 38% Midline 38% 46% 80% 52% Endline 82% 75% 77% 93%
SDN Mojodowo Baseline 46% 40% 34% 49% Midline 45% 36% 33% 43% Endline 53% 76% 66% 77%
SDN Mojowono Baseline 51% 43% 42% 25% Midline 35% 62% 59% 67% Endline 41% 69% 63%
SDN Segunung I Baseline 54% 62% 72% 45% Midline 40% 67% 67% 68% Endline 94% 83% 80% 81%
Comparison MI Nailul Ulum Baseline 42% 28% 40% 26% Midline 48% 61% 83% 66% Endline 68% 66% 61% 72%
SDN Kembangringgit II Baseline 40% 55% 48% 41%
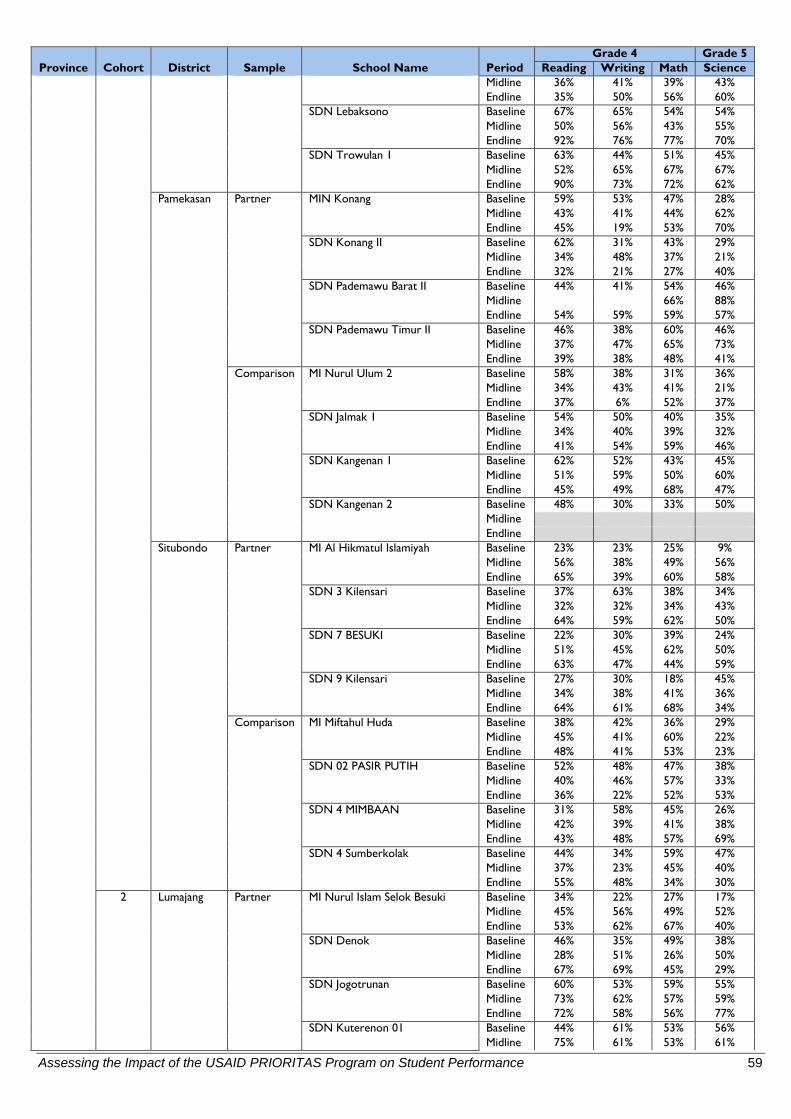
Assessing the Impact of the USAID PRIORITAS Program on Student Performance 59
Province Cohort District Sample School Name Period Grade 4 Grade 5
Reading Writing Math Science Midline 36% 41% 39% 43% Endline 35% 50% 56% 60%
SDN Lebaksono Baseline 67% 65% 54% 54% Midline 50% 56% 43% 55% Endline 92% 76% 77% 70%
SDN Trowulan 1 Baseline 63% 44% 51% 45% Midline 52% 65% 67% 67% Endline 90% 73% 72% 62%
Pamekasan Partner MIN Konang Baseline 59% 53% 47% 28% Midline 43% 41% 44% 62% Endline 45% 19% 53% 70%
SDN Konang II Baseline 62% 31% 43% 29% Midline 34% 48% 37% 21% Endline 32% 21% 27% 40%
SDN Pademawu Barat II Baseline 44% 41% 54% 46% Midline 66% 88% Endline 54% 59% 59% 57%
SDN Pademawu Timur II Baseline 46% 38% 60% 46% Midline 37% 47% 65% 73% Endline 39% 38% 48% 41%
Comparison MI Nurul Ulum 2 Baseline 58% 38% 31% 36% Midline 34% 43% 41% 21% Endline 37% 6% 52% 37%
SDN Jalmak 1 Baseline 54% 50% 40% 35% Midline 34% 40% 39% 32% Endline 41% 54% 59% 46%
SDN Kangenan 1 Baseline 62% 52% 43% 45% Midline 51% 59% 50% 60% Endline 45% 49% 68% 47%
SDN Kangenan 2 Baseline 48% 30% 33% 50% Midline Endline
Situbondo Partner MI Al Hikmatul Islamiyah Baseline 23% 23% 25% 9% Midline 56% 38% 49% 56% Endline 65% 39% 60% 58%
SDN 3 Kilensari Baseline 37% 63% 38% 34% Midline 32% 32% 34% 43% Endline 64% 59% 62% 50%
SDN 7 BESUKI Baseline 22% 30% 39% 24% Midline 51% 45% 62% 50% Endline 63% 47% 44% 59%
SDN 9 Kilensari Baseline 27% 30% 18% 45% Midline 34% 38% 41% 36% Endline 64% 61% 68% 34%
Comparison MI Miftahul Huda Baseline 38% 42% 36% 29% Midline 45% 41% 60% 22% Endline 48% 41% 53% 23%
SDN 02 PASIR PUTIH Baseline 52% 48% 47% 38% Midline 40% 46% 57% 33% Endline 36% 22% 52% 53%
SDN 4 MIMBAAN Baseline 31% 58% 45% 26% Midline 42% 39% 41% 38% Endline 43% 48% 57% 69%
SDN 4 Sumberkolak Baseline 44% 34% 59% 47% Midline 37% 23% 45% 40% Endline 55% 48% 34% 30%
2 Lumajang Partner MI Nurul Islam Selok Besuki Baseline 34% 22% 27% 17% Midline 45% 56% 49% 52% Endline 53% 62% 67% 40%
SDN Denok Baseline 46% 35% 49% 38% Midline 28% 51% 26% 50% Endline 67% 69% 45% 29%
SDN Jogotrunan Baseline 60% 53% 59% 55% Midline 73% 62% 57% 59% Endline 72% 58% 56% 77%
SDN Kuterenon 01 Baseline 44% 61% 53% 56% Midline 75% 61% 53% 61%
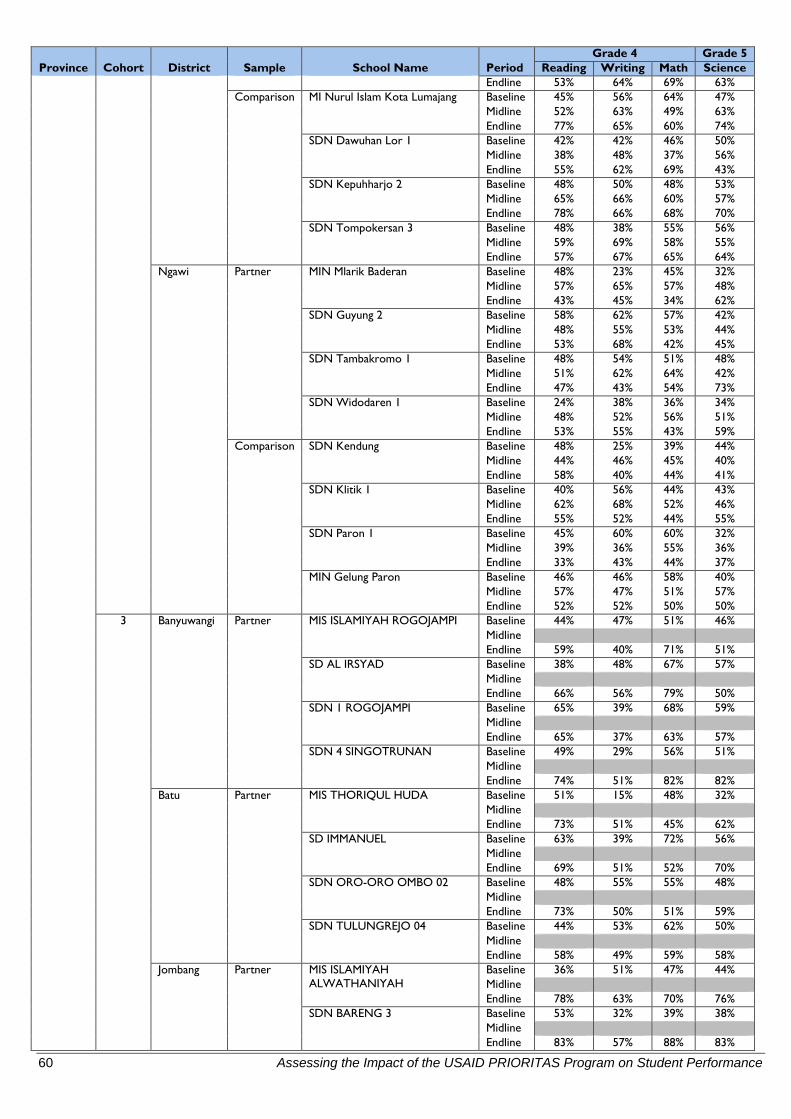
60 Assessing the Impact of the USAID PRIORITAS Program on Student Performance
Province Cohort District Sample School Name Period Grade 4 Grade 5
Reading Writing Math Science Endline 53% 64% 69% 63%
Comparison MI Nurul Islam Kota Lumajang Baseline 45% 56% 64% 47% Midline 52% 63% 49% 63% Endline 77% 65% 60% 74%
SDN Dawuhan Lor 1 Baseline 42% 42% 46% 50% Midline 38% 48% 37% 56% Endline 55% 62% 69% 43%
SDN Kepuhharjo 2 Baseline 48% 50% 48% 53% Midline 65% 66% 60% 57% Endline 78% 66% 68% 70%
SDN Tompokersan 3 Baseline 48% 38% 55% 56% Midline 59% 69% 58% 55% Endline 57% 67% 65% 64%
Ngawi Partner MIN Mlarik Baderan Baseline 48% 23% 45% 32% Midline 57% 65% 57% 48% Endline 43% 45% 34% 62%
SDN Guyung 2 Baseline 58% 62% 57% 42% Midline 48% 55% 53% 44% Endline 53% 68% 42% 45%
SDN Tambakromo 1 Baseline 48% 54% 51% 48% Midline 51% 62% 64% 42% Endline 47% 43% 54% 73%
SDN Widodaren 1 Baseline 24% 38% 36% 34% Midline 48% 52% 56% 51% Endline 53% 55% 43% 59%
Comparison SDN Kendung Baseline 48% 25% 39% 44% Midline 44% 46% 45% 40% Endline 58% 40% 44% 41%
SDN Klitik 1 Baseline 40% 56% 44% 43% Midline 62% 68% 52% 46% Endline 55% 52% 44% 55%
SDN Paron 1 Baseline 45% 60% 60% 32% Midline 39% 36% 55% 36% Endline 33% 43% 44% 37%
MIN Gelung Paron Baseline 46% 46% 58% 40% Midline 57% 47% 51% 57% Endline 52% 52% 50% 50%
3 Banyuwangi Partner MIS ISLAMIYAH ROGOJAMPI Baseline 44% 47% 51% 46% Midline Endline 59% 40% 71% 51%
SD AL IRSYAD Baseline 38% 48% 67% 57% Midline Endline 66% 56% 79% 50%
SDN 1 ROGOJAMPI Baseline 65% 39% 68% 59% Midline Endline 65% 37% 63% 57%
SDN 4 SINGOTRUNAN Baseline 49% 29% 56% 51% Midline Endline 74% 51% 82% 82%
Batu Partner MIS THORIQUL HUDA Baseline 51% 15% 48% 32% Midline Endline 73% 51% 45% 62%
SD IMMANUEL Baseline 63% 39% 72% 56% Midline Endline 69% 51% 52% 70%
SDN ORO-ORO OMBO 02 Baseline 48% 55% 55% 48% Midline Endline 73% 50% 51% 59%
SDN TULUNGREJO 04 Baseline 44% 53% 62% 50% Midline Endline 58% 49% 59% 58%
Jombang Partner MIS ISLAMIYAH ALWATHANIYAH
Baseline 36% 51% 47% 44% Midline Endline 78% 63% 70% 76%
SDN BARENG 3 Baseline 53% 32% 39% 38% Midline Endline 83% 57% 88% 83%
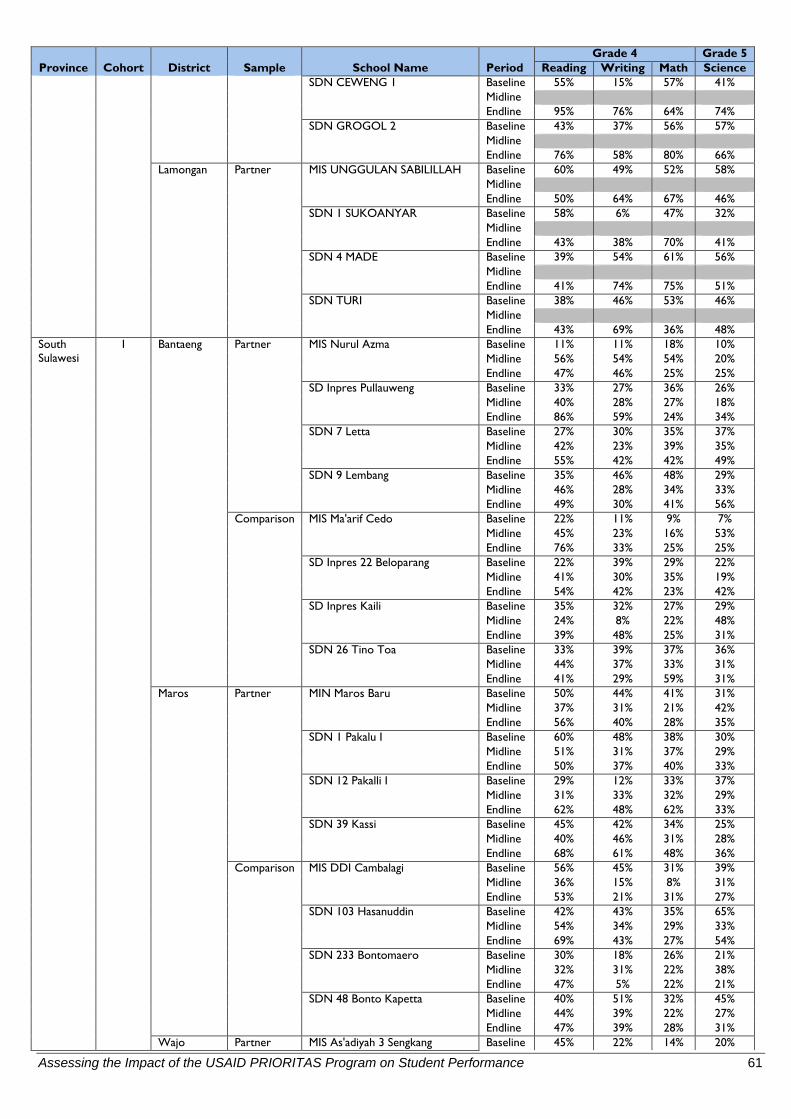
Assessing the Impact of the USAID PRIORITAS Program on Student Performance 61
Province Cohort District Sample School Name Period Grade 4 Grade 5
Reading Writing Math Science SDN CEWENG 1 Baseline 55% 15% 57% 41%
Midline Endline 95% 76% 64% 74%
SDN GROGOL 2 Baseline 43% 37% 56% 57% Midline Endline 76% 58% 80% 66%
Lamongan Partner MIS UNGGULAN SABILILLAH Baseline 60% 49% 52% 58% Midline Endline 50% 64% 67% 46%
SDN 1 SUKOANYAR Baseline 58% 6% 47% 32% Midline Endline 43% 38% 70% 41%
SDN 4 MADE Baseline 39% 54% 61% 56% Midline Endline 41% 74% 75% 51%
SDN TURI Baseline 38% 46% 53% 46% Midline Endline 43% 69% 36% 48%
South Sulawesi
1 Bantaeng Partner MIS Nurul Azma Baseline 11% 11% 18% 10% Midline 56% 54% 54% 20% Endline 47% 46% 25% 25%
SD Inpres Pullauweng Baseline 33% 27% 36% 26% Midline 40% 28% 27% 18% Endline 86% 59% 24% 34%
SDN 7 Letta Baseline 27% 30% 35% 37% Midline 42% 23% 39% 35% Endline 55% 42% 42% 49%
SDN 9 Lembang Baseline 35% 46% 48% 29% Midline 46% 28% 34% 33% Endline 49% 30% 41% 56%
Comparison MIS Ma'arif Cedo Baseline 22% 11% 9% 7% Midline 45% 23% 16% 53% Endline 76% 33% 25% 25%
SD Inpres 22 Beloparang Baseline 22% 39% 29% 22% Midline 41% 30% 35% 19% Endline 54% 42% 23% 42%
SD Inpres Kaili Baseline 35% 32% 27% 29% Midline 24% 8% 22% 48% Endline 39% 48% 25% 31%
SDN 26 Tino Toa Baseline 33% 39% 37% 36% Midline 44% 37% 33% 31% Endline 41% 29% 59% 31%
Maros Partner MIN Maros Baru Baseline 50% 44% 41% 31% Midline 37% 31% 21% 42% Endline 56% 40% 28% 35%
SDN 1 Pakalu I Baseline 60% 48% 38% 30% Midline 51% 31% 37% 29% Endline 50% 37% 40% 33%
SDN 12 Pakalli I Baseline 29% 12% 33% 37% Midline 31% 33% 32% 29% Endline 62% 48% 62% 33%
SDN 39 Kassi Baseline 45% 42% 34% 25% Midline 40% 46% 31% 28% Endline 68% 61% 48% 36%
Comparison MIS DDI Cambalagi Baseline 56% 45% 31% 39% Midline 36% 15% 8% 31% Endline 53% 21% 31% 27%
SDN 103 Hasanuddin Baseline 42% 43% 35% 65% Midline 54% 34% 29% 33% Endline 69% 43% 27% 54%
SDN 233 Bontomaero Baseline 30% 18% 26% 21% Midline 32% 31% 22% 38% Endline 47% 5% 22% 21%
SDN 48 Bonto Kapetta Baseline 40% 51% 32% 45% Midline 44% 39% 22% 27% Endline 47% 39% 28% 31%
Wajo Partner MIS As'adiyah 3 Sengkang Baseline 45% 22% 14% 20%
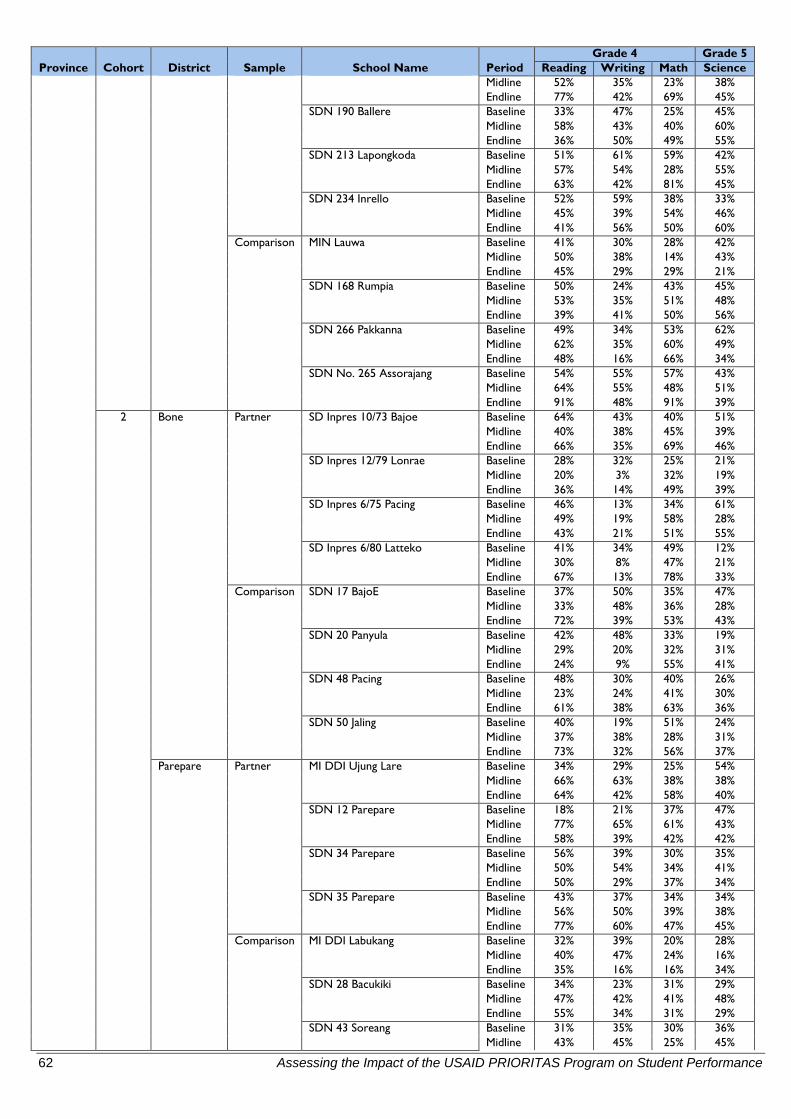
62 Assessing the Impact of the USAID PRIORITAS Program on Student Performance
Province Cohort District Sample School Name Period Grade 4 Grade 5
Reading Writing Math Science Midline 52% 35% 23% 38% Endline 77% 42% 69% 45%
SDN 190 Ballere Baseline 33% 47% 25% 45% Midline 58% 43% 40% 60% Endline 36% 50% 49% 55%
SDN 213 Lapongkoda Baseline 51% 61% 59% 42% Midline 57% 54% 28% 55% Endline 63% 42% 81% 45%
SDN 234 Inrello Baseline 52% 59% 38% 33% Midline 45% 39% 54% 46% Endline 41% 56% 50% 60%
Comparison MIN Lauwa Baseline 41% 30% 28% 42% Midline 50% 38% 14% 43% Endline 45% 29% 29% 21%
SDN 168 Rumpia Baseline 50% 24% 43% 45% Midline 53% 35% 51% 48% Endline 39% 41% 50% 56%
SDN 266 Pakkanna Baseline 49% 34% 53% 62% Midline 62% 35% 60% 49% Endline 48% 16% 66% 34%
SDN No. 265 Assorajang Baseline 54% 55% 57% 43% Midline 64% 55% 48% 51% Endline 91% 48% 91% 39%
2 Bone Partner SD Inpres 10/73 Bajoe Baseline 64% 43% 40% 51% Midline 40% 38% 45% 39% Endline 66% 35% 69% 46%
SD Inpres 12/79 Lonrae Baseline 28% 32% 25% 21% Midline 20% 3% 32% 19% Endline 36% 14% 49% 39%
SD Inpres 6/75 Pacing Baseline 46% 13% 34% 61% Midline 49% 19% 58% 28% Endline 43% 21% 51% 55%
SD Inpres 6/80 Latteko Baseline 41% 34% 49% 12% Midline 30% 8% 47% 21% Endline 67% 13% 78% 33%
Comparison SDN 17 BajoE Baseline 37% 50% 35% 47% Midline 33% 48% 36% 28% Endline 72% 39% 53% 43%
SDN 20 Panyula Baseline 42% 48% 33% 19% Midline 29% 20% 32% 31% Endline 24% 9% 55% 41%
SDN 48 Pacing Baseline 48% 30% 40% 26% Midline 23% 24% 41% 30% Endline 61% 38% 63% 36%
SDN 50 Jaling Baseline 40% 19% 51% 24% Midline 37% 38% 28% 31% Endline 73% 32% 56% 37%
Parepare Partner MI DDI Ujung Lare Baseline 34% 29% 25% 54% Midline 66% 63% 38% 38% Endline 64% 42% 58% 40%
SDN 12 Parepare Baseline 18% 21% 37% 47% Midline 77% 65% 61% 43% Endline 58% 39% 42% 42%
SDN 34 Parepare Baseline 56% 39% 30% 35% Midline 50% 54% 34% 41% Endline 50% 29% 37% 34%
SDN 35 Parepare Baseline 43% 37% 34% 34% Midline 56% 50% 39% 38% Endline 77% 60% 47% 45%
Comparison MI DDI Labukang Baseline 32% 39% 20% 28% Midline 40% 47% 24% 16% Endline 35% 16% 16% 34%
SDN 28 Bacukiki Baseline 34% 23% 31% 29% Midline 47% 42% 41% 48% Endline 55% 34% 31% 29%
SDN 43 Soreang Baseline 31% 35% 30% 36% Midline 43% 45% 25% 45%
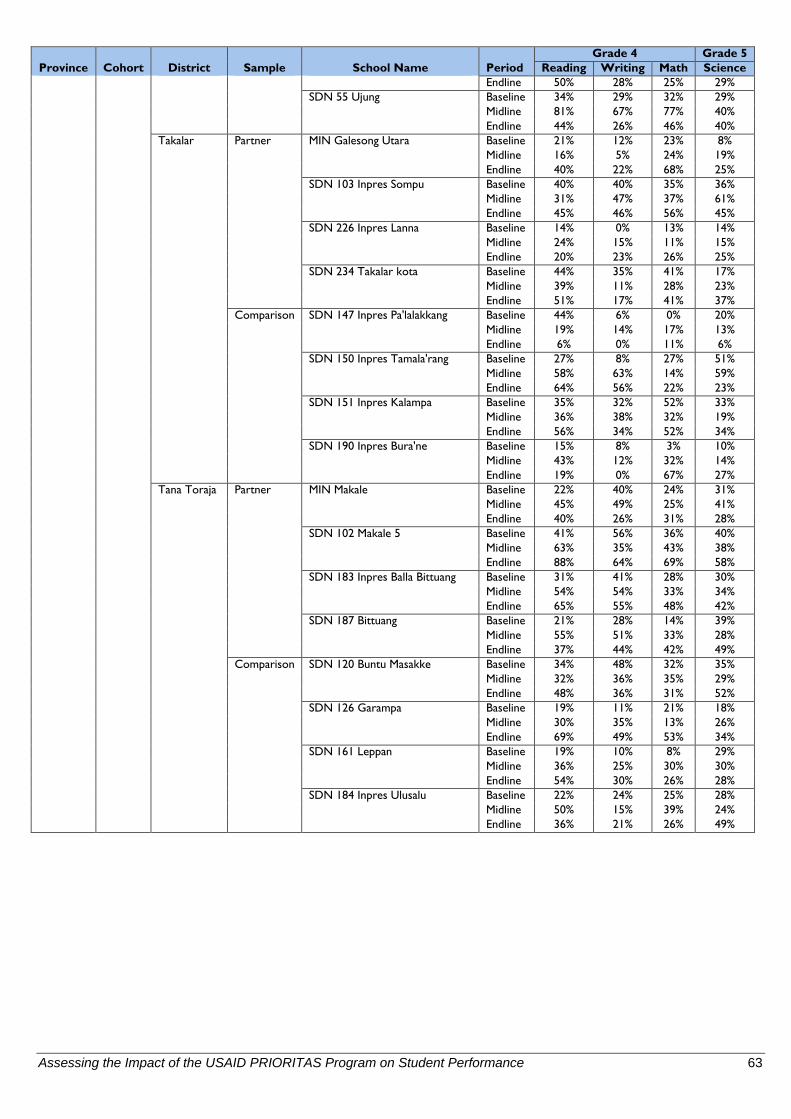
Assessing the Impact of the USAID PRIORITAS Program on Student Performance 63
Province Cohort District Sample School Name Period Grade 4 Grade 5
Reading Writing Math Science Endline 50% 28% 25% 29%
SDN 55 Ujung Baseline 34% 29% 32% 29% Midline 81% 67% 77% 40% Endline 44% 26% 46% 40%
Takalar Partner MIN Galesong Utara Baseline 21% 12% 23% 8% Midline 16% 5% 24% 19% Endline 40% 22% 68% 25%
SDN 103 Inpres Sompu Baseline 40% 40% 35% 36% Midline 31% 47% 37% 61% Endline 45% 46% 56% 45%
SDN 226 Inpres Lanna Baseline 14% 0% 13% 14% Midline 24% 15% 11% 15% Endline 20% 23% 26% 25%
SDN 234 Takalar kota Baseline 44% 35% 41% 17% Midline 39% 11% 28% 23% Endline 51% 17% 41% 37%
Comparison SDN 147 Inpres Pa'lalakkang Baseline 44% 6% 0% 20% Midline 19% 14% 17% 13% Endline 6% 0% 11% 6%
SDN 150 Inpres Tamala'rang Baseline 27% 8% 27% 51% Midline 58% 63% 14% 59% Endline 64% 56% 22% 23%
SDN 151 Inpres Kalampa Baseline 35% 32% 52% 33% Midline 36% 38% 32% 19% Endline 56% 34% 52% 34%
SDN 190 Inpres Bura'ne Baseline 15% 8% 3% 10% Midline 43% 12% 32% 14% Endline 19% 0% 67% 27%
Tana Toraja Partner MIN Makale Baseline 22% 40% 24% 31% Midline 45% 49% 25% 41% Endline 40% 26% 31% 28%
SDN 102 Makale 5 Baseline 41% 56% 36% 40% Midline 63% 35% 43% 38% Endline 88% 64% 69% 58%
SDN 183 Inpres Balla Bittuang Baseline 31% 41% 28% 30% Midline 54% 54% 33% 34% Endline 65% 55% 48% 42%
SDN 187 Bittuang Baseline 21% 28% 14% 39% Midline 55% 51% 33% 28% Endline 37% 44% 42% 49%
Comparison SDN 120 Buntu Masakke Baseline 34% 48% 32% 35% Midline 32% 36% 35% 29% Endline 48% 36% 31% 52%
SDN 126 Garampa Baseline 19% 11% 21% 18% Midline 30% 35% 13% 26% Endline 69% 49% 53% 34%
SDN 161 Leppan Baseline 19% 10% 8% 29% Midline 36% 25% 30% 30% Endline 54% 30% 26% 28%
SDN 184 Inpres Ulusalu Baseline 22% 24% 25% 28% Midline 50% 15% 39% 24% Endline 36% 21% 26% 49%
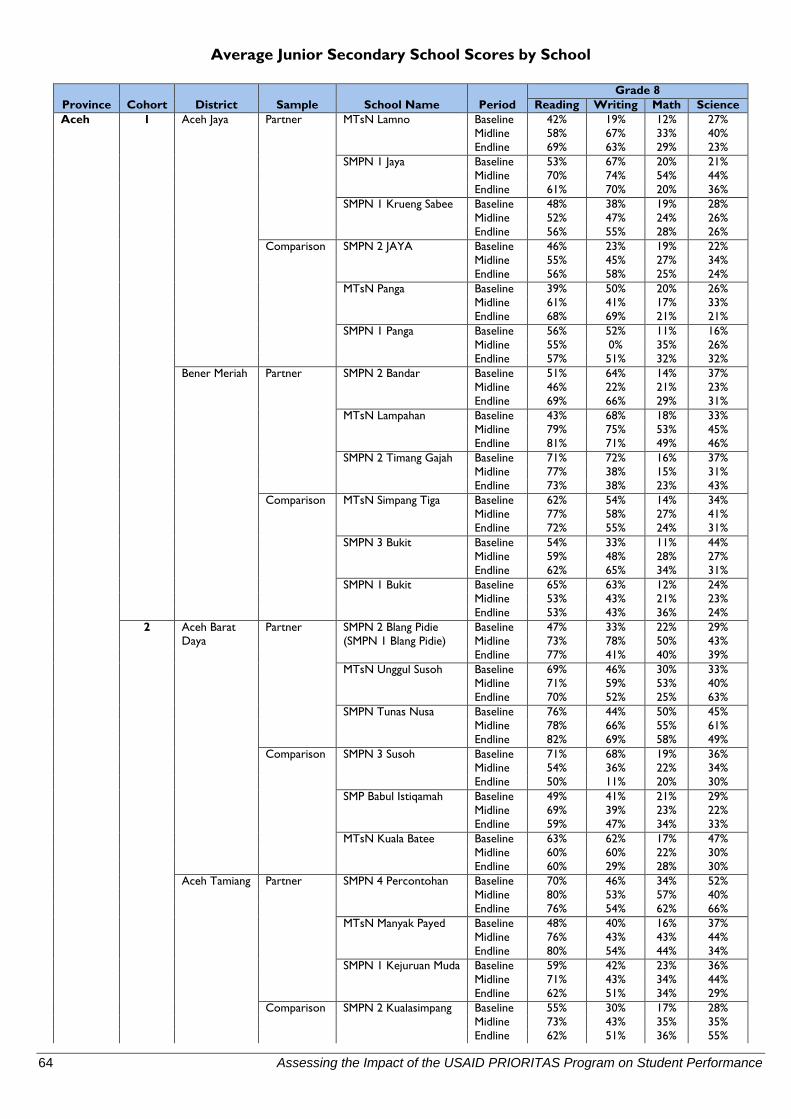
64 Assessing the Impact of the USAID PRIORITAS Program on Student Performance
Average Junior Secondary School Scores by School
Province Cohort District Sample School Name Period Grade 8
Reading Writing Math Science Aceh 1 Aceh Jaya Partner MTsN Lamno Baseline 42% 19% 12% 27%
Midline 58% 67% 33% 40% Endline 69% 63% 29% 23%
SMPN 1 Jaya Baseline 53% 67% 20% 21% Midline 70% 74% 54% 44% Endline 61% 70% 20% 36%
SMPN 1 Krueng Sabee Baseline 48% 38% 19% 28% Midline 52% 47% 24% 26% Endline 56% 55% 28% 26%
Comparison SMPN 2 JAYA Baseline 46% 23% 19% 22% Midline 55% 45% 27% 34% Endline 56% 58% 25% 24%
MTsN Panga Baseline 39% 50% 20% 26% Midline 61% 41% 17% 33% Endline 68% 69% 21% 21%
SMPN 1 Panga Baseline 56% 52% 11% 16% Midline 55% 0% 35% 26% Endline 57% 51% 32% 32%
Bener Meriah Partner SMPN 2 Bandar Baseline 51% 64% 14% 37% Midline 46% 22% 21% 23% Endline 69% 66% 29% 31%
MTsN Lampahan Baseline 43% 68% 18% 33% Midline 79% 75% 53% 45% Endline 81% 71% 49% 46%
SMPN 2 Timang Gajah Baseline 71% 72% 16% 37% Midline 77% 38% 15% 31% Endline 73% 38% 23% 43%
Comparison MTsN Simpang Tiga Baseline 62% 54% 14% 34% Midline 77% 58% 27% 41% Endline 72% 55% 24% 31%
SMPN 3 Bukit Baseline 54% 33% 11% 44% Midline 59% 48% 28% 27% Endline 62% 65% 34% 31%
SMPN 1 Bukit Baseline 65% 63% 12% 24% Midline 53% 43% 21% 23% Endline 53% 43% 36% 24%
2 Aceh Barat Daya
Partner SMPN 2 Blang Pidie (SMPN 1 Blang Pidie)
Baseline 47% 33% 22% 29% Midline 73% 78% 50% 43% Endline 77% 41% 40% 39%
MTsN Unggul Susoh Baseline 69% 46% 30% 33% Midline 71% 59% 53% 40% Endline 70% 52% 25% 63%
SMPN Tunas Nusa Baseline 76% 44% 50% 45% Midline 78% 66% 55% 61% Endline 82% 69% 58% 49%
Comparison SMPN 3 Susoh Baseline 71% 68% 19% 36% Midline 54% 36% 22% 34% Endline 50% 11% 20% 30%
SMP Babul Istiqamah Baseline 49% 41% 21% 29% Midline 69% 39% 23% 22% Endline 59% 47% 34% 33%
MTsN Kuala Batee Baseline 63% 62% 17% 47% Midline 60% 60% 22% 30% Endline 60% 29% 28% 30%
Aceh Tamiang Partner SMPN 4 Percontohan Baseline 70% 46% 34% 52% Midline 80% 53% 57% 40% Endline 76% 54% 62% 66%
MTsN Manyak Payed Baseline 48% 40% 16% 37% Midline 76% 43% 43% 44% Endline 80% 54% 44% 34%
SMPN 1 Kejuruan Muda Baseline 59% 42% 23% 36% Midline 71% 43% 34% 44% Endline 62% 51% 34% 29%
Comparison SMPN 2 Kualasimpang Baseline 55% 30% 17% 28% Midline 73% 43% 35% 35% Endline 62% 51% 36% 55%
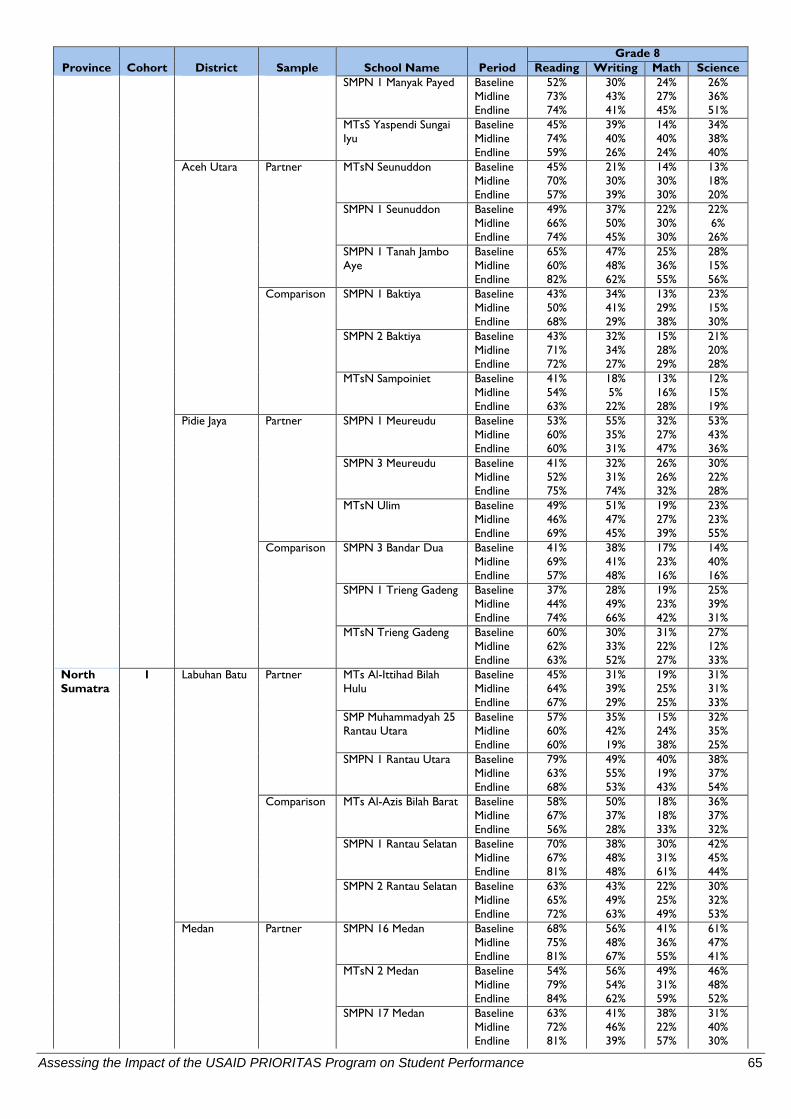
Assessing the Impact of the USAID PRIORITAS Program on Student Performance 65
Province Cohort District Sample School Name Period Grade 8
Reading Writing Math Science SMPN 1 Manyak Payed Baseline 52% 30% 24% 26%
Midline 73% 43% 27% 36% Endline 74% 41% 45% 51%
MTsS Yaspendi Sungai Iyu
Baseline 45% 39% 14% 34% Midline 74% 40% 40% 38% Endline 59% 26% 24% 40%
Aceh Utara Partner MTsN Seunuddon Baseline 45% 21% 14% 13% Midline 70% 30% 30% 18% Endline 57% 39% 30% 20%
SMPN 1 Seunuddon Baseline 49% 37% 22% 22% Midline 66% 50% 30% 6% Endline 74% 45% 30% 26%
SMPN 1 Tanah Jambo Aye
Baseline 65% 47% 25% 28% Midline 60% 48% 36% 15% Endline 82% 62% 55% 56%
Comparison SMPN 1 Baktiya Baseline 43% 34% 13% 23% Midline 50% 41% 29% 15% Endline 68% 29% 38% 30%
SMPN 2 Baktiya Baseline 43% 32% 15% 21% Midline 71% 34% 28% 20% Endline 72% 27% 29% 28%
MTsN Sampoiniet Baseline 41% 18% 13% 12% Midline 54% 5% 16% 15% Endline 63% 22% 28% 19%
Pidie Jaya Partner SMPN 1 Meureudu Baseline 53% 55% 32% 53% Midline 60% 35% 27% 43% Endline 60% 31% 47% 36%
SMPN 3 Meureudu Baseline 41% 32% 26% 30% Midline 52% 31% 26% 22% Endline 75% 74% 32% 28%
MTsN Ulim Baseline 49% 51% 19% 23% Midline 46% 47% 27% 23% Endline 69% 45% 39% 55%
Comparison SMPN 3 Bandar Dua Baseline 41% 38% 17% 14% Midline 69% 41% 23% 40% Endline 57% 48% 16% 16%
SMPN 1 Trieng Gadeng Baseline 37% 28% 19% 25% Midline 44% 49% 23% 39% Endline 74% 66% 42% 31%
MTsN Trieng Gadeng Baseline 60% 30% 31% 27% Midline 62% 33% 22% 12% Endline 63% 52% 27% 33%
North Sumatra
1 Labuhan Batu Partner MTs Al-Ittihad Bilah Hulu
Baseline 45% 31% 19% 31% Midline 64% 39% 25% 31% Endline 67% 29% 25% 33%
SMP Muhammadyah 25 Rantau Utara
Baseline 57% 35% 15% 32% Midline 60% 42% 24% 35% Endline 60% 19% 38% 25%
SMPN 1 Rantau Utara Baseline 79% 49% 40% 38% Midline 63% 55% 19% 37% Endline 68% 53% 43% 54%
Comparison MTs Al-Azis Bilah Barat Baseline 58% 50% 18% 36% Midline 67% 37% 18% 37% Endline 56% 28% 33% 32%
SMPN 1 Rantau Selatan Baseline 70% 38% 30% 42% Midline 67% 48% 31% 45% Endline 81% 48% 61% 44%
SMPN 2 Rantau Selatan Baseline 63% 43% 22% 30% Midline 65% 49% 25% 32% Endline 72% 63% 49% 53%
Medan Partner SMPN 16 Medan Baseline 68% 56% 41% 61% Midline 75% 48% 36% 47% Endline 81% 67% 55% 41%
MTsN 2 Medan Baseline 54% 56% 49% 46% Midline 79% 54% 31% 48% Endline 84% 62% 59% 52%
SMPN 17 Medan Baseline 63% 41% 38% 31% Midline 72% 46% 22% 40% Endline 81% 39% 57% 30%
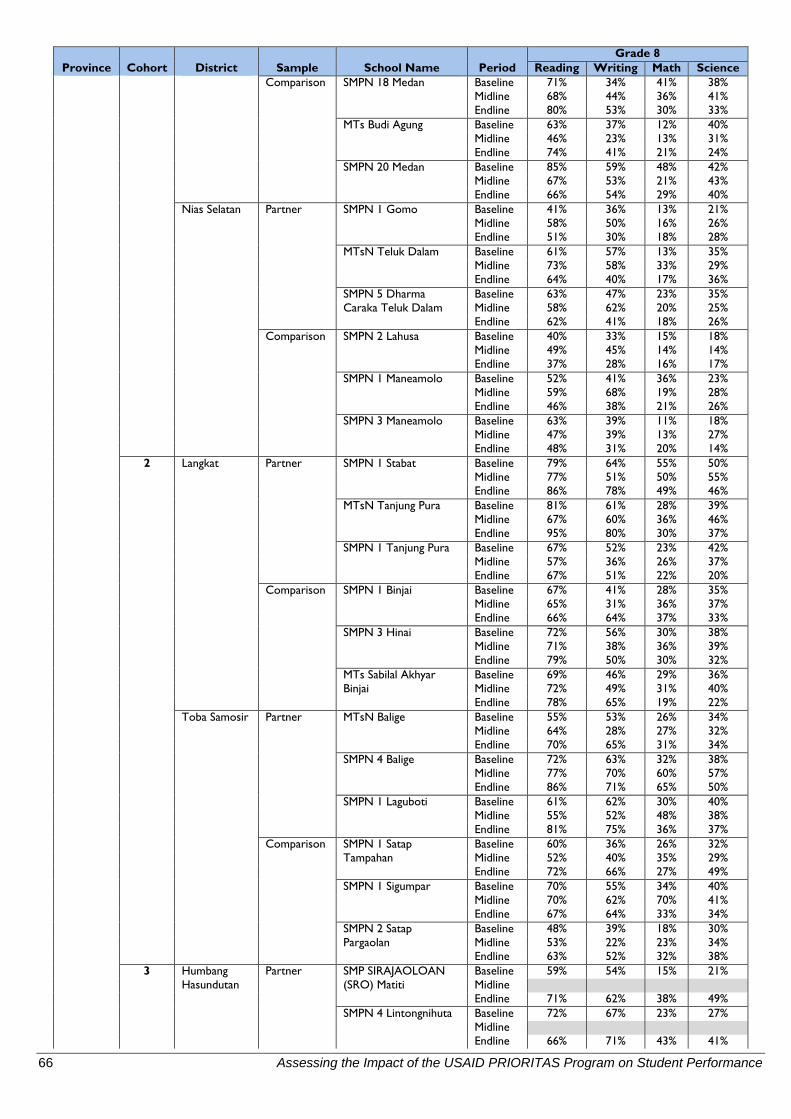
66 Assessing the Impact of the USAID PRIORITAS Program on Student Performance
Province Cohort District Sample School Name Period Grade 8
Reading Writing Math Science Comparison SMPN 18 Medan Baseline 71% 34% 41% 38%
Midline 68% 44% 36% 41% Endline 80% 53% 30% 33%
MTs Budi Agung Baseline 63% 37% 12% 40% Midline 46% 23% 13% 31% Endline 74% 41% 21% 24%
SMPN 20 Medan Baseline 85% 59% 48% 42% Midline 67% 53% 21% 43% Endline 66% 54% 29% 40%
Nias Selatan Partner SMPN 1 Gomo Baseline 41% 36% 13% 21% Midline 58% 50% 16% 26% Endline 51% 30% 18% 28%
MTsN Teluk Dalam Baseline 61% 57% 13% 35% Midline 73% 58% 33% 29% Endline 64% 40% 17% 36%
SMPN 5 Dharma Caraka Teluk Dalam
Baseline 63% 47% 23% 35% Midline 58% 62% 20% 25% Endline 62% 41% 18% 26%
Comparison SMPN 2 Lahusa Baseline 40% 33% 15% 18% Midline 49% 45% 14% 14% Endline 37% 28% 16% 17%
SMPN 1 Maneamolo Baseline 52% 41% 36% 23% Midline 59% 68% 19% 28% Endline 46% 38% 21% 26%
SMPN 3 Maneamolo Baseline 63% 39% 11% 18% Midline 47% 39% 13% 27% Endline 48% 31% 20% 14%
2 Langkat Partner SMPN 1 Stabat Baseline 79% 64% 55% 50% Midline 77% 51% 50% 55% Endline 86% 78% 49% 46%
MTsN Tanjung Pura Baseline 81% 61% 28% 39% Midline 67% 60% 36% 46% Endline 95% 80% 30% 37%
SMPN 1 Tanjung Pura Baseline 67% 52% 23% 42% Midline 57% 36% 26% 37% Endline 67% 51% 22% 20%
Comparison SMPN 1 Binjai Baseline 67% 41% 28% 35% Midline 65% 31% 36% 37% Endline 66% 64% 37% 33%
SMPN 3 Hinai Baseline 72% 56% 30% 38% Midline 71% 38% 36% 39% Endline 79% 50% 30% 32%
MTs Sabilal Akhyar Binjai
Baseline 69% 46% 29% 36% Midline 72% 49% 31% 40% Endline 78% 65% 19% 22%
Toba Samosir Partner MTsN Balige Baseline 55% 53% 26% 34% Midline 64% 28% 27% 32% Endline 70% 65% 31% 34%
SMPN 4 Balige Baseline 72% 63% 32% 38% Midline 77% 70% 60% 57% Endline 86% 71% 65% 50%
SMPN 1 Laguboti Baseline 61% 62% 30% 40% Midline 55% 52% 48% 38% Endline 81% 75% 36% 37%
Comparison SMPN 1 Satap Tampahan
Baseline 60% 36% 26% 32% Midline 52% 40% 35% 29% Endline 72% 66% 27% 49%
SMPN 1 Sigumpar Baseline 70% 55% 34% 40% Midline 70% 62% 70% 41% Endline 67% 64% 33% 34%
SMPN 2 Satap Pargaolan
Baseline 48% 39% 18% 30% Midline 53% 22% 23% 34% Endline 63% 52% 32% 38%
3 Humbang Hasundutan
Partner SMP SIRAJAOLOAN (SRO) Matiti
Baseline 59% 54% 15% 21% Midline
Endline 71% 62% 38% 49% SMPN 4 Lintongnihuta Baseline 72% 67% 23% 27%
Midline Endline 66% 71% 43% 41%
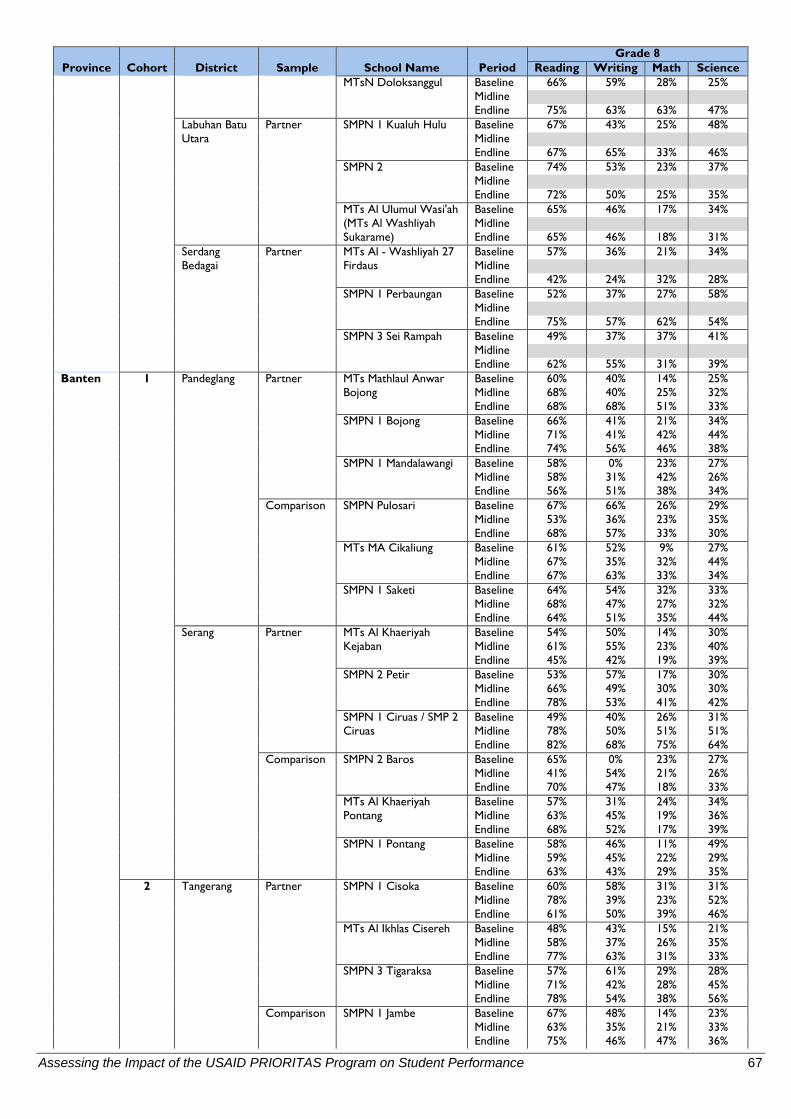
Assessing the Impact of the USAID PRIORITAS Program on Student Performance 67
Province Cohort District Sample School Name Period Grade 8
Reading Writing Math Science MTsN Doloksanggul Baseline 66% 59% 28% 25%
Midline Endline 75% 63% 63% 47%
Labuhan Batu Utara
Partner SMPN 1 Kualuh Hulu Baseline 67% 43% 25% 48% Midline
Endline 67% 65% 33% 46% SMPN 2 Baseline 74% 53% 23% 37%
Midline Endline 72% 50% 25% 35%
MTs Al Ulumul Wasi'ah (MTs Al Washliyah Sukarame)
Baseline 65% 46% 17% 34% Midline
Endline 65% 46% 18% 31% Serdang Bedagai
Partner MTs Al - Washliyah 27 Firdaus
Baseline 57% 36% 21% 34% Midline
Endline 42% 24% 32% 28% SMPN 1 Perbaungan Baseline 52% 37% 27% 58%
Midline Endline 75% 57% 62% 54%
SMPN 3 Sei Rampah Baseline 49% 37% 37% 41% Midline
Endline 62% 55% 31% 39% Banten 1 Pandeglang Partner MTs Mathlaul Anwar
Bojong Baseline 60% 40% 14% 25% Midline 68% 40% 25% 32% Endline 68% 68% 51% 33%
SMPN 1 Bojong Baseline 66% 41% 21% 34% Midline 71% 41% 42% 44% Endline 74% 56% 46% 38%
SMPN 1 Mandalawangi Baseline 58% 0% 23% 27% Midline 58% 31% 42% 26% Endline 56% 51% 38% 34%
Comparison SMPN Pulosari Baseline 67% 66% 26% 29% Midline 53% 36% 23% 35% Endline 68% 57% 33% 30%
MTs MA Cikaliung Baseline 61% 52% 9% 27% Midline 67% 35% 32% 44% Endline 67% 63% 33% 34%
SMPN 1 Saketi Baseline 64% 54% 32% 33% Midline 68% 47% 27% 32% Endline 64% 51% 35% 44%
Serang Partner MTs Al Khaeriyah Kejaban
Baseline 54% 50% 14% 30% Midline 61% 55% 23% 40% Endline 45% 42% 19% 39%
SMPN 2 Petir Baseline 53% 57% 17% 30% Midline 66% 49% 30% 30% Endline 78% 53% 41% 42%
SMPN 1 Ciruas / SMP 2 Ciruas
Baseline 49% 40% 26% 31% Midline 78% 50% 51% 51% Endline 82% 68% 75% 64%
Comparison SMPN 2 Baros Baseline 65% 0% 23% 27% Midline 41% 54% 21% 26% Endline 70% 47% 18% 33%
MTs Al Khaeriyah Pontang
Baseline 57% 31% 24% 34% Midline 63% 45% 19% 36% Endline 68% 52% 17% 39%
SMPN 1 Pontang Baseline 58% 46% 11% 49% Midline 59% 45% 22% 29% Endline 63% 43% 29% 35%
2 Tangerang Partner SMPN 1 Cisoka Baseline 60% 58% 31% 31% Midline 78% 39% 23% 52% Endline 61% 50% 39% 46%
MTs Al Ikhlas Cisereh Baseline 48% 43% 15% 21% Midline 58% 37% 26% 35% Endline 77% 63% 31% 33%
SMPN 3 Tigaraksa Baseline 57% 61% 29% 28% Midline 71% 42% 28% 45% Endline 78% 54% 38% 56%
Comparison SMPN 1 Jambe Baseline 67% 48% 14% 23% Midline 63% 35% 21% 33% Endline 75% 46% 47% 36%
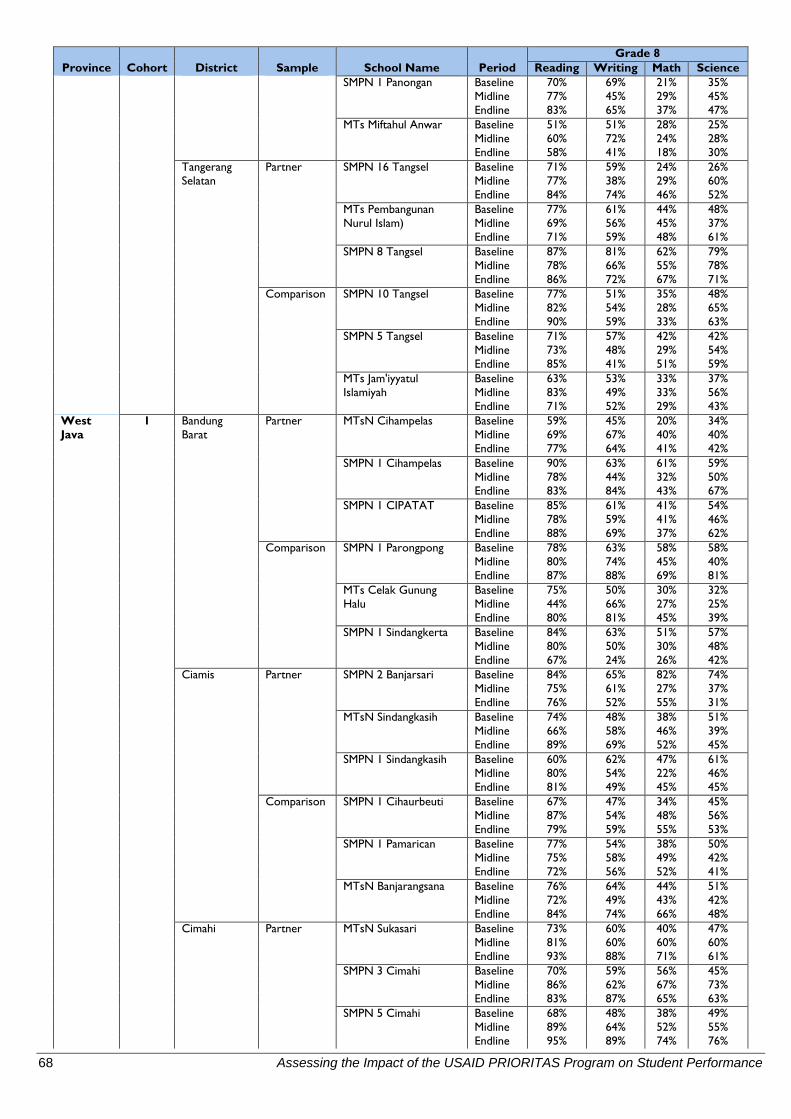
68 Assessing the Impact of the USAID PRIORITAS Program on Student Performance
Province Cohort District Sample School Name Period Grade 8
Reading Writing Math Science SMPN 1 Panongan Baseline 70% 69% 21% 35%
Midline 77% 45% 29% 45% Endline 83% 65% 37% 47%
MTs Miftahul Anwar Baseline 51% 51% 28% 25% Midline 60% 72% 24% 28% Endline 58% 41% 18% 30%
Tangerang Selatan
Partner SMPN 16 Tangsel Baseline 71% 59% 24% 26% Midline 77% 38% 29% 60% Endline 84% 74% 46% 52%
MTs Pembangunan Nurul Islam)
Baseline 77% 61% 44% 48% Midline 69% 56% 45% 37% Endline 71% 59% 48% 61%
SMPN 8 Tangsel Baseline 87% 81% 62% 79% Midline 78% 66% 55% 78% Endline 86% 72% 67% 71%
Comparison SMPN 10 Tangsel Baseline 77% 51% 35% 48% Midline 82% 54% 28% 65% Endline 90% 59% 33% 63%
SMPN 5 Tangsel Baseline 71% 57% 42% 42% Midline 73% 48% 29% 54% Endline 85% 41% 51% 59%
MTs Jam'iyyatul Islamiyah
Baseline 63% 53% 33% 37% Midline 83% 49% 33% 56% Endline 71% 52% 29% 43%
West Java
1 Bandung Barat
Partner MTsN Cihampelas Baseline 59% 45% 20% 34% Midline 69% 67% 40% 40% Endline 77% 64% 41% 42%
SMPN 1 Cihampelas Baseline 90% 63% 61% 59% Midline 78% 44% 32% 50% Endline 83% 84% 43% 67%
SMPN 1 CIPATAT Baseline 85% 61% 41% 54% Midline 78% 59% 41% 46% Endline 88% 69% 37% 62%
Comparison SMPN 1 Parongpong Baseline 78% 63% 58% 58% Midline 80% 74% 45% 40% Endline 87% 88% 69% 81%
MTs Celak Gunung Halu
Baseline 75% 50% 30% 32% Midline 44% 66% 27% 25% Endline 80% 81% 45% 39%
SMPN 1 Sindangkerta Baseline 84% 63% 51% 57% Midline 80% 50% 30% 48% Endline 67% 24% 26% 42%
Ciamis Partner SMPN 2 Banjarsari Baseline 84% 65% 82% 74% Midline 75% 61% 27% 37% Endline 76% 52% 55% 31%
MTsN Sindangkasih Baseline 74% 48% 38% 51% Midline 66% 58% 46% 39% Endline 89% 69% 52% 45%
SMPN 1 Sindangkasih Baseline 60% 62% 47% 61% Midline 80% 54% 22% 46% Endline 81% 49% 45% 45%
Comparison SMPN 1 Cihaurbeuti Baseline 67% 47% 34% 45% Midline 87% 54% 48% 56% Endline 79% 59% 55% 53%
SMPN 1 Pamarican Baseline 77% 54% 38% 50% Midline 75% 58% 49% 42% Endline 72% 56% 52% 41%
MTsN Banjarangsana Baseline 76% 64% 44% 51% Midline 72% 49% 43% 42% Endline 84% 74% 66% 48%
Cimahi Partner MTsN Sukasari Baseline 73% 60% 40% 47% Midline 81% 60% 60% 60% Endline 93% 88% 71% 61%
SMPN 3 Cimahi Baseline 70% 59% 56% 45% Midline 86% 62% 67% 73% Endline 83% 87% 65% 63%
SMPN 5 Cimahi Baseline 68% 48% 38% 49% Midline 89% 64% 52% 55% Endline 95% 89% 74% 76%
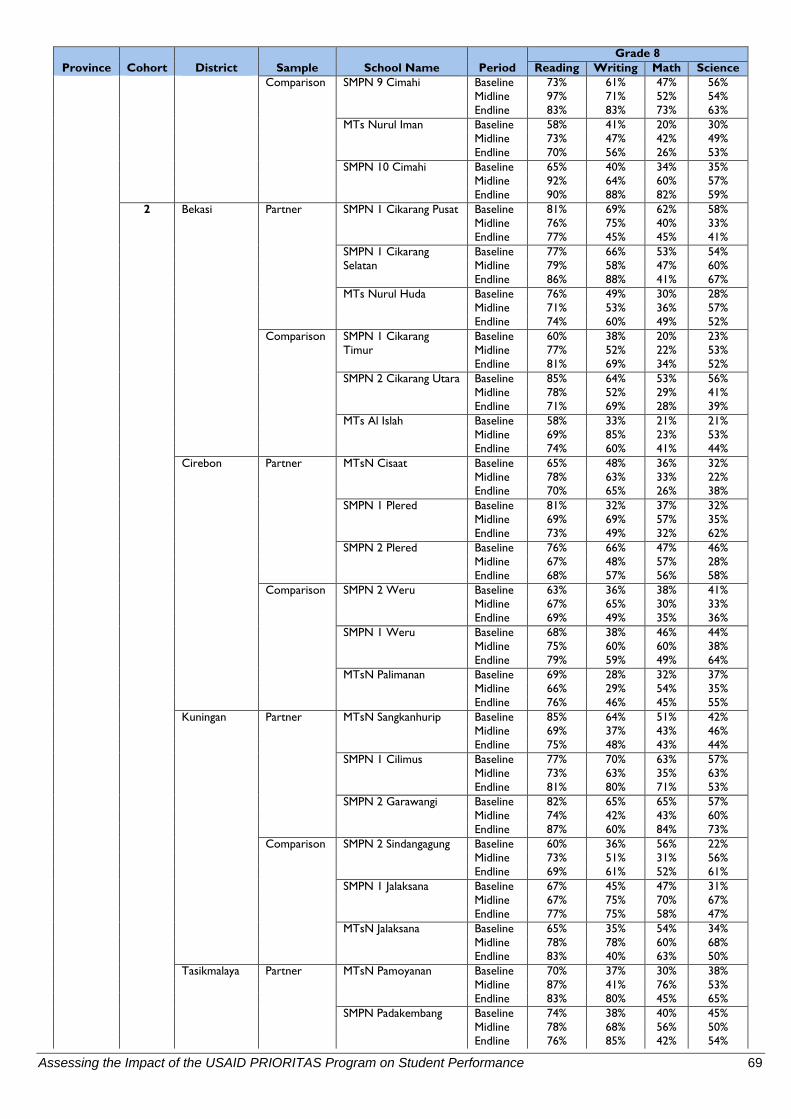
Assessing the Impact of the USAID PRIORITAS Program on Student Performance 69
Province Cohort District Sample School Name Period Grade 8
Reading Writing Math Science Comparison SMPN 9 Cimahi Baseline 73% 61% 47% 56%
Midline 97% 71% 52% 54% Endline 83% 83% 73% 63%
MTs Nurul Iman Baseline 58% 41% 20% 30% Midline 73% 47% 42% 49% Endline 70% 56% 26% 53%
SMPN 10 Cimahi Baseline 65% 40% 34% 35% Midline 92% 64% 60% 57% Endline 90% 88% 82% 59%
2 Bekasi Partner SMPN 1 Cikarang Pusat Baseline 81% 69% 62% 58% Midline 76% 75% 40% 33% Endline 77% 45% 45% 41%
SMPN 1 Cikarang Selatan
Baseline 77% 66% 53% 54% Midline 79% 58% 47% 60% Endline 86% 88% 41% 67%
MTs Nurul Huda Baseline 76% 49% 30% 28% Midline 71% 53% 36% 57% Endline 74% 60% 49% 52%
Comparison SMPN 1 Cikarang Timur
Baseline 60% 38% 20% 23% Midline 77% 52% 22% 53% Endline 81% 69% 34% 52%
SMPN 2 Cikarang Utara Baseline 85% 64% 53% 56% Midline 78% 52% 29% 41% Endline 71% 69% 28% 39%
MTs Al Islah Baseline 58% 33% 21% 21% Midline 69% 85% 23% 53% Endline 74% 60% 41% 44%
Cirebon Partner MTsN Cisaat Baseline 65% 48% 36% 32% Midline 78% 63% 33% 22% Endline 70% 65% 26% 38%
SMPN 1 Plered Baseline 81% 32% 37% 32% Midline 69% 69% 57% 35% Endline 73% 49% 32% 62%
SMPN 2 Plered Baseline 76% 66% 47% 46% Midline 67% 48% 57% 28% Endline 68% 57% 56% 58%
Comparison SMPN 2 Weru Baseline 63% 36% 38% 41% Midline 67% 65% 30% 33% Endline 69% 49% 35% 36%
SMPN 1 Weru Baseline 68% 38% 46% 44% Midline 75% 60% 60% 38% Endline 79% 59% 49% 64%
MTsN Palimanan Baseline 69% 28% 32% 37% Midline 66% 29% 54% 35% Endline 76% 46% 45% 55%
Kuningan Partner MTsN Sangkanhurip Baseline 85% 64% 51% 42% Midline 69% 37% 43% 46% Endline 75% 48% 43% 44%
SMPN 1 Cilimus Baseline 77% 70% 63% 57% Midline 73% 63% 35% 63% Endline 81% 80% 71% 53%
SMPN 2 Garawangi Baseline 82% 65% 65% 57% Midline 74% 42% 43% 60% Endline 87% 60% 84% 73%
Comparison SMPN 2 Sindangagung Baseline 60% 36% 56% 22% Midline 73% 51% 31% 56% Endline 69% 61% 52% 61%
SMPN 1 Jalaksana Baseline 67% 45% 47% 31% Midline 67% 75% 70% 67% Endline 77% 75% 58% 47%
MTsN Jalaksana Baseline 65% 35% 54% 34% Midline 78% 78% 60% 68% Endline 83% 40% 63% 50%
Tasikmalaya Partner MTsN Pamoyanan Baseline 70% 37% 30% 38% Midline 87% 41% 76% 53% Endline 83% 80% 45% 65%
SMPN Padakembang Baseline 74% 38% 40% 45% Midline 78% 68% 56% 50% Endline 76% 85% 42% 54%
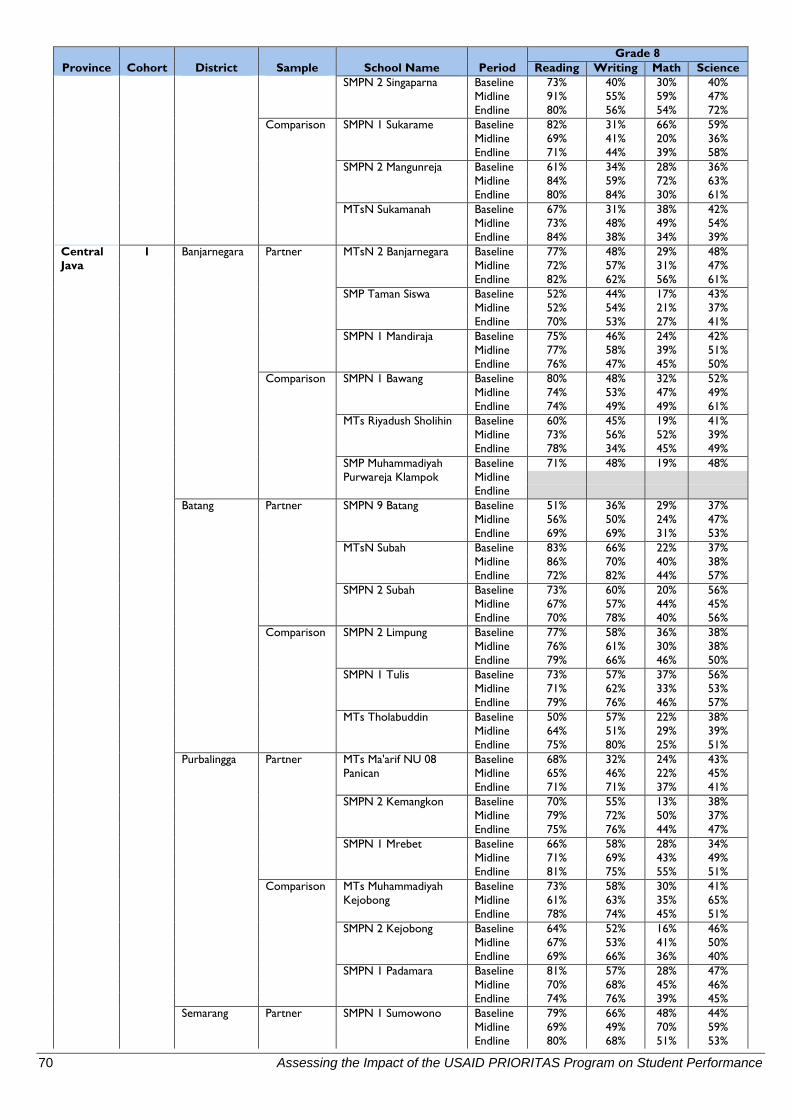
70 Assessing the Impact of the USAID PRIORITAS Program on Student Performance
Province Cohort District Sample School Name Period Grade 8
Reading Writing Math Science SMPN 2 Singaparna Baseline 73% 40% 30% 40%
Midline 91% 55% 59% 47% Endline 80% 56% 54% 72%
Comparison SMPN 1 Sukarame Baseline 82% 31% 66% 59% Midline 69% 41% 20% 36% Endline 71% 44% 39% 58%
SMPN 2 Mangunreja Baseline 61% 34% 28% 36% Midline 84% 59% 72% 63% Endline 80% 84% 30% 61%
MTsN Sukamanah Baseline 67% 31% 38% 42% Midline 73% 48% 49% 54% Endline 84% 38% 34% 39%
Central Java
1 Banjarnegara Partner MTsN 2 Banjarnegara Baseline 77% 48% 29% 48% Midline 72% 57% 31% 47% Endline 82% 62% 56% 61%
SMP Taman Siswa Baseline 52% 44% 17% 43% Midline 52% 54% 21% 37% Endline 70% 53% 27% 41%
SMPN 1 Mandiraja Baseline 75% 46% 24% 42% Midline 77% 58% 39% 51% Endline 76% 47% 45% 50%
Comparison SMPN 1 Bawang Baseline 80% 48% 32% 52% Midline 74% 53% 47% 49% Endline 74% 49% 49% 61%
MTs Riyadush Sholihin Baseline 60% 45% 19% 41% Midline 73% 56% 52% 39% Endline 78% 34% 45% 49%
SMP Muhammadiyah Purwareja Klampok
Baseline 71% 48% 19% 48% Midline
Endline Batang Partner SMPN 9 Batang Baseline 51% 36% 29% 37%
Midline 56% 50% 24% 47% Endline 69% 69% 31% 53%
MTsN Subah Baseline 83% 66% 22% 37% Midline 86% 70% 40% 38% Endline 72% 82% 44% 57%
SMPN 2 Subah Baseline 73% 60% 20% 56% Midline 67% 57% 44% 45% Endline 70% 78% 40% 56%
Comparison SMPN 2 Limpung Baseline 77% 58% 36% 38% Midline 76% 61% 30% 38% Endline 79% 66% 46% 50%
SMPN 1 Tulis Baseline 73% 57% 37% 56% Midline 71% 62% 33% 53% Endline 79% 76% 46% 57%
MTs Tholabuddin Baseline 50% 57% 22% 38% Midline 64% 51% 29% 39% Endline 75% 80% 25% 51%
Purbalingga Partner MTs Ma'arif NU 08 Panican
Baseline 68% 32% 24% 43% Midline 65% 46% 22% 45% Endline 71% 71% 37% 41%
SMPN 2 Kemangkon Baseline 70% 55% 13% 38% Midline 79% 72% 50% 37% Endline 75% 76% 44% 47%
SMPN 1 Mrebet Baseline 66% 58% 28% 34% Midline 71% 69% 43% 49% Endline 81% 75% 55% 51%
Comparison MTs Muhammadiyah Kejobong
Baseline 73% 58% 30% 41% Midline 61% 63% 35% 65% Endline 78% 74% 45% 51%
SMPN 2 Kejobong Baseline 64% 52% 16% 46% Midline 67% 53% 41% 50% Endline 69% 66% 36% 40%
SMPN 1 Padamara Baseline 81% 57% 28% 47% Midline 70% 68% 45% 46% Endline 74% 76% 39% 45%
Semarang Partner SMPN 1 Sumowono Baseline 79% 66% 48% 44% Midline 69% 49% 70% 59% Endline 80% 68% 51% 53%
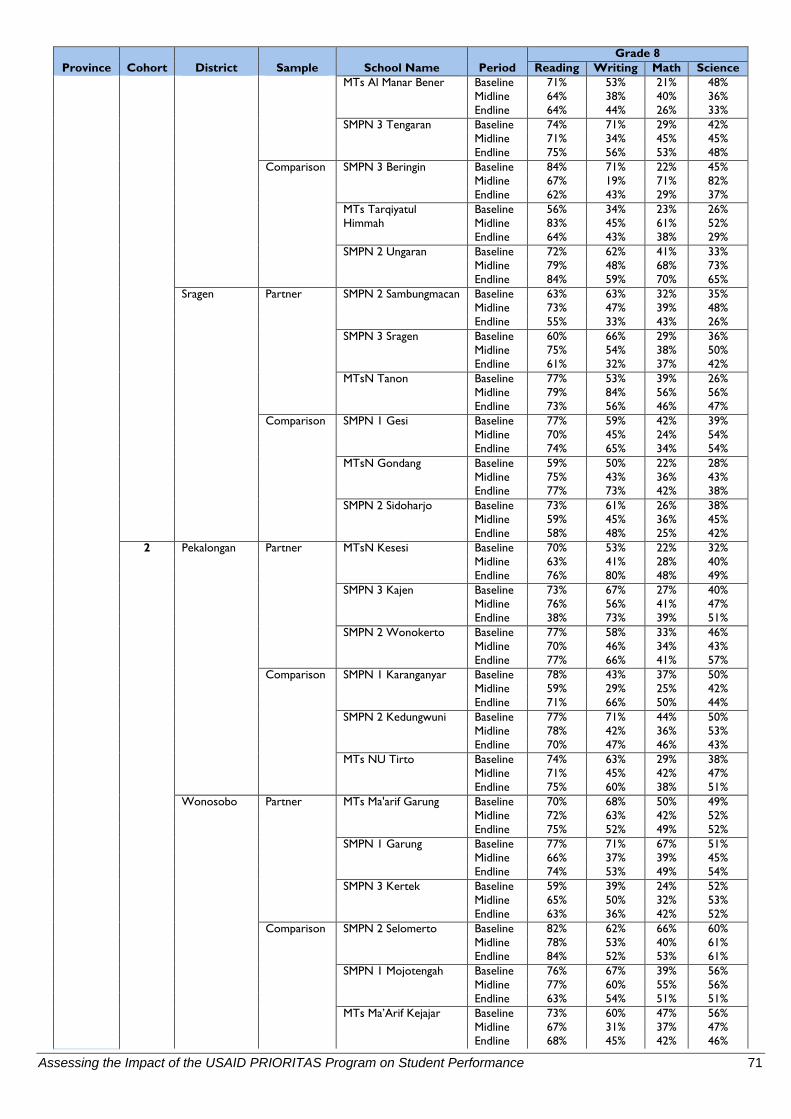
Assessing the Impact of the USAID PRIORITAS Program on Student Performance 71
Province Cohort District Sample School Name Period Grade 8
Reading Writing Math Science MTs Al Manar Bener Baseline 71% 53% 21% 48%
Midline 64% 38% 40% 36% Endline 64% 44% 26% 33%
SMPN 3 Tengaran Baseline 74% 71% 29% 42% Midline 71% 34% 45% 45% Endline 75% 56% 53% 48%
Comparison SMPN 3 Beringin Baseline 84% 71% 22% 45% Midline 67% 19% 71% 82% Endline 62% 43% 29% 37%
MTs Tarqiyatul Himmah
Baseline 56% 34% 23% 26% Midline 83% 45% 61% 52% Endline 64% 43% 38% 29%
SMPN 2 Ungaran Baseline 72% 62% 41% 33% Midline 79% 48% 68% 73% Endline 84% 59% 70% 65%
Sragen Partner SMPN 2 Sambungmacan Baseline 63% 63% 32% 35% Midline 73% 47% 39% 48% Endline 55% 33% 43% 26%
SMPN 3 Sragen Baseline 60% 66% 29% 36% Midline 75% 54% 38% 50% Endline 61% 32% 37% 42%
MTsN Tanon Baseline 77% 53% 39% 26% Midline 79% 84% 56% 56% Endline 73% 56% 46% 47%
Comparison SMPN 1 Gesi Baseline 77% 59% 42% 39% Midline 70% 45% 24% 54% Endline 74% 65% 34% 54%
MTsN Gondang Baseline 59% 50% 22% 28% Midline 75% 43% 36% 43% Endline 77% 73% 42% 38%
SMPN 2 Sidoharjo Baseline 73% 61% 26% 38% Midline 59% 45% 36% 45% Endline 58% 48% 25% 42%
2 Pekalongan Partner MTsN Kesesi Baseline 70% 53% 22% 32% Midline 63% 41% 28% 40% Endline 76% 80% 48% 49%
SMPN 3 Kajen Baseline 73% 67% 27% 40% Midline 76% 56% 41% 47% Endline 38% 73% 39% 51%
SMPN 2 Wonokerto Baseline 77% 58% 33% 46% Midline 70% 46% 34% 43% Endline 77% 66% 41% 57%
Comparison SMPN 1 Karanganyar Baseline 78% 43% 37% 50% Midline 59% 29% 25% 42% Endline 71% 66% 50% 44%
SMPN 2 Kedungwuni Baseline 77% 71% 44% 50% Midline 78% 42% 36% 53% Endline 70% 47% 46% 43%
MTs NU Tirto Baseline 74% 63% 29% 38% Midline 71% 45% 42% 47% Endline 75% 60% 38% 51%
Wonosobo Partner MTs Ma'arif Garung Baseline 70% 68% 50% 49% Midline 72% 63% 42% 52% Endline 75% 52% 49% 52%
SMPN 1 Garung Baseline 77% 71% 67% 51% Midline 66% 37% 39% 45% Endline 74% 53% 49% 54%
SMPN 3 Kertek Baseline 59% 39% 24% 52% Midline 65% 50% 32% 53% Endline 63% 36% 42% 52%
Comparison SMPN 2 Selomerto Baseline 82% 62% 66% 60% Midline 78% 53% 40% 61% Endline 84% 52% 53% 61%
SMPN 1 Mojotengah Baseline 76% 67% 39% 56% Midline 77% 60% 55% 56% Endline 63% 54% 51% 51%
MTs Ma’Arif Kejajar Baseline 73% 60% 47% 56% Midline 67% 31% 37% 47% Endline 68% 45% 42% 46%
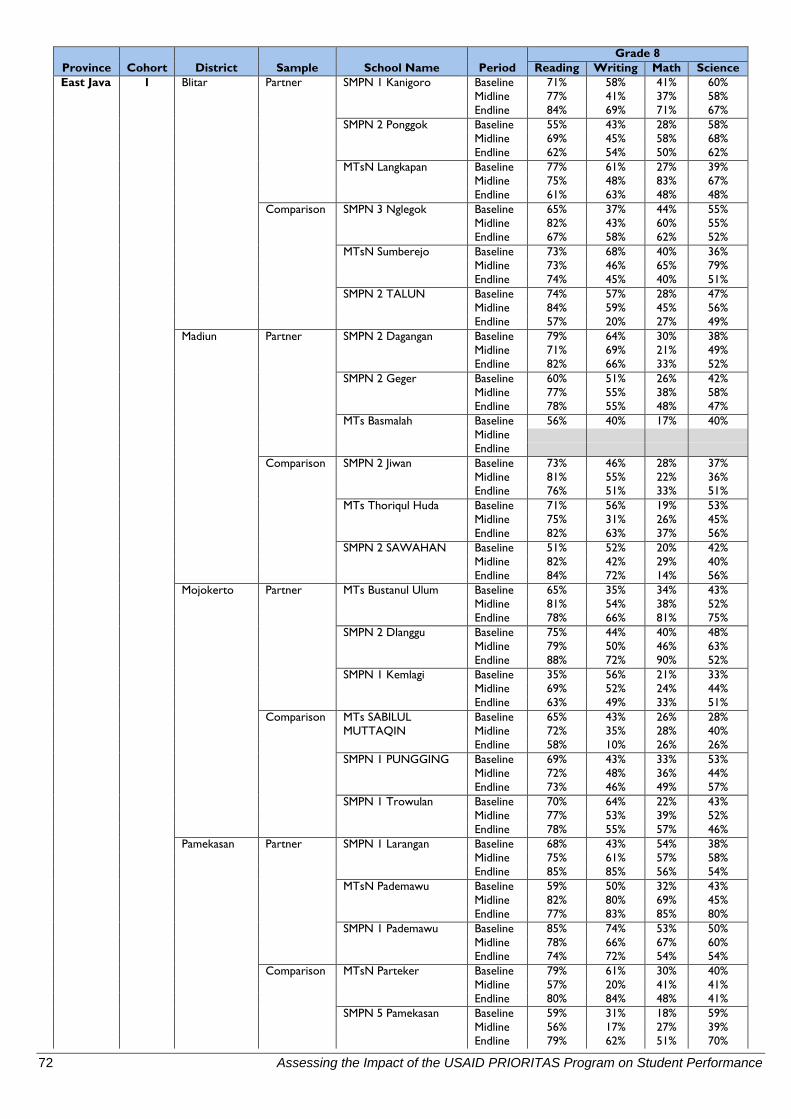
72 Assessing the Impact of the USAID PRIORITAS Program on Student Performance
Province Cohort District Sample School Name Period Grade 8
Reading Writing Math Science East Java 1 Blitar Partner SMPN 1 Kanigoro Baseline 71% 58% 41% 60%
Midline 77% 41% 37% 58% Endline 84% 69% 71% 67%
SMPN 2 Ponggok Baseline 55% 43% 28% 58% Midline 69% 45% 58% 68% Endline 62% 54% 50% 62%
MTsN Langkapan Baseline 77% 61% 27% 39% Midline 75% 48% 83% 67% Endline 61% 63% 48% 48%
Comparison SMPN 3 Nglegok Baseline 65% 37% 44% 55% Midline 82% 43% 60% 55% Endline 67% 58% 62% 52%
MTsN Sumberejo Baseline 73% 68% 40% 36% Midline 73% 46% 65% 79% Endline 74% 45% 40% 51%
SMPN 2 TALUN Baseline 74% 57% 28% 47% Midline 84% 59% 45% 56% Endline 57% 20% 27% 49%
Madiun Partner SMPN 2 Dagangan Baseline 79% 64% 30% 38% Midline 71% 69% 21% 49% Endline 82% 66% 33% 52%
SMPN 2 Geger Baseline 60% 51% 26% 42% Midline 77% 55% 38% 58% Endline 78% 55% 48% 47%
MTs Basmalah Baseline 56% 40% 17% 40% Midline
Endline Comparison SMPN 2 Jiwan Baseline 73% 46% 28% 37%
Midline 81% 55% 22% 36% Endline 76% 51% 33% 51%
MTs Thoriqul Huda Baseline 71% 56% 19% 53% Midline 75% 31% 26% 45% Endline 82% 63% 37% 56%
SMPN 2 SAWAHAN Baseline 51% 52% 20% 42% Midline 82% 42% 29% 40% Endline 84% 72% 14% 56%
Mojokerto Partner MTs Bustanul Ulum Baseline 65% 35% 34% 43% Midline 81% 54% 38% 52% Endline 78% 66% 81% 75%
SMPN 2 Dlanggu Baseline 75% 44% 40% 48% Midline 79% 50% 46% 63% Endline 88% 72% 90% 52%
SMPN 1 Kemlagi Baseline 35% 56% 21% 33% Midline 69% 52% 24% 44% Endline 63% 49% 33% 51%
Comparison MTs SABILUL MUTTAQIN
Baseline 65% 43% 26% 28% Midline 72% 35% 28% 40% Endline 58% 10% 26% 26%
SMPN 1 PUNGGING Baseline 69% 43% 33% 53% Midline 72% 48% 36% 44% Endline 73% 46% 49% 57%
SMPN 1 Trowulan Baseline 70% 64% 22% 43% Midline 77% 53% 39% 52% Endline 78% 55% 57% 46%
Pamekasan Partner SMPN 1 Larangan Baseline 68% 43% 54% 38% Midline 75% 61% 57% 58% Endline 85% 85% 56% 54%
MTsN Pademawu Baseline 59% 50% 32% 43% Midline 82% 80% 69% 45% Endline 77% 83% 85% 80%
SMPN 1 Pademawu Baseline 85% 74% 53% 50% Midline 78% 66% 67% 60% Endline 74% 72% 54% 54%
Comparison MTsN Parteker Baseline 79% 61% 30% 40% Midline 57% 20% 41% 41% Endline 80% 84% 48% 41%
SMPN 5 Pamekasan Baseline 59% 31% 18% 59% Midline 56% 17% 27% 39% Endline 79% 62% 51% 70%
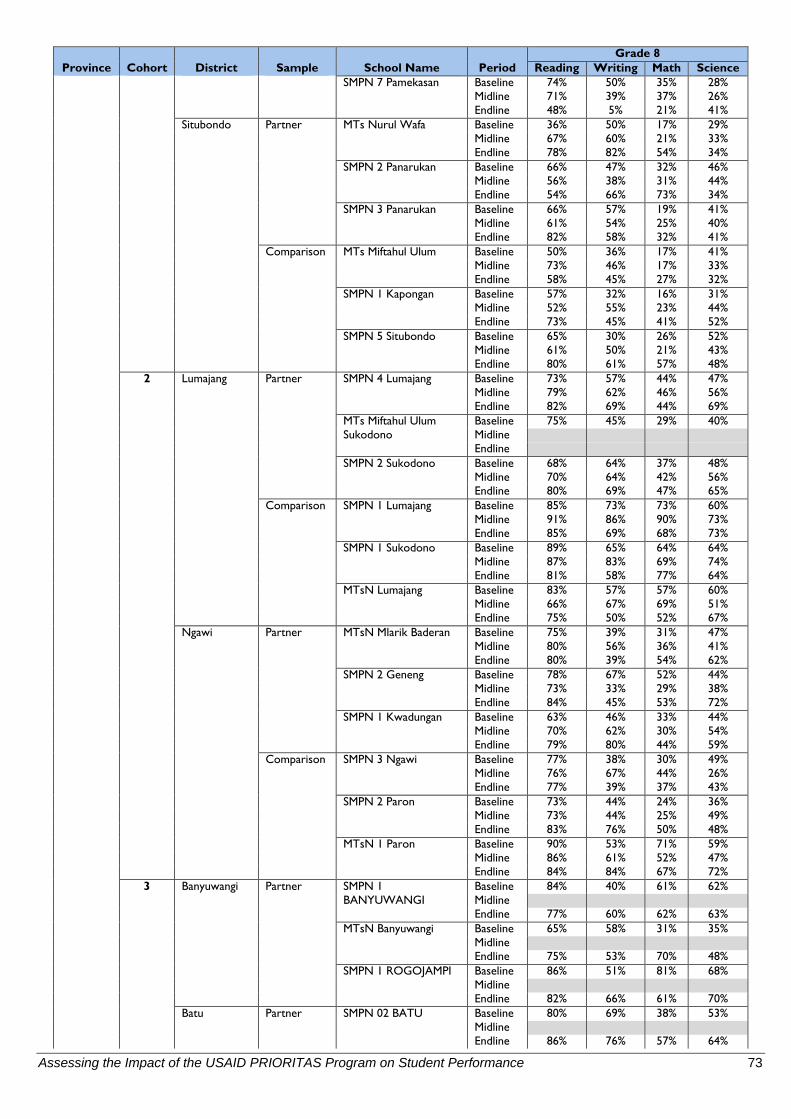
Assessing the Impact of the USAID PRIORITAS Program on Student Performance 73
Province Cohort District Sample School Name Period Grade 8
Reading Writing Math Science SMPN 7 Pamekasan Baseline 74% 50% 35% 28%
Midline 71% 39% 37% 26% Endline 48% 5% 21% 41%
Situbondo Partner MTs Nurul Wafa Baseline 36% 50% 17% 29% Midline 67% 60% 21% 33% Endline 78% 82% 54% 34%
SMPN 2 Panarukan Baseline 66% 47% 32% 46% Midline 56% 38% 31% 44% Endline 54% 66% 73% 34%
SMPN 3 Panarukan Baseline 66% 57% 19% 41% Midline 61% 54% 25% 40% Endline 82% 58% 32% 41%
Comparison MTs Miftahul Ulum Baseline 50% 36% 17% 41% Midline 73% 46% 17% 33% Endline 58% 45% 27% 32%
SMPN 1 Kapongan Baseline 57% 32% 16% 31% Midline 52% 55% 23% 44% Endline 73% 45% 41% 52%
SMPN 5 Situbondo Baseline 65% 30% 26% 52% Midline 61% 50% 21% 43% Endline 80% 61% 57% 48%
2 Lumajang Partner SMPN 4 Lumajang Baseline 73% 57% 44% 47% Midline 79% 62% 46% 56% Endline 82% 69% 44% 69%
MTs Miftahul Ulum Sukodono
Baseline 75% 45% 29% 40% Midline
Endline SMPN 2 Sukodono Baseline 68% 64% 37% 48%
Midline 70% 64% 42% 56% Endline 80% 69% 47% 65%
Comparison SMPN 1 Lumajang Baseline 85% 73% 73% 60% Midline 91% 86% 90% 73% Endline 85% 69% 68% 73%
SMPN 1 Sukodono Baseline 89% 65% 64% 64% Midline 87% 83% 69% 74% Endline 81% 58% 77% 64%
MTsN Lumajang Baseline 83% 57% 57% 60% Midline 66% 67% 69% 51% Endline 75% 50% 52% 67%
Ngawi Partner MTsN Mlarik Baderan Baseline 75% 39% 31% 47% Midline 80% 56% 36% 41% Endline 80% 39% 54% 62%
SMPN 2 Geneng Baseline 78% 67% 52% 44% Midline 73% 33% 29% 38% Endline 84% 45% 53% 72%
SMPN 1 Kwadungan Baseline 63% 46% 33% 44% Midline 70% 62% 30% 54% Endline 79% 80% 44% 59%
Comparison SMPN 3 Ngawi Baseline 77% 38% 30% 49% Midline 76% 67% 44% 26% Endline 77% 39% 37% 43%
SMPN 2 Paron Baseline 73% 44% 24% 36% Midline 73% 44% 25% 49% Endline 83% 76% 50% 48%
MTsN 1 Paron Baseline 90% 53% 71% 59% Midline 86% 61% 52% 47% Endline 84% 84% 67% 72%
3 Banyuwangi Partner SMPN 1 BANYUWANGI
Baseline 84% 40% 61% 62% Midline
Endline 77% 60% 62% 63% MTsN Banyuwangi Baseline 65% 58% 31% 35%
Midline Endline 75% 53% 70% 48%
SMPN 1 ROGOJAMPI Baseline 86% 51% 81% 68% Midline
Endline 82% 66% 61% 70% Batu Partner SMPN 02 BATU Baseline 80% 69% 38% 53%
Midline Endline 86% 76% 57% 64%
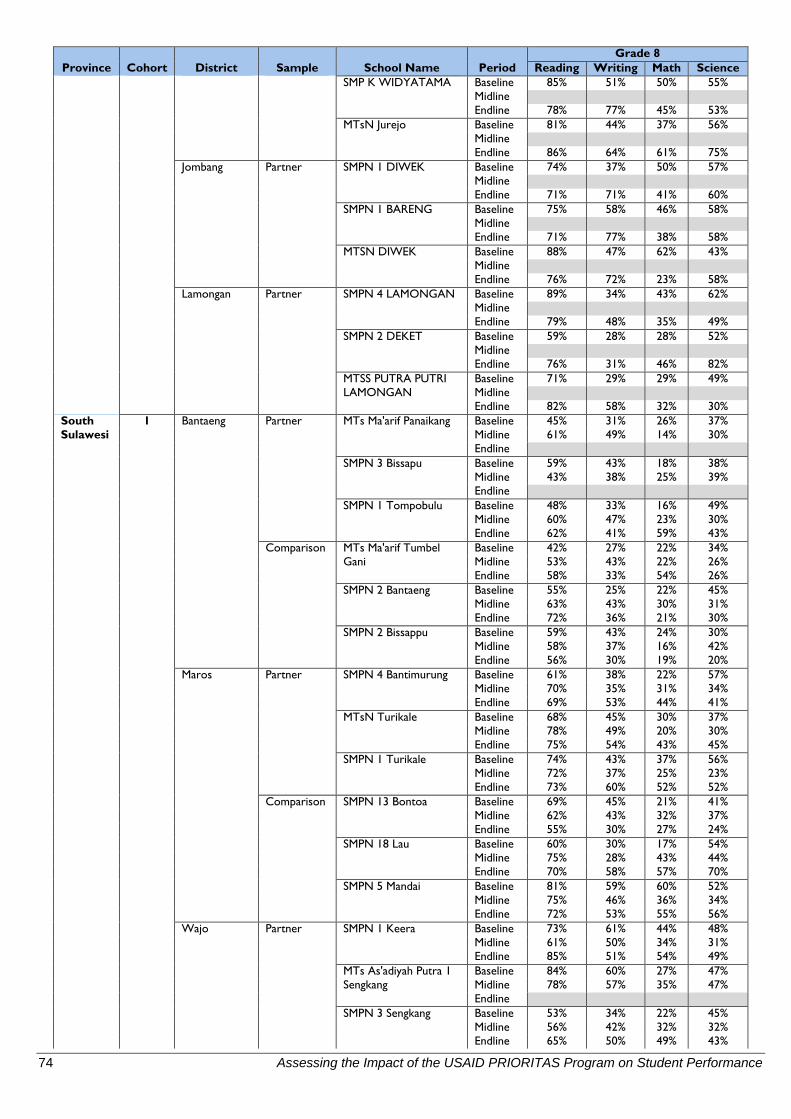
74 Assessing the Impact of the USAID PRIORITAS Program on Student Performance
Province Cohort District Sample School Name Period Grade 8
Reading Writing Math Science SMP K WIDYATAMA Baseline 85% 51% 50% 55%
Midline Endline 78% 77% 45% 53%
MTsN Jurejo Baseline 81% 44% 37% 56% Midline
Endline 86% 64% 61% 75% Jombang Partner SMPN 1 DIWEK Baseline 74% 37% 50% 57%
Midline Endline 71% 71% 41% 60%
SMPN 1 BARENG Baseline 75% 58% 46% 58% Midline
Endline 71% 77% 38% 58% MTSN DIWEK Baseline 88% 47% 62% 43%
Midline Endline 76% 72% 23% 58%
Lamongan Partner SMPN 4 LAMONGAN Baseline 89% 34% 43% 62% Midline
Endline 79% 48% 35% 49% SMPN 2 DEKET Baseline 59% 28% 28% 52%
Midline Endline 76% 31% 46% 82%
MTSS PUTRA PUTRI LAMONGAN
Baseline 71% 29% 29% 49% Midline
Endline 82% 58% 32% 30% South Sulawesi
1 Bantaeng Partner MTs Ma'arif Panaikang Baseline 45% 31% 26% 37% Midline 61% 49% 14% 30% Endline
SMPN 3 Bissapu Baseline 59% 43% 18% 38% Midline 43% 38% 25% 39% Endline
SMPN 1 Tompobulu Baseline 48% 33% 16% 49% Midline 60% 47% 23% 30% Endline 62% 41% 59% 43%
Comparison MTs Ma'arif Tumbel Gani
Baseline 42% 27% 22% 34% Midline 53% 43% 22% 26% Endline 58% 33% 54% 26%
SMPN 2 Bantaeng Baseline 55% 25% 22% 45% Midline 63% 43% 30% 31% Endline 72% 36% 21% 30%
SMPN 2 Bissappu Baseline 59% 43% 24% 30% Midline 58% 37% 16% 42% Endline 56% 30% 19% 20%
Maros Partner SMPN 4 Bantimurung Baseline 61% 38% 22% 57% Midline 70% 35% 31% 34% Endline 69% 53% 44% 41%
MTsN Turikale Baseline 68% 45% 30% 37% Midline 78% 49% 20% 30% Endline 75% 54% 43% 45%
SMPN 1 Turikale Baseline 74% 43% 37% 56% Midline 72% 37% 25% 23% Endline 73% 60% 52% 52%
Comparison SMPN 13 Bontoa Baseline 69% 45% 21% 41% Midline 62% 43% 32% 37% Endline 55% 30% 27% 24%
SMPN 18 Lau Baseline 60% 30% 17% 54% Midline 75% 28% 43% 44% Endline 70% 58% 57% 70%
SMPN 5 Mandai Baseline 81% 59% 60% 52% Midline 75% 46% 36% 34% Endline 72% 53% 55% 56%
Wajo Partner SMPN 1 Keera Baseline 73% 61% 44% 48% Midline 61% 50% 34% 31% Endline 85% 51% 54% 49%
MTs As'adiyah Putra 1 Sengkang
Baseline 84% 60% 27% 47% Midline 78% 57% 35% 47% Endline
SMPN 3 Sengkang Baseline 53% 34% 22% 45% Midline 56% 42% 32% 32% Endline 65% 50% 49% 43%
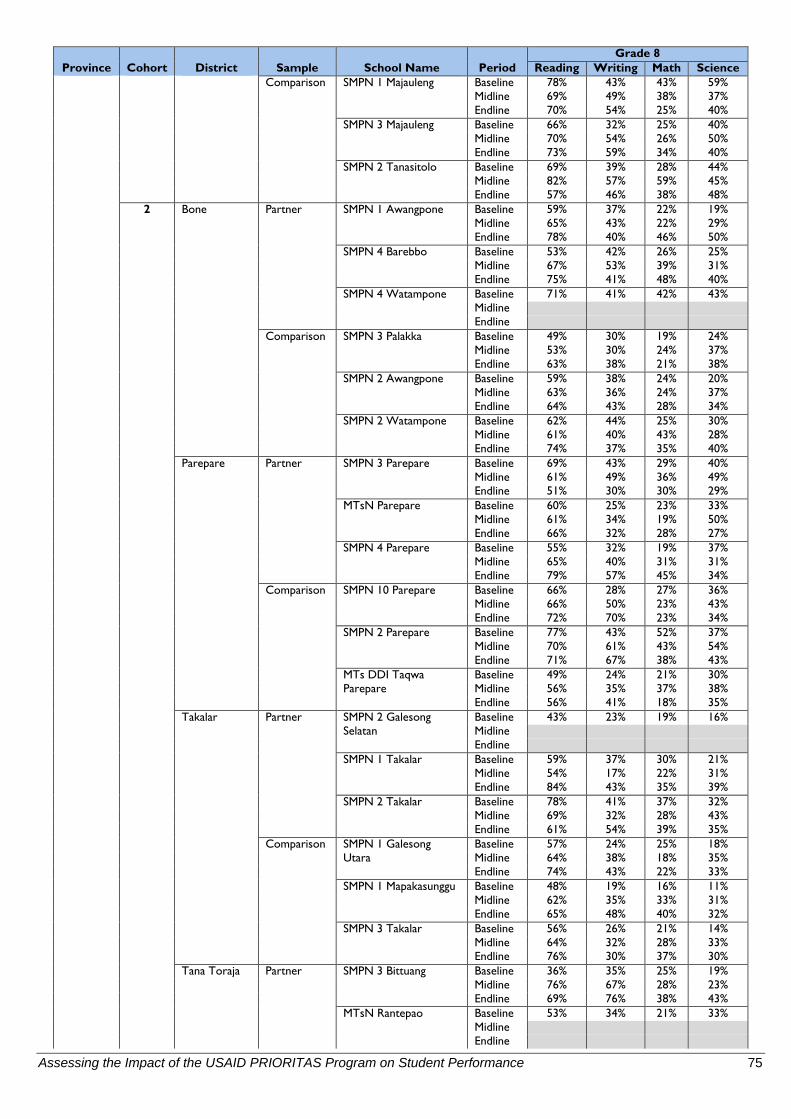
Assessing the Impact of the USAID PRIORITAS Program on Student Performance 75
Province Cohort District Sample School Name Period Grade 8
Reading Writing Math Science Comparison SMPN 1 Majauleng Baseline 78% 43% 43% 59%
Midline 69% 49% 38% 37% Endline 70% 54% 25% 40%
SMPN 3 Majauleng Baseline 66% 32% 25% 40% Midline 70% 54% 26% 50% Endline 73% 59% 34% 40%
SMPN 2 Tanasitolo Baseline 69% 39% 28% 44% Midline 82% 57% 59% 45% Endline 57% 46% 38% 48%
2 Bone Partner SMPN 1 Awangpone Baseline 59% 37% 22% 19% Midline 65% 43% 22% 29% Endline 78% 40% 46% 50%
SMPN 4 Barebbo Baseline 53% 42% 26% 25% Midline 67% 53% 39% 31% Endline 75% 41% 48% 40%
SMPN 4 Watampone Baseline 71% 41% 42% 43% Midline
Endline Comparison SMPN 3 Palakka Baseline 49% 30% 19% 24%
Midline 53% 30% 24% 37% Endline 63% 38% 21% 38%
SMPN 2 Awangpone Baseline 59% 38% 24% 20% Midline 63% 36% 24% 37% Endline 64% 43% 28% 34%
SMPN 2 Watampone Baseline 62% 44% 25% 30% Midline 61% 40% 43% 28% Endline 74% 37% 35% 40%
Parepare Partner SMPN 3 Parepare Baseline 69% 43% 29% 40% Midline 61% 49% 36% 49% Endline 51% 30% 30% 29%
MTsN Parepare Baseline 60% 25% 23% 33% Midline 61% 34% 19% 50% Endline 66% 32% 28% 27%
SMPN 4 Parepare Baseline 55% 32% 19% 37% Midline 65% 40% 31% 31% Endline 79% 57% 45% 34%
Comparison SMPN 10 Parepare Baseline 66% 28% 27% 36% Midline 66% 50% 23% 43% Endline 72% 70% 23% 34%
SMPN 2 Parepare Baseline 77% 43% 52% 37% Midline 70% 61% 43% 54% Endline 71% 67% 38% 43%
MTs DDI Taqwa Parepare
Baseline 49% 24% 21% 30% Midline 56% 35% 37% 38% Endline 56% 41% 18% 35%
Takalar Partner SMPN 2 Galesong Selatan
Baseline 43% 23% 19% 16% Midline
Endline SMPN 1 Takalar Baseline 59% 37% 30% 21%
Midline 54% 17% 22% 31% Endline 84% 43% 35% 39%
SMPN 2 Takalar Baseline 78% 41% 37% 32% Midline 69% 32% 28% 43% Endline 61% 54% 39% 35%
Comparison SMPN 1 Galesong Utara
Baseline 57% 24% 25% 18% Midline 64% 38% 18% 35% Endline 74% 43% 22% 33%
SMPN 1 Mapakasunggu Baseline 48% 19% 16% 11% Midline 62% 35% 33% 31% Endline 65% 48% 40% 32%
SMPN 3 Takalar Baseline 56% 26% 21% 14% Midline 64% 32% 28% 33% Endline 76% 30% 37% 30%
Tana Toraja Partner SMPN 3 Bittuang Baseline 36% 35% 25% 19% Midline 76% 67% 28% 23% Endline 69% 76% 38% 43%
MTsN Rantepao Baseline 53% 34% 21% 33% Midline
Endline
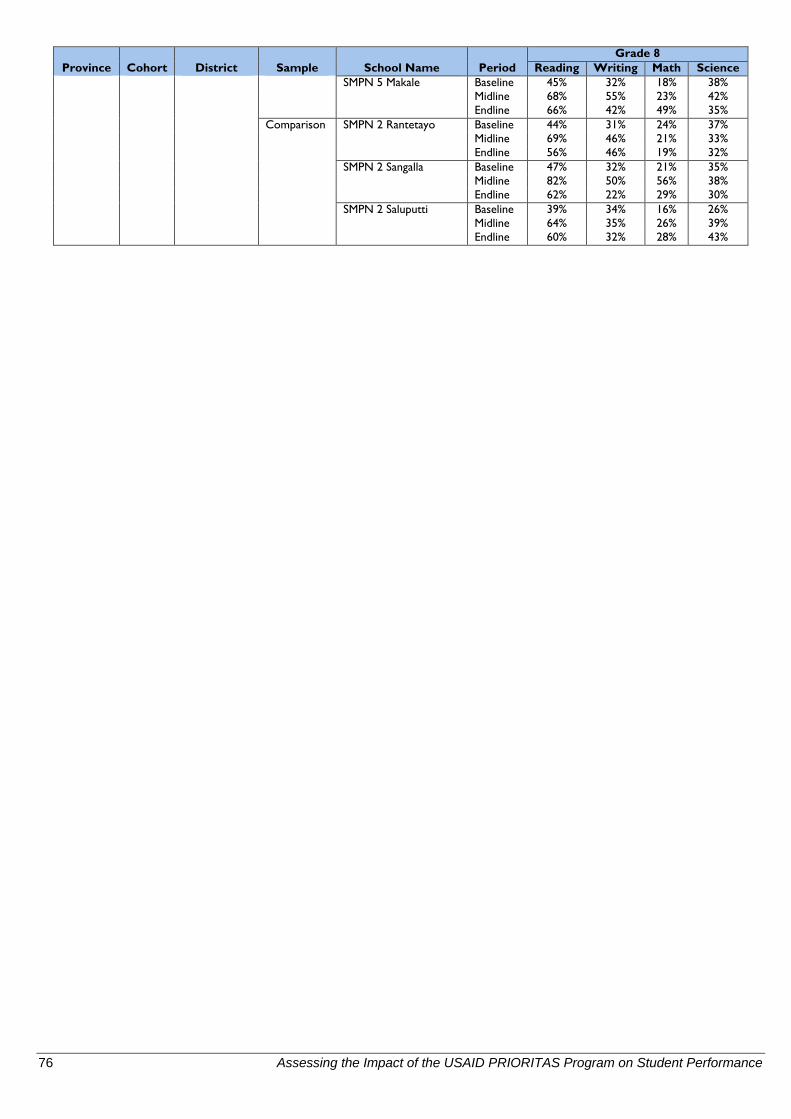
76 Assessing the Impact of the USAID PRIORITAS Program on Student Performance
Province Cohort District Sample School Name Period Grade 8
Reading Writing Math Science SMPN 5 Makale Baseline 45% 32% 18% 38%
Midline 68% 55% 23% 42% Endline 66% 42% 49% 35%
Comparison SMPN 2 Rantetayo Baseline 44% 31% 24% 37% Midline 69% 46% 21% 33% Endline 56% 46% 19% 32%
SMPN 2 Sangalla Baseline 47% 32% 21% 35% Midline 82% 50% 56% 38% Endline 62% 22% 29% 30%
SMPN 2 Saluputti Baseline 39% 34% 16% 26% Midline 64% 35% 26% 39% Endline 60% 32% 28% 43%
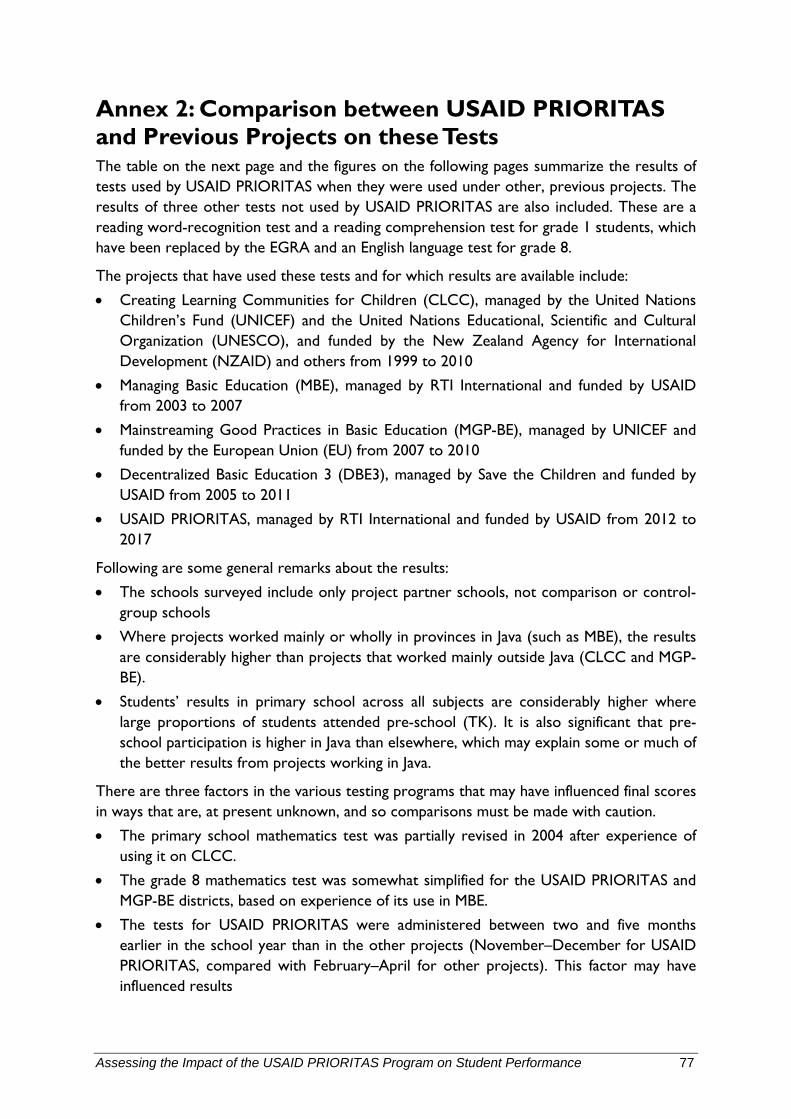
Assessing the Impact of the USAID PRIORITAS Program on Student Performance 77
Annex 2: Comparison between USAID PRIORITAS and Previous Projects on these Tests The table on the next page and the figures on the following pages summarize the results of tests used by USAID PRIORITAS when they were used under other, previous projects. The results of three other tests not used by USAID PRIORITAS are also included. These are a reading word-recognition test and a reading comprehension test for grade 1 students, which have been replaced by the EGRA and an English language test for grade 8.
The projects that have used these tests and for which results are available include:
• Creating Learning Communities for Children (CLCC), managed by the United Nations Children’s Fund (UNICEF) and the United Nations Educational, Scientific and Cultural Organization (UNESCO), and funded by the New Zealand Agency for International Development (NZAID) and others from 1999 to 2010
• Managing Basic Education (MBE), managed by RTI International and funded by USAID from 2003 to 2007
• Mainstreaming Good Practices in Basic Education (MGP-BE), managed by UNICEF and funded by the European Union (EU) from 2007 to 2010
• Decentralized Basic Education 3 (DBE3), managed by Save the Children and funded by USAID from 2005 to 2011
• USAID PRIORITAS, managed by RTI International and funded by USAID from 2012 to 2017
Following are some general remarks about the results:
• The schools surveyed include only project partner schools, not comparison or control-group schools
• Where projects worked mainly or wholly in provinces in Java (such as MBE), the results are considerably higher than projects that worked mainly outside Java (CLCC and MGP-BE).
• Students’ results in primary school across all subjects are considerably higher where large proportions of students attended pre-school (TK). It is also significant that pre-school participation is higher in Java than elsewhere, which may explain some or much of the better results from projects working in Java.
There are three factors in the various testing programs that may have influenced final scores in ways that are, at present unknown, and so comparisons must be made with caution.
• The primary school mathematics test was partially revised in 2004 after experience of using it on CLCC.
• The grade 8 mathematics test was somewhat simplified for the USAID PRIORITAS and MGP-BE districts, based on experience of its use in MBE.
• The tests for USAID PRIORITAS were administered between two and five months earlier in the school year than in the other projects (November–December for USAID PRIORITAS, compared with February–April for other projects). This factor may have influenced results
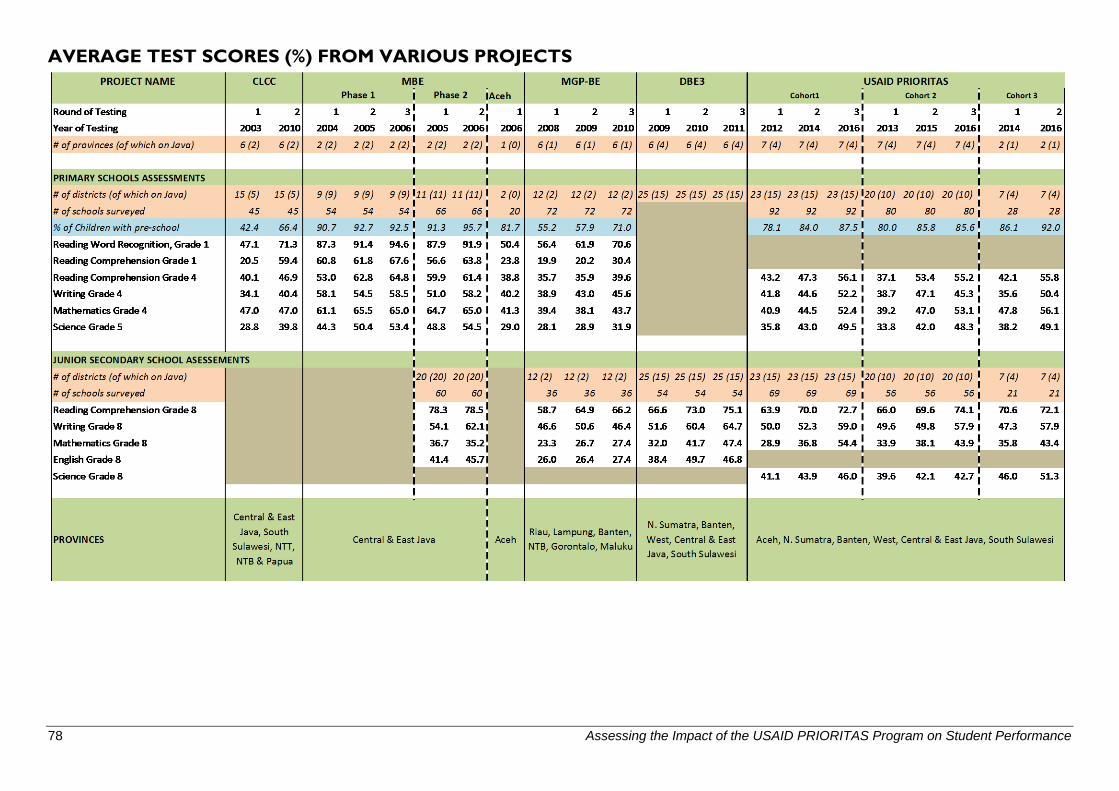
78 Assessing the Impact of the USAID PRIORITAS Program on Student Performance
AVERAGE TEST SCORES (%) FROM VARIOUS PROJECTS
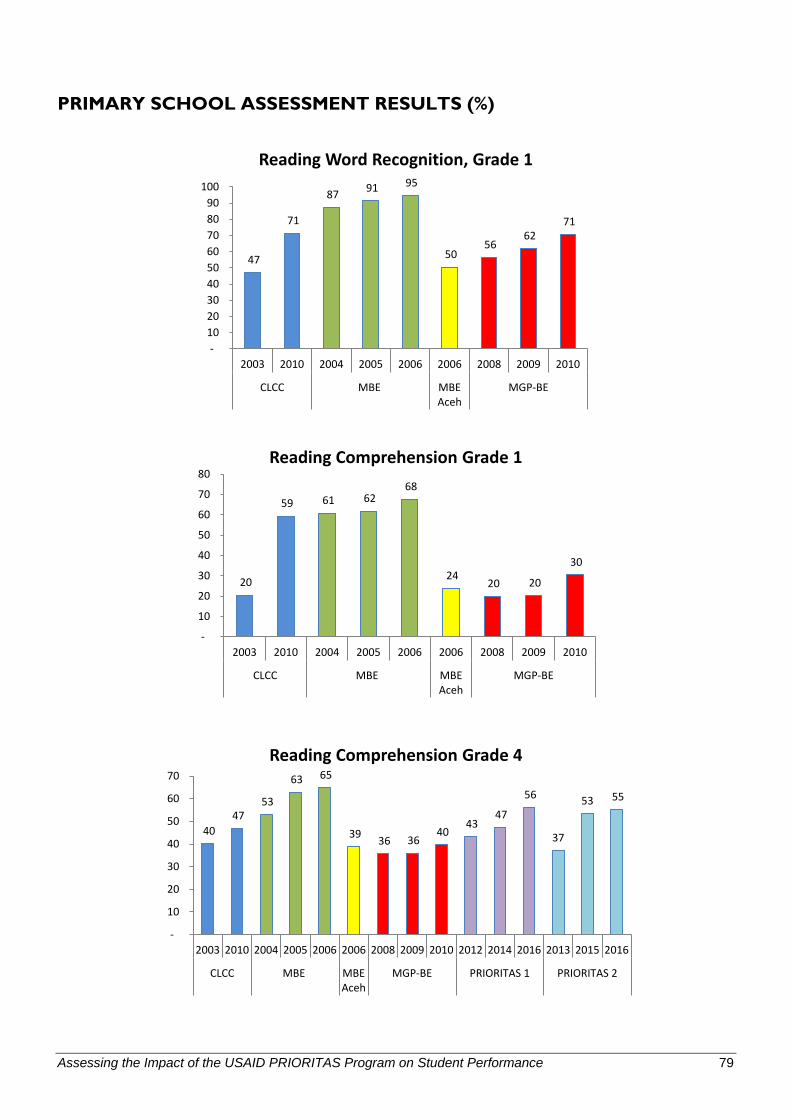
Assessing the Impact of the USAID PRIORITAS Program on Student Performance 79
PRIMARY SCHOOL ASSESSMENT RESULTS (%)
47
71
87 91 95
50 56
62 71
- 10 20 30 40 50 60 70 80 90
100
2003 2010 2004 2005 2006 2006 2008 2009 2010
CLCC MBE MBEAceh
MGP-BE
Reading Word Recognition, Grade 1
20
59 61 62 68
24 20 20
30
-
10
20
30
40
50
60
70
80
2003 2010 2004 2005 2006 2006 2008 2009 2010
CLCC MBE MBEAceh
MGP-BE
Reading Comprehension Grade 1
40 47
53
63 65
39 36 36 40
43 47
56
37
53 55
-
10
20
30
40
50
60
70
2003 2010 2004 2005 2006 2006 2008 2009 2010 2012 2014 2016 2013 2015 2016
CLCC MBE MBEAceh
MGP-BE PRIORITAS 1 PRIORITAS 2
Reading Comprehension Grade 4
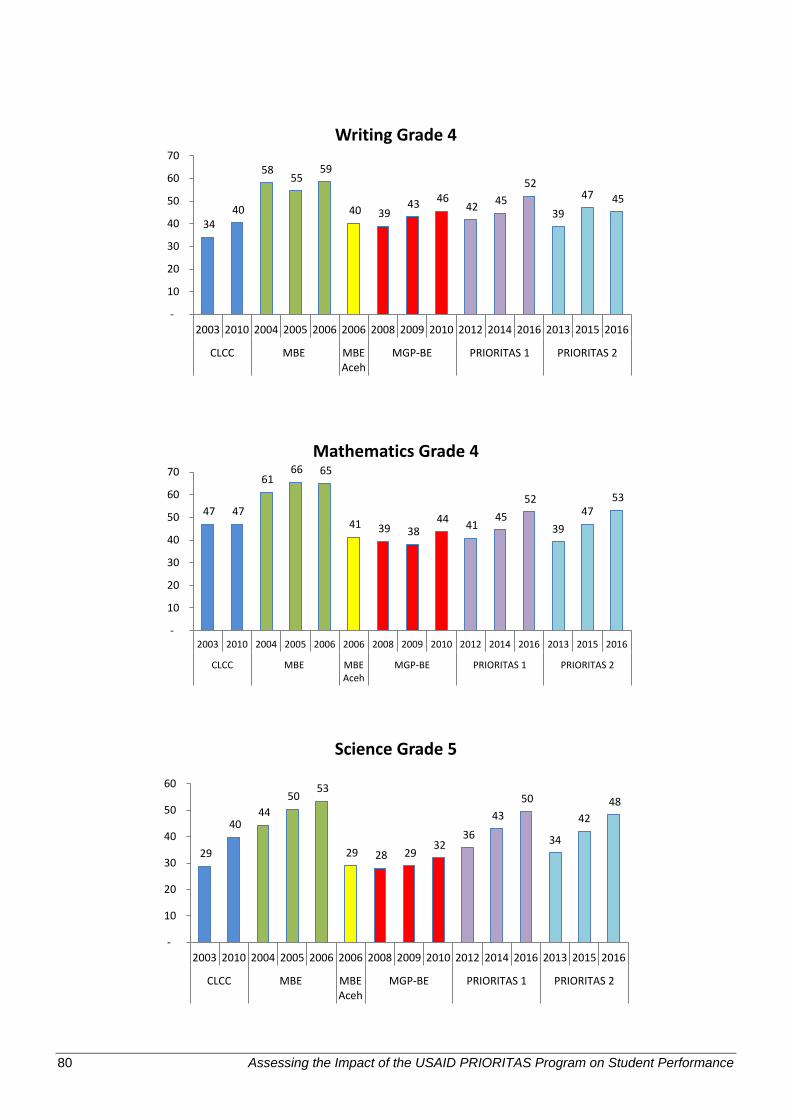
80 Assessing the Impact of the USAID PRIORITAS Program on Student Performance
34 40
58 55
59
40 39 43 46
42 45 52
39
47 45
-
10
20
30
40
50
60
70
2003 2010 2004 2005 2006 2006 2008 2009 2010 2012 2014 2016 2013 2015 2016
CLCC MBE MBEAceh
MGP-BE PRIORITAS 1 PRIORITAS 2
Writing Grade 4
47 47
61 66 65
41 39 38 44 41
45 52
3947
53
-
10
20
30
40
50
60
70
2003 2010 2004 2005 2006 2006 2008 2009 2010 2012 2014 2016 2013 2015 2016
CLCC MBE MBEAceh
MGP-BE PRIORITAS 1 PRIORITAS 2
Mathematics Grade 4
29
40 44
50 53
29 28 29 32
36
43 50
34
4248
-
10
20
30
40
50
60
2003 2010 2004 2005 2006 2006 2008 2009 2010 2012 2014 2016 2013 2015 2016
CLCC MBE MBEAceh
MGP-BE PRIORITAS 1 PRIORITAS 2
Science Grade 5
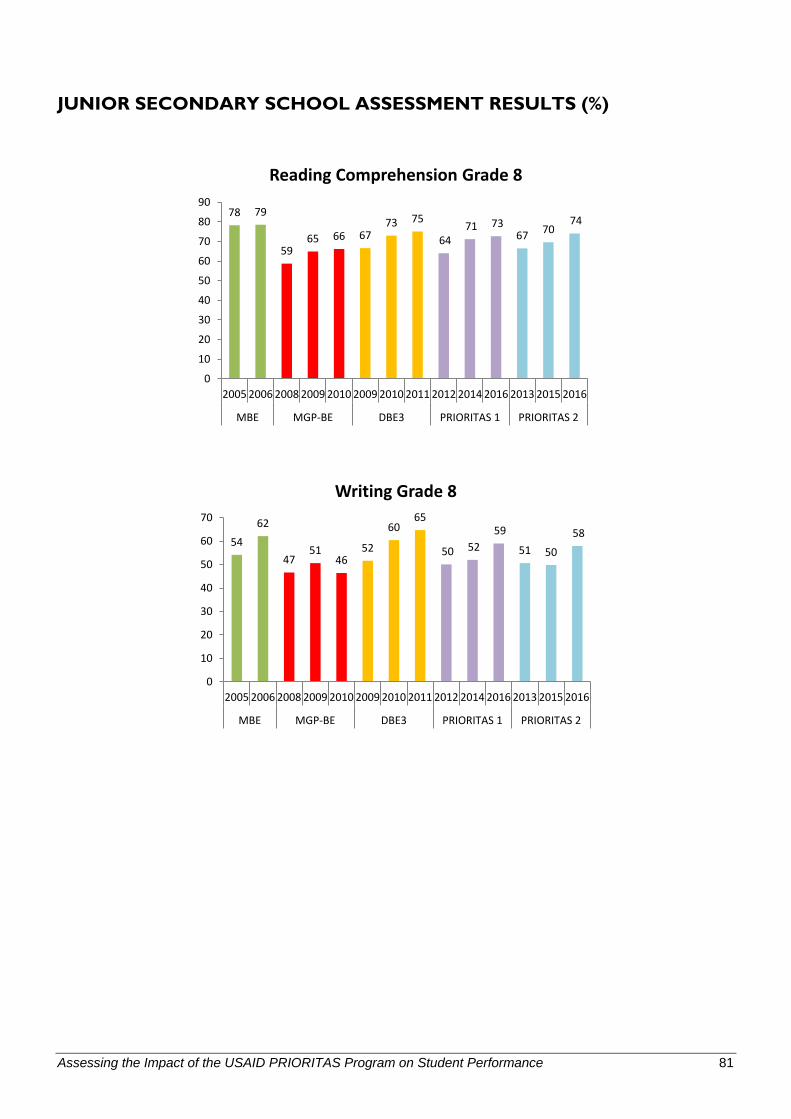
Assessing the Impact of the USAID PRIORITAS Program on Student Performance 81
JUNIOR SECONDARY SCHOOL ASSESSMENT RESULTS (%)
78 79
5965 66 67
73 75
64 71 73
67 7074
0
10
20
30
40
50
60
70
80
90
2005 2006 2008 2009 2010 2009 2010 2011 2012 2014 2016 2013 2015 2016
MBE MGP-BE DBE3 PRIORITAS 1 PRIORITAS 2
Reading Comprehension Grade 8
5462
4751
4652
6065
50 52 59
51 50
58
0
10
20
30
40
50
60
70
2005 2006 2008 2009 2010 2009 2010 2011 2012 2014 2016 2013 2015 2016
MBE MGP-BE DBE3 PRIORITAS 1 PRIORITAS 2
Writing Grade 8
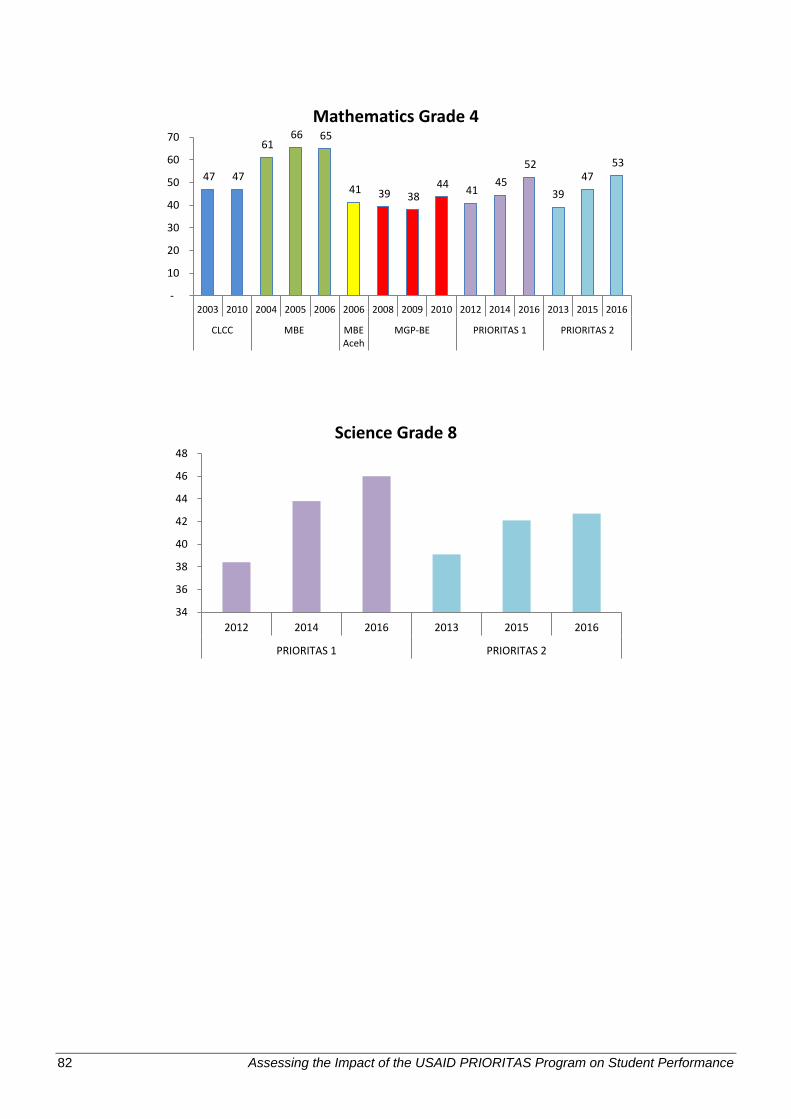
82 Assessing the Impact of the USAID PRIORITAS Program on Student Performance
47 47
61 66 65
41 39 38 44 41
45 52
3947
53
-
10
20
30
40
50
60
70
2003 2010 2004 2005 2006 2006 2008 2009 2010 2012 2014 2016 2013 2015 2016
CLCC MBE MBEAceh
MGP-BE PRIORITAS 1 PRIORITAS 2
Mathematics Grade 4
34
36
38
40
42
44
46
48
2012 2014 2016 2013 2015 2016
PRIORITAS 1 PRIORITAS 2
Science Grade 8
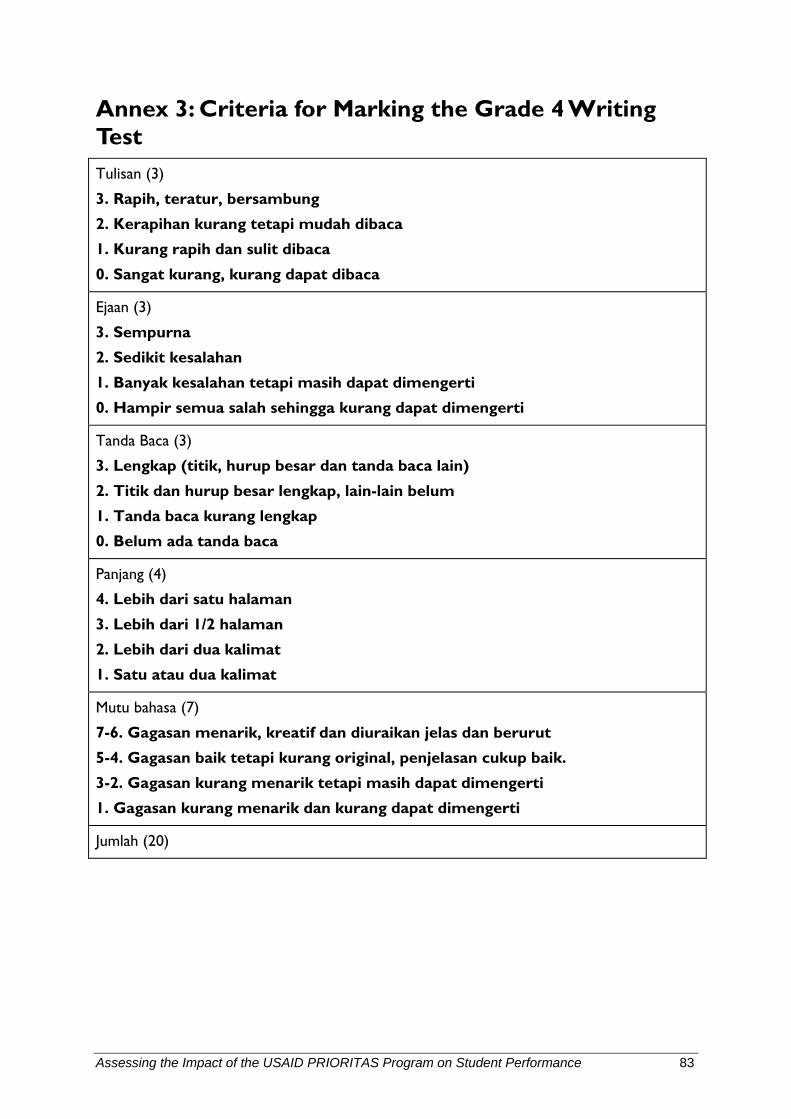
Assessing the Impact of the USAID PRIORITAS Program on Student Performance 83
Annex 3: Criteria for Marking the Grade 4 Writing Test Tulisan (3)
3. Rapih, teratur, bersambung
2. Kerapihan kurang tetapi mudah dibaca
1. Kurang rapih dan sulit dibaca
0. Sangat kurang, kurang dapat dibaca
Ejaan (3)
3. Sempurna
2. Sedikit kesalahan
1. Banyak kesalahan tetapi masih dapat dimengerti
0. Hampir semua salah sehingga kurang dapat dimengerti
Tanda Baca (3)
3. Lengkap (titik, hurup besar dan tanda baca lain)
2. Titik dan hurup besar lengkap, lain-lain belum
1. Tanda baca kurang lengkap
0. Belum ada tanda baca
Panjang (4)
4. Lebih dari satu halaman
3. Lebih dari 1/2 halaman
2. Lebih dari dua kalimat
1. Satu atau dua kalimat
Mutu bahasa (7)
7-6. Gagasan menarik, kreatif dan diuraikan jelas dan berurut
5-4. Gagasan baik tetapi kurang original, penjelasan cukup baik.
3-2. Gagasan kurang menarik tetapi masih dapat dimengerti
1. Gagasan kurang menarik dan kurang dapat dimengerti
Jumlah (20)
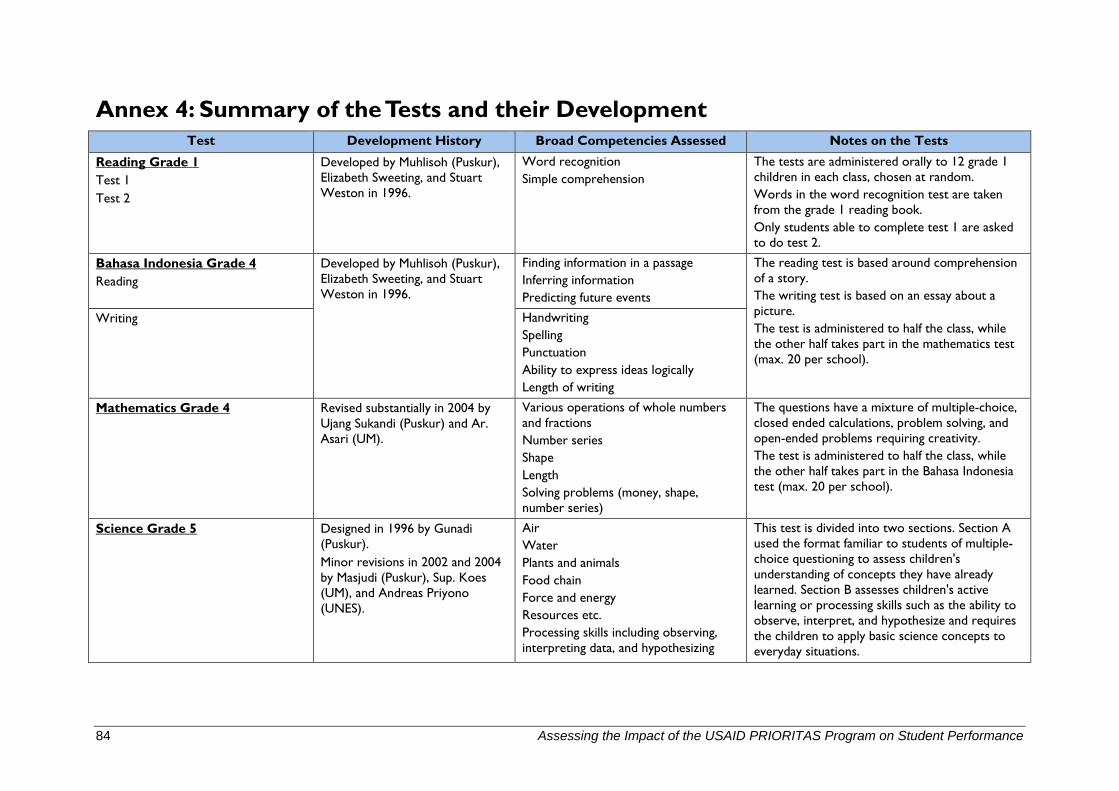
84 Assessing the Impact of the USAID PRIORITAS Program on Student Performance
Annex 4: Summary of the Tests and their Development Test Development History Broad Competencies Assessed Notes on the Tests
Reading Grade 1 Test 1 Test 2
Developed by Muhlisoh (Puskur), Elizabeth Sweeting, and Stuart Weston in 1996.
Word recognition Simple comprehension
The tests are administered orally to 12 grade 1 children in each class, chosen at random. Words in the word recognition test are taken from the grade 1 reading book. Only students able to complete test 1 are asked to do test 2.
Bahasa Indonesia Grade 4 Reading
Developed by Muhlisoh (Puskur), Elizabeth Sweeting, and Stuart Weston in 1996.
Finding information in a passage Inferring information Predicting future events
The reading test is based around comprehension of a story. The writing test is based on an essay about a picture. The test is administered to half the class, while the other half takes part in the mathematics test (max. 20 per school).
Writing Handwriting Spelling Punctuation Ability to express ideas logically Length of writing
Mathematics Grade 4 Revised substantially in 2004 by Ujang Sukandi (Puskur) and Ar. Asari (UM).
Various operations of whole numbers and fractions Number series Shape Length Solving problems (money, shape, number series)
The questions have a mixture of multiple-choice, closed ended calculations, problem solving, and open-ended problems requiring creativity. The test is administered to half the class, while the other half takes part in the Bahasa Indonesia test (max. 20 per school).
Science Grade 5 Designed in 1996 by Gunadi (Puskur). Minor revisions in 2002 and 2004 by Masjudi (Puskur), Sup. Koes (UM), and Andreas Priyono (UNES).
Air Water Plants and animals Food chain Force and energy Resources etc. Processing skills including observing, interpreting data, and hypothesizing
This test is divided into two sections. Section A used the format familiar to students of multiple-choice questioning to assess children's understanding of concepts they have already learned. Section B assesses children's active learning or processing skills such as the ability to observe, interpret, and hypothesize and requires the children to apply basic science concepts to everyday situations.
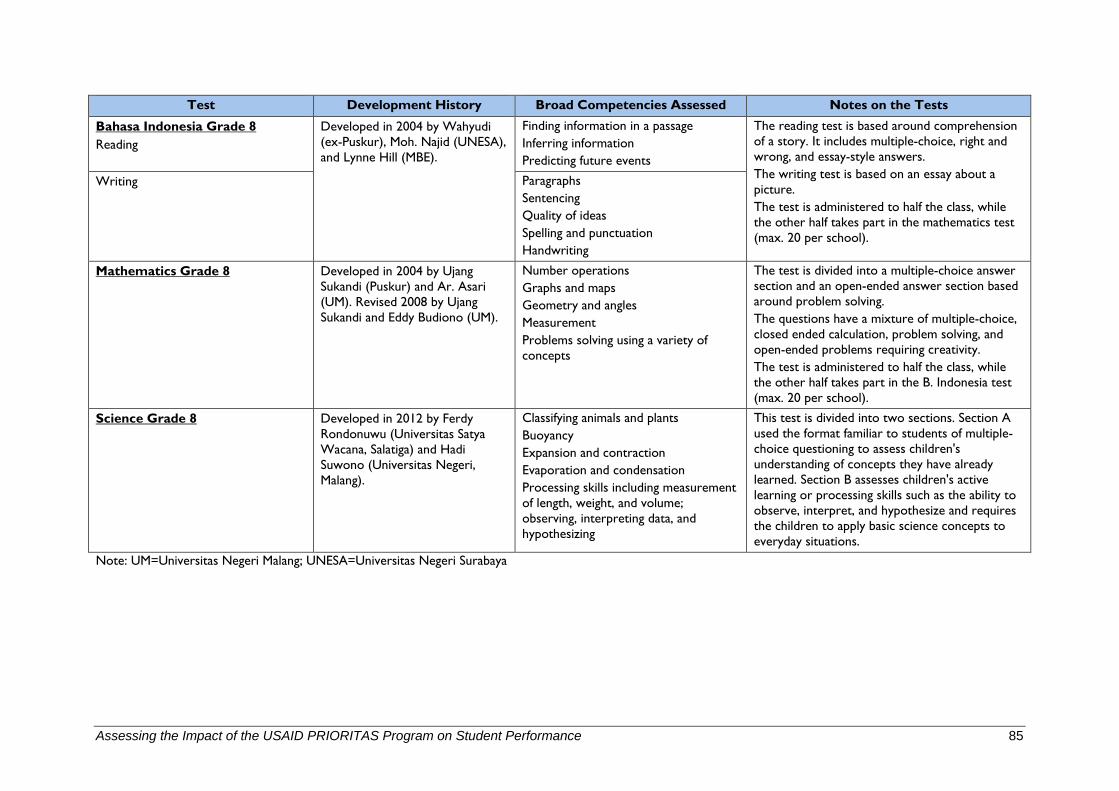
Assessing the Impact of the USAID PRIORITAS Program on Student Performance 85
Test Development History Broad Competencies Assessed Notes on the Tests
Bahasa Indonesia Grade 8 Reading
Developed in 2004 by Wahyudi (ex-Puskur), Moh. Najid (UNESA), and Lynne Hill (MBE).
Finding information in a passage Inferring information Predicting future events
The reading test is based around comprehension of a story. It includes multiple-choice, right and wrong, and essay-style answers. The writing test is based on an essay about a picture. The test is administered to half the class, while the other half takes part in the mathematics test (max. 20 per school).
Writing Paragraphs Sentencing Quality of ideas Spelling and punctuation Handwriting
Mathematics Grade 8 Developed in 2004 by Ujang Sukandi (Puskur) and Ar. Asari (UM). Revised 2008 by Ujang Sukandi and Eddy Budiono (UM).
Number operations Graphs and maps Geometry and angles Measurement Problems solving using a variety of concepts
The test is divided into a multiple-choice answer section and an open-ended answer section based around problem solving. The questions have a mixture of multiple-choice, closed ended calculation, problem solving, and open-ended problems requiring creativity. The test is administered to half the class, while the other half takes part in the B. Indonesia test (max. 20 per school).
Science Grade 8 Developed in 2012 by Ferdy Rondonuwu (Universitas Satya Wacana, Salatiga) and Hadi Suwono (Universitas Negeri, Malang).
Classifying animals and plants Buoyancy Expansion and contraction Evaporation and condensation Processing skills including measurement of length, weight, and volume; observing, interpreting data, and hypothesizing
This test is divided into two sections. Section A used the format familiar to students of multiple-choice questioning to assess children's understanding of concepts they have already learned. Section B assesses children's active learning or processing skills such as the ability to observe, interpret, and hypothesize and requires the children to apply basic science concepts to everyday situations.
Note: UM=Universitas Negeri Malang; UNESA=Universitas Negeri Surabaya