analisis pengaruh kualitas pelayanan perbankan terhadap
TRANSCRIPT
ANALISIS PENGARUH KUALITAS PELAYANAN
PERBANKAN TERHADAP KEPUASAN NASABAH
PADA PT. BANK NIAGA, TBK.
(KANTOR CABANG KALIMALANG BEKASI)
Melly Agustin SE
Jl. Cut Mutia 01/02 No. 4
Kel. Sepanjang Jaya - Kec.Rawalumbu
Bekasi – Timur 17114
Abstrak :
Tujuan dari penelitian ini adalah untuk mengukur pengaruh kualitaspelayanan terhadap kepuasan pada nasabah PT. Bank Niaga, Tbk. (KantorCabang Kalimalang Bekasi). Metode yang digunakan adalah Analisis Deskriptif,Metode Regresi, Uji Validitas dan Reliabilitas, Uji Hipotesis dan Uji F-Test. Danhasil yang di dapat dari penelitian tersebut adalah bahwa nasabah PT. BankNiaga, Tbk. (Kantor Cabang Kalimalang Bekasi), pada Metode Regresi (UjiResponsiveness) terdapat penurunan kepuasan nasabah.Kata Kunci : Kualitas, Kepuasan Nasabah
PENDAHULUANPersaingan perbankan pada saat ini sangat ketat. Untuk itu menuntut setiap
bank untuk mempertahankan atau mendapatkan nasabah baru. Pentingnya faktorpelayanan memang tidak dapat di hindari oleh bank, karena bisnis perbankanmerupakan bisnis layanan (service). Bank-bank yang memberikan layanan lebihbaik yang akan dicari oleh para nasabah. Dan ketidakpuasan nasabah akan mudahsekali membuat para nasabah tersebut pindah ke bank lain.

Untuk itu penulis melakukan penelitian sebagai mengukur pengaruhtingkat kepuasan terhadap rekomendasi nasabah terhadap bank dan tentunyauntuk mengetahui pangaruh kualitas pelayanan terhadap kepuasan pada nasabah.Bolton and Drew,1991; Cronin and Taylor,1992;Taylor and Baker,1994;Sprengand Mackoy,1996,”Customer Service Quality in The Greek Cypriot BankingIndustry”: “Customer satisfaction in another important aspect for serviceorganizations and is highly related with service quality”.
Zeithaml,Valerie.A.,Parasuraman,A.,Berry,Leonard.,1990,”Delivering QualityService: Balancing Customer Perception and Expectations”: “Terdapat 10kriteria yang dapat digunakan untuk menilai kualitas pelayanan : Tangible,Responsiveness, Competence, Courtesy, Credibility, Security, Access,Communication, and Understanding The Customer”.
A.Subonteng et,al,”Relationship Between Online Service Quality and CustomerSatisfaction”: “Service quality can be defined as the difference betweencustomers expectation for service performance prior to the service encounterand their perception of the service received”.
METODE PENELITIANUntuk populasi dalam penelitian ini adalah semua nasabah PT. Bank
Niaga, Tbk Cabang Kalimalang Bekasi. Data yang dikumpulkan adalah denganmetode probability sampling dan menggunakan purposive sampling, dimanapengambilan sampel populasi dilakukan secara acak.
Variabel penelitian terdiri dari : Variabel Bebas (Independent Variable) :X1(Tangibles), X2(Reliability), X3(Responsiveness), X4(Assurance)danX5(Empathy). Variabel Terikat (Dependent Variable) : Y
Metode analisis data ; Analisis Deskriptif, Digunakan untuk menyusundata yang jumlahnya relative banyak kedalam suatu table frekwensi.Uji Validitas, Tujuannya adalah agar data yang diambil benar-benar valid, yaknibenar-benar mengukur apa yang hendak diukur.Uji Reliabilitas, Digunakan untuk mengukur suatu kuesioner yang merupakanindicator dari variable. Kuesioner dikatakan reliable, jika jawaban seseoranggerhadap pertanyaan adalah konsisten atau stabil dari waktu ke waktu.Metode Regresi, Digunakan antara satu Dependent Variable (Variabel Terikat)dengan beberapa (lebih dari satu) Variable Independent (Variabel Bebas)Uji Hipotesis, Untuk mengetahui ada tidaknya perbedaan antara pendapat danharapan nasabah terhadap kualitas pelayanan.

Uji F-Test, Digunakan untuk menguji hubungan 2 variabel bebas secara bersama-sama dengan variable terikat.
HASIL DAN PEMBAHASANPopulasi yang diambil sebanyak 100 orang.
Uji Validitas XI ( TANGIBLES )
RELIABILITY ANALYSIS - SCALE ( ALPHA )
N of Cases = 100,0
Summary Item Statistics
Maximum /
Mean Minimum Maximum Range Minimum Variance N of Items
Item Means 5.323 5.130 5.430 .300 1.058 .028 3
Item Variances .970 .871 1.084 .213 1.245 .012 3
Inter-Item Covariances .422 .327 .471 .144 1.442 .005 3
Inter-Item Correlations .435 .359 .485 .127 1.353 .004 3
The covariance matrix is calculated and used in the analysis.
Item-Total Statistics
Scale Corrected Squared Cronbach's
Scale Mean if Variance if Item Item-Total Multiple Alpha if Item
Item Deleted Deleted Correlation Correlation Deleted
P1 10.56 2.976 .496 .259 .630
P2 10.84 2.479 .574 .330 .528
P3 10.54 2.897 .478 .236 .651
Reliability Statistics
Cronbach's Alpha
Cronbach's Alpha Basedon Standardized Items
.698 .698 3
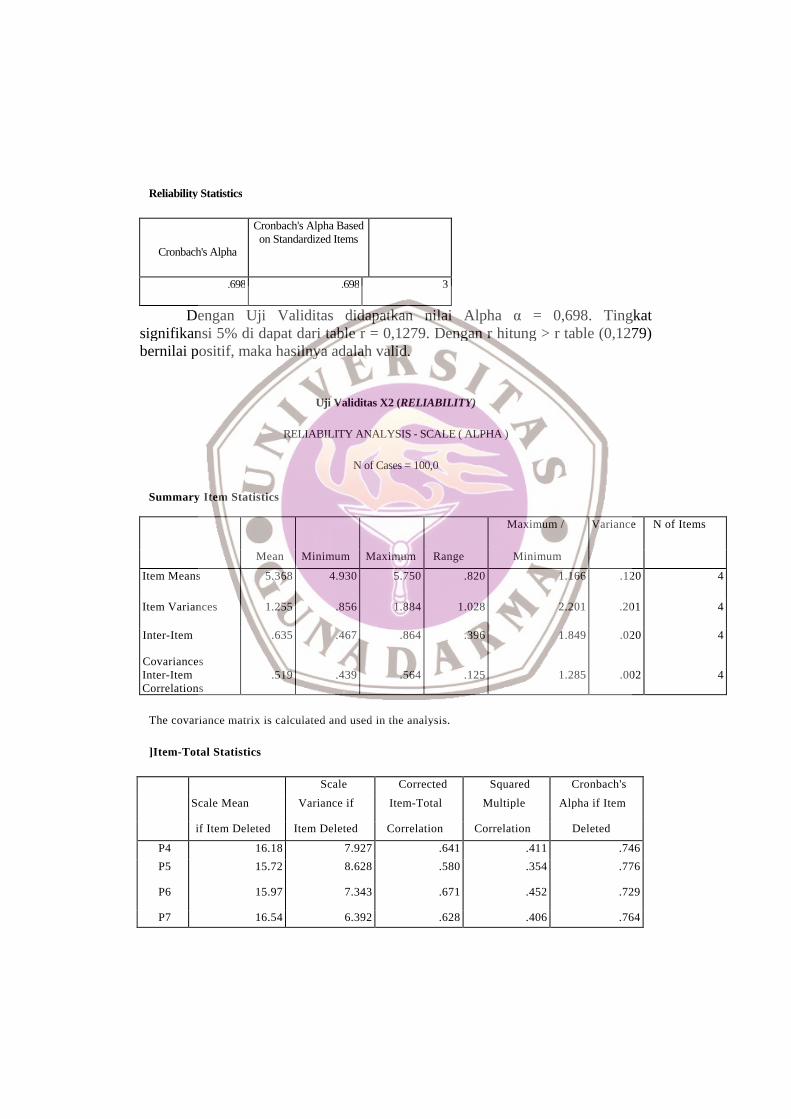
Dengan Uji Validitas didapatkan nilai Alpha α = 0,698. Tingkatsignifikansi 5% di dapat dari table r = 0,1279. Dengan r hitung > r table (0,1279)bernilai positif, maka hasilnya adalah valid.
Uji Validitas X2 (RELIABILITY)
RELIABILITY ANALYSIS - SCALE ( ALPHA )
N of Cases = 100,0
Summary Item Statistics
Maximum / Variance N of Items
Mean Minimum Maximum Range Minimum
Item Means 5.368 4.930 5.750 .820 1.166 .120 4
Item Variances 1.255 .856 1.884 1.028 2.201 .201 4
Inter-Item
Covariances
.635 .467 .864 .396 1.849 .020 4
Inter-ItemCorrelations
.519 .439 .564 .125 1.285 .002 4
The covariance matrix is calculated and used in the analysis.
]Item-Total Statistics
Scale Corrected Squared Cronbach's
Scale Mean Variance if Item-Total Multiple Alpha if Item
if Item Deleted Item Deleted Correlation Correlation Deleted
P4 16.18 7.927 .641 .411 .746
P5 15.72 8.628 .580 .354 .776
P6 15.97 7.343 .671 .452 .729
P7 16.54 6.392 .628 .406 .764
Reliability Statistics
Cronbach'sAlpha
Cronbach's Alpha Basedon Standardized Items
N of Items
.804 .812 4
Reliability Coefficients 4 items
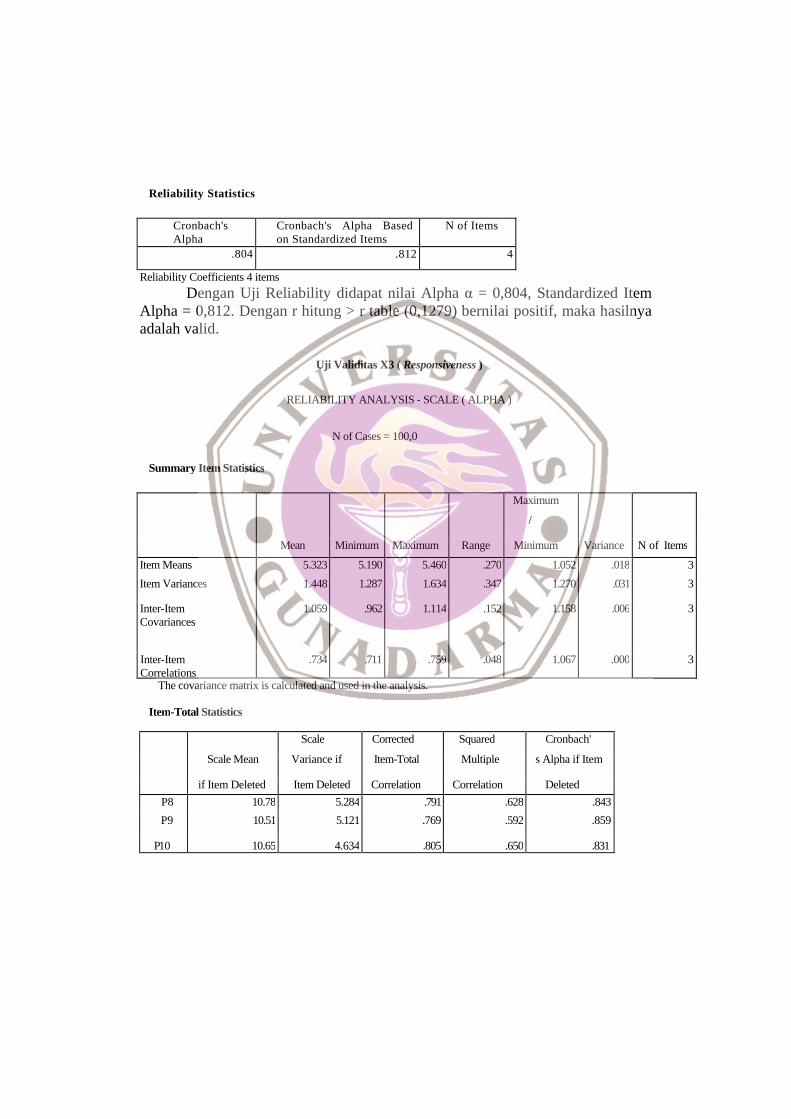
Dengan Uji Reliability didapat nilai Alpha α = 0,804, Standardized ItemAlpha = 0,812. Dengan r hitung > r table (0,1279) bernilai positif, maka hasilnyaadalah valid.
Uji Validitas X3 ( Responsiveness )
RELIABILITY ANALYSIS - SCALE ( ALPHA )
N of Cases = 100,0
Summary Item Statistics
Maximum
/
Mean Minimum Maximum Range Minimum Variance N of Items
Item Means 5.323 5.190 5.460 .270 1.052 .018 3
Item Variances 1.448 1.287 1.634 .347 1.270 .031 3
Inter-ItemCovariances
1.059 .962 1.114 .152 1.158 .006 3
Inter-ItemCorrelations
.734 .711 .759 .048 1.067 .000 3
The covariance matrix is calculated and used in the analysis.
Item-Total Statistics
Scale Corrected Squared Cronbach'
Scale Mean Variance if Item-Total Multiple s Alpha if Item
if Item Deleted Item Deleted Correlation Correlation Deleted
P8 10.78 5.284 .791 .628 .843
P9 10.51 5.121 .769 .592 .859
P10 10.65 4.634 .805 .650 .831

Reliability Coefficients 3 items
Dengan Uji Responsiveness didapat Alpha α = 0,891, Standardized ItemAlpha = 0,892. Dengan r hitung > r table (0,1279) bernilai positif, maka hasilnyaadalah valid.
Uji Validitas X4 (Assurance)
RELIABILITY ANALYSIS - SCALE ( ALPHA )
N of Cases = 100,0
Summary Item Statistics
Maximum /
Mean Minimum Maximum Range Minimum Variance N of Items
Item Means 5.538 5.380 5.700 .320 1.059 .020 4
Item Variances 1.241 1.091 1.450 .359 1.329 .026 4
Inter-ItemCovariances
.715 .567 .802 .235 1.415 .008 4
Inter-ItemCorrelations
.578 .468 .620 .152 1.323 .003 4
The covariance matrix is calculated and used in the analysis.
Item-Total Statistics
Cronbach'sAlpha
Cronbach's Alpha Basedon Standardized Items
.891 .892 3
Scale Scale Corrected Squared Cronbach's
Mean if Item Variance if Item-Total Multiple Alpha if Item
Deleted Item Deleted Correlation Correlation Deleted
P11 16.68 8.341 .658 .460 .812
P12 16.77 7.351 .726 .528 .783
P13 16.55 8.189 .713 .510 .791
P14 16.45 8.169 .632 .418 .824

Reliability Statistics
Cronbach'sAlpha
Cronbach's AlphaBased on Standardized
Items
.845 .846 4
Reliability Coefficients 4 items
Dengan Uji Assurance didapat Alpha α = 0,845, Standardized Item Alpha= 0,846. Dengan r hitung > r table (0,1279) bernilai positif, maka hasilnya adalahvalid.
Uji Validitas X5 ( Empathy )
RELIABILITY ANALYSIS - SCALE ( ALPHA )
N of Cases = 100,0
Summary Item Statistics
Maximum /
Mean Minimum Maximum Range Minimum Variance N ofItems
Item Means 5.438 5.320 5.520 .200 1.038 .007 4
Item Variances .970 .899 1.028 .129 1.144 .004 4
Inter-ItemCovariances
.561 .491 .640 .149 1.304 .004 4
Inter-ItemCorrelations
.579 .503 .655 .152 1.302 .004 4
Item-Total Statistics
Scale Scale Corrected Squared Cronbach'
Mean if Item Variance if Item-Total Multiple s Alpha if Item
Deleted Item Deleted Correlation Correlation Deleted
P15 16.43 6.126 .689 .509 .801
P16 16.23 6.482 .670 .475 .810
P17 16.31 6.196 .723 .542 .787
P18 16.28 6.305 .649 .465 .819
Reliability Statistics
Cronbach's
Cronbach's Alpha Based on
Alpha Standardized Items N of Items
.846 .846 4
Reliability Coefficients 4 items
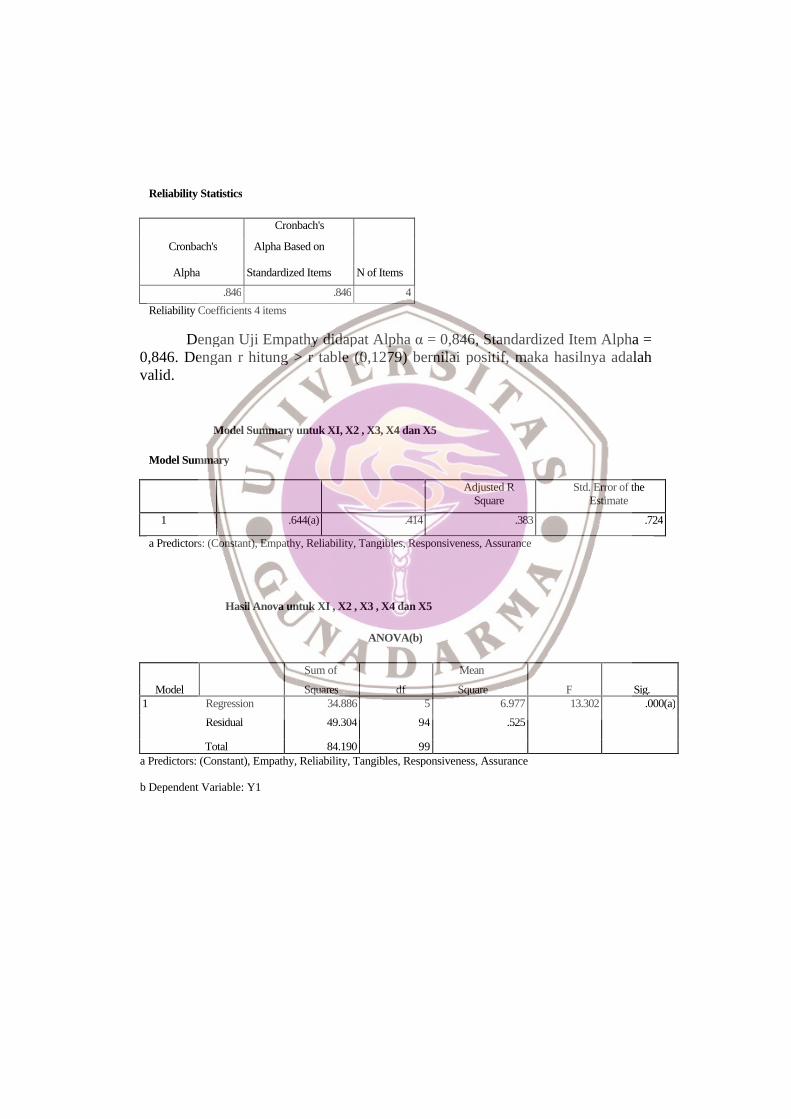
Dengan Uji Empathy didapat Alpha α = 0,846, Standardized Item Alpha =0,846. Dengan r hitung > r table (0,1279) bernilai positif, maka hasilnya adalahvalid.
Model Summary untuk XI, X2 , X3, X4 dan X5
Model Summary
Adjusted RSquare
Std. Error of theEstimate
1 .644(a) .414 .383 .724
a Predictors: (Constant), Empathy, Reliability, Tangibles, Responsiveness, Assurance
Hasil Anova untuk XI , X2 , X3 , X4 dan X5
ANOVA(b)
Sum of Mean
Model Squares df Square F Sig.1 Regression 34.886 5 6.977 13.302 .000(a)
Residual 49.304 94 .525
Total 84.190 99a Predictors: (Constant), Empathy, Reliability, Tangibles, Responsiveness, Assurance
b Dependent Variable: Y1

Hasil Coefficients untuk XI, X2 , X3 , X4 dan X5
Coefficients(a)
Unstandardized Standardize
Model Coefficients d Coefficients t Sig.
B Std. Error Beta
1 (Constant) 1.360 .600 2.267 .026
Tangibles .098 .042 .249 2.369 .020
Reliability .065 .028 .249 2.334 .022
Responsiveness -.076 .030 -.267 -2.568 .012
Assurance .044 .036 .173 1.201 .233
Empathy .070 .033 .248 2.138 .035
a Dependent Variable: Y1
Dapat di lihat bahwa nilai R = 0,644 merupakan koefisian korelasiberganda antara variable tidak bebas (kepuasan nasabah) dengan himpunanvariable bebas. Dan nilai R Square = 0,414.
Persamaan Regresi : Y1 = 1,360 + 0,098 Tangibles + 0,065 Reliability -0,076 Responsiveness + 0,070 Empathy
Model Summary untuk Kepuasan Nasabah Model Summary
Model R R Square
Adjusted RSquare
Std. Error of theEstimate
1 ,587(a) .344 .337 .851
a Predictors: (Constant), Y1
Hasil Anova untuk Kepuasan Nasabah
ANOVA(b)
Sum of Mean
Model Squares df Square F Sig.
1 Regression 37.209 1 37.209 51.431 .000(a)
Residual 70.901 98 .723
Total 108.110 99
a Predictors: (Constant), Y1
b Dependent Variable: Y2
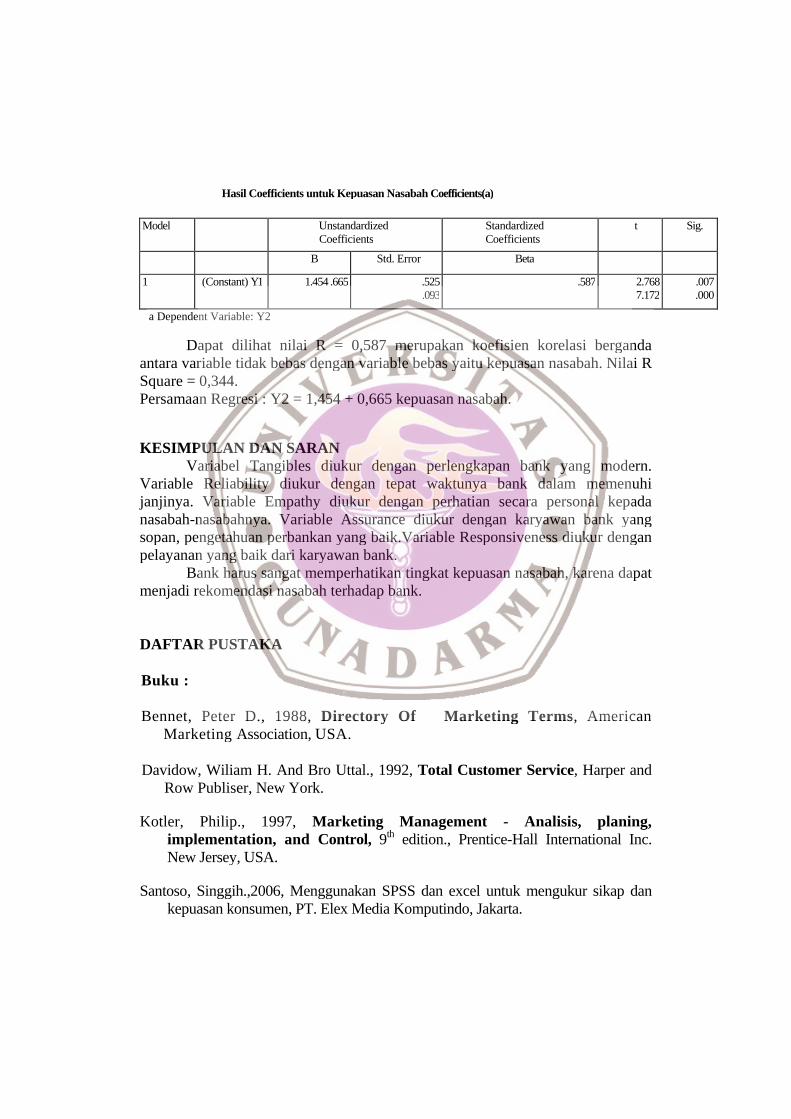
Hasil Coefficients untuk Kepuasan Nasabah Coefficients(a)
Model UnstandardizedCoefficients
StandardizedCoefficients
t Sig.
B Std. Error Beta
1 (Constant) Y1 1.454 .665 .525.093
.587 2.7687.172
.007
.000
a Dependent Variable: Y2
Dapat dilihat nilai R = 0,587 merupakan koefisien korelasi bergandaantara variable tidak bebas dengan variable bebas yaitu kepuasan nasabah. Nilai RSquare = 0,344.Persamaan Regresi : Y2 = 1,454 + 0,665 kepuasan nasabah.
KESIMPULAN DAN SARANVariabel Tangibles diukur dengan perlengkapan bank yang modern.
Variable Reliability diukur dengan tepat waktunya bank dalam memenuhijanjinya. Variable Empathy diukur dengan perhatian secara personal kepadanasabah-nasabahnya. Variable Assurance diukur dengan karyawan bank yangsopan, pengetahuan perbankan yang baik.Variable Responsiveness diukur denganpelayanan yang baik dari karyawan bank.
Bank harus sangat memperhatikan tingkat kepuasan nasabah, karena dapatmenjadi rekomendasi nasabah terhadap bank.
DAFTAR PUSTAKA
Buku :
Bennet, Peter D., 1988, Directory Of Marketing Terms, AmericanMarketing Association, USA.
Davidow, Wiliam H. And Bro Uttal., 1992, Total Customer Service, Harper andRow Publiser, New York.
Kotler, Philip., 1997, Marketing Management - Analisis, planing,implementation, and Control, 9th edition., Prentice-Hall International Inc.New Jersey, USA.
Santoso, Singgih.,2006, Menggunakan SPSS dan excel untuk mengukur sikap dankepuasan konsumen, PT. Elex Media Komputindo, Jakarta.
Santoso, Singgih.,2001, Buku latihan SPSS: Statistik Non Parametrik, PT. ElexMedia Komputindo, Jakarta.
Tjiptono, T.A., 1997, Total Quality Service, Penerbit Andi Offset, Jakarta.
Zeithaml, Valerie. A.,Parasuraman,A.,Berry,Leonard.L.,1990, Delivering QualityService : Balancing Customer Perception and Expectations, The Press, NewYork.
JURNAL:
Avkiran,1994;Le Blanc and Nguyen,1988;Blanchard and Galoway,1994,"Customer Service Quality in The Greek Cypriot Banking Industry",Greek Cypriot Banking Industri, Department of Business Administration,Faculty of Business and Economics, Eastren Mediterranean UniversityMersin,Turkey 2005.
A. Subonteng et,al, “Relationship Between Online Service Quality AndCustomer Satisfaction". A Study in Internet Banking, Department of BussinesAdministration and Social Sciences Division Of Industrial Marketing ande -commerce, Lulea University Of Tecnology.
Bolton and Drew,1991; Cronin and Taylor,1992; Taylor and Baker,1994; Sprengand Mackoy,1996," Customer Service Quality in The Greek CypriotBanking Industry", Greek Cypriot Banking Industri, Department of BusinessAdministration, Faculty of Business and Economics, Eastren MediterraneanUniversity Mersin,Turkey,2005.
Berry and Parasuraman,1991;Gounaris et.al,2003;Reichheld,1996;Heskettet.al,1997, " Customer Service Quality in The Greek Cypriot BankingIndustry", Greek Cypriot Banking Industri, Department of BusinessAdministration, Faculty of Business and Economics, Eastren MediterraneanUniversity Mersin,Turkey,2005.
Bitner et.al.; Parasuraman et.al,2005, “Relationship Between Online ServiceQuality And Customer Satisfaction". A Study in Internet Banking,Department of Bussines Administration and Social Sciences Division OfIndustrial Marketing and e -commerce, Lulea University Of Tecnology,2005.
Caruna & Malta,2005, “Relationship Between Online Service Quality AndCustomer Satisfaction". A Study in Internet Banking, Department of BussinesAdministration and Social Sciences Division Of Industrial Marketing ande -commerce, Lulea University Of Tecnology.
Churchill and Sauprenant,2005, “Relationship Between Online Service QualityAnd Customer Satisfaction". A Study in Internet Banking, Department ofBussines Administration and Social Sciences Division Of Industrial Marketingand e -commerce, Lulea University Of Tecnology.
Gefan,2005, "Relationship Between Online Service Quality AndCustomer Satisfaction". A Study in Internet Banking, Department ofBussines Administration and Social Sciences Division Of Industrial Marketingand e -commerce, Lulea University Of Tecnology.
Hoffman & Bateson, 2005, "Relationship Between Online Service QualityAnd Customer Satisfaction". A Study in Internet Banking, Department ofBussines Administration and Social Sciences Division Of Industrial Marketingand e -commerce, Lulea University Of Tecnology.
Hunt,2005, "Relationship Between Online Service Quality AndCustomer Satisfaction". A Study in Internet Banking, Department ofBussines Administration and Social Sciences Division Of Industrial Marketingand e -commerce, Lulea University Of Tecnology.
Huseini, Martani., 1994," Penyusunan Strategi Pelayanan Prima ; Da lamSuatuPerspektif Reengineering ", Jurnal ilmu Administrasi dan Organisasi,No 3 / Vol.11.September, FISIP UI.
Hardjosoekarto, Sudarsono., 1994," Penyusunan Strategi Pelayanan Prima ;Dalam Suatu Perspektif Reengineering ", Jurnal ilmu Administrasi danOrganisasi, No 3 / Vol. 11 .September, FISIP UI.
Kotler, 2005, "Relationship Between Online Service Quality AndCustomer Satisfaction". A Study in Internet Banking, Department ofBussines Administration and Social Sciences Division Of Industrial Marketingand e -commerce, Lulea University Of Tecnology.
Oliver, 2005, "Relationship Between Online Service Quality AndCustomer Satisfaction". A Study in Internet Banking, Department of

Bussines Administration and Social Sciences Division Of Industrial Marketingand e -commerce, Lulea University Of Tecnology.
Parasuraman ,et,al, 2005, "Relationship Between Online Service Quality AndCustomer Satisfaction". A Study in Internet Banking, Department ofBussines Administration and Social Sciences Division Of Industrial Marketingand e -commerce, Lulea University Of Tecnology.
Zeithmal et.al. ; Yang & Fang ,2005, "Relationship Between Online ServiceQuality And Customer Satisfaction". A Study in Internet Banking,Department of Bussines Administration and Social Sciences Division OfIndustrial Marketing and e -commerce, Lulea University Of Tecnology.