6.1 industri pengolahan 6.1. manufacturing industry · 6.1 industri pengolahan kontribusi terbesar...
TRANSCRIPT
MANUFACTURING, QUARRYING AND ENERGY
Jawa Barat Dalam Angka 2004/2005 285
6.1 Industri Pengolahan Kontribusi terbesar dalam pembangunan ekonomi di Jawa Barat secara makro pada tahun 2003 didominasi oleh Sektor Industri Pengolahan. Oleh karena hampir 60 persen Industri pengolahan berlokasi di Jawa Barat, maka perekonomian nasional sangat dipengaruhi oleh kinerja industri di daerah ini. Bahkan sektor industri pengolahan, merupakan lapangan usaha terbesar kedua menyerap tenaga kerja setelah Pertanian. Untuk itu, kebijakan pembangunan dalam pengembangan sektor ini, sangatlah tepat, walaupun akhir-akhir ini sektor industri pengolahan terhempas akibat krisis ekonomi yang melanda per-ekonomian nasional. Pada umumnya Industri di Jawa Barat berorientasi ekspor, sehingga secara makro dapat meningkatkan penerimaan negara dalam bentuk devisa. Namun karena industri yang dibangun bukan berbasis ekonomi rakyat atau paling tidak menggunakan bahan baku produksi dalam negeri, maka sektor ini rentan terhadap krisis yang melanda dunia bisnis di tanah air. Dalam pengumpulan data Statistik Industri, yang dimaksud dengan sedang dengan jumlah pekerja
6.1. Manufacturing Industry Contribution of manufacturing sector to national economic is very huge, included in Jawa Barat. Since almost 60 percent of manufacturing industries are located in Jawa Barat, the performance of Jawa Barat Manufacturing Industry will affect performance of national economic. In Jawa Barat Economic Structure, Manufacturing Industry Sector has the largest contribution and then followed by Agriculture. On the contrary, manufacturing industry sector was the second economic sector that employs labor force after agriculture. Therefore, development policy in this sector is very significant, even though at this sector is falling down by economic crisis which hurled national economic. Generally, manufacturing industry in Jawa Barat was designed as export oriented industry, so that can increase government revenue in foreign exchange. However since this industry basically is not people economic oriented or at least use domestic raw material product, then this sector susceptible to crisis which hurled business world in this country. In Collecting Data of Industrial Statistics, definition of large scale or more, medium scale industry is
INDUSTRI , PENGGALIAN DAN ENERGI
Jawa Barat Dalam Angka 2004/2005 286
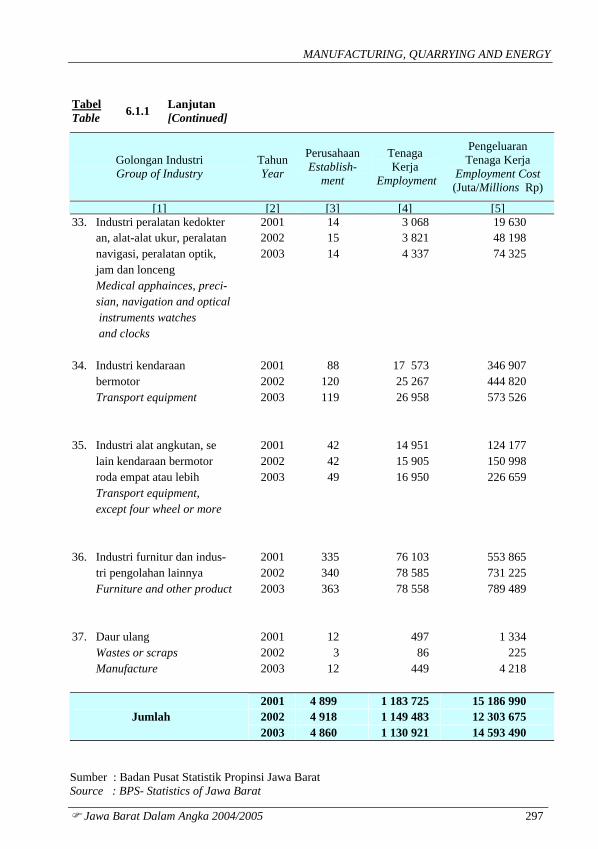
industri besar adalah dengan jumlah pekerja 100 orang atau lebih, industri antara 20 sampai dengan 99 orang. Industri kecil mempunyai mempunyai pekerja antara 5 sampai dengan 19 orang dan perusahaan yang mempunyai pekerja kurang dari 5 orang industri kerajinan rumah tangga. Berdasarkan hasil survei industri besar/sedang tahun 2003 di Jawa Barat terdapat 4 860 buah perusahaan dengan jumlah tenaga kerja terserap sebanyak 1 130 921 orang dan apabila dibandingkan dengan tahun sebelumnya maka jumlah tenaga kerja yang terserap industri besar / sedang mengalami penurunan sebesar 1,61 persen. Upah tenaga kerja selama tahun 2003 mencapai 14 593 490 juta rupiah. Dibandingkan dengan tahun 2002, mengalami kenaikan sebesar 2 289 815 juta rupiah atau sekitar 18,61 persen. Nilai output perusahaan industri besar dan sedang tahun 2003 naik menjadi 195 213 763 juta rupiah (4,24 persen), sedangkan nilai input mencapai 119 002 833 juta rupiah atau turun 0,73 persen. Dengan demikian nilai tambah atas dasar harga pasar sektor industri besar dan sedang tahun 2003 naik menjadi 76 210 930 juta rupiah (13,09 persen).
industry is manufacturing establishment with total number of worker 100 persons manufacturing establishment with number of worker between 20 to 99 persons. Small scale industry is manufacturing establishment with number of worker between 5 to 19 persons and establishment which has number of worker below 5 person is categorized as household industry. According to the result of large/ medium scale Industry Survey Year 2003, in Jawa Barat existed 4 860 enterprises with the number of worker about 1 130 921 thousands persons and compared to previous year number of large/medium scale industry decreased about 1.61 percent.
Worker salary during 2003 reached 14 593 490 million rupiahs. Compared to year 2002 increased about 2 289 815 billion rupiahs at about 18.61 percent Output Value of large/medium manufacturing establishment year 2003 increased to 195 213 763 million rupiahs (4.24 percent). On the other hand, input value reached 119 002 833 million rupiahs or it decreased 0.73 percent. Nevertheless, added value of large/medium scale industry at market prices year 2002 increased to 76 210 930 billion rupiahs (13.09 percent).
MANUFACTURING, QUARRYING AND ENERGY
Jawa Barat Dalam Angka 2004/2005 287
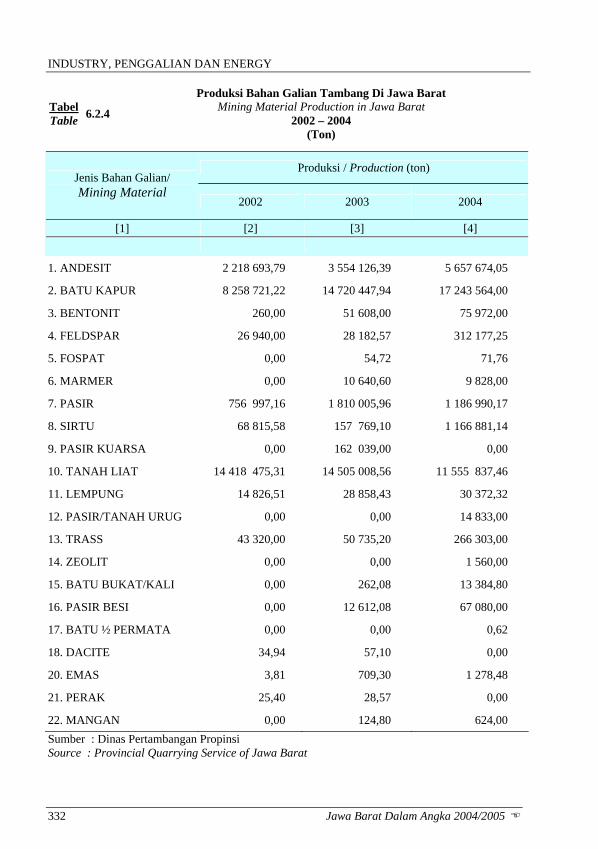
6.2. Penggalian Pengambilan air bawah tanah secara berlebihan dapat mengakibatkan terganggunya ekosistem alam Indonesia. Oleh sebab itu volume air yang diijinkan untuk diambil dan jumlah air yang diambil harus terus dipantau untuk menjaga keseimbangan ekosistem. Pada tahun 2004 jumlah ijin usaha pertambangan di Jawa Barat mencapai 512. Hanya 329 usaha yang sedang aktif atau sekitar 64,26 persen dan sisanya 183 atau sekitar 35,74 persen tidak aktif Jenis bahan galian tambang yang paling banyak dieksploitasi di Jawa Barat adalah batu kapur, tanah liat dan andesit. Pada umumnya, produksi bahan galian tambang mengalami peningkatan dari tahun 2002 sampai 2004. 6.3. Listrik dan Air Minum Sebagian besar dari kebutuhan listrik baik industri maupun untuk rumahtangga di Jawa Barat dilayani oleh Perusahaan Umum Listrik Negara dan sebagian lainnya di luar PLN. Sumber tenaga listrik Perusahaan Umum Listrik Negara berasal dari Pembangkit Listrik Tenaga Air (PLTA) dan Pembangkit Listrik Tenaga Diesel (PLTD).
6.2. Quarrying Exploiting Natural Water Resource overly can damage the nature of ecosystem in Indonesia. Therefore, government has to regulate the volume of water taken and these numbers has to be observed in order to balance the ecosystem itself. In year 2004, the total of mining establishment permit reaches 512 numbers. Only 329 establishments are active, which is around 64.26 percent, and the rest 183 or around 35.74 percent is not active. However, the kinds of mining material mostly exploited in Jawa Barat are limestone, kaolin, and andesit. On general, the production of mining material has been increased since the year of 2002 up to 2004. 6.3. Electricity and Water Supply In Jawa Barat, the State-owned Electricity Company (PLN) supplies most of electricity demand either for manufacturing establishments or for households, and only a small portion supplied by non PLN. The Source of electric power of state-owned Electric Company (PLN) came from hydro electric power generator (PLTA) and Diesel electric power generator (PLTD).
INDUSTRI , PENGGALIAN DAN ENERGI
Jawa Barat Dalam Angka 2004/2005 288
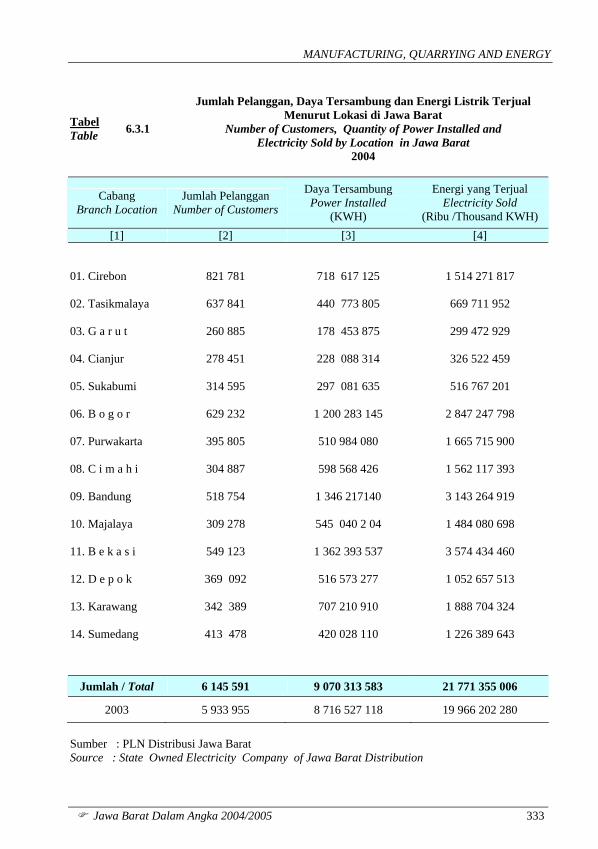
Kebutuhan akan energi listrik dewasa ini semakin meningkat karena terus berkembangnya pembangunan sektor industri dan terus bertambahnya pengguna rumah tangga setiap tahunnya. Bahkan pemerintah tidak mampu untuk mensupply permintaan konsumen terutama dunia usaha. Melalui pinjaman luar negeri maka dibangunlah beberapa pembangkit tenaga listrik baik yang bersumber dari tenaga uap, air, diesel bahkan nuklir, yang dikelola oleh perusahaan swasta. Tahun 2004 jumlah pelanggan sebesar 6 145 591 dengan daya tersambung 9 070 313 583 kwh dan energi listrik yang terjual yaitu sebesar 21 771 355 006 ribu kwh. Akan tetapi 24 156 196 900 ribu kwh yang siap dijual, hanya 22 017 790 318 ribu kwh yang dijual, sisanya sebanyak 2 138 406 582 kwh susut atau hilang (8,85 persen). Jumlah desa yang dialiri listrik pada tahun 2004 sebanyak 5 562 desa dengan dengan daya tersambung 3 992 MVA.
In 2004, total customers was 6 145 591 with power installed 9 070 313 583 kwh, and the total electricity sold was 21 771 355 006 thousand kwh. However, the total of ready sold energy was 24 156 196 900 thousand kwh. There was only 22 017 790 318being sold, and the rest 2 138 406 582 was lost (8.85 percent).
Kebutuhan air bersih semakin dirasakan oleh masyarakat perkotaan. Hal ini merupakan dampak dari tingginya kepadatan penduduk daerah perkotaan yang dibarengi dengan langkanya sumber air bersih. Di samping itu, manajemen perusahaan daerah sebagai pengelola ternyata selama ini kurang profesional sehingga sebagian besar dalam operasionalnya mengalami inefisiensi.
The needs of electricity increased sharply since development of manufacturing industry sector increased and the number of households increased every year. The government even can not supply all the consumer needs especially demand from manufacturing industry. Therefore, by using the foreign loan the government built new electric power generator such as, hydro electric power generator (PLTA), Nuclear Electric Power Generator (PLTN), Gas Electric Power Generator (PLTG).
The number of villages that have electricity in year 2004 was 5 562 villages with connected power 3 992 MVA. At this moment, urban societies rely heavily on clean water supply. It is an impact of highly populated density in urban area together with scarcity of fresh water resources. Beside that, the management of regional enterprises as manager during this time was so unprofessional. This reason has caused inefficiency in the company operation.
MANUFACTURING, QUARRYING AND ENERGY
Jawa Barat Dalam Angka 2004/2005 289
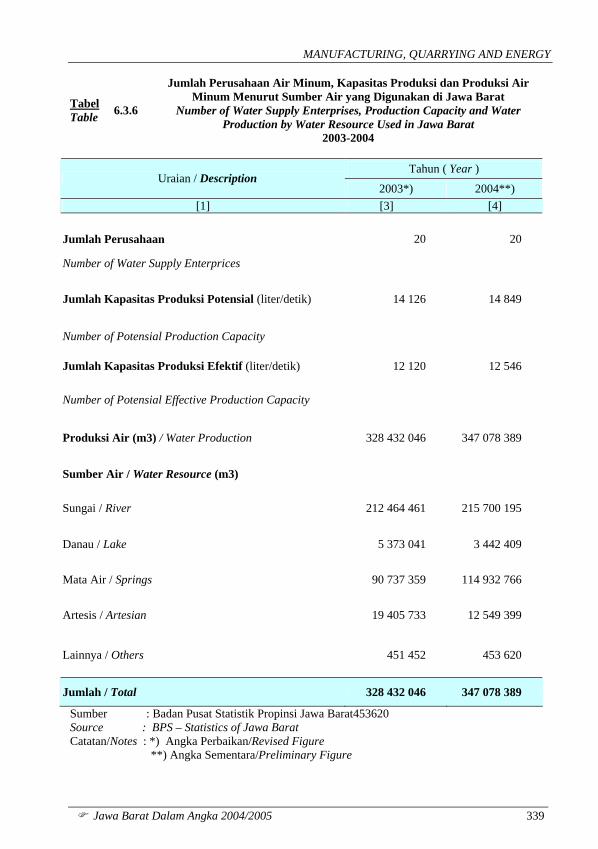
Di samping itu sumber air bersih ini menjadi masalah utama terutama daerah yang tata ruangnya tidak konsisten sehingga terjadi pencemaran lingkungan dan dapat membawa dampak terhadap kesehatan masyarakat. Pada tahun 2004 jumlah perusahaan air minum di Jawa Barat sebanyak 20 perusahaan dengan kemampuan kapasitas produksi efektif sebesar 12 413 lt/detik. Sedangkan jumlah kapasitas produksi potensial adalah sebesar 14 702 lt/detik. Produksi air bersumber dari sungai, danau, mata air, artesis dan lainnya. Sedangkan produksi air terbesar bersumber dari sungai sebesar 208,2 juta m3. Pendistribusian air disalurkan ke berbagai golongan konsumen antara lain rumah tangga, niaga/perdagangan dan industri, badan sosial, umum, instansi pemerintah dan lainnya.
The fresh water resources became main problem prominently in region that has inconsistent space regulation so that happened environment pollution and could bring impact to society health. In year 2004 the number of water supply enterprises is 20 with total effective production capacity 12 413 lt/seconds. However, the number of potential capacity production was 14 702 lt/ second. The water resources are from rivers, lakes, spring water, artesian and others. Most of the water taken is from rivers, about 208.2 million m3. The clean water is distributed to all kinds of costumers , i.e. house holds, trading and industries, social institutions, public facilities, government institution and others.
MANUFACTURING, QUARRYING AND ENERGY
Jawa Barat Dalam Angka 2004/ 2005 291
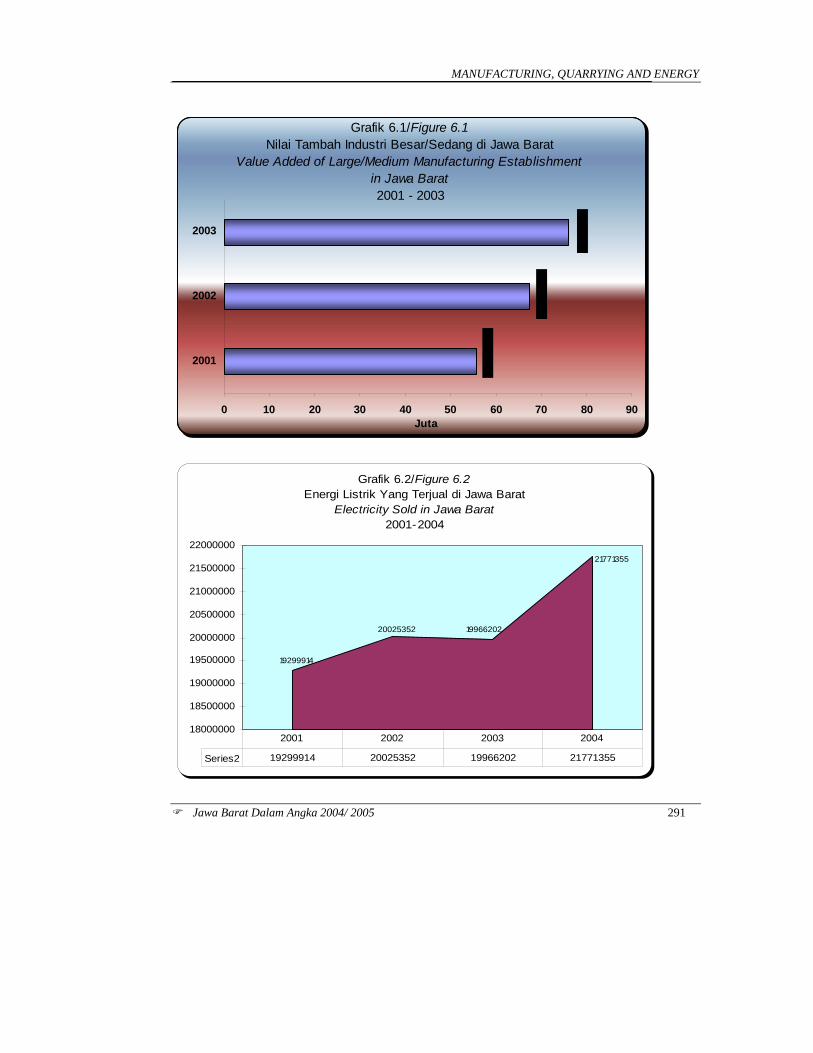
Grafik 6.1/Figure 6.1Nilai Tambah Industri Besar/Sedang di Jawa Barat
Value Added of Large/Medium Manufacturing Establishmentin Jawa Barat2001 - 2003
0 10 20 30 40 50 60 70 80 90
2001
2002
2003
Juta
Grafik 6.2/Figure 6.2Energi Listrik Yang Terjual di Jawa Barat
Electricity Sold in Jawa Barat2001-2004
21771355
1996620220025352
19299914
18000000
18500000
19000000
19500000
20000000
20500000
21000000
21500000
22000000
Series2 19299914 20025352 19966202 21771355
2001 2002 2003 2004
MANUFACTURING, QUARRYING AND ENERGY
Jawa Barat Dalam Angka 2004/2005 293
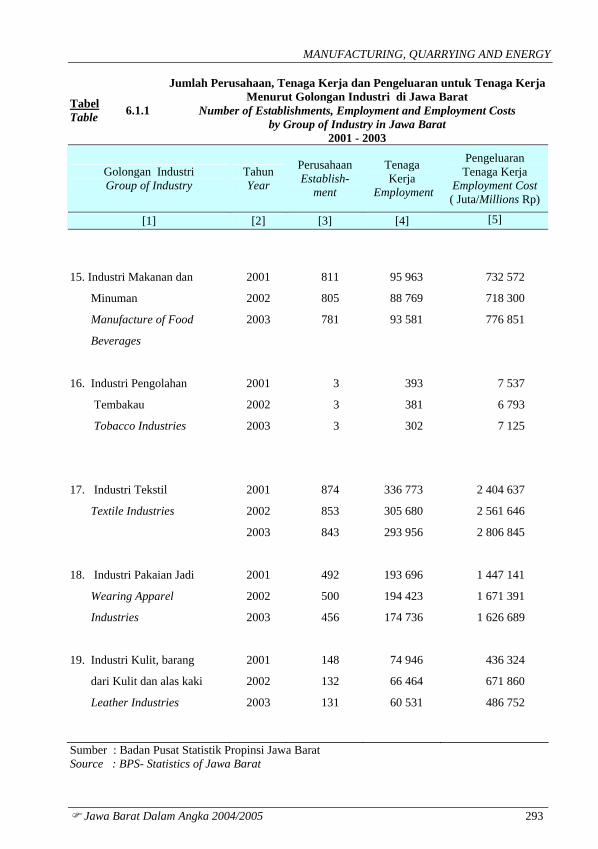
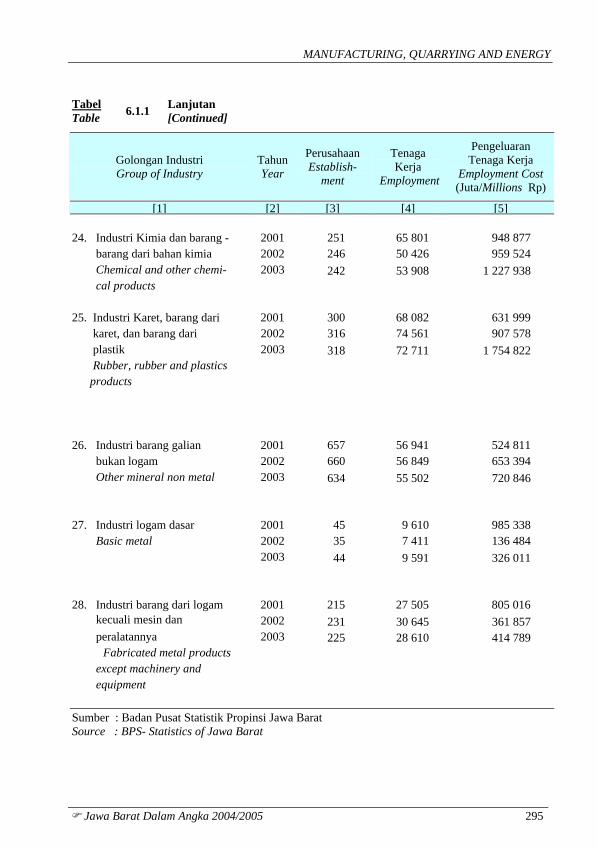
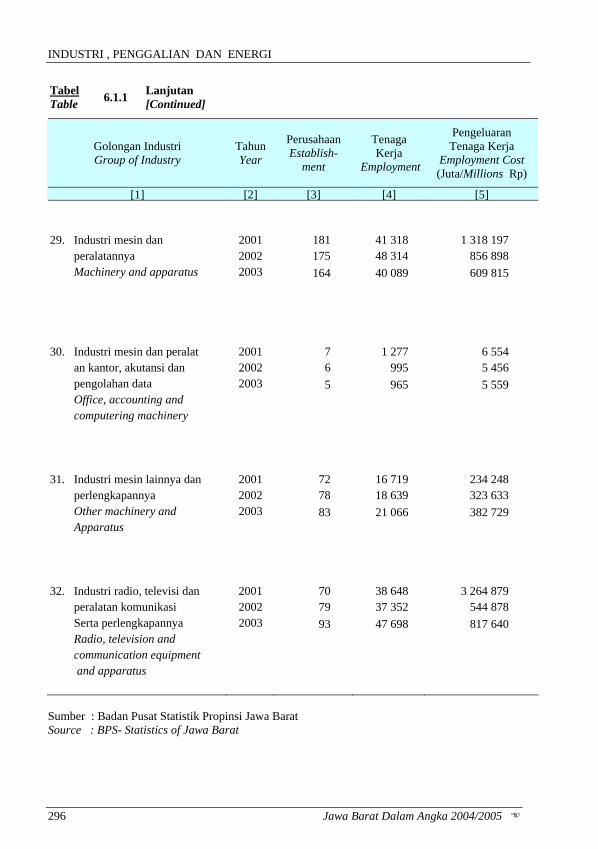
Tabel Table 6.1.1
Jumlah Perusahaan, Tenaga Kerja dan Pengeluaran untuk Tenaga Kerja Menurut Golongan Industri di Jawa Barat
Number of Establishments, Employment and Employment Costs by Group of Industry in Jawa Barat
2001 - 2003
Golongan Industri Group of Industry
Tahun Year
Perusahaan Establish-
ment
Tenaga Kerja
Employment
Pengeluaran Tenaga Kerja
Employment Cost ( Juta/Millions Rp)
[1] [2] [3] [4] [5]
15. Industri Makanan dan 2001 811 95 963 732 572
Minuman 2002 805 88 769 718 300
Manufacture of Food 2003 781 93 581 776 851
Beverages
16. Industri Pengolahan 2001 3 393 7 537
Tembakau 2002 3 381 6 793
Tobacco Industries 2003 3 302 7 125
17. Industri Tekstil 2001 874 336 773 2 404 637
Textile Industries 2002 853 305 680 2 561 646
2003 843 293 956 2 806 845
18. Industri Pakaian Jadi 2001 492 193 696 1 447 141
Wearing Apparel 2002 500 194 423 1 671 391
Industries 2003 456 174 736 1 626 689
19. Industri Kulit, barang 2001 148 74 946 436 324
dari Kulit dan alas kaki 2002 132 66 464 671 860
Leather Industries 2003 131 60 531 486 752
Sumber : Badan Pusat Statistik Propinsi Jawa Barat Source : BPS- Statistics of Jawa Barat
INDUSTRI , PENGGALIAN DAN ENERGI
294 Jawa Barat Dalam Angka 2004/2005
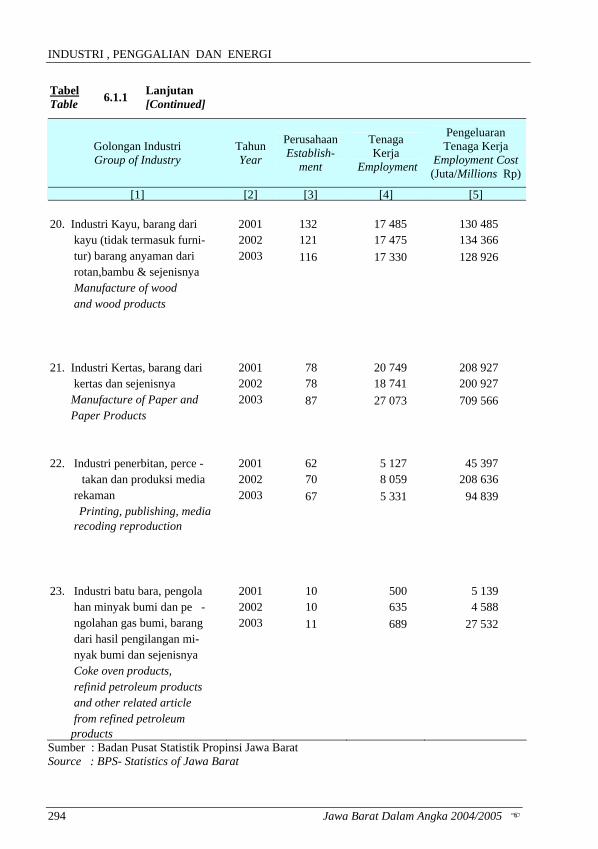
Tabel Table 6.1.1 Lanjutan
[Continued]
Golongan Industri Group of Industry
Tahun Year
Perusahaan Establish-
ment
Tenaga Kerja
Employment
Pengeluaran Tenaga Kerja
Employment Cost (Juta/Millions Rp)
[1] [2] [3] [4] [5] 20. Industri Kayu, barang dari 2001 132 17 485 130 485 kayu (tidak termasuk furni- 2002 121 17 475 134 366 tur) barang anyaman dari 2003 116 17 330 128 926 rotan,bambu & sejenisnya Manufacture of wood and wood products 21. Industri Kertas, barang dari 2001 78 20 749 208 927 kertas dan sejenisnya 2002 78 18 741 200 927 Manufacture of Paper and 2003 87 27 073 709 566 Paper Products 22. Industri penerbitan, perce - 2001 62 5 127 45 397
takan dan produksi media 2002 70 8 059 208 636 rekaman 2003 67 5 331 94 839
Printing, publishing, media recoding reproduction
23. Industri batu bara, pengola 2001 10 500 5 139 han minyak bumi dan pe - 2002 10 635 4 588 ngolahan gas bumi, barang 2003 11 689 27 532 dari hasil pengilangan mi- nyak bumi dan sejenisnya Coke oven products, refinid petroleum products and other related article from refined petroleum products Sumber : Badan Pusat Statistik Propinsi Jawa Barat Source : BPS- Statistics of Jawa Barat
MANUFACTURING, QUARRYING AND ENERGY
Jawa Barat Dalam Angka 2004/2005 295
Tabel Table 6.1.1 Lanjutan
[Continued]
Golongan Industri Group of Industry
Tahun Year
Perusahaan Establish-
ment
Tenaga Kerja
Employment
Pengeluaran Tenaga Kerja
Employment Cost (Juta/Millions Rp)
[1] [2] [3] [4] [5] 24. Industri Kimia dan barang - 2001 251 65 801 948 877 barang dari bahan kimia 2002 246 50 426 959 524 Chemical and other chemi- 2003 242 53 908 1 227 938 cal products 25. Industri Karet, barang dari 2001 300 68 082 631 999 karet, dan barang dari 2002 316 74 561 907 578 plastik 2003 318 72 711 1 754 822 Rubber, rubber and plastics products 26. Industri barang galian 2001 657 56 941 524 811 bukan logam 2002 660 56 849 653 394 Other mineral non metal 2003 634 55 502 720 846 27. Industri logam dasar 2001 45 9 610 985 338 Basic metal 2002 35 7 411 136 484 2003 44 9 591 326 011 28. Industri barang dari logam 2001 215 27 505 805 016 kecuali mesin dan 2002 231 30 645 361 857 peralatannya 2003 225 28 610 414 789
Fabricated metal products except machinery and equipment Sumber : Badan Pusat Statistik Propinsi Jawa Barat Source : BPS- Statistics of Jawa Barat
INDUSTRI , PENGGALIAN DAN ENERGI
296 Jawa Barat Dalam Angka 2004/2005
Tabel Table 6.1.1 Lanjutan
[Continued]
Golongan Industri Group of Industry
Tahun Year
Perusahaan Establish-
ment
Tenaga Kerja
Employment
Pengeluaran Tenaga Kerja
Employment Cost (Juta/Millions Rp)
[1] [2] [3] [4] [5] 29. Industri mesin dan 2001 181 41 318 1 318 197 peralatannya 2002 175 48 314 856 898 Machinery and apparatus 2003 164 40 089 609 815 30. Industri mesin dan peralat 2001 7 1 277 6 554 an kantor, akutansi dan 2002 6 995 5 456 pengolahan data 2003 5 965 5 559 Office, accounting and computering machinery 31. Industri mesin lainnya dan 2001 72 16 719 234 248 perlengkapannya 2002 78 18 639 323 633 Other machinery and 2003 83 21 066 382 729 Apparatus 32. Industri radio, televisi dan 2001 70 38 648 3 264 879 peralatan komunikasi 2002 79 37 352 544 878 Serta perlengkapannya 2003 93 47 698 817 640 Radio, television and communication equipment and apparatus Sumber : Badan Pusat Statistik Propinsi Jawa Barat Source : BPS- Statistics of Jawa Barat
MANUFACTURING, QUARRYING AND ENERGY
Jawa Barat Dalam Angka 2004/2005 297
Tabel Table 6.1.1 Lanjutan
[Continued]
Golongan Industri Group of Industry
Tahun Year
Perusahaan Establish-
ment
Tenaga Kerja
Employment
Pengeluaran Tenaga Kerja
Employment Cost (Juta/Millions Rp)
[1] [2] [3] [4] [5]33. Industri peralatan kedokter 2001 14 3 068 19 630 an, alat-alat ukur, peralatan 2002 15 3 821 48 198 navigasi, peralatan optik, 2003 14 4 337 74 325 jam dan lonceng Medical apphainces, preci- sian, navigation and optical instruments watches and clocks 34. Industri kendaraan 2001 88 17 573 346 907 bermotor 2002 120 25 267 444 820 Transport equipment 2003 119 26 958 573 526 35. Industri alat angkutan, se 2001 42 14 951 124 177 lain kendaraan bermotor 2002 42 15 905 150 998 roda empat atau lebih 2003 49 16 950 226 659 Transport equipment, except four wheel or more 36. Industri furnitur dan indus- 2001 335 76 103 553 865 tri pengolahan lainnya 2002 340 78 585 731 225 Furniture and other product 2003 363 78 558 789 489 37. Daur ulang 2001 12 497 1 334 Wastes or scraps 2002 3 86 225 Manufacture 2003 12 449 4 218
2001 4 899 1 183 725 15 186 990 2002 4 918 1 149 483 12 303 675 Jumlah 2003 4 860 1 130 921 14 593 490
Sumber : Badan Pusat Statistik Propinsi Jawa Barat Source : BPS- Statistics of Jawa Barat
INDUSTRI , PENGGALIAN DAN ENERGI
298 Jawa Barat Dalam Angka 2004/2005
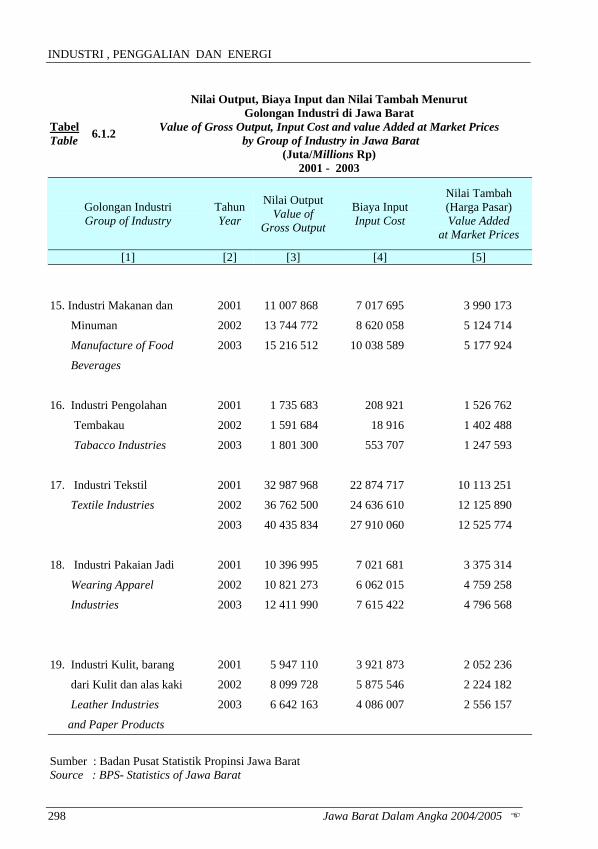
Tabel Table 6.1.2
Nilai Output, Biaya Input dan Nilai Tambah Menurut Golongan Industri di Jawa Barat
Value of Gross Output, Input Cost and value Added at Market Prices by Group of Industry in Jawa Barat
(Juta/Millions Rp) 2001 - 2003
Golongan Industri Group of Industry
Tahun Year
Nilai Output Value of
Gross Output
Biaya Input Input Cost
Nilai Tambah (Harga Pasar) Value Added
at Market Prices
[1] [2] [3] [4] [5]
15. Industri Makanan dan 2001 11 007 868 7 017 695 3 990 173
Minuman 2002 13 744 772 8 620 058 5 124 714
Manufacture of Food 2003 15 216 512 10 038 589 5 177 924
Beverages
16. Industri Pengolahan 2001 1 735 683 208 921 1 526 762
Tembakau 2002 1 591 684 18 916 1 402 488
Tabacco Industries 2003 1 801 300 553 707 1 247 593
17. Industri Tekstil 2001 32 987 968 22 874 717 10 113 251
Textile Industries 2002 36 762 500 24 636 610 12 125 890
2003 40 435 834 27 910 060 12 525 774
18. Industri Pakaian Jadi 2001 10 396 995 7 021 681 3 375 314
Wearing Apparel 2002 10 821 273 6 062 015 4 759 258
Industries 2003 12 411 990 7 615 422 4 796 568
19. Industri Kulit, barang 2001 5 947 110 3 921 873 2 052 236
dari Kulit dan alas kaki 2002 8 099 728 5 875 546 2 224 182
Leather Industries 2003 6 642 163 4 086 007 2 556 157
and Paper Products
Sumber : Badan Pusat Statistik Propinsi Jawa Barat Source : BPS- Statistics of Jawa Barat
MANUFACTURING, QUARRYING AND ENERGY
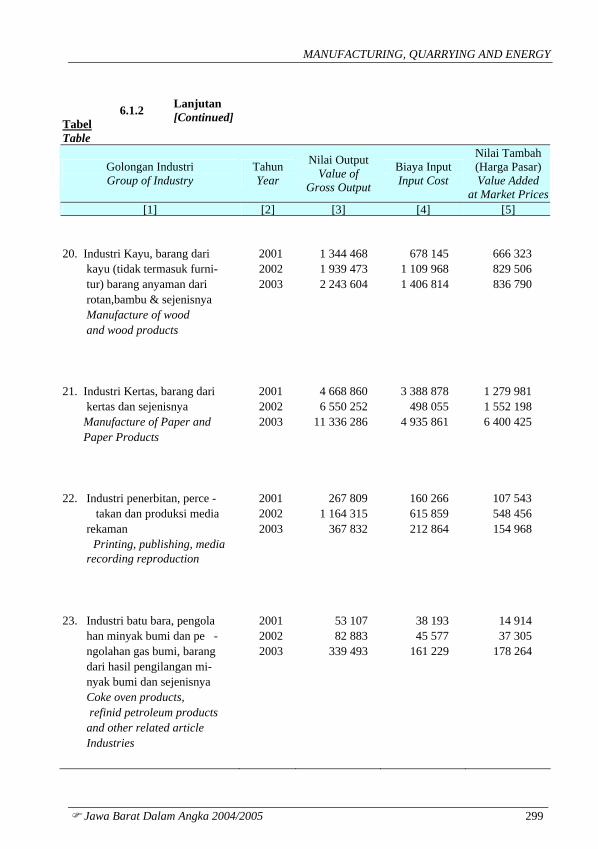
Jawa Barat Dalam Angka 2004/2005 299
Tabel Table
6.1.2 Lanjutan [Continued]
Golongan Industri Group of Industry
Tahun Year
Nilai Output Value of
Gross Output
Biaya Input Input Cost
Nilai Tambah (Harga Pasar) Value Added
at Market Prices[1] [2] [3] [4] [5]
20. Industri Kayu, barang dari 2001 1 344 468 678 145 666 323 kayu (tidak termasuk furni- 2002 1 939 473 1 109 968 829 506 tur) barang anyaman dari 2003 2 243 604 1 406 814 836 790 rotan,bambu & sejenisnya Manufacture of wood and wood products 21. Industri Kertas, barang dari 2001 4 668 860 3 388 878 1 279 981 kertas dan sejenisnya 2002 6 550 252 498 055 1 552 198 Manufacture of Paper and 2003 11 336 286 4 935 861 6 400 425 Paper Products 22. Industri penerbitan, perce - 2001 267 809 160 266 107 543
takan dan produksi media 2002 1 164 315 615 859 548 456 rekaman 2003 367 832 212 864 154 968
Printing, publishing, media recording reproduction
23. Industri batu bara, pengola 2001 53 107 38 193 14 914 han minyak bumi dan pe - 2002 82 883 45 577 37 305 ngolahan gas bumi, barang 2003 339 493 161 229 178 264 dari hasil pengilangan mi- nyak bumi dan sejenisnya Coke oven products, refinid petroleum products and other related article Industries
INDUSTRI , PENGGALIAN DAN ENERGI
300 Jawa Barat Dalam Angka 2004/2005
Tabel Table 6.1.2 Lanjutan
[Continued]
Golongan Industri Group of Industry
Tahun Year
Nilai Output Value of
Gross Output
Biaya Input Input Cost
Nilai Tambah (Harga Pasar) Value Added
at Market Prices
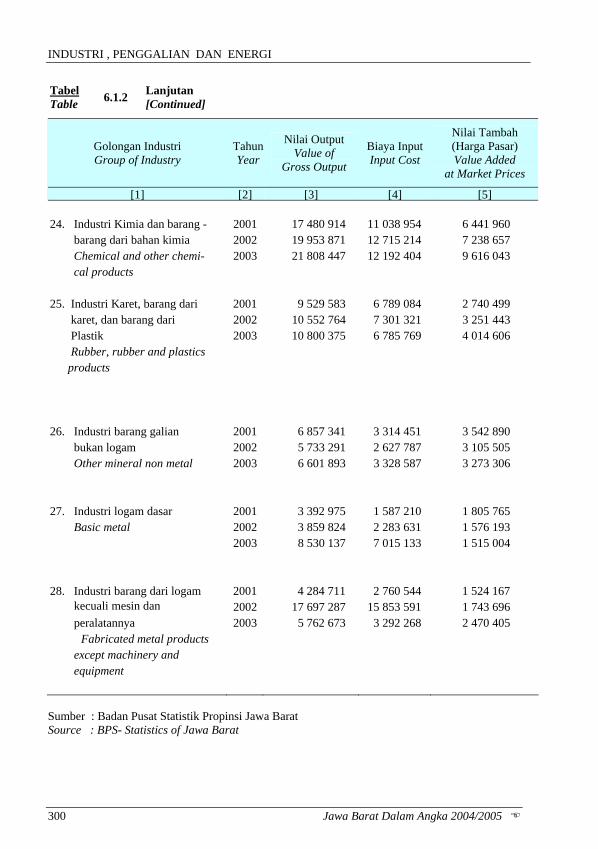
[1] [2] [3] [4] [5] 24. Industri Kimia dan barang - 2001 17 480 914 11 038 954 6 441 960 barang dari bahan kimia 2002 19 953 871 12 715 214 7 238 657 Chemical and other chemi- 2003 21 808 447 12 192 404 9 616 043 cal products 25. Industri Karet, barang dari 2001 9 529 583 6 789 084 2 740 499 karet, dan barang dari 2002 10 552 764 7 301 321 3 251 443 Plastik 2003 10 800 375 6 785 769 4 014 606 Rubber, rubber and plastics products 26. Industri barang galian 2001 6 857 341 3 314 451 3 542 890 bukan logam 2002 5 733 291 2 627 787 3 105 505 Other mineral non metal 2003 6 601 893 3 328 587 3 273 306 27. Industri logam dasar 2001 3 392 975 1 587 210 1 805 765 Basic metal 2002 3 859 824 2 283 631 1 576 193 2003 8 530 137 7 015 133 1 515 004 28. Industri barang dari logam 2001 4 284 711 2 760 544 1 524 167 kecuali mesin dan 2002 17 697 287 15 853 591 1 743 696 peralatannya 2003 5 762 673 3 292 268 2 470 405
Fabricated metal products except machinery and equipment Sumber : Badan Pusat Statistik Propinsi Jawa Barat Source : BPS- Statistics of Jawa Barat
MANUFACTURING, QUARRYING AND ENERGY
Jawa Barat Dalam Angka 2004/2005 301
Tabel Table 6.1.2 Lanjutan
[Continued]
Golongan Industri Group of Industry
Tahun Year
Nilai Output Value of
Gross Output
Biaya Input Input Cost
Nilai Tambah (Harga Pasar) Value Added
at Market Prices
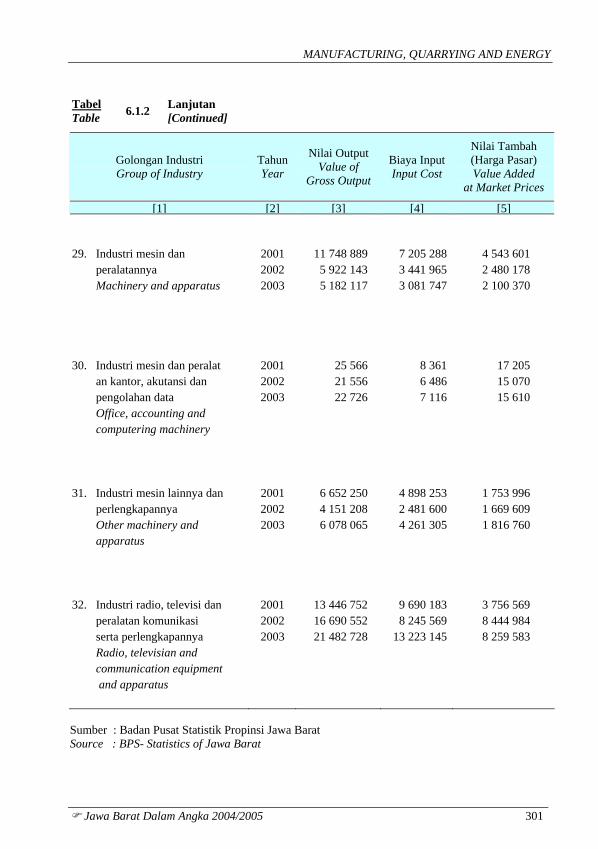
[1] [2] [3] [4] [5] 29. Industri mesin dan 2001 11 748 889 7 205 288 4 543 601 peralatannya 2002 5 922 143 3 441 965 2 480 178 Machinery and apparatus 2003 5 182 117 3 081 747 2 100 370 30. Industri mesin dan peralat 2001 25 566 8 361 17 205 an kantor, akutansi dan 2002 21 556 6 486 15 070 pengolahan data 2003 22 726 7 116 15 610 Office, accounting and computering machinery 31. Industri mesin lainnya dan 2001 6 652 250 4 898 253 1 753 996 perlengkapannya 2002 4 151 208 2 481 600 1 669 609 Other machinery and 2003 6 078 065 4 261 305 1 816 760 apparatus 32. Industri radio, televisi dan 2001 13 446 752 9 690 183 3 756 569 peralatan komunikasi 2002 16 690 552 8 245 569 8 444 984 serta perlengkapannya 2003 21 482 728 13 223 145 8 259 583 Radio, televisian and communication equipment and apparatus Sumber : Badan Pusat Statistik Propinsi Jawa Barat Source : BPS- Statistics of Jawa Barat
INDUSTRI , PENGGALIAN DAN ENERGI
302 Jawa Barat Dalam Angka 2004/2005
Tabel Table 6.1.2 Lanjutan
[Continued]
Golongan Industri Group of Industry
Tahun Year
Nilai Output Value of
Gross Output
Biaya Input Input Cost
Nilai Tambah (Harga Pasar) Value Added
at Market Prices
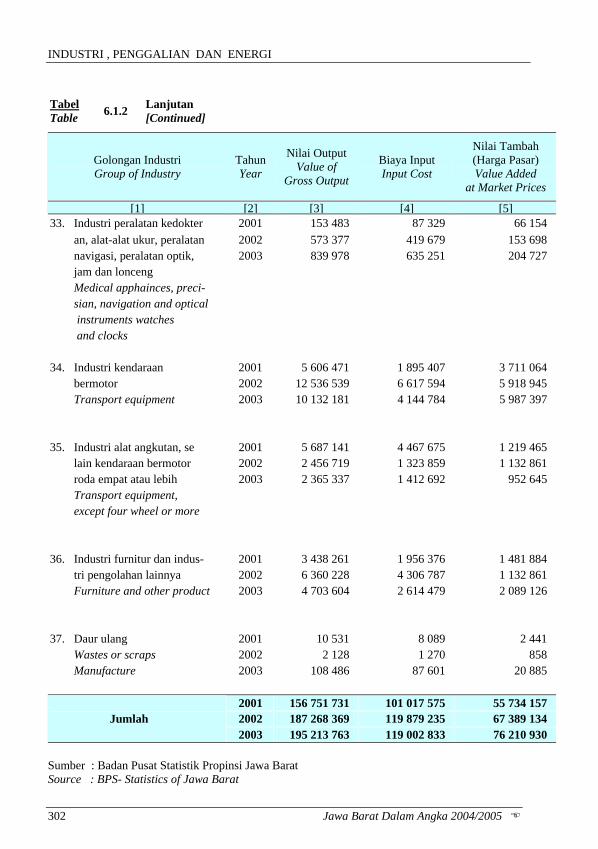
[1] [2] [3] [4] [5]33. Industri peralatan kedokter 2001 153 483 87 329 66 154 an, alat-alat ukur, peralatan 2002 573 377 419 679 153 698 navigasi, peralatan optik, 2003 839 978 635 251 204 727 jam dan lonceng Medical apphainces, preci- sian, navigation and optical instruments watches and clocks 34. Industri kendaraan 2001 5 606 471 1 895 407 3 711 064 bermotor 2002 12 536 539 6 617 594 5 918 945 Transport equipment 2003 10 132 181 4 144 784 5 987 397 35. Industri alat angkutan, se 2001 5 687 141 4 467 675 1 219 465 lain kendaraan bermotor 2002 2 456 719 1 323 859 1 132 861 roda empat atau lebih 2003 2 365 337 1 412 692 952 645 Transport equipment, except four wheel or more 36. Industri furnitur dan indus- 2001 3 438 261 1 956 376 1 481 884 tri pengolahan lainnya 2002 6 360 228 4 306 787 1 132 861 Furniture and other product 2003 4 703 604 2 614 479 2 089 126 37. Daur ulang 2001 10 531 8 089 2 441 Wastes or scraps 2002 2 128 1 270 858 Manufacture 2003 108 486 87 601 20 885
2001 156 751 731 101 017 575 55 734 157 2002 187 268 369 119 879 235 67 389 134 Jumlah 2003 195 213 763 119 002 833 76 210 930
Sumber : Badan Pusat Statistik Propinsi Jawa Barat Source : BPS- Statistics of Jawa Barat
MANUFACTURING, QUARRYING AND ENERGY
Jawa Barat Dalam Angka 2004/2005 303
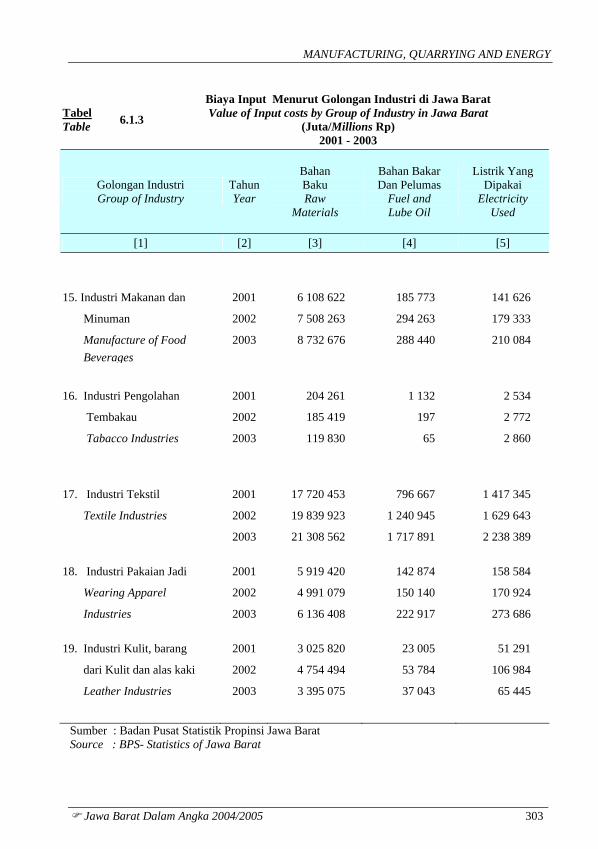
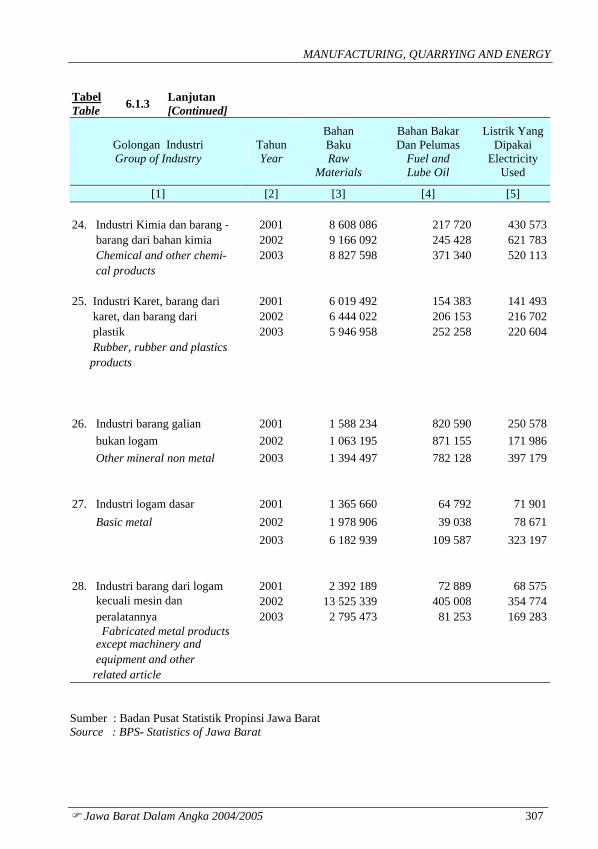
Tabel Table 6.1.3
Biaya Input Menurut Golongan Industri di Jawa Barat Value of Input costs by Group of Industry in Jawa Barat
(Juta/Millions Rp) 2001 - 2003
Golongan Industri Group of Industry
Tahun Year
Bahan Baku Raw
Materials
Bahan Bakar Dan Pelumas
Fuel and Lube Oil
Listrik Yang Dipakai
Electricity Used
[1] [2] [3] [4] [5]
15. Industri Makanan dan 2001 6 108 622 185 773 141 626
Minuman 2002 7 508 263 294 263 179 333
Manufacture of Food 2003 8 732 676 288 440 210 084 Beverages
16. Industri Pengolahan 2001 204 261 1 132 2 534
Tembakau 2002 185 419 197 2 772
Tabacco Industries 2003 119 830 65 2 860
17. Industri Tekstil 2001 17 720 453 796 667 1 417 345
Textile Industries 2002 19 839 923 1 240 945 1 629 643
2003 21 308 562 1 717 891 2 238 389 18. Industri Pakaian Jadi 2001 5 919 420 142 874 158 584
Wearing Apparel 2002 4 991 079 150 140 170 924
Industries 2003 6 136 408 222 917 273 686 19. Industri Kulit, barang 2001 3 025 820 23 005 51 291
dari Kulit dan alas kaki 2002 4 754 494 53 784 106 984
Leather Industries 2003 3 395 075 37 043 65 445
Sumber : Badan Pusat Statistik Propinsi Jawa Barat Source : BPS- Statistics of Jawa Barat
INDUSTRI , PENGGALIAN DAN ENERGI
304 Jawa Barat Dalam Angka 2004/2005
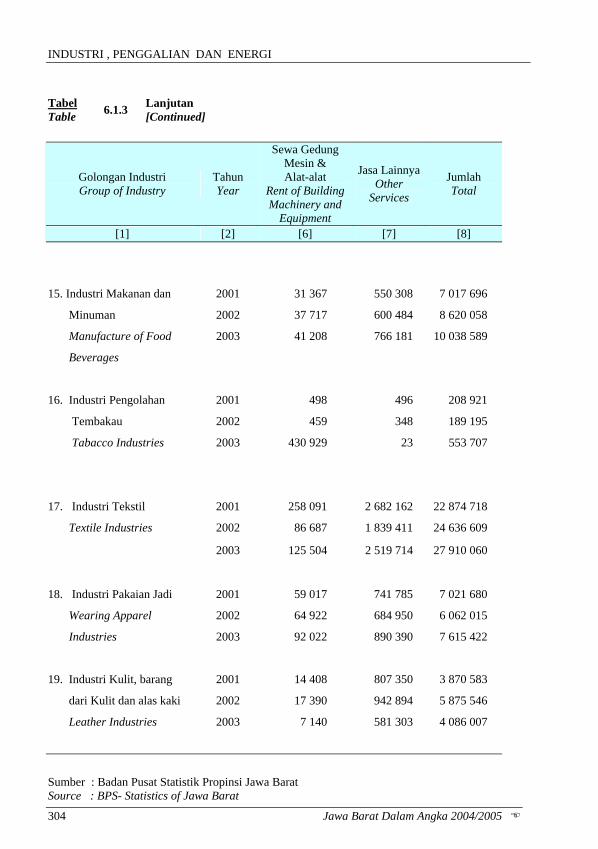
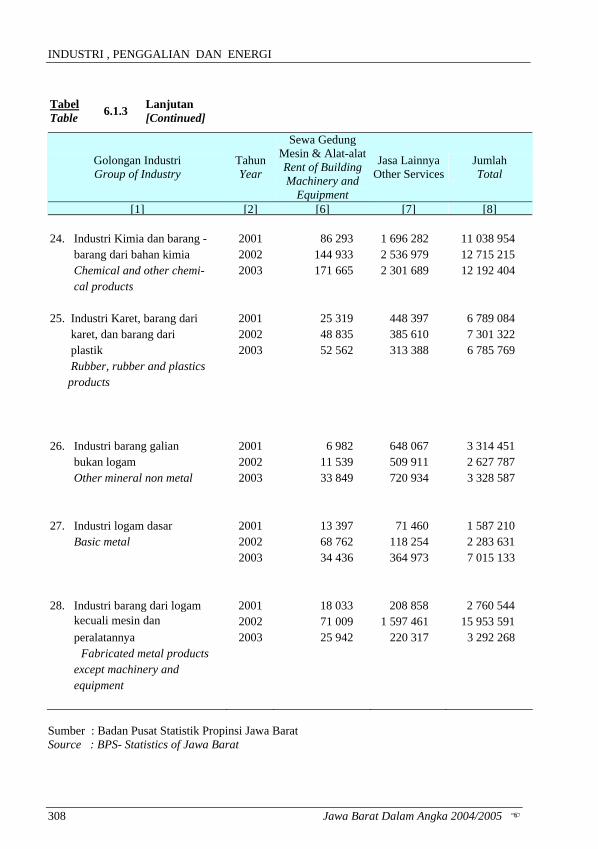
Tabel Table 6.1.3 Lanjutan
[Continued]
Golongan Industri Group of Industry
Tahun Year
Sewa Gedung Mesin & Alat-alat
Rent of Building Machinery and
Equipment
Jasa LainnyaOther
Services
Jumlah Total
[1] [2] [6] [7] [8]
15. Industri Makanan dan 2001 31 367 550 308 7 017 696
Minuman 2002 37 717 600 484 8 620 058
Manufacture of Food 2003 41 208 766 181 10 038 589
Beverages
16. Industri Pengolahan 2001 498 496 208 921
Tembakau 2002 459 348 189 195
Tabacco Industries 2003 430 929 23 553 707
17. Industri Tekstil 2001 258 091 2 682 162 22 874 718
Textile Industries 2002 86 687 1 839 411 24 636 609
2003 125 504 2 519 714 27 910 060
18. Industri Pakaian Jadi 2001 59 017 741 785 7 021 680
Wearing Apparel 2002 64 922 684 950 6 062 015
Industries 2003 92 022 890 390 7 615 422
19. Industri Kulit, barang 2001 14 408 807 350 3 870 583
dari Kulit dan alas kaki 2002 17 390 942 894 5 875 546
Leather Industries 2003 7 140 581 303 4 086 007
Sumber : Badan Pusat Statistik Propinsi Jawa Barat Source : BPS- Statistics of Jawa Barat
MANUFACTURING, QUARRYING AND ENERGY
Jawa Barat Dalam Angka 2004/2005 305
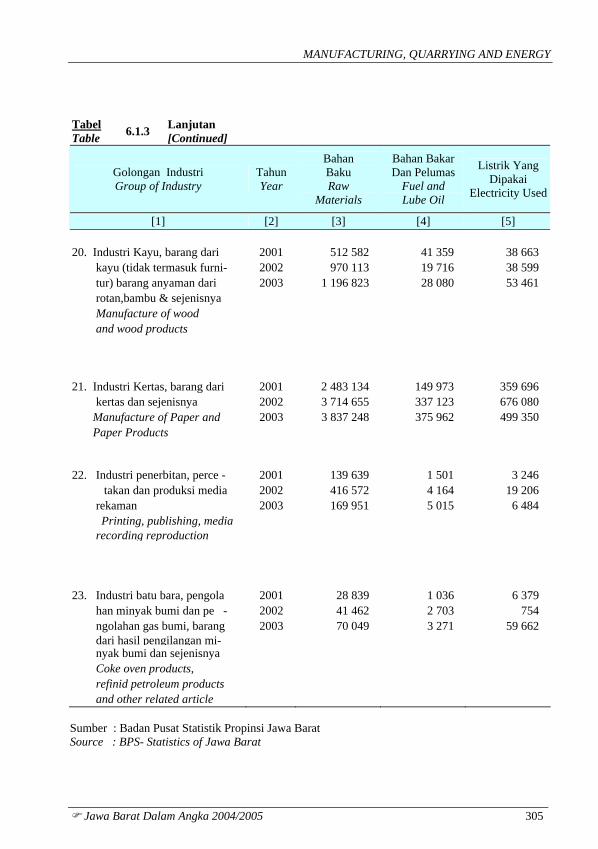
Tabel Table 6.1.3 Lanjutan
[Continued]
Golongan Industri Group of Industry
Tahun Year
Bahan Baku Raw
Materials
Bahan Bakar Dan Pelumas
Fuel and Lube Oil
Listrik Yang Dipakai
Electricity Used
[1] [2] [3] [4] [5] 20. Industri Kayu, barang dari 2001 512 582 41 359 38 663 kayu (tidak termasuk furni- 2002 970 113 19 716 38 599 tur) barang anyaman dari 2003 1 196 823 28 080 53 461 rotan,bambu & sejenisnya Manufacture of wood and wood products 21. Industri Kertas, barang dari 2001 2 483 134 149 973 359 696 kertas dan sejenisnya 2002 3 714 655 337 123 676 080 Manufacture of Paper and 2003 3 837 248 375 962 499 350 Paper Products 22. Industri penerbitan, perce - 2001 139 639 1 501 3 246
takan dan produksi media 2002 416 572 4 164 19 206 rekaman 2003 169 951 5 015 6 484
Printing, publishing, media recording reproduction
23. Industri batu bara, pengola 2001 28 839 1 036 6 379 han minyak bumi dan pe - 2002 41 462 2 703 754 ngolahan gas bumi, barang 2003 70 049 3 271 59 662 dari hasil pengilangan mi- nyak bumi dan sejenisnya Coke oven products, refinid petroleum products and other related article Sumber : Badan Pusat Statistik Propinsi Jawa Barat Source : BPS- Statistics of Jawa Barat
INDUSTRI , PENGGALIAN DAN ENERGI
306 Jawa Barat Dalam Angka 2004/2005
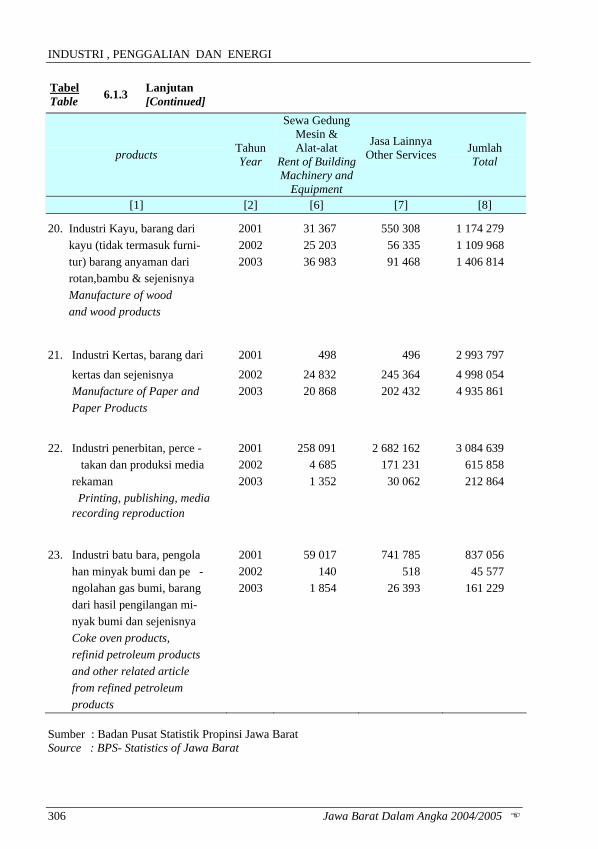
Tabel Table 6.1.3 Lanjutan
[Continued]
products Tahun Year
Sewa Gedung Mesin & Alat-alat
Rent of BuildingMachinery and
Equipment
Jasa Lainnya Other Services
Jumlah Total
[1] [2] [6] [7] [8]
20. Industri Kayu, barang dari 2001 31 367 550 308 1 174 279 kayu (tidak termasuk furni- 2002 25 203 56 335 1 109 968 tur) barang anyaman dari 2003 36 983 91 468 1 406 814 rotan,bambu & sejenisnya Manufacture of wood and wood products
21. Industri Kertas, barang dari 2001 498 496 2 993 797
kertas dan sejenisnya 2002 24 832 245 364 4 998 054 Manufacture of Paper and 2003 20 868 202 432 4 935 861 Paper Products
22. Industri penerbitan, perce - 2001 258 091 2 682 162 3 084 639
takan dan produksi media 2002 4 685 171 231 615 858 rekaman 2003 1 352 30 062 212 864
Printing, publishing, media recording reproduction
23. Industri batu bara, pengola 2001 59 017 741 785 837 056 han minyak bumi dan pe - 2002 140 518 45 577 ngolahan gas bumi, barang 2003 1 854 26 393 161 229 dari hasil pengilangan mi- nyak bumi dan sejenisnya Coke oven products, refinid petroleum products and other related article from refined petroleum products Sumber : Badan Pusat Statistik Propinsi Jawa Barat Source : BPS- Statistics of Jawa Barat
MANUFACTURING, QUARRYING AND ENERGY
Jawa Barat Dalam Angka 2004/2005 307
Tabel Table 6.1.3 Lanjutan
[Continued]
Golongan Industri Group of Industry
Tahun Year
Bahan Baku Raw
Materials
Bahan Bakar Dan Pelumas
Fuel and Lube Oil
Listrik Yang Dipakai
Electricity Used
[1] [2] [3] [4] [5] 24. Industri Kimia dan barang - 2001 8 608 086 217 720 430 573 barang dari bahan kimia 2002 9 166 092 245 428 621 783 Chemical and other chemi- 2003 8 827 598 371 340 520 113 cal products 25. Industri Karet, barang dari 2001 6 019 492 154 383 141 493 karet, dan barang dari 2002 6 444 022 206 153 216 702 plastik 2003 5 946 958 252 258 220 604 Rubber, rubber and plastics products 26. Industri barang galian 2001 1 588 234 820 590 250 578 bukan logam 2002 1 063 195 871 155 171 986 Other mineral non metal 2003 1 394 497 782 128 397 179 27. Industri logam dasar 2001 1 365 660 64 792 71 901 Basic metal 2002 1 978 906 39 038 78 671 2003 6 182 939 109 587 323 197 28. Industri barang dari logam 2001 2 392 189 72 889 68 575 kecuali mesin dan 2002 13 525 339 405 008 354 774 peralatannya 2003 2 795 473 81 253 169 283
Fabricated metal products except machinery and equipment and other related article Sumber : Badan Pusat Statistik Propinsi Jawa Barat Source : BPS- Statistics of Jawa Barat
INDUSTRI , PENGGALIAN DAN ENERGI
308 Jawa Barat Dalam Angka 2004/2005
Tabel Table 6.1.3 Lanjutan
[Continued]
Golongan Industri Group of Industry
Tahun Year
Sewa Gedung Mesin & Alat-alatRent of Building Machinery and
Equipment
Jasa Lainnya Other Services
Jumlah Total
[1] [2] [6] [7] [8] 24. Industri Kimia dan barang - 2001 86 293 1 696 282 11 038 954 barang dari bahan kimia 2002 144 933 2 536 979 12 715 215 Chemical and other chemi- 2003 171 665 2 301 689 12 192 404 cal products 25. Industri Karet, barang dari 2001 25 319 448 397 6 789 084 karet, dan barang dari 2002 48 835 385 610 7 301 322 plastik 2003 52 562 313 388 6 785 769 Rubber, rubber and plastics products 26. Industri barang galian 2001 6 982 648 067 3 314 451 bukan logam 2002 11 539 509 911 2 627 787 Other mineral non metal 2003 33 849 720 934 3 328 587 27. Industri logam dasar 2001 13 397 71 460 1 587 210 Basic metal 2002 68 762 118 254 2 283 631 2003 34 436 364 973 7 015 133 28. Industri barang dari logam 2001 18 033 208 858 2 760 544 kecuali mesin dan 2002 71 009 1 597 461 15 953 591 peralatannya 2003 25 942 220 317 3 292 268
Fabricated metal products except machinery and equipment Sumber : Badan Pusat Statistik Propinsi Jawa Barat Source : BPS- Statistics of Jawa Barat
MANUFACTURING, QUARRYING AND ENERGY
Jawa Barat Dalam Angka 2004/2005 309
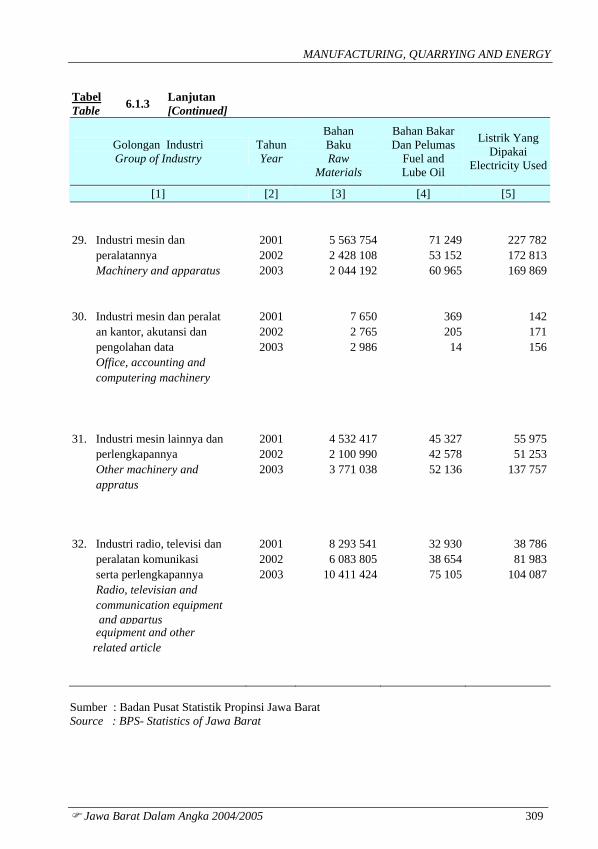
Tabel Table 6.1.3 Lanjutan
[Continued]
Golongan Industri Group of Industry
Tahun Year
Bahan Baku Raw
Materials
Bahan Bakar Dan Pelumas
Fuel and Lube Oil
Listrik Yang Dipakai
Electricity Used
[1] [2] [3] [4] [5] 29. Industri mesin dan 2001 5 563 754 71 249 227 782 peralatannya 2002 2 428 108 53 152 172 813 Machinery and apparatus 2003 2 044 192 60 965 169 869 30. Industri mesin dan peralat 2001 7 650 369 142 an kantor, akutansi dan 2002 2 765 205 171 pengolahan data 2003 2 986 14 156 Office, accounting and computering machinery 31. Industri mesin lainnya dan 2001 4 532 417 45 327 55 975 perlengkapannya 2002 2 100 990 42 578 51 253 Other machinery and 2003 3 771 038 52 136 137 757 appratus 32. Industri radio, televisi dan 2001 8 293 541 32 930 38 786 peralatan komunikasi 2002 6 083 805 38 654 81 983 serta perlengkapannya 2003 10 411 424 75 105 104 087 Radio, televisian and communication equipment and appartus equipment and other related article Sumber : Badan Pusat Statistik Propinsi Jawa Barat Source : BPS- Statistics of Jawa Barat
INDUSTRI , PENGGALIAN DAN ENERGI
310 Jawa Barat Dalam Angka 2004/2005
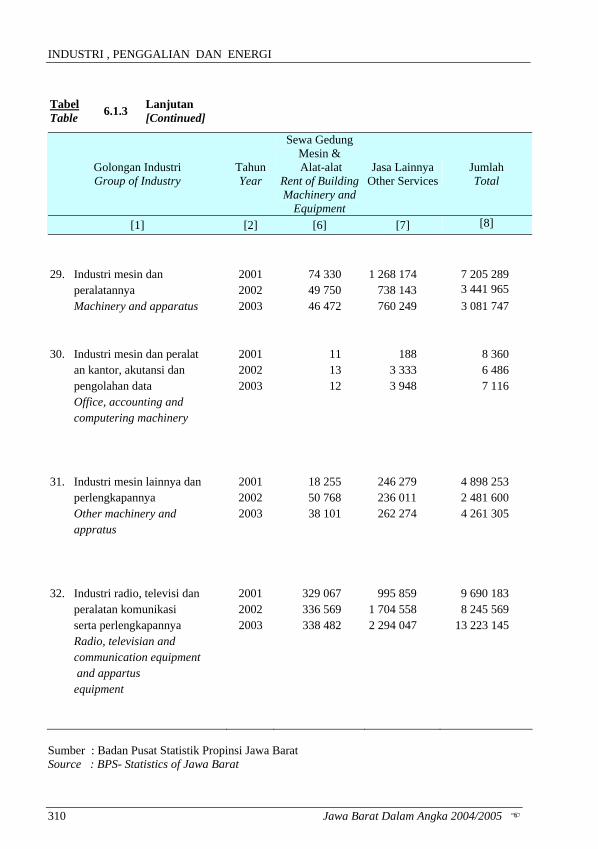
Tabel Table 6.1.3 Lanjutan
[Continued]
Golongan Industri Group of Industry
Tahun Year
Sewa Gedung Mesin & Alat-alat
Rent of Building Machinery and
Equipment
Jasa Lainnya Other Services
Jumlah Total
[1] [2] [6] [7] [8]
29. Industri mesin dan 2001 74 330 1 268 174 7 205 289 peralatannya 2002 49 750 738 143 3 441 965 Machinery and apparatus 2003 46 472 760 249 3 081 747 30. Industri mesin dan peralat 2001 11 188 8 360 an kantor, akutansi dan 2002 13 3 333 6 486 pengolahan data 2003 12 3 948 7 116 Office, accounting and computering machinery 31. Industri mesin lainnya dan 2001 18 255 246 279 4 898 253 perlengkapannya 2002 50 768 236 011 2 481 600 Other machinery and 2003 38 101 262 274 4 261 305 appratus 32. Industri radio, televisi dan 2001 329 067 995 859 9 690 183 peralatan komunikasi 2002 336 569 1 704 558 8 245 569 serta perlengkapannya 2003 338 482 2 294 047 13 223 145 Radio, televisian and communication equipment and appartus equipment Sumber : Badan Pusat Statistik Propinsi Jawa Barat Source : BPS- Statistics of Jawa Barat
MANUFACTURING, QUARRYING AND ENERGY
Jawa Barat Dalam Angka 2004/2005 311
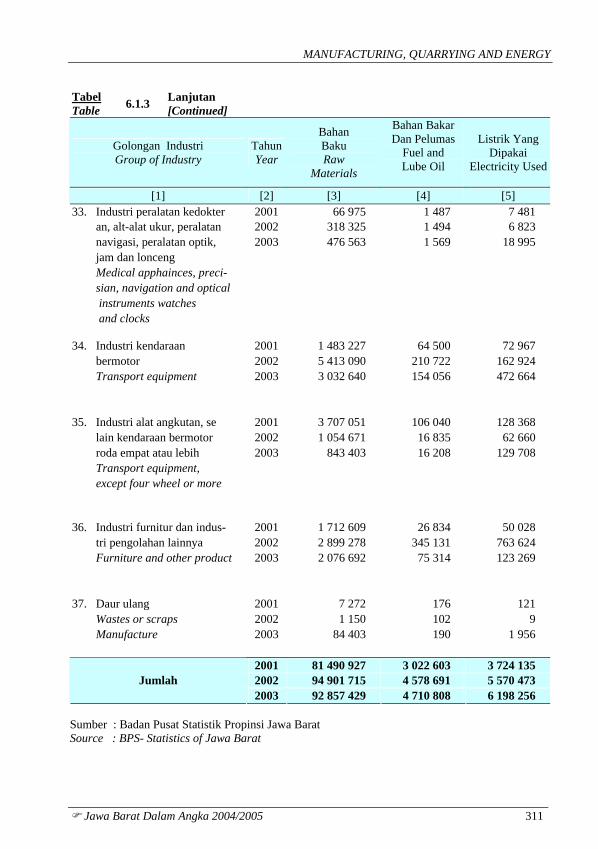
Tabel Table 6.1.3 Lanjutan
[Continued]
Golongan Industri Group of Industry
TahunYear
Bahan Baku Raw
Materials
Bahan Bakar Dan Pelumas
Fuel and Lube Oil
Listrik Yang Dipakai
Electricity Used
[1] [2] [3] [4] [5] 33. Industri peralatan kedokter 2001 66 975 1 487 7 481 an, alt-alat ukur, peralatan 2002 318 325 1 494 6 823 navigasi, peralatan optik, 2003 476 563 1 569 18 995 jam dan lonceng Medical apphainces, preci- sian, navigation and optical instruments watches and clocks 34. Industri kendaraan 2001 1 483 227 64 500 72 967 bermotor 2002 5 413 090 210 722 162 924 Transport equipment 2003 3 032 640 154 056 472 664 35. Industri alat angkutan, se 2001 3 707 051 106 040 128 368 lain kendaraan bermotor 2002 1 054 671 16 835 62 660 roda empat atau lebih 2003 843 403 16 208 129 708 Transport equipment, except four wheel or more 36. Industri furnitur dan indus- 2001 1 712 609 26 834 50 028 tri pengolahan lainnya 2002 2 899 278 345 131 763 624 Furniture and other product 2003 2 076 692 75 314 123 269 37. Daur ulang 2001 7 272 176 121 Wastes or scraps 2002 1 150 102 9 Manufacture 2003 84 403 190 1 956
2001 81 490 927 3 022 603 3 724 135 2002 94 901 715 4 578 691 5 570 473 Jumlah 2003 92 857 429 4 710 808 6 198 256
Sumber : Badan Pusat Statistik Propinsi Jawa Barat Source : BPS- Statistics of Jawa Barat
INDUSTRI , PENGGALIAN DAN ENERGI
312 Jawa Barat Dalam Angka 2004/2005
Tabel Table 6.1.3 Lanjutan
[Continued]
Golongan Industri Group of Industry
Tahun Year
Sewa Gedung Mesin & Alat-alat
Rent of BuildingMachinery and
Equipment
Jasa Lainnya Other Services
Jumlah Total
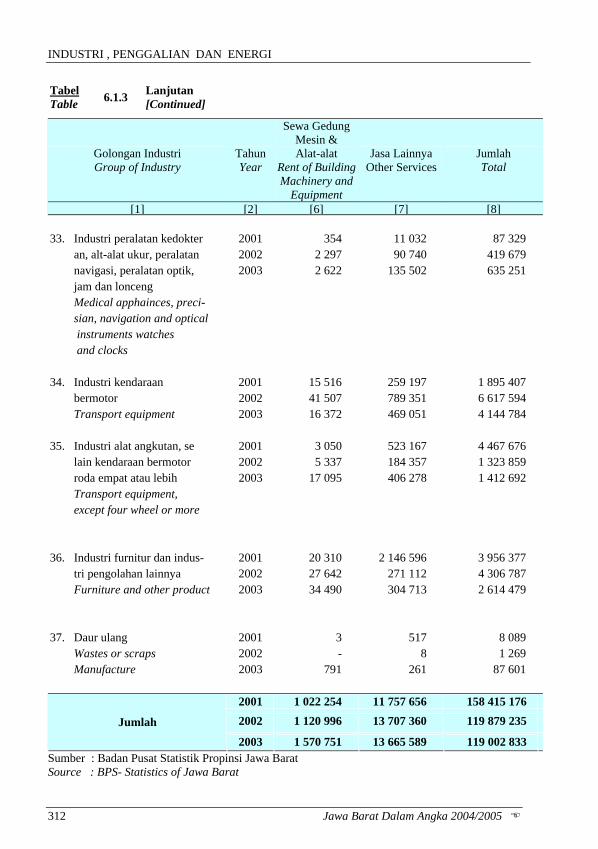
[1] [2] [6] [7] [8] 33. Industri peralatan kedokter 2001 354 11 032 87 329 an, alt-alat ukur, peralatan 2002 2 297 90 740 419 679 navigasi, peralatan optik, 2003 2 622 135 502 635 251 jam dan lonceng Medical apphainces, preci- sian, navigation and optical instruments watches and clocks 34. Industri kendaraan 2001 15 516 259 197 1 895 407 bermotor 2002 41 507 789 351 6 617 594 Transport equipment 2003 16 372 469 051 4 144 784 35. Industri alat angkutan, se 2001 3 050 523 167 4 467 676 lain kendaraan bermotor 2002 5 337 184 357 1 323 859 roda empat atau lebih 2003 17 095 406 278 1 412 692 Transport equipment, except four wheel or more 36. Industri furnitur dan indus- 2001 20 310 2 146 596 3 956 377 tri pengolahan lainnya 2002 27 642 271 112 4 306 787 Furniture and other product 2003 34 490 304 713 2 614 479 37. Daur ulang 2001 3 517 8 089 Wastes or scraps 2002 - 8 1 269 Manufacture 2003 791 261 87 601
2001 1 022 254 11 757 656 158 415 176 2002 1 120 996 13 707 360 119 879 235 Jumlah
2003 1 570 751 13 665 589 119 002 833 Sumber : Badan Pusat Statistik Propinsi Jawa Barat Source : BPS- Statistics of Jawa Barat
MANUFACTURING, QUARRYING AND ENERGY
Jawa Barat Dalam Angka 2004/2005 313
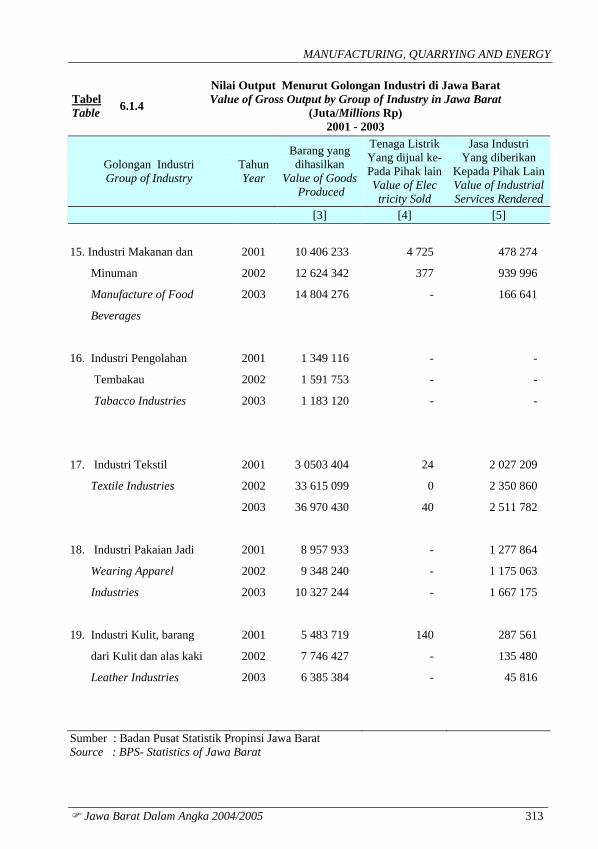
Tabel Table 6.1.4
Nilai Output Menurut Golongan Industri di Jawa Barat Value of Gross Output by Group of Industry in Jawa Barat
(Juta/Millions Rp) 2001 - 2003
Golongan Industri Group of Industry
Tahun Year
Barang yang dihasilkan
Value of Goods Produced
Tenaga Listrik Yang dijual ke-Pada Pihak lainValue of Elec tricity Sold
Jasa Industri Yang diberikan
Kepada Pihak Lain Value of Industrial Services Rendered
[3] [4] [5] 15. Industri Makanan dan 2001 10 406 233 4 725 478 274
Minuman 2002 12 624 342 377 939 996
Manufacture of Food 2003 14 804 276 - 166 641
Beverages
16. Industri Pengolahan 2001 1 349 116 - -
Tembakau 2002 1 591 753 - -
Tabacco Industries 2003 1 183 120 - -
17. Industri Tekstil 2001 3 0503 404 24 2 027 209
Textile Industries 2002 33 615 099 0 2 350 860
2003 36 970 430 40 2 511 782
18. Industri Pakaian Jadi 2001 8 957 933 - 1 277 864
Wearing Apparel 2002 9 348 240 - 1 175 063
Industries 2003 10 327 244 - 1 667 175
19. Industri Kulit, barang 2001 5 483 719 140 287 561
dari Kulit dan alas kaki 2002 7 746 427 - 135 480
Leather Industries 2003 6 385 384 - 45 816
Sumber : Badan Pusat Statistik Propinsi Jawa Barat Source : BPS- Statistics of Jawa Barat
INDUSTRI , PENGGALIAN DAN ENERGI
314 Jawa Barat Dalam Angka 2004/2005
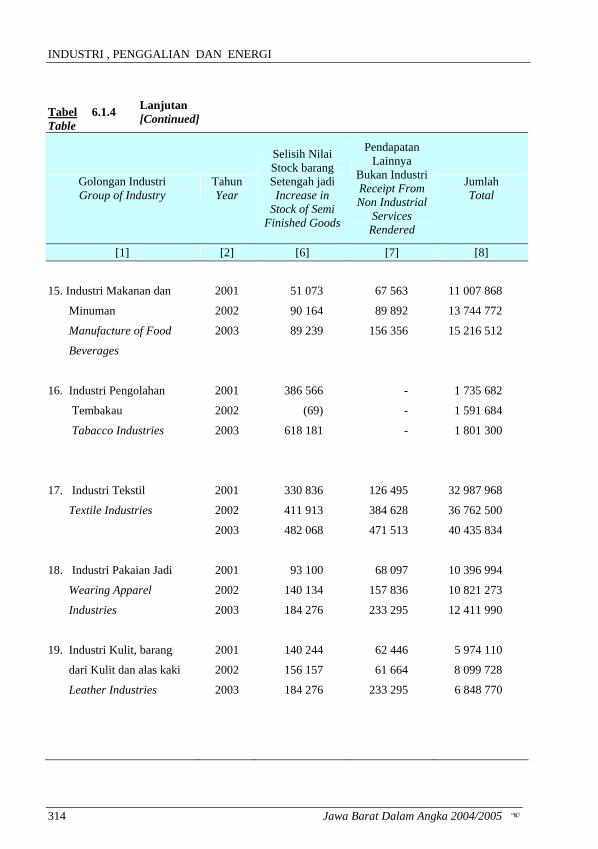
Tabel Table
6.1.4 Lanjutan [Continued]
Golongan Industri Group of Industry
Tahun Year
Selisih Nilai Stock barang Setengah jadi Increase in
Stock of Semi Finished Goods
Pendapatan Lainnya
Bukan Industri Receipt From Non Industrial
Services Rendered
Jumlah Total
[1] [2] [6] [7] [8]
15. Industri Makanan dan 2001 51 073 67 563 11 007 868
Minuman 2002 90 164 89 892 13 744 772
Manufacture of Food 2003 89 239 156 356 15 216 512
Beverages
16. Industri Pengolahan 2001 386 566 - 1 735 682
Tembakau 2002 (69) - 1 591 684
Tabacco Industries 2003 618 181 - 1 801 300
17. Industri Tekstil 2001 330 836 126 495 32 987 968
Textile Industries 2002 411 913 384 628 36 762 500
2003 482 068 471 513 40 435 834
18. Industri Pakaian Jadi 2001 93 100 68 097 10 396 994
Wearing Apparel 2002 140 134 157 836 10 821 273
Industries 2003 184 276 233 295 12 411 990
19. Industri Kulit, barang 2001 140 244 62 446 5 974 110
dari Kulit dan alas kaki 2002 156 157 61 664 8 099 728
Leather Industries 2003 184 276 233 295 6 848 770
MANUFACTURING, QUARRYING AND ENERGY
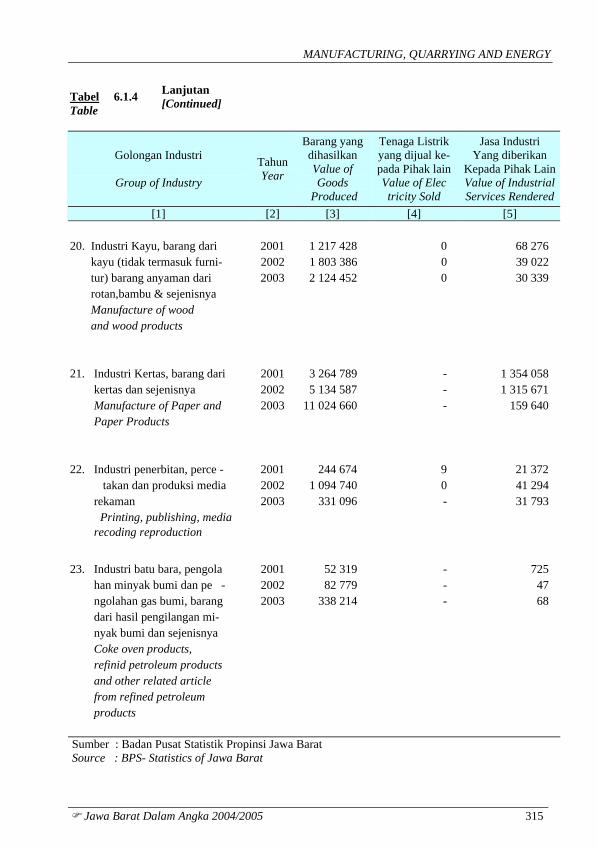
Jawa Barat Dalam Angka 2004/2005 315
Tabel Table
6.1.4 Lanjutan [Continued]
Golongan Industri
Group of Industry
Tahun Year
Barang yang dihasilkan Value of Goods
Produced
Tenaga Listrik yang dijual ke- pada Pihak lain Value of Elec tricity Sold
Jasa Industri Yang diberikan
Kepada Pihak LainValue of IndustrialServices Rendered
[1] [2] [3] [4] [5] 20. Industri Kayu, barang dari 2001 1 217 428 0 68 276 kayu (tidak termasuk furni- 2002 1 803 386 0 39 022 tur) barang anyaman dari 2003 2 124 452 0 30 339 rotan,bambu & sejenisnya Manufacture of wood and wood products 21. Industri Kertas, barang dari 2001 3 264 789 - 1 354 058 kertas dan sejenisnya 2002 5 134 587 - 1 315 671 Manufacture of Paper and 2003 11 024 660 - 159 640 Paper Products 22. Industri penerbitan, perce - 2001 244 674 9 21 372
takan dan produksi media 2002 1 094 740 0 41 294 rekaman 2003 331 096 - 31 793
Printing, publishing, media recoding reproduction
23. Industri batu bara, pengola 2001 52 319 - 725 han minyak bumi dan pe - 2002 82 779 - 47 ngolahan gas bumi, barang 2003 338 214 - 68 dari hasil pengilangan mi- nyak bumi dan sejenisnya Coke oven products, refinid petroleum products and other related article from refined petroleum products Sumber : Badan Pusat Statistik Propinsi Jawa Barat Source : BPS- Statistics of Jawa Barat
INDUSTRI , PENGGALIAN DAN ENERGI
316 Jawa Barat Dalam Angka 2004/2005
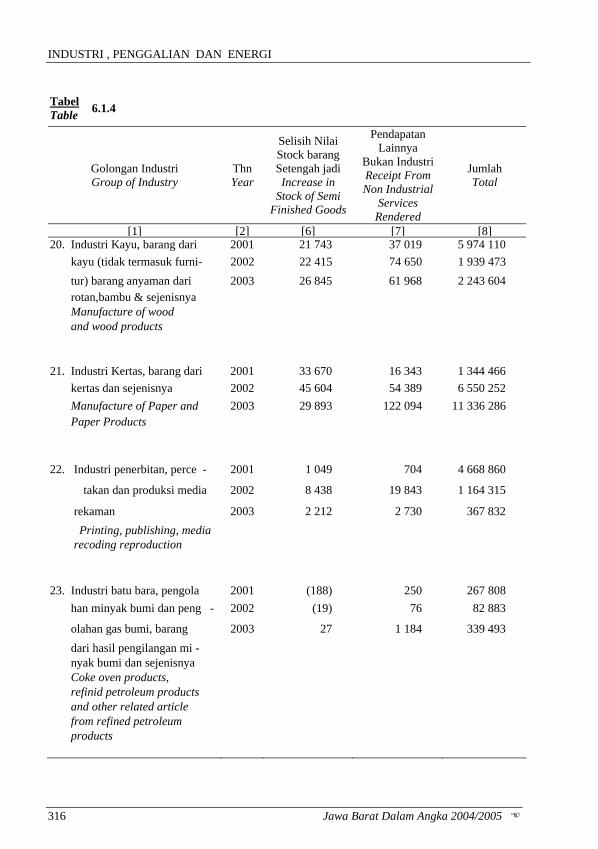
Tabel Table 6.1.4
Golongan Industri Group of Industry
Thn Year
Selisih Nilai Stock barang Setengah jadi Increase in
Stock of Semi Finished Goods
Pendapatan Lainnya
Bukan Industri Receipt From Non Industrial
Services Rendered
Jumlah Total
[1] [2] [6] [7] [8]20. Industri Kayu, barang dari 2001 21 743 37 019 5 974 110 kayu (tidak termasuk furni- 2002 22 415 74 650 1 939 473 tur) barang anyaman dari 2003 26 845 61 968 2 243 604 rotan,bambu & sejenisnya Manufacture of wood and wood products 21. Industri Kertas, barang dari 2001 33 670 16 343 1 344 466 kertas dan sejenisnya 2002 45 604 54 389 6 550 252 Manufacture of Paper and 2003 29 893 122 094 11 336 286 Paper Products 22. Industri penerbitan, perce - 2001 1 049 704 4 668 860
takan dan produksi media 2002 8 438 19 843 1 164 315
rekaman 2003 2 212 2 730 367 832 Printing, publishing, media
recoding reproduction
23. Industri batu bara, pengola 2001 (188) 250 267 808 han minyak bumi dan peng - 2002 (19) 76 82 883
olahan gas bumi, barang 2003 27 1 184 339 493 dari hasil pengilangan mi - nyak bumi dan sejenisnya Coke oven products, refinid petroleum products and other related article from refined petroleum products
MANUFACTURING, QUARRYING AND ENERGY
Jawa Barat Dalam Angka 2004/2005 317
Tabel Table 6.1.4 Lanjutan
[Continued]
Golongan Industri
Group of Industry
Tahun Year
Barang yang dihasilkan
Value of Goods Produced
Tenaga Listrikyang dijual ke-pada Pihak lainValue of Elec tricity Sold
Jasa Industri Yang diberikan
Kepada Pihak LainValue of IndustrialServices Rendered
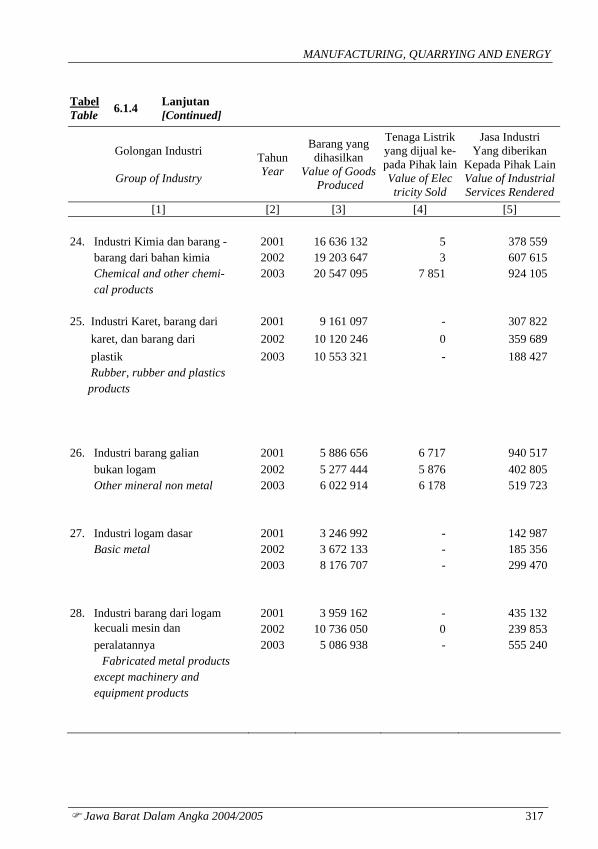
[1] [2] [3] [4] [5] 24. Industri Kimia dan barang - 2001 16 636 132 5 378 559 barang dari bahan kimia 2002 19 203 647 3 607 615 Chemical and other chemi- 2003 20 547 095 7 851 924 105 cal products 25. Industri Karet, barang dari 2001 9 161 097 - 307 822 karet, dan barang dari 2002 10 120 246 0 359 689 plastik 2003 10 553 321 - 188 427 Rubber, rubber and plastics products 26. Industri barang galian 2001 5 886 656 6 717 940 517 bukan logam 2002 5 277 444 5 876 402 805 Other mineral non metal 2003 6 022 914 6 178 519 723 27. Industri logam dasar 2001 3 246 992 - 142 987 Basic metal 2002 3 672 133 - 185 356 2003 8 176 707 - 299 470 28. Industri barang dari logam 2001 3 959 162 - 435 132 kecuali mesin dan 2002 10 736 050 0 239 853 peralatannya 2003 5 086 938 - 555 240
Fabricated metal products except machinery and equipment products
INDUSTRI , PENGGALIAN DAN ENERGI
318 Jawa Barat Dalam Angka 2004/2005
Tabel Table 6.1.4 Lanjutan
[Continued]
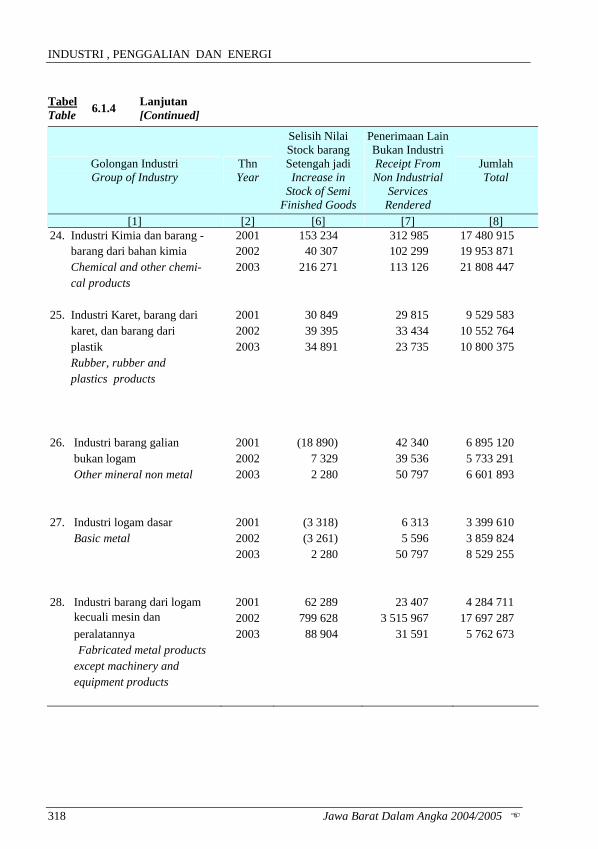
Golongan Industri Group of Industry
Thn Year
Selisih Nilai Stock barang Setengah jadi Increase in
Stock of Semi Finished Goods
Penerimaan Lain Bukan Industri Receipt From Non Industrial
Services Rendered
Jumlah Total
[1] [2] [6] [7] [8]24. Industri Kimia dan barang - 2001 153 234 312 985 17 480 915 barang dari bahan kimia 2002 40 307 102 299 19 953 871 Chemical and other chemi- 2003 216 271 113 126 21 808 447 cal products 25. Industri Karet, barang dari 2001 30 849 29 815 9 529 583 karet, dan barang dari 2002 39 395 33 434 10 552 764 plastik 2003 34 891 23 735 10 800 375 Rubber, rubber and plastics products 26. Industri barang galian 2001 (18 890) 42 340 6 895 120 bukan logam 2002 7 329 39 536 5 733 291 Other mineral non metal 2003 2 280 50 797 6 601 893 27. Industri logam dasar 2001 (3 318) 6 313 3 399 610 Basic metal 2002 (3 261) 5 596 3 859 824 2003 2 280 50 797 8 529 255 28. Industri barang dari logam 2001 62 289 23 407 4 284 711 kecuali mesin dan 2002 799 628 3 515 967 17 697 287 peralatannya 2003 88 904 31 591 5 762 673
Fabricated metal products except machinery and equipment products
MANUFACTURING, QUARRYING AND ENERGY
Jawa Barat Dalam Angka 2004/2005 319
Tabel Table 6.1.4 Lanjutan
[Continued]
Golongan Industri Group of Industry
Tahun Year
Barang yang Dihasilkan
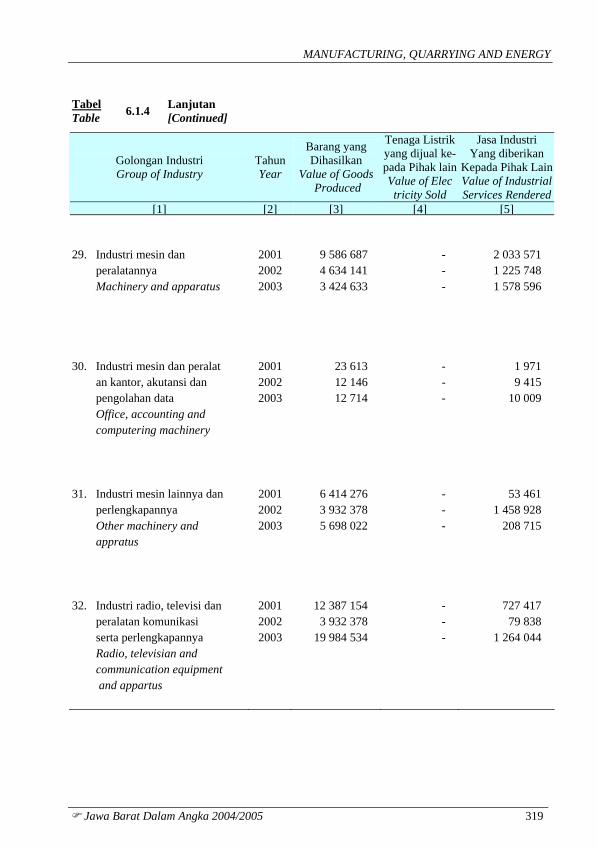
Value of Goods Produced
Tenaga Listrikyang dijual ke-pada Pihak lainValue of Elec tricity Sold
Jasa Industri Yang diberikan
Kepada Pihak LainValue of IndustrialServices Rendered
[1] [2] [3] [4] [5] 29. Industri mesin dan 2001 9 586 687 - 2 033 571 peralatannya 2002 4 634 141 - 1 225 748 Machinery and apparatus 2003 3 424 633 - 1 578 596 30. Industri mesin dan peralat 2001 23 613 - 1 971 an kantor, akutansi dan 2002 12 146 - 9 415 pengolahan data 2003 12 714 - 10 009 Office, accounting and computering machinery 31. Industri mesin lainnya dan 2001 6 414 276 - 53 461 perlengkapannya 2002 3 932 378 - 1 458 928 Other machinery and 2003 5 698 022 - 208 715 appratus 32. Industri radio, televisi dan 2001 12 387 154 - 727 417 peralatan komunikasi 2002 3 932 378 - 79 838 serta perlengkapannya 2003 19 984 534 - 1 264 044 Radio, televisian and communication equipment and appartus
INDUSTRI , PENGGALIAN DAN ENERGI
320 Jawa Barat Dalam Angka 2004/2005
Tabel Table 6.1.4 Lanjutan
[Continued]
Golongan Industri Group of Industry
Thn Year
Selisih Nilai Stock barang Setengah jadi Increase in
Stock of Semi Finished Goods
Penerimaan Lain Bukan Industri
Receipt From Non Industrial Services
Rendered
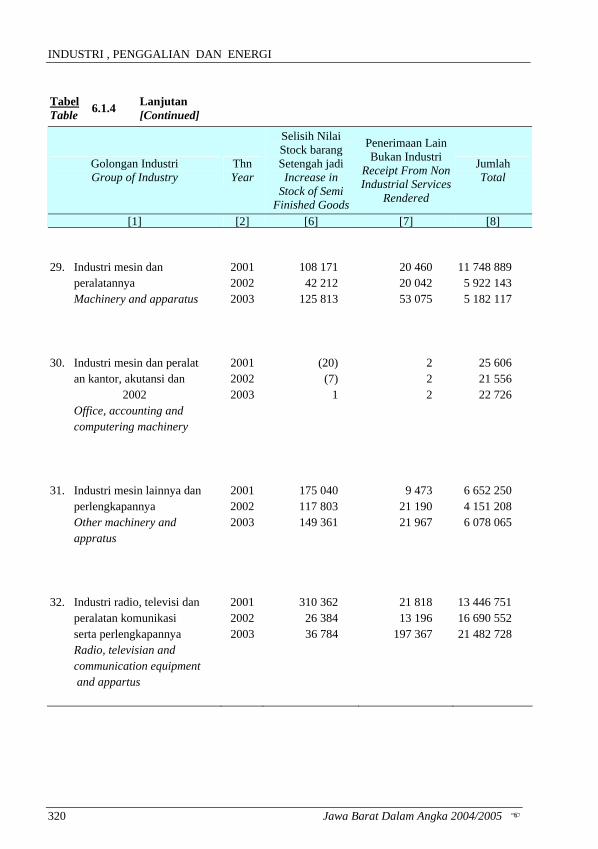
Jumlah Total
[1] [2] [6] [7] [8] 29. Industri mesin dan 2001 108 171 20 460 11 748 889 peralatannya 2002 42 212 20 042 5 922 143 Machinery and apparatus 2003 125 813 53 075 5 182 117 30. Industri mesin dan peralat 2001 (20) 2 25 606 an kantor, akutansi dan 2002 (7) 2 21 556
2002 2003 1 2 22 726 Office, accounting and computering machinery 31. Industri mesin lainnya dan 2001 175 040 9 473 6 652 250 perlengkapannya 2002 117 803 21 190 4 151 208 Other machinery and 2003 149 361 21 967 6 078 065 appratus 32. Industri radio, televisi dan 2001 310 362 21 818 13 446 751 peralatan komunikasi 2002 26 384 13 196 16 690 552 serta perlengkapannya 2003 36 784 197 367 21 482 728 Radio, televisian and communication equipment and appartus
MANUFACTURING, QUARRYING AND ENERGY
Jawa Barat Dalam Angka 2004/2005 321
Tabel Table 6.1.4 Lanjutan
[Continued]
Golongan Industri Group of Industry
Tahun Year
Barang yang dihasilkan
Value of Goods Produced
Tenaga Listrik yang dijual ke-pada Pihak lainValue of Elec tricity Sold
Jasa Industri Yang diberikan
Kepada Pihak Lain Value of Industrial Services Rendered
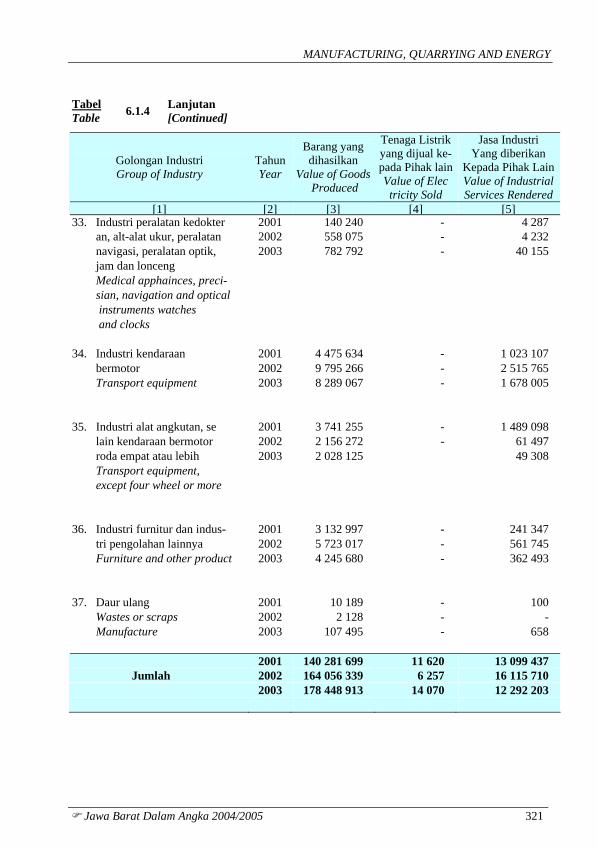
[1] [2] [3] [4] [5]33. Industri peralatan kedokter 2001 140 240 - 4 287 an, alt-alat ukur, peralatan 2002 558 075 - 4 232 navigasi, peralatan optik, 2003 782 792 - 40 155 jam dan lonceng Medical apphainces, preci- sian, navigation and optical instruments watches and clocks 34. Industri kendaraan 2001 4 475 634 - 1 023 107 bermotor 2002 9 795 266 - 2 515 765 Transport equipment 2003 8 289 067 - 1 678 005 35. Industri alat angkutan, se 2001 3 741 255 - 1 489 098 lain kendaraan bermotor 2002 2 156 272 - 61 497 roda empat atau lebih 2003 2 028 125 49 308 Transport equipment, except four wheel or more 36. Industri furnitur dan indus- 2001 3 132 997 - 241 347 tri pengolahan lainnya 2002 5 723 017 - 561 745 Furniture and other product 2003 4 245 680 - 362 493 37. Daur ulang 2001 10 189 - 100 Wastes or scraps 2002 2 128 - - Manufacture 2003 107 495 - 658 2001 140 281 699 11 620 13 099 437 Jumlah 2002 164 056 339 6 257 16 115 710 2003 178 448 913 14 070 12 292 203
INDUSTRI , PENGGALIAN DAN ENERGI
322 Jawa Barat Dalam Angka 2004/2005
Tabel Table 6.1.4 Lanjutan
[Continued]
Golongan Industri Group of Industry
Tahun Year
Selisih Nilai Stock barang Setengah jadi Increase in
Stock of Semi Finished Goods
Penerimaan Lain Bukan Industri Receipt From Non Industrial
Services Rendered
Jumlah Total
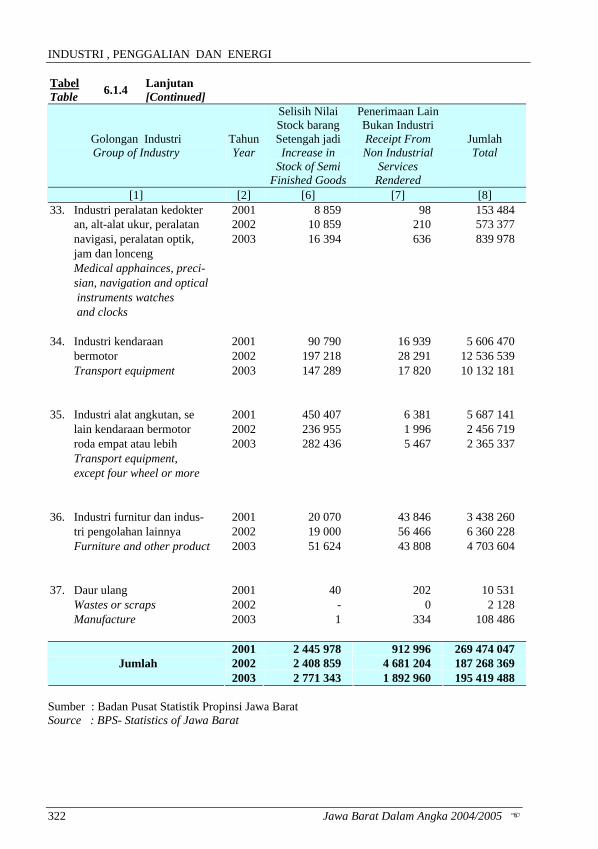
[1] [2] [6] [7] [8] 33. Industri peralatan kedokter 2001 8 859 98 153 484 an, alt-alat ukur, peralatan 2002 10 859 210 573 377 navigasi, peralatan optik, 2003 16 394 636 839 978 jam dan lonceng Medical apphainces, preci- sian, navigation and optical instruments watches and clocks 34. Industri kendaraan 2001 90 790 16 939 5 606 470 bermotor 2002 197 218 28 291 12 536 539 Transport equipment 2003 147 289 17 820 10 132 181 35. Industri alat angkutan, se 2001 450 407 6 381 5 687 141 lain kendaraan bermotor 2002 236 955 1 996 2 456 719 roda empat atau lebih 2003 282 436 5 467 2 365 337 Transport equipment, except four wheel or more 36. Industri furnitur dan indus- 2001 20 070 43 846 3 438 260 tri pengolahan lainnya 2002 19 000 56 466 6 360 228 Furniture and other product 2003 51 624 43 808 4 703 604 37. Daur ulang 2001 40 202 10 531 Wastes or scraps 2002 - 0 2 128 Manufacture 2003 1 334 108 486
2001 2 445 978 912 996 269 474 047 2002 2 408 859 4 681 204 187 268 369 Jumlah 2003 2 771 343 1 892 960 195 419 488
Sumber : Badan Pusat Statistik Propinsi Jawa Barat Source : BPS- Statistics of Jawa Barat
MANUFACTURING, QUARRYING AND ENERGY
Jawa Barat Dalam Angka 2004/2005 323
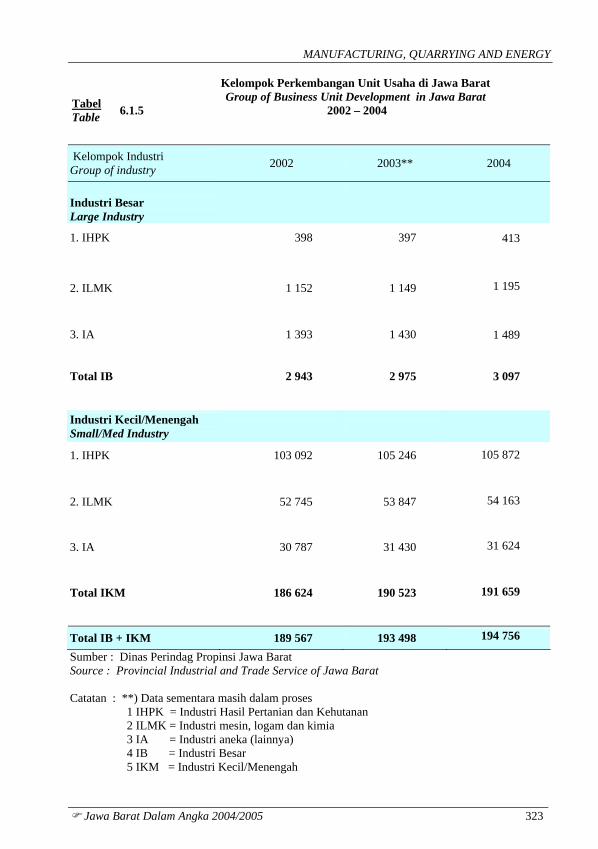
Tabel Table 6.1.5
Kelompok Perkembangan Unit Usaha di Jawa Barat Group of Business Unit Development in Jawa Barat
2002 – 2004
Kelompok Industri Group of industry 2002 2003** 2004
Industri Besar Large Industry
1. IHPK 398 397 413
2. ILMK 1 152 1 149 1 195
3. IA 1 393 1 430 1 489
Total IB 2 943 2 975 3 097
Industri Kecil/Menengah Small/Med Industry
1. IHPK 103 092 105 246 105 872
2. ILMK 52 745 53 847 54 163
3. IA 30 787 31 430 31 624
Total IKM 186 624 190 523 191 659
Total IB + IKM 189 567 193 498 194 756
Sumber : Dinas Perindag Propinsi Jawa Barat Source : Provincial Industrial and Trade Service of Jawa Barat Catatan : **) Data sementara masih dalam proses 1 IHPK = Industri Hasil Pertanian dan Kehutanan 2 ILMK = Industri mesin, logam dan kimia 3 IA = Industri aneka (lainnya) 4 IB = Industri Besar 5 IKM = Industri Kecil/Menengah
INDUSTRI , PENGGALIAN DAN ENERGI
324 Jawa Barat Dalam Angka 2004/2005
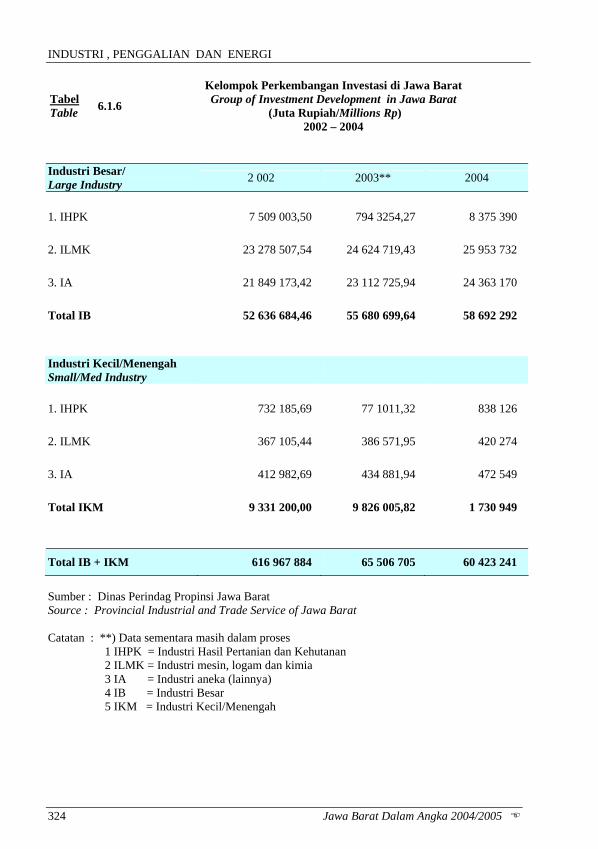
Tabel Table 6.1.6
Kelompok Perkembangan Investasi di Jawa Barat Group of Investment Development in Jawa Barat
(Juta Rupiah/Millions Rp) 2002 – 2004
Industri Besar/ Large Industry 2 002 2003** 2004
1. IHPK 7 509 003,50 794 3254,27 8 375 390 2. ILMK 23 278 507,54 24 624 719,43 25 953 732 3. IA 21 849 173,42 23 112 725,94 24 363 170 Total IB 52 636 684,46 55 680 699,64 58 692 292 Industri Kecil/Menengah Small/Med Industry
1. IHPK 732 185,69 77 1011,32 838 126 2. ILMK 367 105,44 386 571,95 420 274 3. IA 412 982,69 434 881,94 472 549 Total IKM 9 331 200,00 9 826 005,82 1 730 949
Total IB + IKM 616 967 884 65 506 705 60 423 241
Sumber : Dinas Perindag Propinsi Jawa Barat Source : Provincial Industrial and Trade Service of Jawa Barat Catatan : **) Data sementara masih dalam proses 1 IHPK = Industri Hasil Pertanian dan Kehutanan 2 ILMK = Industri mesin, logam dan kimia 3 IA = Industri aneka (lainnya) 4 IB = Industri Besar 5 IKM = Industri Kecil/Menengah
MANUFACTURING, QUARRYING AND ENERGY
Jawa Barat Dalam Angka 2004/2005 325
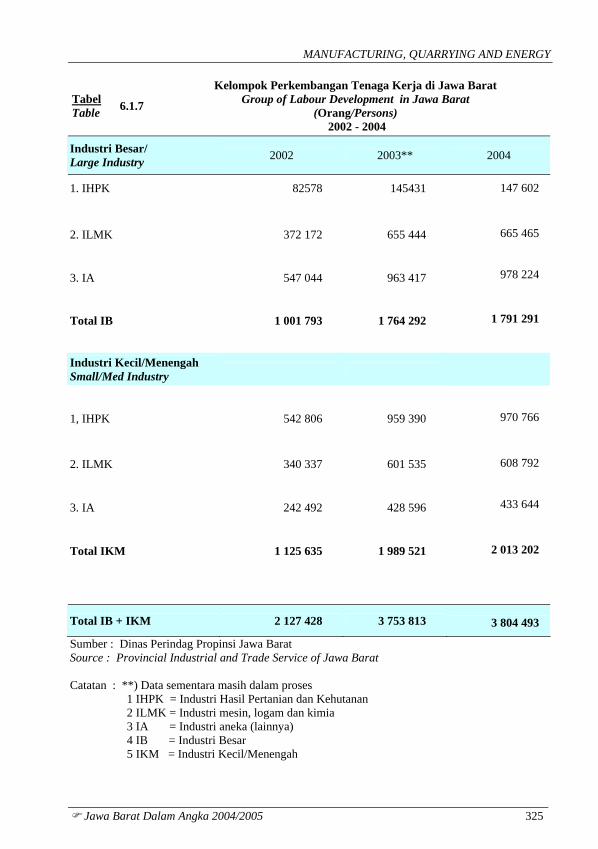
Tabel Table 6.1.7
Kelompok Perkembangan Tenaga Kerja di Jawa Barat Group of Labour Development in Jawa Barat
(Orang/Persons) 2002 - 2004
Industri Besar/ Large Industry 2002 2003** 2004
1. IHPK 82578 145431 147 602
2. ILMK 372 172 655 444 665 465
3. IA 547 044 963 417 978 224
Total IB 1 001 793 1 764 292 1 791 291
Industri Kecil/Menengah Small/Med Industry
1, IHPK 542 806 959 390 970 766
2. ILMK 340 337 601 535 608 792
3. IA 242 492 428 596 433 644
Total IKM 1 125 635 1 989 521 2 013 202
Total IB + IKM 2 127 428 3 753 813 3 804 493
Sumber : Dinas Perindag Propinsi Jawa Barat Source : Provincial Industrial and Trade Service of Jawa Barat Catatan : **) Data sementara masih dalam proses 1 IHPK = Industri Hasil Pertanian dan Kehutanan 2 ILMK = Industri mesin, logam dan kimia 3 IA = Industri aneka (lainnya) 4 IB = Industri Besar 5 IKM = Industri Kecil/Menengah
INDUSTRY, PENGGALIAN DAN ENERGY
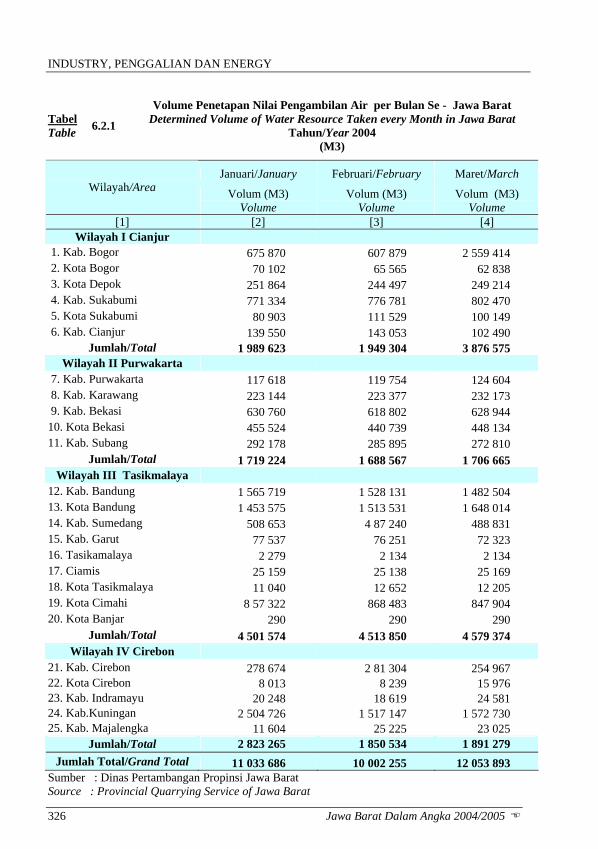
Tabel Table 6.2.1
Volume Penetapan Nilai Pengambilan Air per Bulan Se - Jawa Barat Determined Volume of Water Resource Taken every Month in Jawa Barat
Tahun/Year 2004 (M3)
Januari/January Februari/February Maret/March Wilayah/Area Volum (M3)
Volume Volum (M3)
Volume Volum (M3)
Volume [1] [2] [3] [4]
Wilayah I Cianjur 1. Kab. Bogor 675 870 607 879 2 559 414 2. Kota Bogor 70 102 65 565 62 838 3. Kota Depok 251 864 244 497 249 214 4. Kab. Sukabumi 771 334 776 781 802 470 5. Kota Sukabumi 80 903 111 529 100 149 6. Kab. Cianjur 139 550 143 053 102 490
Jumlah/Total 1 989 623 1 949 304 3 876 575 Wilayah II Purwakarta
7. Kab. Purwakarta 117 618 119 754 124 604 8. Kab. Karawang 223 144 223 377 232 173 9. Kab. Bekasi 630 760 618 802 628 944 10. Kota Bekasi 455 524 440 739 448 134 11. Kab. Subang 292 178 285 895 272 810
Jumlah/Total 1 719 224 1 688 567 1 706 665 Wilayah III Tasikmalaya
12. Kab. Bandung 1 565 719 1 528 131 1 482 504 13. Kota Bandung 1 453 575 1 513 531 1 648 014 14. Kab. Sumedang 508 653 4 87 240 488 831 15. Kab. Garut 77 537 76 251 72 323 16. Tasikamalaya 2 279 2 134 2 134 17. Ciamis 25 159 25 138 25 169 18. Kota Tasikmalaya 11 040 12 652 12 205 19. Kota Cimahi 8 57 322 868 483 847 904 20. Kota Banjar 290 290 290
Jumlah/Total 4 501 574 4 513 850 4 579 374 Wilayah IV Cirebon
21. Kab. Cirebon 278 674 2 81 304 254 967 22. Kota Cirebon 8 013 8 239 15 976 23. Kab. Indramayu 20 248 18 619 24 581 24. Kab.Kuningan 2 504 726 1 517 147 1 572 730 25. Kab. Majalengka 11 604 25 225 23 025
Jumlah/Total 2 823 265 1 850 534 1 891 279 Jumlah Total/Grand Total 11 033 686 10 002 255 12 053 893
Sumber : Dinas Pertambangan Propinsi Jawa Barat Source : Provincial Quarrying Service of Jawa Barat
326 Jawa Barat Dalam Angka 2004/2005
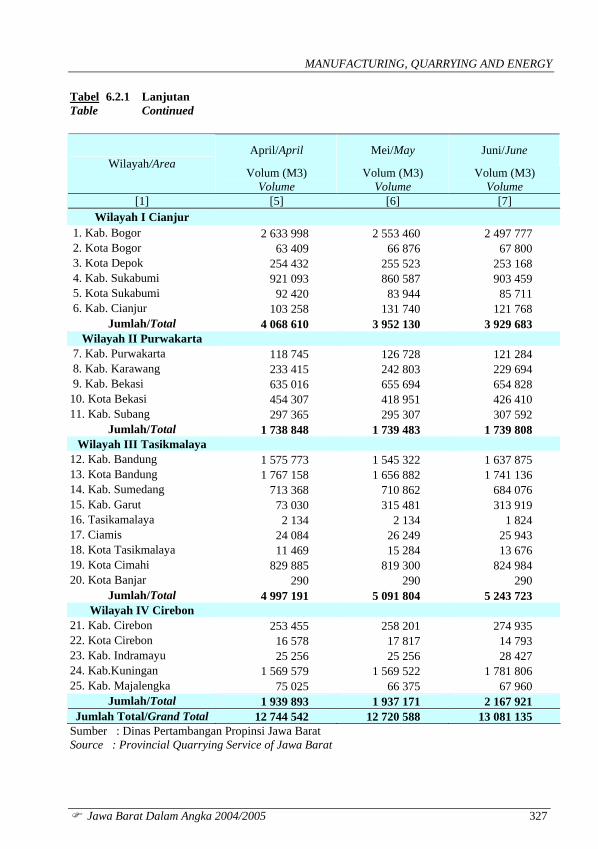
MANUFACTURING, QUARRYING AND ENERGY Tabel Table
6.2.1 Lanjutan Continued
April/April Mei/May Juni/June Wilayah/Area
Volum (M3) Volume
Volum (M3) Volume
Volum (M3) Volume
[1] [5] [6] [7] Wilayah I Cianjur
1. Kab. Bogor 2 633 998 2 553 460 2 497 777 2. Kota Bogor 63 409 66 876 67 800 3. Kota Depok 254 432 255 523 253 168 4. Kab. Sukabumi 921 093 860 587 903 459 5. Kota Sukabumi 92 420 83 944 85 711 6. Kab. Cianjur 103 258 131 740 121 768
Jumlah/Total 4 068 610 3 952 130 3 929 683 Wilayah II Purwakarta
7. Kab. Purwakarta 118 745 126 728 121 284 8. Kab. Karawang 233 415 242 803 229 694 9. Kab. Bekasi 635 016 655 694 654 828 10. Kota Bekasi 454 307 418 951 426 410 11. Kab. Subang 297 365 295 307 307 592
Jumlah/Total 1 738 848 1 739 483 1 739 808 Wilayah III Tasikmalaya
12. Kab. Bandung 1 575 773 1 545 322 1 637 875 13. Kota Bandung 1 767 158 1 656 882 1 741 136 14. Kab. Sumedang 713 368 710 862 684 076 15. Kab. Garut 73 030 315 481 313 919 16. Tasikamalaya 2 134 2 134 1 824 17. Ciamis 24 084 26 249 25 943 18. Kota Tasikmalaya 11 469 15 284 13 676 19. Kota Cimahi 829 885 819 300 824 984 20. Kota Banjar 290 290 290
Jumlah/Total 4 997 191 5 091 804 5 243 723 Wilayah IV Cirebon
21. Kab. Cirebon 253 455 258 201 274 935 22. Kota Cirebon 16 578 17 817 14 793 23. Kab. Indramayu 25 256 25 256 28 427 24. Kab.Kuningan 1 569 579 1 569 522 1 781 806 25. Kab. Majalengka 75 025 66 375 67 960
Jumlah/Total 1 939 893 1 937 171 2 167 921 Jumlah Total/Grand Total 12 744 542 12 720 588 13 081 135
Sumber : Dinas Pertambangan Propinsi Jawa Barat Source : Provincial Quarrying Service of Jawa Barat
Jawa Barat Dalam Angka 2004/2005 327
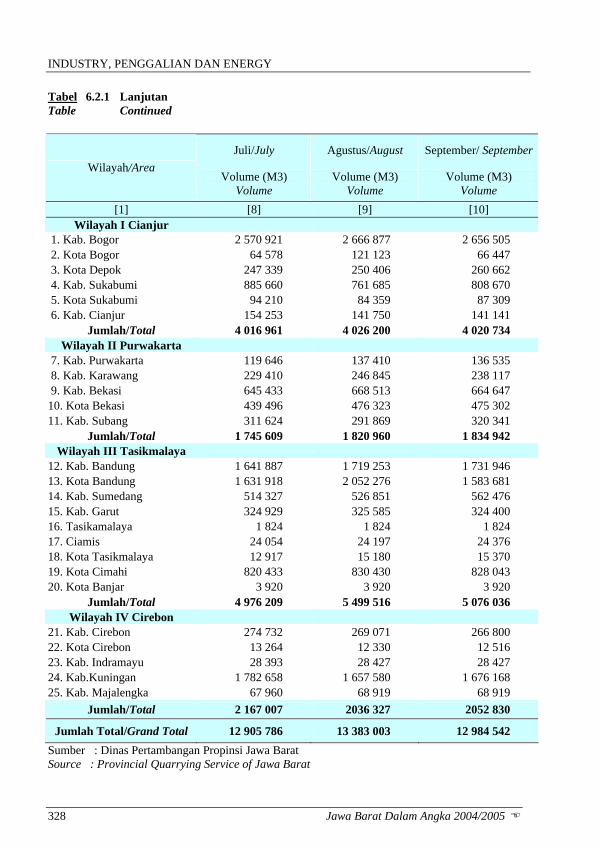
INDUSTRY, PENGGALIAN DAN ENERGY Tabel Table
6.2.1 Lanjutan Continued
Juli/July Agustus/August September/ SeptemberWilayah/Area
Volume (M3) Volume
Volume (M3) Volume
Volume (M3) Volume
[1] [8] [9] [10] Wilayah I Cianjur
1. Kab. Bogor 2 570 921 2 666 877 2 656 505 2. Kota Bogor 64 578 121 123 66 447 3. Kota Depok 247 339 250 406 260 662 4. Kab. Sukabumi 885 660 761 685 808 670 5. Kota Sukabumi 94 210 84 359 87 309 6. Kab. Cianjur 154 253 141 750 141 141
Jumlah/Total 4 016 961 4 026 200 4 020 734 Wilayah II Purwakarta
7. Kab. Purwakarta 119 646 137 410 136 535 8. Kab. Karawang 229 410 246 845 238 117 9. Kab. Bekasi 645 433 668 513 664 647 10. Kota Bekasi 439 496 476 323 475 302 11. Kab. Subang 311 624 291 869 320 341
Jumlah/Total 1 745 609 1 820 960 1 834 942 Wilayah III Tasikmalaya
12. Kab. Bandung 1 641 887 1 719 253 1 731 946 13. Kota Bandung 1 631 918 2 052 276 1 583 681 14. Kab. Sumedang 514 327 526 851 562 476 15. Kab. Garut 324 929 325 585 324 400 16. Tasikamalaya 1 824 1 824 1 824 17. Ciamis 24 054 24 197 24 376 18. Kota Tasikmalaya 12 917 15 180 15 370 19. Kota Cimahi 820 433 830 430 828 043 20. Kota Banjar 3 920 3 920 3 920
Jumlah/Total 4 976 209 5 499 516 5 076 036 Wilayah IV Cirebon
21. Kab. Cirebon 274 732 269 071 266 800 22. Kota Cirebon 13 264 12 330 12 516 23. Kab. Indramayu 28 393 28 427 28 427 24. Kab.Kuningan 1 782 658 1 657 580 1 676 168 25. Kab. Majalengka 67 960 68 919 68 919
Jumlah/Total 2 167 007 2036 327 2052 830
Jumlah Total/Grand Total 12 905 786 13 383 003 12 984 542 Sumber : Dinas Pertambangan Propinsi Jawa Barat Source : Provincial Quarrying Service of Jawa Barat
328 Jawa Barat Dalam Angka 2004/2005
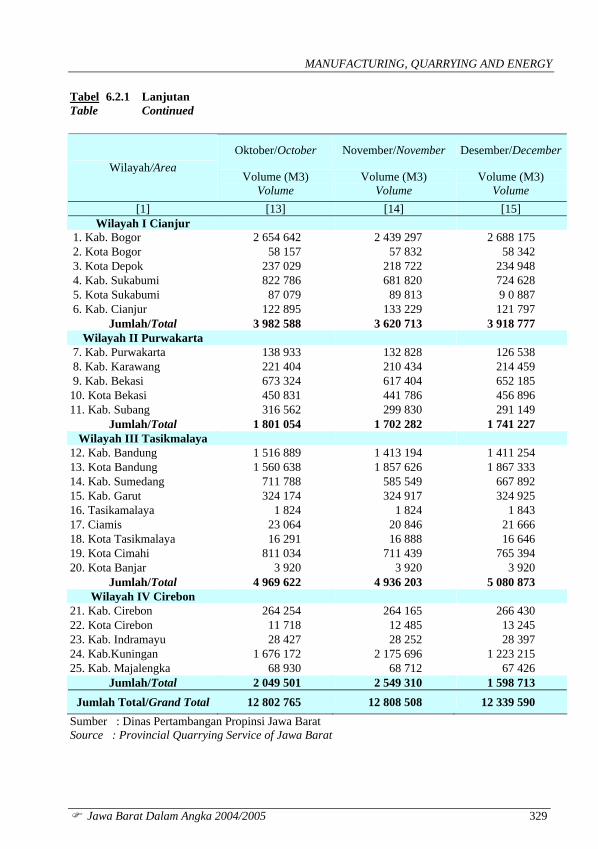
MANUFACTURING, QUARRYING AND ENERGY Tabel Table
6.2.1 Lanjutan Continued
Oktober/October November/November Desember/DecemberWilayah/Area
Volume (M3) Volume
Volume (M3) Volume
Volume (M3) Volume
[1] [13] [14] [15] Wilayah I Cianjur
1. Kab. Bogor 2 654 642 2 439 297 2 688 175 2. Kota Bogor 58 157 57 832 58 342 3. Kota Depok 237 029 218 722 234 948 4. Kab. Sukabumi 822 786 681 820 724 628 5. Kota Sukabumi 87 079 89 813 9 0 887 6. Kab. Cianjur 122 895 133 229 121 797
Jumlah/Total 3 982 588 3 620 713 3 918 777 Wilayah II Purwakarta
7. Kab. Purwakarta 138 933 132 828 126 538 8. Kab. Karawang 221 404 210 434 214 459 9. Kab. Bekasi 673 324 617 404 652 185 10. Kota Bekasi 450 831 441 786 456 896 11. Kab. Subang 316 562 299 830 291 149
Jumlah/Total 1 801 054 1 702 282 1 741 227 Wilayah III Tasikmalaya
12. Kab. Bandung 1 516 889 1 413 194 1 411 254 13. Kota Bandung 1 560 638 1 857 626 1 867 333 14. Kab. Sumedang 711 788 585 549 667 892 15. Kab. Garut 324 174 324 917 324 925 16. Tasikamalaya 1 824 1 824 1 843 17. Ciamis 23 064 20 846 21 666 18. Kota Tasikmalaya 16 291 16 888 16 646 19. Kota Cimahi 811 034 711 439 765 394 20. Kota Banjar 3 920 3 920 3 920
Jumlah/Total 4 969 622 4 936 203 5 080 873 Wilayah IV Cirebon
21. Kab. Cirebon 264 254 264 165 266 430 22. Kota Cirebon 11 718 12 485 13 245 23. Kab. Indramayu 28 427 28 252 28 397 24. Kab.Kuningan 1 676 172 2 175 696 1 223 215 25. Kab. Majalengka 68 930 68 712 67 426
Jumlah/Total 2 049 501 2 549 310 1 598 713 Jumlah Total/Grand Total 12 802 765 12 808 508 12 339 590
Sumber : Dinas Pertambangan Propinsi Jawa Barat Source : Provincial Quarrying Service of Jawa Barat
Jawa Barat Dalam Angka 2004/2005 329
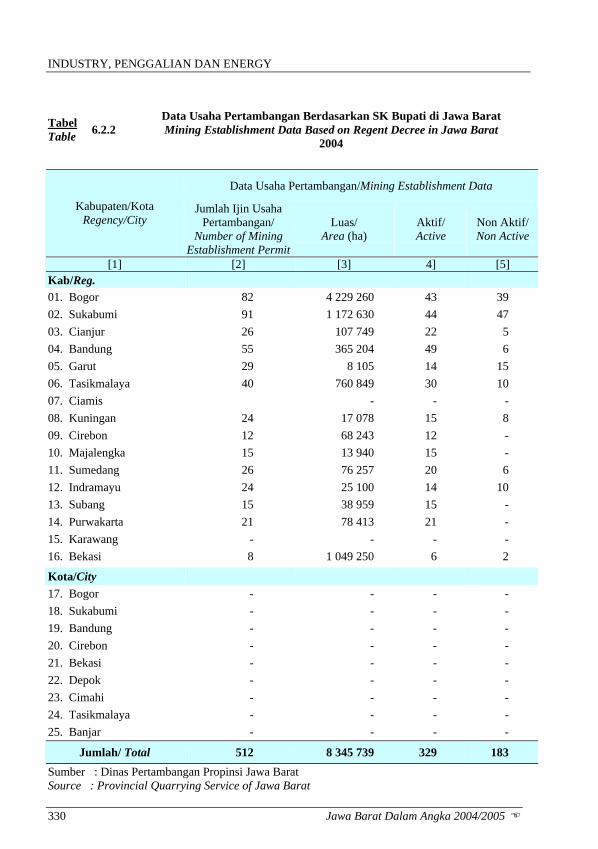
INDUSTRY, PENGGALIAN DAN ENERGY
Tabel Table 6.2.2
Data Usaha Pertambangan Berdasarkan SK Bupati di Jawa Barat Mining Establishment Data Based on Regent Decree in Jawa Barat
2004
Data Usaha Pertambangan/Mining Establishment Data
Kabupaten/Kota Regency/City
Jumlah Ijin Usaha Pertambangan/
Number of Mining Establishment Permit
Luas/ Area (ha)
Aktif/ Active
Non Aktif/ Non Active
[1] [2] [3] 4] [5] Kab/Reg. 01. Bogor 82 4 229 260 43 39 02. Sukabumi 91 1 172 630 44 47 03. Cianjur 26 107 749 22 5 04. Bandung 55 365 204 49 6 05. Garut 29 8 105 14 15 06. Tasikmalaya 40 760 849 30 10 07. Ciamis - - - 08. Kuningan 24 17 078 15 8 09. Cirebon 12 68 243 12 - 10. Majalengka 15 13 940 15 - 11. Sumedang 26 76 257 20 6 12. Indramayu 24 25 100 14 10 13. Subang 15 38 959 15 - 14. Purwakarta 21 78 413 21 - 15. Karawang - - - - 16. Bekasi 8 1 049 250 6 2
Kota/City 17. Bogor - - - - 18. Sukabumi - - - - 19. Bandung - - - - 20. Cirebon - - - - 21. Bekasi - - - - 22. Depok - - - - 23. Cimahi - - - - 24. Tasikmalaya - - - - 25. Banjar - - - -
Jumlah/ Total 512 8 345 739 329 183 Sumber : Dinas Pertambangan Propinsi Jawa Barat Source : Provincial Quarrying Service of Jawa Barat
330 Jawa Barat Dalam Angka 2004/2005
MANUFACTURING, QUARRYING AND ENERGY
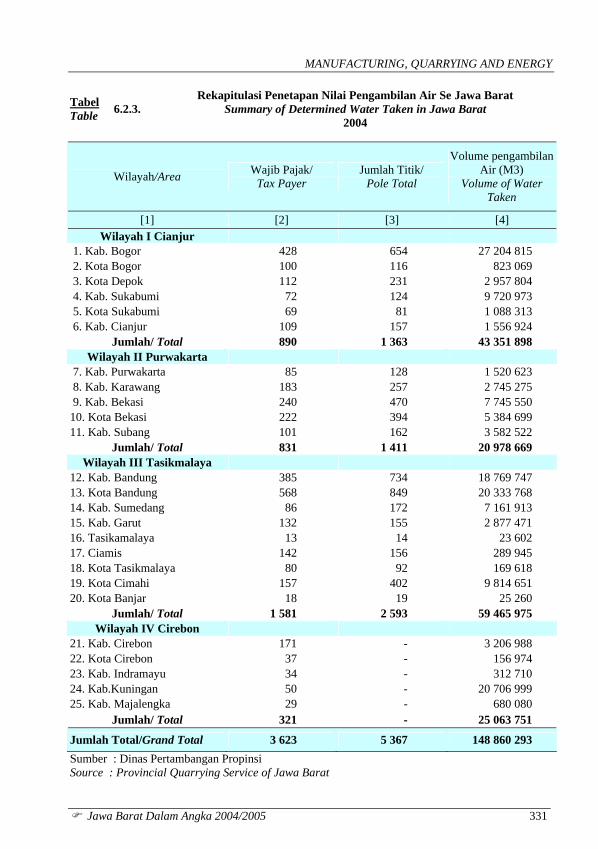
Tabel Table 6.2.3.
Rekapitulasi Penetapan Nilai Pengambilan Air Se Jawa Barat Summary of Determined Water Taken in Jawa Barat
2004
Wilayah/Area Wajib Pajak/ Tax Payer
Jumlah Titik/ Pole Total
Volume pengambilan Air (M3)
Volume of Water Taken
[1] [2] [3] [4] Wilayah I Cianjur
1. Kab. Bogor 428 654 27 204 815 2. Kota Bogor 100 116 823 069 3. Kota Depok 112 231 2 957 804 4. Kab. Sukabumi 72 124 9 720 973 5. Kota Sukabumi 69 81 1 088 313 6. Kab. Cianjur 109 157 1 556 924
Jumlah/ Total 890 1 363 43 351 898 Wilayah II Purwakarta
7. Kab. Purwakarta 85 128 1 520 623 8. Kab. Karawang 183 257 2 745 275 9. Kab. Bekasi 240 470 7 745 550 10. Kota Bekasi 222 394 5 384 699 11. Kab. Subang 101 162 3 582 522
Jumlah/ Total 831 1 411 20 978 669 Wilayah III Tasikmalaya
12. Kab. Bandung 385 734 18 769 747 13. Kota Bandung 568 849 20 333 768 14. Kab. Sumedang 86 172 7 161 913 15. Kab. Garut 132 155 2 877 471 16. Tasikamalaya 13 14 23 602 17. Ciamis 142 156 289 945 18. Kota Tasikmalaya 80 92 169 618 19. Kota Cimahi 157 402 9 814 651 20. Kota Banjar 18 19 25 260
Jumlah/ Total 1 581 2 593 59 465 975 Wilayah IV Cirebon
21. Kab. Cirebon 171 - 3 206 988 22. Kota Cirebon 37 - 156 974 23. Kab. Indramayu 34 - 312 710 24. Kab.Kuningan 50 - 20 706 999 25. Kab. Majalengka 29 - 680 080
Jumlah/ Total 321 - 25 063 751
Jumlah Total/Grand Total 3 623 5 367 148 860 293 Sumber : Dinas Pertambangan Propinsi Source : Provincial Quarrying Service of Jawa Barat
Jawa Barat Dalam Angka 2004/2005 331
INDUSTRY, PENGGALIAN DAN ENERGY
Tabel Table 6.2.4
Produksi Bahan Galian Tambang Di Jawa Barat Mining Material Production in Jawa Barat
2002 – 2004 (Ton)
Produksi / Production (ton) Jenis Bahan Galian/ Mining Material
2002 2003 2004
[1] [2] [3] [4]
1. ANDESIT 2 218 693,79 3 554 126,39 5 657 674,05
2. BATU KAPUR 8 258 721,22 14 720 447,94 17 243 564,00
3. BENTONIT 260,00 51 608,00 75 972,00
4. FELDSPAR 26 940,00 28 182,57 312 177,25
5. FOSPAT 0,00 54,72 71,76
6. MARMER 0,00 10 640,60 9 828,00
7. PASIR 756 997,16 1 810 005,96 1 186 990,17
8. SIRTU 68 815,58 157 769,10 1 166 881,14
9. PASIR KUARSA 0,00 162 039,00 0,00
10. TANAH LIAT 14 418 475,31 14 505 008,56 11 555 837,46
11. LEMPUNG 14 826,51 28 858,43 30 372,32
12. PASIR/TANAH URUG 0,00 0,00 14 833,00
13. TRASS 43 320,00 50 735,20 266 303,00
14. ZEOLIT 0,00 0,00 1 560,00
15. BATU BUKAT/KALI 0,00 262,08 13 384,80
16. PASIR BESI 0,00 12 612,08 67 080,00
17. BATU ½ PERMATA 0,00 0,00 0,62
18. DACITE 34,94 57,10 0,00
20. EMAS 3,81 709,30 1 278,48
21. PERAK 25,40 28,57 0,00
22. MANGAN 0,00 124,80 624,00 Sumber : Dinas Pertambangan Propinsi Source : Provincial Quarrying Service of Jawa Barat
332 Jawa Barat Dalam Angka 2004/2005
MANUFACTURING, QUARRYING AND ENERGY
Tabel Table 6.3.1
Jumlah Pelanggan, Daya Tersambung dan Energi Listrik Terjual Menurut Lokasi di Jawa Barat
Number of Customers, Quantity of Power Installed and Electricity Sold by Location in Jawa Barat
2004
Cabang Branch Location
Jumlah Pelanggan Number of Customers
Daya Tersambung Power Installed
(KWH)
Energi yang Terjual Electricity Sold
(Ribu /Thousand KWH) [1] [2] [3] [4]
01. Cirebon 821 781 718 617 125 1 514 271 817
02. Tasikmalaya 637 841 440 773 805 669 711 952
03. G a r u t 260 885 178 453 875 299 472 929
04. Cianjur 278 451 228 088 314 326 522 459
05. Sukabumi 314 595 297 081 635 516 767 201
06. B o g o r 629 232 1 200 283 145 2 847 247 798
07. Purwakarta 395 805 510 984 080 1 665 715 900
08. C i m a h i 304 887 598 568 426 1 562 117 393
09. Bandung 518 754 1 346 217140 3 143 264 919
10. Majalaya 309 278 545 040 2 04 1 484 080 698
11. B e k a s i 549 123 1 362 393 537 3 574 434 460
12. D e p o k 369 092 516 573 277 1 052 657 513
13. Karawang 342 389 707 210 910 1 888 704 324
14. Sumedang 413 478 420 028 110 1 226 389 643
Jumlah / Total 6 145 591 9 070 313 583 21 771 355 006
2003 5 933 955 8 716 527 118 19 966 202 280 Sumber : PLN Distribusi Jawa Barat Source : State Owned Electricity Company of Jawa Barat Distribution
Jawa Barat Dalam Angka 2004/2005 333
INDUSTRI, PENGGALIAN DAN ENERGY
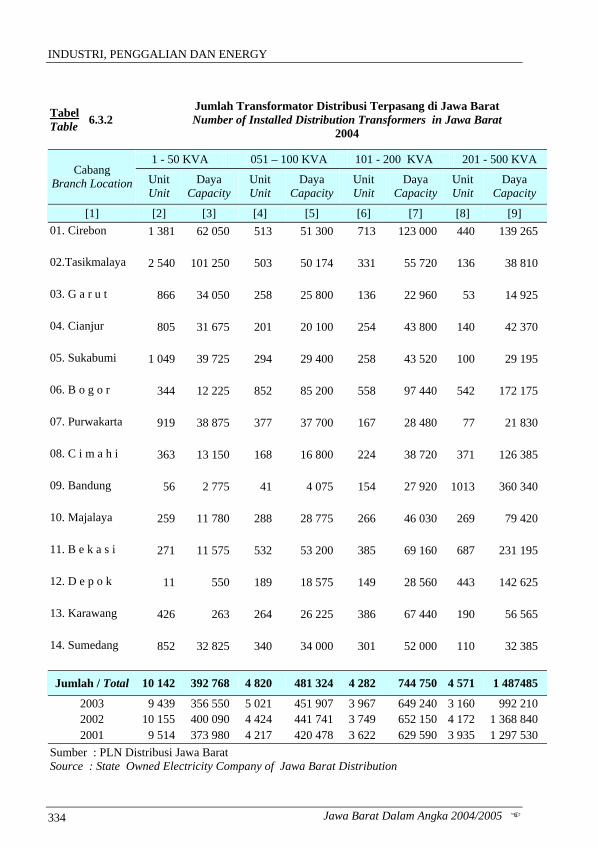
Tabel Table 6.3.2
Jumlah Transformator Distribusi Terpasang di Jawa Barat Number of Installed Distribution Transformers in Jawa Barat
2004
1 - 50 KVA 051 – 100 KVA 101 - 200 KVA 201 - 500 KVA Cabang
Branch Location Unit Unit
Daya Capacity
Unit Unit
Daya Capacity
Unit Unit
Daya Capacity
Unit Unit
Daya Capacity
[1] [2] [3] [4] [5] [6] [7] [8] [9] 01. Cirebon 1 381 62 050 513 51 300 713 123 000 440 139 265 02.Tasikmalaya 2 540 101 250 503 50 174 331 55 720 136 38 810 03. G a r u t 866 34 050 258 25 800 136 22 960 53 14 925 04. Cianjur 805 31 675 201 20 100 254 43 800 140 42 370 05. Sukabumi 1 049 39 725 294 29 400 258 43 520 100 29 195 06. B o g o r 344 12 225 852 85 200 558 97 440 542 172 175 07. Purwakarta 919 38 875 377 37 700 167 28 480 77 21 830 08. C i m a h i 363 13 150 168 16 800 224 38 720 371 126 385 09. Bandung 56 2 775 41 4 075 154 27 920 1013 360 340 10. Majalaya 259 11 780 288 28 775 266 46 030 269 79 420 11. B e k a s i 271 11 575 532 53 200 385 69 160 687 231 195 12. D e p o k 11 550 189 18 575 149 28 560 443 142 625
13. Karawang 426 263 264 26 225 386 67 440 190 56 565
14. Sumedang 852 32 825 340 34 000 301 52 000 110 32 385
Jumlah / Total 10 142 392 768 4 820 481 324 4 282 744 750 4 571 1 487485
2003 9 439 356 550 5 021 451 907 3 967 649 240 3 160 992 210 2002 10 155 400 090 4 424 441 741 3 749 652 150 4 172 1 368 840 2001 9 514 373 980 4 217 420 478 3 622 629 590 3 935 1 297 530
Sumber : PLN Distribusi Jawa Barat Source : State Owned Electricity Company of Jawa Barat Distribution
Jawa Barat Dalam Angka 2004/2005 334

MANUFACTURING, QUARRYING AND ENERGY
Tabel Table 6.3.2 Lanjutan
Continued
501 - 1000 KVA 1001 KVA dan Lebih Jumlah /Total Cabang
Branch Location Unit Unit
Daya Capacity
Unit Unit
Daya Capacity
Unit Unit
Daya Capacity
[1] [10] [11] [12] [13] [14] [15] 01. Cirebon 60 44 255 3 4 100 3 110 423 970 02. Tasikmalaya 19 12 340 2 3 200 3 531 261 494 03. G a r u t 6 3 780 - - 1 319 101 515 04. Cianjur 22 14 600 - - 1 422 152 545 05. Sukabumi 45 31 990 11 20 100 1 757 193 930 06. B o g o r 313 213 570 50 91 400 2 659 672 010 07. Purwakarta 31 24 450 44 121 000 1 615 272 335 08. C i m a h i 275 18 550 24 45 400 1 425 426 305 09. Bandung 538 379 195 207 363 450 2 009 1 137 755 10. Majalaya 134 94 980 86 173 700 1 302 434 685 11. B e k a s i 364 235 240 33 58 100 2 272 658 470 12. D e p o k 247 158 910 23 30 100 1 062 379 320
13. Karawang 99 74 754 101 182 500 1 466 407 747
14. Sumedang 23 17 485 28 109 000 1 654 277 695
Jumlah / Total 2 176 1 491399 612 1 202 050 26 603 5 799 776
2003 991 642 465 18 53 200 22 496 3 139 952
2002 2 158 1 480 684 648 1 464 640 26 585 5 891 130
2001 2 019 1 383 784 613 1 341 390 2 919 5 446 752Sumber : PLN Distribusi Jawa Barat Source : State Owned Electricity Company of Jawa Barat Distribution
Jawa Barat Dalam Angka 2004/2005 335
INDUSTRI, PENGGALIAN DAN ENERGY
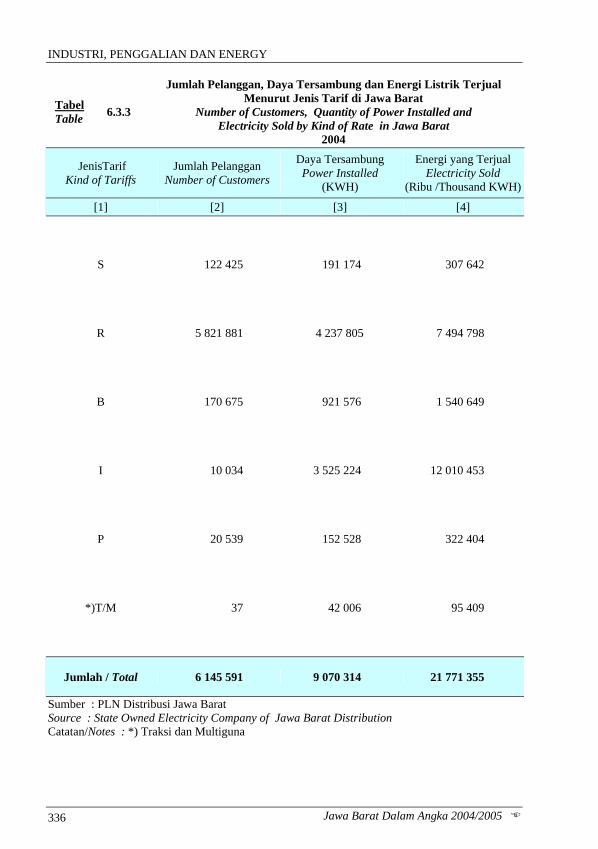
Tabel Table 6.3.3
Jumlah Pelanggan, Daya Tersambung dan Energi Listrik Terjual Menurut Jenis Tarif di Jawa Barat
Number of Customers, Quantity of Power Installed and Electricity Sold by Kind of Rate in Jawa Barat
2004
JenisTarif Kind of Tariffs
Jumlah Pelanggan Number of Customers
Daya Tersambung Power Installed
(KWH)
Energi yang Terjual Electricity Sold
(Ribu /Thousand KWH)
[1] [2] [3] [4]
S 122 425 191 174 307 642
R 5 821 881 4 237 805 7 494 798
B 170 675 921 576 1 540 649
I 10 034 3 525 224 12 010 453
P 20 539 152 528 322 404
*)T/M 37 42 006 95 409
Jumlah / Total 6 145 591 9 070 314 21 771 355
Sumber : PLN Distribusi Jawa Barat Source : State Owned Electricity Company of Jawa Barat Distribution Catatan/Notes : *) Traksi dan Multiguna
Jawa Barat Dalam Angka 2004/2005 336
MANUFACTURING, QUARRYING AND ENERGY
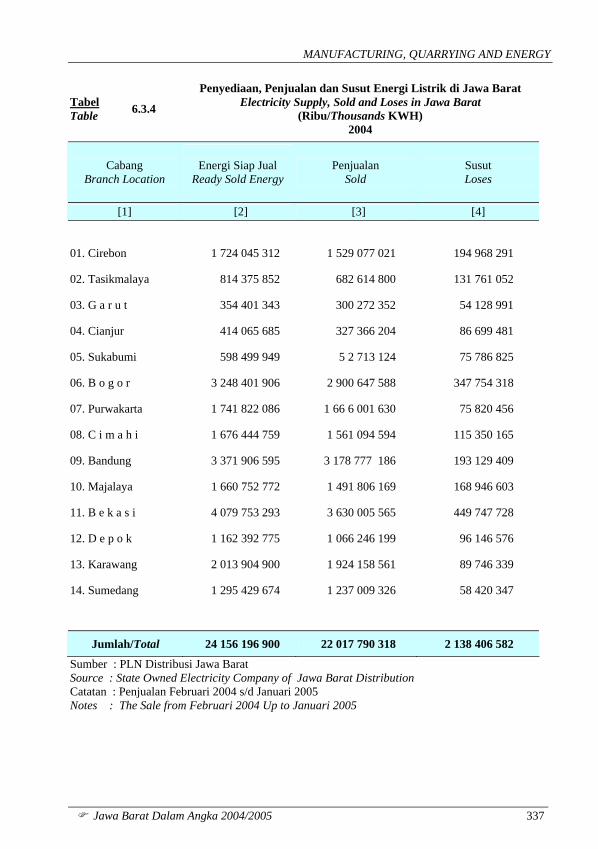
Tabel Table 6.3.4
Penyediaan, Penjualan dan Susut Energi Listrik di Jawa Barat Electricity Supply, Sold and Loses in Jawa Barat
(Ribu/Thousands KWH) 2004
Cabang Branch Location
Energi Siap Jual
Ready Sold Energy
Penjualan Sold
Susut Loses
[1] [2] [3] [4]
01. Cirebon 1 724 045 312 1 529 077 021 194 968 291
02. Tasikmalaya 814 375 852 682 614 800 131 761 052
03. G a r u t 354 401 343 300 272 352 54 128 991
04. Cianjur 414 065 685 327 366 204 86 699 481
05. Sukabumi 598 499 949 5 2 713 124 75 786 825
06. B o g o r 3 248 401 906 2 900 647 588 347 754 318
07. Purwakarta 1 741 822 086 1 66 6 001 630 75 820 456
08. C i m a h i 1 676 444 759 1 561 094 594 115 350 165
09. Bandung 3 371 906 595 3 178 777 186 193 129 409
10. Majalaya 1 660 752 772 1 491 806 169 168 946 603
11. B e k a s i 4 079 753 293 3 630 005 565 449 747 728
12. D e p o k 1 162 392 775 1 066 246 199 96 146 576
13. Karawang 2 013 904 900 1 924 158 561 89 746 339
14. Sumedang 1 295 429 674 1 237 009 326 58 420 347
Jumlah/Total 24 156 196 900 22 017 790 318 2 138 406 582
Sumber : PLN Distribusi Jawa Barat Source : State Owned Electricity Company of Jawa Barat Distribution Catatan : Penjualan Februari 2004 s/d Januari 2005 Notes : The Sale from Februari 2004 Up to Januari 2005
Jawa Barat Dalam Angka 2004/2005 337
INDUSTRI, PENGGALIAN DAN ENERGY
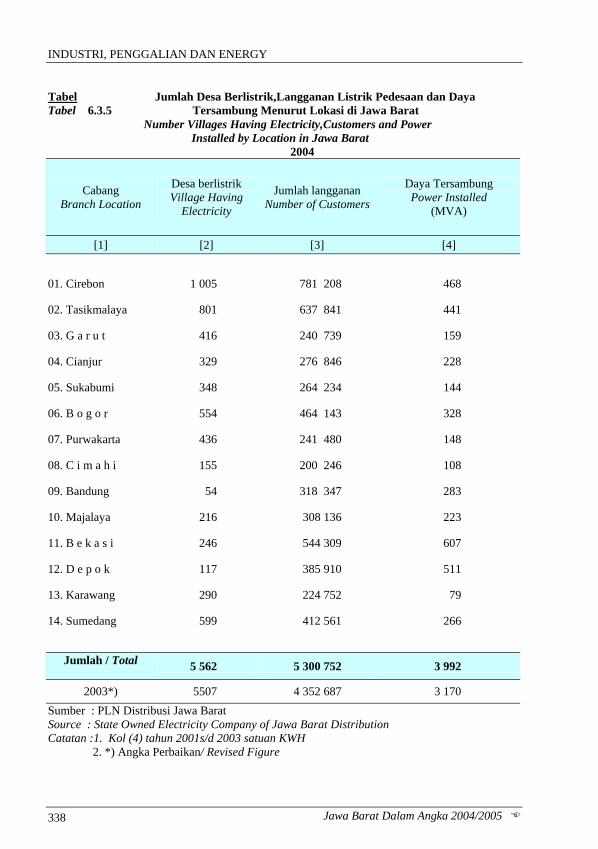
Tabel Jumlah Desa Berlistrik,Langganan Listrik Pedesaan dan Daya Tabel 6.3.5 Tersambung Menurut Lokasi di Jawa Barat
Number Villages Having Electricity,Customers and Power Installed by Location in Jawa Barat
2004
Cabang Branch Location
Desa berlistrik Village Having
Electricity
Jumlah langganan Number of Customers
Daya Tersambung Power Installed
(MVA)
[1] [2] [3] [4]
01. Cirebon 1 005 781 208 468
02. Tasikmalaya 801 637 841 441
03. G a r u t 416 240 739 159
04. Cianjur 329 276 846 228
05. Sukabumi 348 264 234 144
06. B o g o r 554 464 143 328
07. Purwakarta 436 241 480 148
08. C i m a h i 155 200 246 108
09. Bandung 54 318 347 283
10. Majalaya 216 308 136 223
11. B e k a s i 246 544 309 607
12. D e p o k 117 385 910 511
13. Karawang 290 224 752 79
14. Sumedang 599 412 561 266
Jumlah / Total
5 562 5 300 752 3 992
2003*) 5507 4 352 687 3 170 Sumber : PLN Distribusi Jawa Barat Source : State Owned Electricity Company of Jawa Barat Distribution Catatan :1. Kol (4) tahun 2001s/d 2003 satuan KWH 2. *) Angka Perbaikan/ Revised Figure
Jawa Barat Dalam Angka 2004/2005 338
MANUFACTURING, QUARRYING AND ENERGY
Tabel Table 6.3.6
Jumlah Perusahaan Air Minum, Kapasitas Produksi dan Produksi Air Minum Menurut Sumber Air yang Digunakan di Jawa Barat
Number of Water Supply Enterprises, Production Capacity and Water Production by Water Resource Used in Jawa Barat
2003-2004
Tahun ( Year ) Uraian / Description
2003*) 2004**) [1] [3] [4]
Jumlah Perusahaan 20 20
Number of Water Supply Enterprices
Jumlah Kapasitas Produksi Potensial (liter/detik) 14 126 14 849
Number of Potensial Production Capacity
Jumlah Kapasitas Produksi Efektif (liter/detik) 12 120 12 546
Number of Potensial Effective Production Capacity
Produksi Air (m3) / Water Production 328 432 046 347 078 389
Sumber Air / Water Resource (m3)
Sungai / River 212 464 461 215 700 195
Danau / Lake 5 373 041 3 442 409
Mata Air / Springs 90 737 359 114 932 766
Artesis / Artesian 19 405 733 12 549 399
Lainnya / Others 451 452 453 620
Jumlah / Total 328 432 046 347 078 389
Sumber : Badan Pusat Statistik Propinsi Jawa Barat453620 Source : BPS – Statistics of Jawa Barat Catatan/Notes : *) Angka Perbaikan/Revised Figure **) Angka Sementara/Preliminary Figure
Jawa Barat Dalam Angka 2004/2005 339
INDUSTRI, PENGGALIAN DAN ENERGY
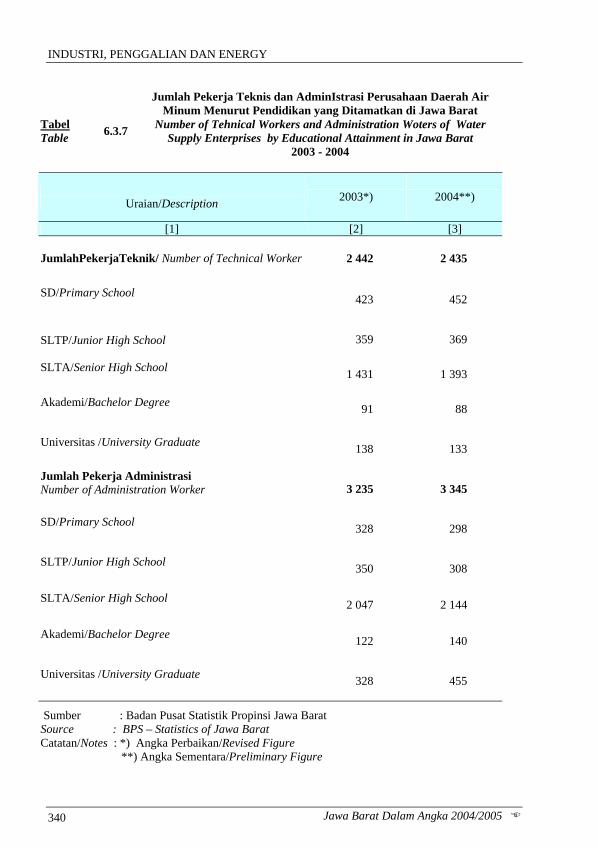
Tabel Table 6.3.7
Jumlah Pekerja Teknis dan AdminIstrasi Perusahaan Daerah Air Minum Menurut Pendidikan yang Ditamatkan di Jawa Barat
Number of Tehnical Workers and Administration Woters of Water Supply Enterprises by Educational Attainment in Jawa Barat
2003 - 2004
Uraian/Description 2003*) 2004**)
[1] [2] [3]
JumlahPekerjaTeknik/ Number of Technical Worker 2 442 2 435
SD/Primary School 423 452
SLTP/Junior High School
359 369
SLTA/Senior High School 1 431 1 393
Akademi/Bachelor Degree 91 88
Universitas /University Graduate 138 133
Jumlah Pekerja Administrasi Number of Administration Worker
3 235 3 345
SD/Primary School 328 298
SLTP/Junior High School 350 308
SLTA/Senior High School 2 047 2 144
Akademi/Bachelor Degree 122 140
Universitas /University Graduate 328 455
Sumber : Badan Pusat Statistik Propinsi Jawa Barat Source : BPS – Statistics of Jawa Barat Catatan/Notes : *) Angka Perbaikan/Revised Figure **) Angka Sementara/Preliminary Figure
Jawa Barat Dalam Angka 2004/2005 340
MANUFACTURING, QUARRYING AND ENERGY
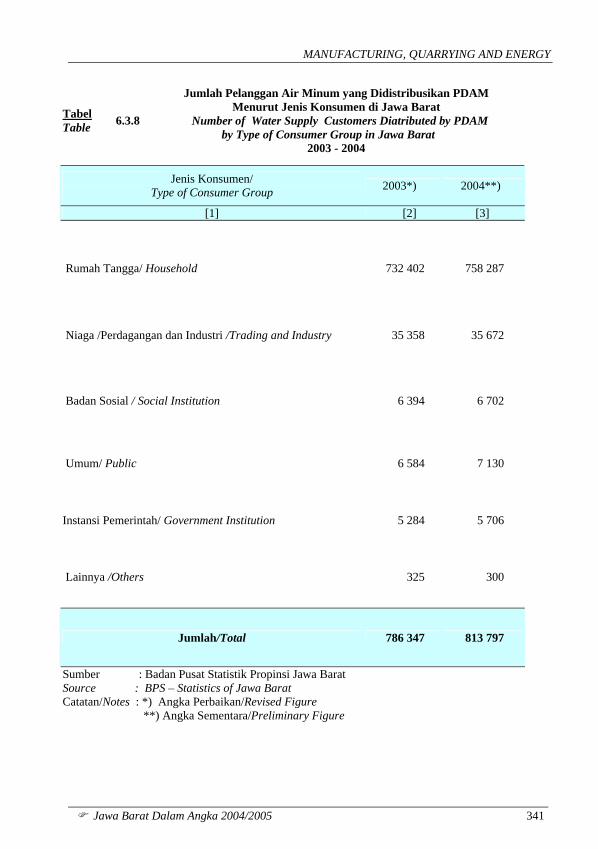
Tabel Table 6.3.8
Jumlah Pelanggan Air Minum yang Didistribusikan PDAM Menurut Jenis Konsumen di Jawa Barat
Number of Water Supply Customers Diatributed by PDAM by Type of Consumer Group in Jawa Barat
2003 - 2004
Jenis Konsumen/ Type of Consumer Group 2003*) 2004**)
[1] [2] [3]
Rumah Tangga/ Household 732 402 758 287
Niaga /Perdagangan dan Industri /Trading and Industry 35 358 35 672
Badan Sosial / Social Institution 6 394 6 702
Umum/ Public 6 584 7 130
Instansi Pemerintah/ Government Institution 5 284 5 706
Lainnya /Others 325 300
Jumlah/Total 786 347 813 797
Sumber : Badan Pusat Statistik Propinsi Jawa Barat Source : BPS – Statistics of Jawa Barat Catatan/Notes : *) Angka Perbaikan/Revised Figure **) Angka Sementara/Preliminary Figure
Jawa Barat Dalam Angka 2004/2005 341
INDUSTRI, PENGGALIAN DAN ENERGY
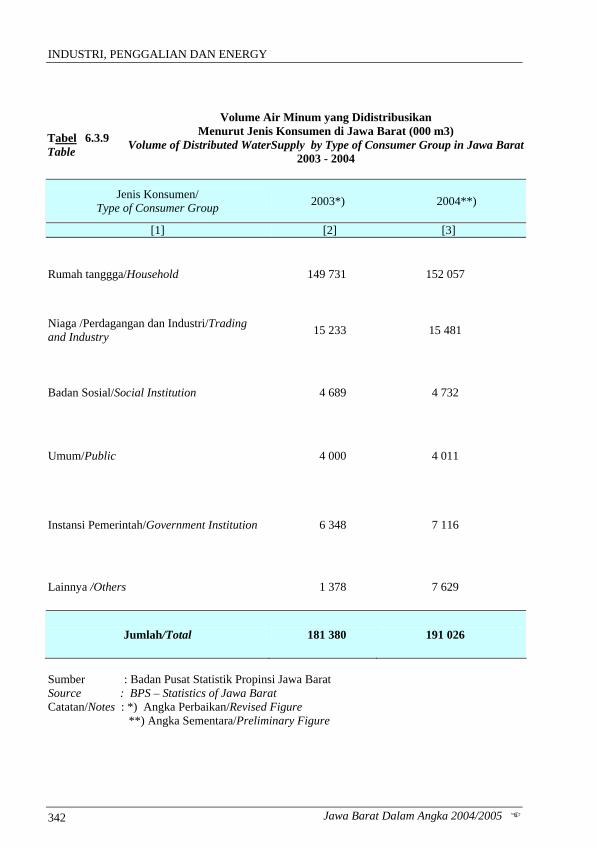
Tabel Table
6.3.9
Volume Air Minum yang Didistribusikan Menurut Jenis Konsumen di Jawa Barat (000 m3)
Volume of Distributed WaterSupply by Type of Consumer Group in Jawa Barat 2003 - 2004
Jenis Konsumen/ Type of Consumer Group 2003*) 2004**)
[1] [2] [3]
Rumah tanggga/Household 149 731 152 057
Niaga /Perdagangan dan Industri/Trading and Industry 15 233 15 481
Badan Sosial/Social Institution 4 689 4 732
Umum/Public 4 000 4 011
Instansi Pemerintah/Government Institution 6 348 7 116
Lainnya /Others 1 378 7 629
Jumlah/Total 181 380 191 026
Sumber : Badan Pusat Statistik Propinsi Jawa Barat Source : BPS – Statistics of Jawa Barat Catatan/Notes : *) Angka Perbaikan/Revised Figure **) Angka Sementara/Preliminary Figure
Jawa Barat Dalam Angka 2004/2005 342
MANUFACTURING, QUARRYING AND ENERGY
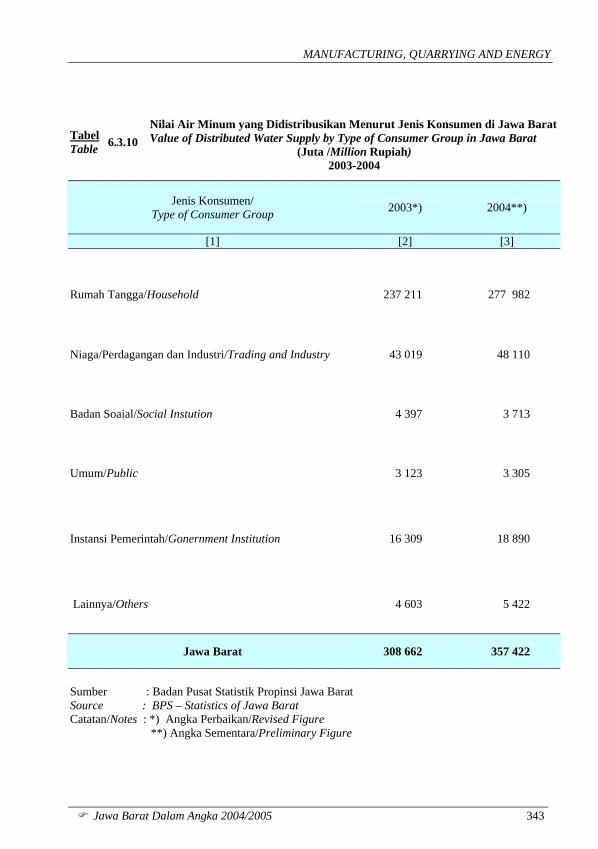
Tabel Table 6.3.10
Nilai Air Minum yang Didistribusikan Menurut Jenis Konsumen di Jawa Barat Value of Distributed Water Supply by Type of Consumer Group in Jawa Barat
(Juta /Million Rupiah) 2003-2004
Jenis Konsumen/ Type of Consumer Group 2003*) 2004**)
[1] [2] [3]
Rumah Tangga/Household 237 211 277 982
Niaga/Perdagangan dan Industri/Trading and Industry 43 019 48 110
Badan Soaial/Social Instution 4 397 3 713
Umum/Public 3 123 3 305
Instansi Pemerintah/Gonernment Institution 16 309 18 890
Lainnya/Others 4 603 5 422
Jawa Barat 308 662 357 422
Sumber : Badan Pusat Statistik Propinsi Jawa Barat Source : BPS – Statistics of Jawa Barat Catatan/Notes : *) Angka Perbaikan/Revised Figure **) Angka Sementara/Preliminary Figure
Jawa Barat Dalam Angka 2004/2005 343