pengumuman equity research pt intiland development tbk ... · pefindo credit rating indonesia...
TRANSCRIPT
PENGUMUMAN
Equity Research PT Intiland Development Tbk. (DILD) (Tercatat Di Papan : Pengembangan) No.Peng-ER-00014/BEI.PPJ/06-2012
(dapat dilihat di laman: http://www.idx.co.id) PT Bursa Efek Indonesia pada tanggal 18 Juni 2012 telah menerima surat melalui email dari PT Pemeringkat Efek Indonesia dengan No. 1034/PEF-DIR/VI/2012 tanggal 15 Juni 2012 mengenai Publikasi Laporan Penilaian Target Harga Referensi Saham PT Intiland Development Tbk. sebagaimana terlampir (39 lembar). Demikian untuk diketahui.
19 Juni 2012
Umi Kulsum Eko Siswanto Kepala Divisi Penilaian Perusahaan Sektor Jasa P.H. Kepala Divisi Perdagangan Saham Tembusan: 1. Yth. Ketua Badan Pengawas Pasar Modal dan LK; 2. Yth. Kepala Biro Transaksi dan Lembaga Efek Bapepam dan LK; 3. Yth. Kepala Biro PKP Sektor Jasa Bapepam dan LK; 4. Yth. Pengurus Pusat Referensi Pasar Modal; 5. Yth. Direksi PT Intiland Development Tbk.
psu_DILD_er_20120619_14
-~.PEFINDO CREDIT RATING INDONESIA
1034/PEF-DIR/VI/2012
lakarta, 15 luni 2012
Kepada Yth.1. PT Intiland Development TbkIntiland Tower, Penthouse FloorJI. Jendral Sudirman Kav. 32Jakarta, 10220
u.p. Bapak Archied Noto Pradono, Executive Director & Investment ManagementIbu Theresia Rustandi, Corporate Secretary
2. PT Bursa Efek IndonesiaGedung Bursa Efek IndonesiaJI. Jend. Sudirman Kav 52-53Jakarta Selatan, 12190
u.p. Bapak Ito Warsito, Direktur UtamaBapak Eddy Sugito, Direktur Penilaiari Perusahaan
Perihal: Publikasi Laporan Penilaian Target Harga Referensi Saham PT IntilandDevelopment Tbk.
Dengan hormat,
Sehubungan dengan penugasan yang kami peroleh untuk melakukan Penilaian Target HargaReferensi Saham, dengan ini kami sampaikan hasil penilaian kami atas saham PT IntilandDevelopment Tbk (DILD) dalam versi Bahasa Indonesia dan Bahasa Inggris.
Apabila masih ada hal-hal yang memerlukan penjelasan lebih lanjut, mohon agar menghubungi kami.Atas perhatian dan kerjasamanya, kami ucapkan terima kasih.
Hormat kami,
Ronald T. Andi Kasim, CFADirektur Utama
se Rizalirektur
Tembusan : Ibu Umi Kulsum, Kepala Divisi Pencatatan Sektor Jasa, PT Bursa Efek Indonesia
/gh
PT. Pemeringkat Efek IndonesiaPanin Tower Senayan City, 17th FloorJI. Asia Afrika Lot. 19, Jakarta 10270, INDONESIAPhone: (62-21) 7278 2380 • Fax: (62-21) 7278 2370
Halaman ke 1 dari 20
Kontak: Equity & Index Valuation Division Phone: (6221) 7278 2380 [email protected]
“Pernyataan disclaimer pada halaman akhir
merupakan bagian yang tidak terpisahkan dari
dokumen ini”
www.pefindo.com
Intiland Development, Tbk Laporan Kedua
Equity Valuation
13 Juni 2012
Target Harga
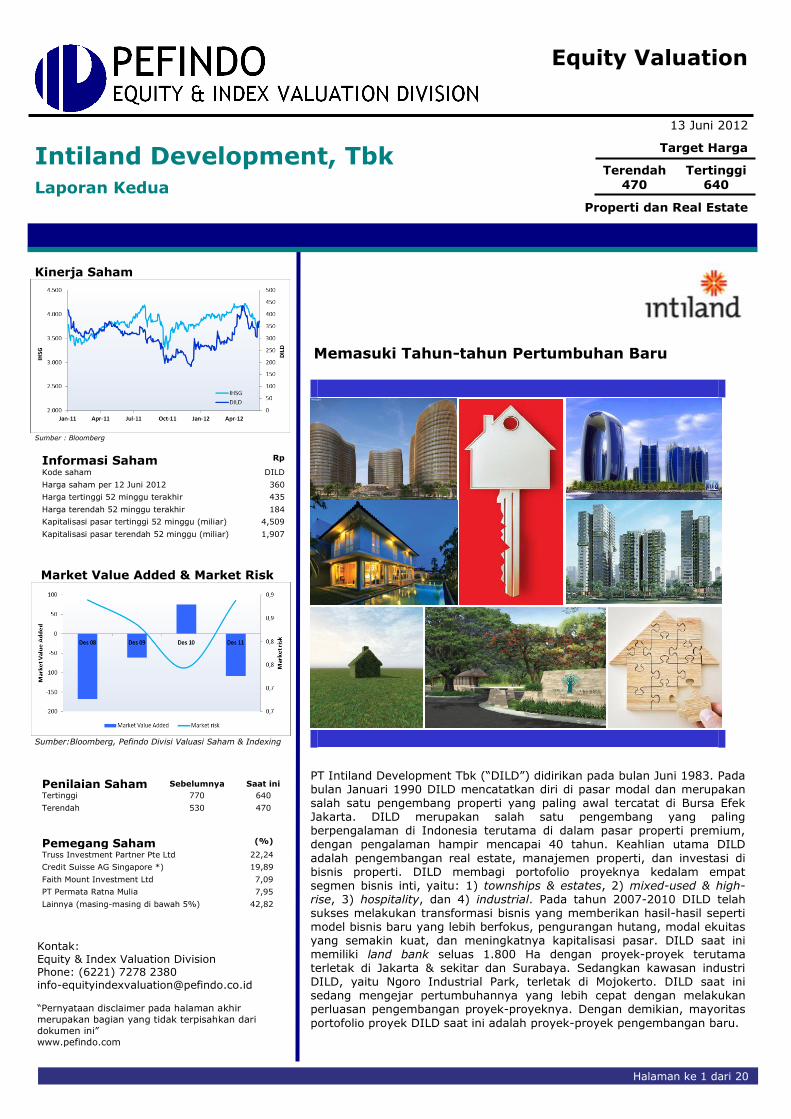
Terendah Tertinggi 470 640
Properti dan Real Estate
Kinerja Saham
Sumber : Bloomberg
Informasi Saham Rp
Kode saham DILD
Harga saham per 12 Juni 2012 360
Harga tertinggi 52 minggu terakhir 435
Harga terendah 52 minggu terakhir 184
Kapitalisasi pasar tertinggi 52 minggu (miliar) 4,509
Kapitalisasi pasar terendah 52 minggu (miliar) 1,907
Market Value Added & Market Risk
Sumber:Bloomberg, Pefindo Divisi Valuasi Saham & Indexing
Penilaian Saham Sebelumnya Saat ini
Tertinggi 770 640
Terendah 530 470
Pemegang Saham (%)
Truss Investment Partner Pte Ltd 22,24
Credit Suisse AG Singapore *) 19,89
Faith Mount Investment Ltd 7,09
PT Permata Ratna Mulia 7,95
Lainnya (masing-masing di bawah 5%) 42,82
Memasuki Tahun-tahun Pertumbuhan Baru
PT Intiland Development Tbk (“DILD”) didirikan pada bulan Juni 1983. Pada bulan Januari 1990 DILD mencatatkan diri di pasar modal dan merupakan salah satu pengembang properti yang paling awal tercatat di Bursa Efek Jakarta. DILD merupakan salah satu pengembang yang paling berpengalaman di Indonesia terutama di dalam pasar properti premium, dengan pengalaman hampir mencapai 40 tahun. Keahlian utama DILD
adalah pengembangan real estate, manajemen properti, dan investasi di bisnis properti. DILD membagi portofolio proyeknya kedalam empat segmen bisnis inti, yaitu: 1) townships & estates, 2) mixed-used & high-rise, 3) hospitality, dan 4) industrial. Pada tahun 2007-2010 DILD telah sukses melakukan transformasi bisnis yang memberikan hasil-hasil seperti model bisnis baru yang lebih berfokus, pengurangan hutang, modal ekuitas yang semakin kuat, dan meningkatnya kapitalisasi pasar. DILD saat ini memiliki land bank seluas 1.800 Ha dengan proyek-proyek terutama terletak di Jakarta & sekitar dan Surabaya. Sedangkan kawasan industri DILD, yaitu Ngoro Industrial Park, terletak di Mojokerto. DILD saat ini sedang mengejar pertumbuhannya yang lebih cepat dengan melakukan perluasan pengembangan proyek-proyeknya. Dengan demikian, mayoritas
portofolio proyek DILD saat ini adalah proyek-proyek pengembangan baru.
“Pernyataan disclaimer pada halaman
akhir merupakan bagian yang tidak
terpisahkan dari dokumen ini”
www.pefindo.com
Intiland Development, Tbk
13 Juni 2012 Halaman 2 dari 20
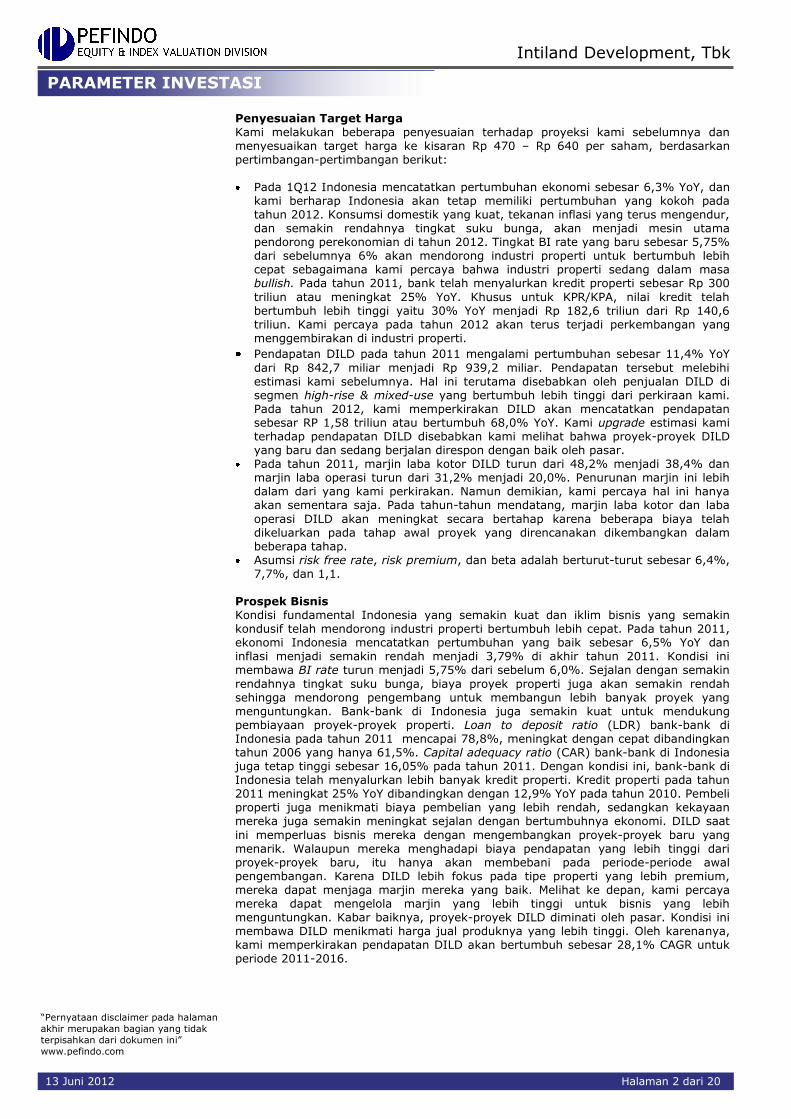
Penyesuaian Target Harga
Kami melakukan beberapa penyesuaian terhadap proyeksi kami sebelumnya dan menyesuaikan target harga ke kisaran Rp 470 – Rp 640 per saham, berdasarkan pertimbangan-pertimbangan berikut: Pada 1Q12 Indonesia mencatatkan pertumbuhan ekonomi sebesar 6,3% YoY, dan
kami berharap Indonesia akan tetap memiliki pertumbuhan yang kokoh pada tahun 2012. Konsumsi domestik yang kuat, tekanan inflasi yang terus mengendur, dan semakin rendahnya tingkat suku bunga, akan menjadi mesin utama pendorong perekonomian di tahun 2012. Tingkat BI rate yang baru sebesar 5,75% dari sebelumnya 6% akan mendorong industri properti untuk bertumbuh lebih cepat sebagaimana kami percaya bahwa industri properti sedang dalam masa bullish. Pada tahun 2011, bank telah menyalurkan kredit properti sebesar Rp 300
triliun atau meningkat 25% YoY. Khusus untuk KPR/KPA, nilai kredit telah bertumbuh lebih tinggi yaitu 30% YoY menjadi Rp 182,6 triliun dari Rp 140,6 triliun. Kami percaya pada tahun 2012 akan terus terjadi perkembangan yang menggembirakan di industri properti.
Pendapatan DILD pada tahun 2011 mengalami pertumbuhan sebesar 11,4% YoY
dari Rp 842,7 miliar menjadi Rp 939,2 miliar. Pendapatan tersebut melebihi estimasi kami sebelumnya. Hal ini terutama disebabkan oleh penjualan DILD di segmen high-rise & mixed-use yang bertumbuh lebih tinggi dari perkiraan kami. Pada tahun 2012, kami memperkirakan DILD akan mencatatkan pendapatan sebesar RP 1,58 triliun atau bertumbuh 68,0% YoY. Kami upgrade estimasi kami terhadap pendapatan DILD disebabkan kami melihat bahwa proyek-proyek DILD yang baru dan sedang berjalan direspon dengan baik oleh pasar.
Pada tahun 2011, marjin laba kotor DILD turun dari 48,2% menjadi 38,4% dan marjin laba operasi turun dari 31,2% menjadi 20,0%. Penurunan marjin ini lebih dalam dari yang kami perkirakan. Namun demikian, kami percaya hal ini hanya akan sementara saja. Pada tahun-tahun mendatang, marjin laba kotor dan laba
operasi DILD akan meningkat secara bertahap karena beberapa biaya telah dikeluarkan pada tahap awal proyek yang direncanakan dikembangkan dalam beberapa tahap.
Asumsi risk free rate, risk premium, dan beta adalah berturut-turut sebesar 6,4%, 7,7%, dan 1,1.
Prospek Bisnis Kondisi fundamental Indonesia yang semakin kuat dan iklim bisnis yang semakin kondusif telah mendorong industri properti bertumbuh lebih cepat. Pada tahun 2011, ekonomi Indonesia mencatatkan pertumbuhan yang baik sebesar 6,5% YoY dan inflasi menjadi semakin rendah menjadi 3,79% di akhir tahun 2011. Kondisi ini membawa BI rate turun menjadi 5,75% dari sebelum 6,0%. Sejalan dengan semakin
rendahnya tingkat suku bunga, biaya proyek properti juga akan semakin rendah sehingga mendorong pengembang untuk membangun lebih banyak proyek yang menguntungkan. Bank-bank di Indonesia juga semakin kuat untuk mendukung pembiayaan proyek-proyek properti. Loan to deposit ratio (LDR) bank-bank di Indonesia pada tahun 2011 mencapai 78,8%, meningkat dengan cepat dibandingkan tahun 2006 yang hanya 61,5%. Capital adequacy ratio (CAR) bank-bank di Indonesia juga tetap tinggi sebesar 16,05% pada tahun 2011. Dengan kondisi ini, bank-bank di Indonesia telah menyalurkan lebih banyak kredit properti. Kredit properti pada tahun 2011 meningkat 25% YoY dibandingkan dengan 12,9% YoY pada tahun 2010. Pembeli properti juga menikmati biaya pembelian yang lebih rendah, sedangkan kekayaan mereka juga semakin meningkat sejalan dengan bertumbuhnya ekonomi. DILD saat
ini memperluas bisnis mereka dengan mengembangkan proyek-proyek baru yang menarik. Walaupun mereka menghadapi biaya pendapatan yang lebih tinggi dari proyek-proyek baru, itu hanya akan membebani pada periode-periode awal pengembangan. Karena DILD lebih fokus pada tipe properti yang lebih premium, mereka dapat menjaga marjin mereka yang baik. Melihat ke depan, kami percaya mereka dapat mengelola marjin yang lebih tinggi untuk bisnis yang lebih menguntungkan. Kabar baiknya, proyek-proyek DILD diminati oleh pasar. Kondisi ini membawa DILD menikmati harga jual produknya yang lebih tinggi. Oleh karenanya, kami memperkirakan pendapatan DILD akan bertumbuh sebesar 28,1% CAGR untuk periode 2011-2016.
PARAMETER INVESTASI
“Pernyataan disclaimer pada halaman
akhir merupakan bagian yang tidak
terpisahkan dari dokumen ini”
www.pefindo.com
Intiland Development, Tbk
13 Juni 2012 Halaman 3 dari 20
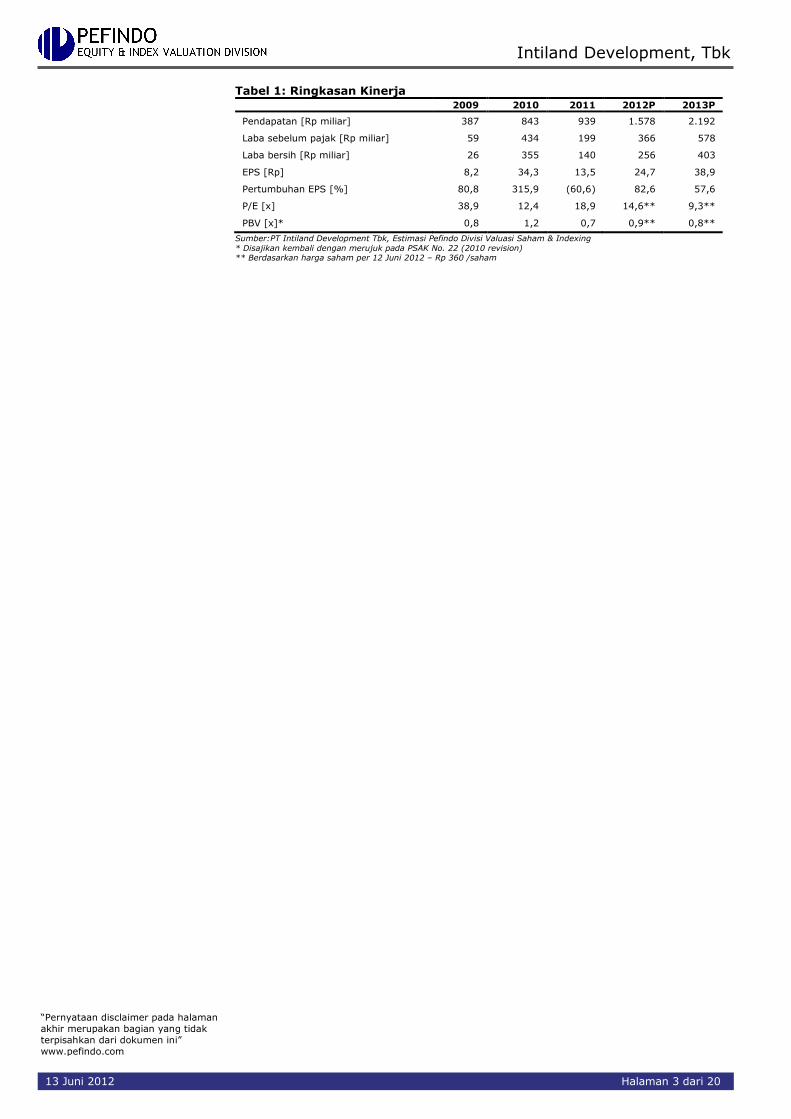
Tabel 1: Ringkasan Kinerja 2009 2010 2011 2012P 2013P
Pendapatan [Rp miliar] 387 843 939 1.578 2.192
Laba sebelum pajak [Rp miliar] 59 434 199 366 578
Laba bersih [Rp miliar] 26 355 140 256 403
EPS [Rp] 8,2 34,3 13,5 24,7 38,9
Pertumbuhan EPS [%] 80,8 315,9 (60,6) 82,6 57,6
P/E [x] 38,9 12,4 18,9 14,6** 9,3**
PBV [x]* 0,8 1,2 0,7 0,9** 0,8**
Sumber:PT Intiland Development Tbk, Estimasi Pefindo Divisi Valuasi Saham & Indexing
* Disajikan kembali dengan merujuk pada PSAK No. 22 (2010 revision) ** Berdasarkan harga saham per 12 Juni 2012 – Rp 360 /saham
“Pernyataan disclaimer pada halaman
akhir merupakan bagian yang tidak
terpisahkan dari dokumen ini”
www.pefindo.com
Intiland Development, Tbk
13 Juni 2012 Halaman 4 dari 20
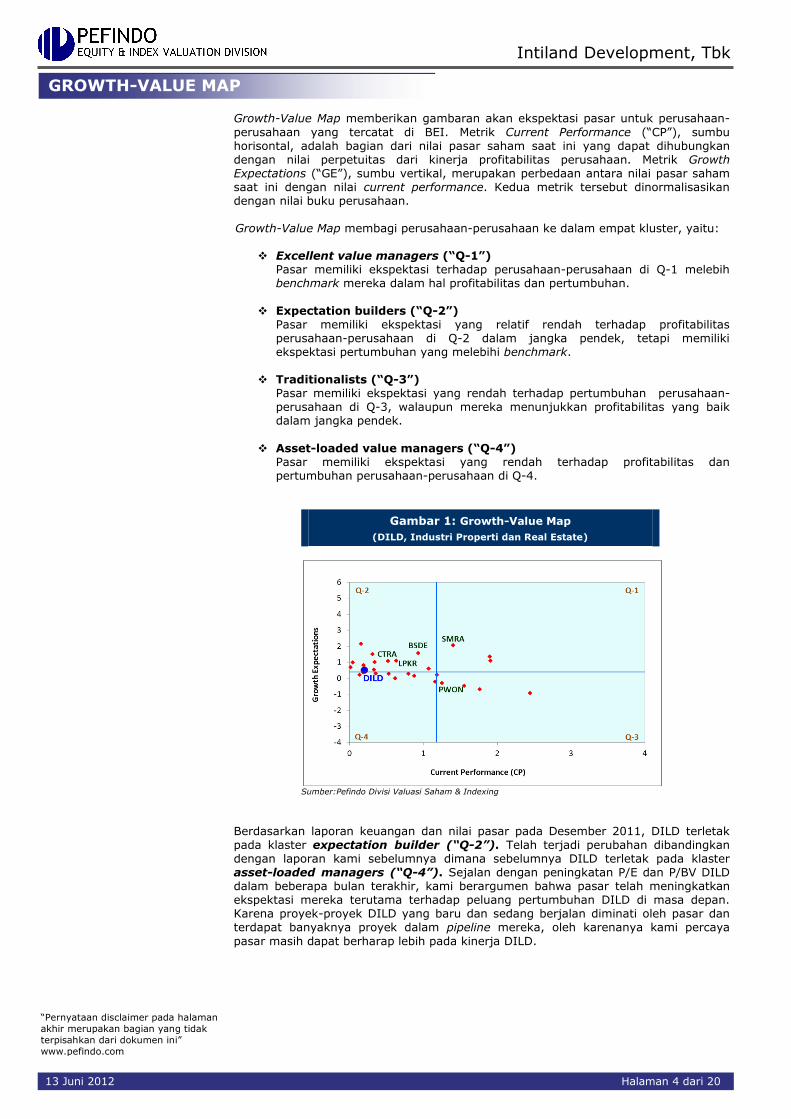
Growth-Value Map memberikan gambaran akan ekspektasi pasar untuk perusahaan-
perusahaan yang tercatat di BEI. Metrik Current Performance (“CP”), sumbu horisontal, adalah bagian dari nilai pasar saham saat ini yang dapat dihubungkan dengan nilai perpetuitas dari kinerja profitabilitas perusahaan. Metrik Growth Expectations (“GE”), sumbu vertikal, merupakan perbedaan antara nilai pasar saham saat ini dengan nilai current performance. Kedua metrik tersebut dinormalisasikan dengan nilai buku perusahaan. Growth-Value Map membagi perusahaan-perusahaan ke dalam empat kluster, yaitu:
Excellent value managers (“Q-1”) Pasar memiliki ekspektasi terhadap perusahaan-perusahaan di Q-1 melebih benchmark mereka dalam hal profitabilitas dan pertumbuhan.
Expectation builders (“Q-2”)
Pasar memiliki ekspektasi yang relatif rendah terhadap profitabilitas perusahaan-perusahaan di Q-2 dalam jangka pendek, tetapi memiliki ekspektasi pertumbuhan yang melebihi benchmark.
Traditionalists (“Q-3”) Pasar memiliki ekspektasi yang rendah terhadap pertumbuhan perusahaan-perusahaan di Q-3, walaupun mereka menunjukkan profitabilitas yang baik dalam jangka pendek.
Asset-loaded value managers (“Q-4”) Pasar memiliki ekspektasi yang rendah terhadap profitabilitas dan pertumbuhan perusahaan-perusahaan di Q-4.
Gambar 1: Growth-Value Map
(DILD, Industri Properti dan Real Estate)
Sumber:Pefindo Divisi Valuasi Saham & Indexing
Berdasarkan laporan keuangan dan nilai pasar pada Desember 2011, DILD terletak pada klaster expectation builder (“Q-2”). Telah terjadi perubahan dibandingkan dengan laporan kami sebelumnya dimana sebelumnya DILD terletak pada klaster asset-loaded managers (“Q-4”). Sejalan dengan peningkatan P/E dan P/BV DILD dalam beberapa bulan terakhir, kami berargumen bahwa pasar telah meningkatkan ekspektasi mereka terutama terhadap peluang pertumbuhan DILD di masa depan. Karena proyek-proyek DILD yang baru dan sedang berjalan diminati oleh pasar dan terdapat banyaknya proyek dalam pipeline mereka, oleh karenanya kami percaya
pasar masih dapat berharap lebih pada kinerja DILD.
GROWTH-VALUE MAP
“Pernyataan disclaimer pada halaman
akhir merupakan bagian yang tidak
terpisahkan dari dokumen ini”
www.pefindo.com
Intiland Development, Tbk
13 Juni 2012 Halaman 5 dari 20
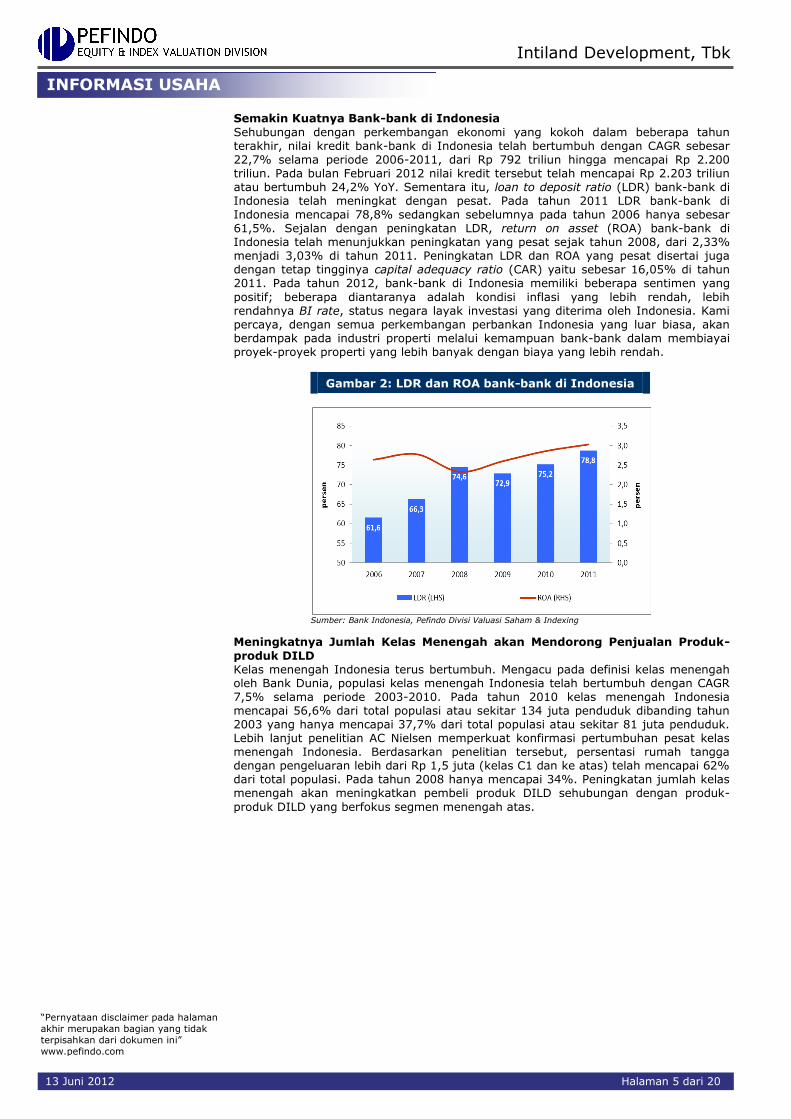
Semakin Kuatnya Bank-bank di Indonesia
Sehubungan dengan perkembangan ekonomi yang kokoh dalam beberapa tahun terakhir, nilai kredit bank-bank di Indonesia telah bertumbuh dengan CAGR sebesar 22,7% selama periode 2006-2011, dari Rp 792 triliun hingga mencapai Rp 2.200 triliun. Pada bulan Februari 2012 nilai kredit tersebut telah mencapai Rp 2.203 triliun atau bertumbuh 24,2% YoY. Sementara itu, loan to deposit ratio (LDR) bank-bank di Indonesia telah meningkat dengan pesat. Pada tahun 2011 LDR bank-bank di Indonesia mencapai 78,8% sedangkan sebelumnya pada tahun 2006 hanya sebesar 61,5%. Sejalan dengan peningkatan LDR, return on asset (ROA) bank-bank di Indonesia telah menunjukkan peningkatan yang pesat sejak tahun 2008, dari 2,33% menjadi 3,03% di tahun 2011. Peningkatan LDR dan ROA yang pesat disertai juga dengan tetap tingginya capital adequacy ratio (CAR) yaitu sebesar 16,05% di tahun 2011. Pada tahun 2012, bank-bank di Indonesia memiliki beberapa sentimen yang
positif; beberapa diantaranya adalah kondisi inflasi yang lebih rendah, lebih rendahnya BI rate, status negara layak investasi yang diterima oleh Indonesia. Kami percaya, dengan semua perkembangan perbankan Indonesia yang luar biasa, akan berdampak pada industri properti melalui kemampuan bank-bank dalam membiayai proyek-proyek properti yang lebih banyak dengan biaya yang lebih rendah.
Gambar 2: LDR dan ROA bank-bank di Indonesia
Sumber: Bank Indonesia, Pefindo Divisi Valuasi Saham & Indexing
Meningkatnya Jumlah Kelas Menengah akan Mendorong Penjualan Produk-
produk DILD Kelas menengah Indonesia terus bertumbuh. Mengacu pada definisi kelas menengah oleh Bank Dunia, populasi kelas menengah Indonesia telah bertumbuh dengan CAGR 7,5% selama periode 2003-2010. Pada tahun 2010 kelas menengah Indonesia mencapai 56,6% dari total populasi atau sekitar 134 juta penduduk dibanding tahun 2003 yang hanya mencapai 37,7% dari total populasi atau sekitar 81 juta penduduk. Lebih lanjut penelitian AC Nielsen memperkuat konfirmasi pertumbuhan pesat kelas menengah Indonesia. Berdasarkan penelitian tersebut, persentasi rumah tangga dengan pengeluaran lebih dari Rp 1,5 juta (kelas C1 dan ke atas) telah mencapai 62% dari total populasi. Pada tahun 2008 hanya mencapai 34%. Peningkatan jumlah kelas menengah akan meningkatkan pembeli produk DILD sehubungan dengan produk-
produk DILD yang berfokus segmen menengah atas.
INFORMASI USAHA
“Pernyataan disclaimer pada halaman
akhir merupakan bagian yang tidak
terpisahkan dari dokumen ini”
www.pefindo.com
Intiland Development, Tbk
13 Juni 2012 Halaman 6 dari 20
Gambar 3: Pertumbuhan Kelas Menengah Indonesia
* Kelas pengeluaran diklasfikasi dalam satuan Rupiah
Sumber: AC Nielsen, Pefindo Divisi Valuasi Saham & Indexing
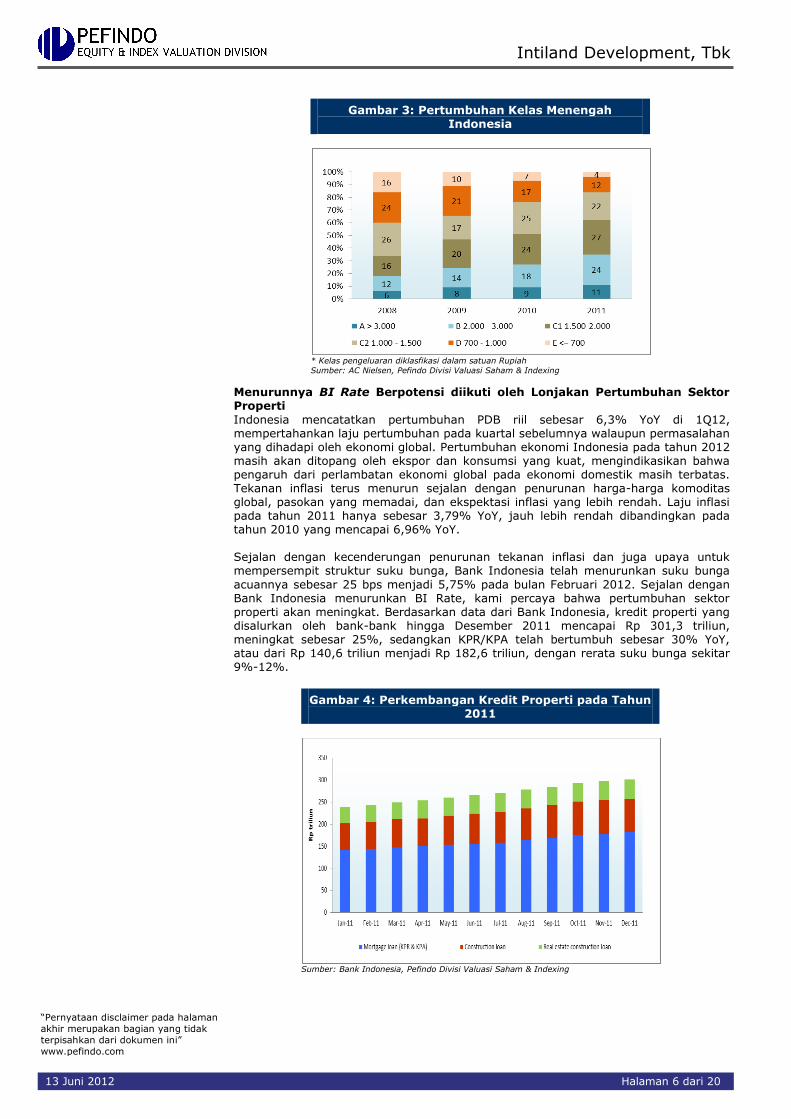
Menurunnya BI Rate Berpotensi diikuti oleh Lonjakan Pertumbuhan Sektor Properti
Indonesia mencatatkan pertumbuhan PDB riil sebesar 6,3% YoY di 1Q12, mempertahankan laju pertumbuhan pada kuartal sebelumnya walaupun permasalahan yang dihadapi oleh ekonomi global. Pertumbuhan ekonomi Indonesia pada tahun 2012 masih akan ditopang oleh ekspor dan konsumsi yang kuat, mengindikasikan bahwa pengaruh dari perlambatan ekonomi global pada ekonomi domestik masih terbatas. Tekanan inflasi terus menurun sejalan dengan penurunan harga-harga komoditas global, pasokan yang memadai, dan ekspektasi inflasi yang lebih rendah. Laju inflasi pada tahun 2011 hanya sebesar 3,79% YoY, jauh lebih rendah dibandingkan pada tahun 2010 yang mencapai 6,96% YoY. Sejalan dengan kecenderungan penurunan tekanan inflasi dan juga upaya untuk mempersempit struktur suku bunga, Bank Indonesia telah menurunkan suku bunga
acuannya sebesar 25 bps menjadi 5,75% pada bulan Februari 2012. Sejalan dengan Bank Indonesia menurunkan BI Rate, kami percaya bahwa pertumbuhan sektor properti akan meningkat. Berdasarkan data dari Bank Indonesia, kredit properti yang disalurkan oleh bank-bank hingga Desember 2011 mencapai Rp 301,3 triliun, meningkat sebesar 25%, sedangkan KPR/KPA telah bertumbuh sebesar 30% YoY, atau dari Rp 140,6 triliun menjadi Rp 182,6 triliun, dengan rerata suku bunga sekitar 9%-12%.
Gambar 4: Perkembangan Kredit Properti pada Tahun 2011
Sumber: Bank Indonesia, Pefindo Divisi Valuasi Saham & Indexing
“Pernyataan disclaimer pada halaman
akhir merupakan bagian yang tidak
terpisahkan dari dokumen ini”
www.pefindo.com
Intiland Development, Tbk
13 Juni 2012 Halaman 7 dari 20
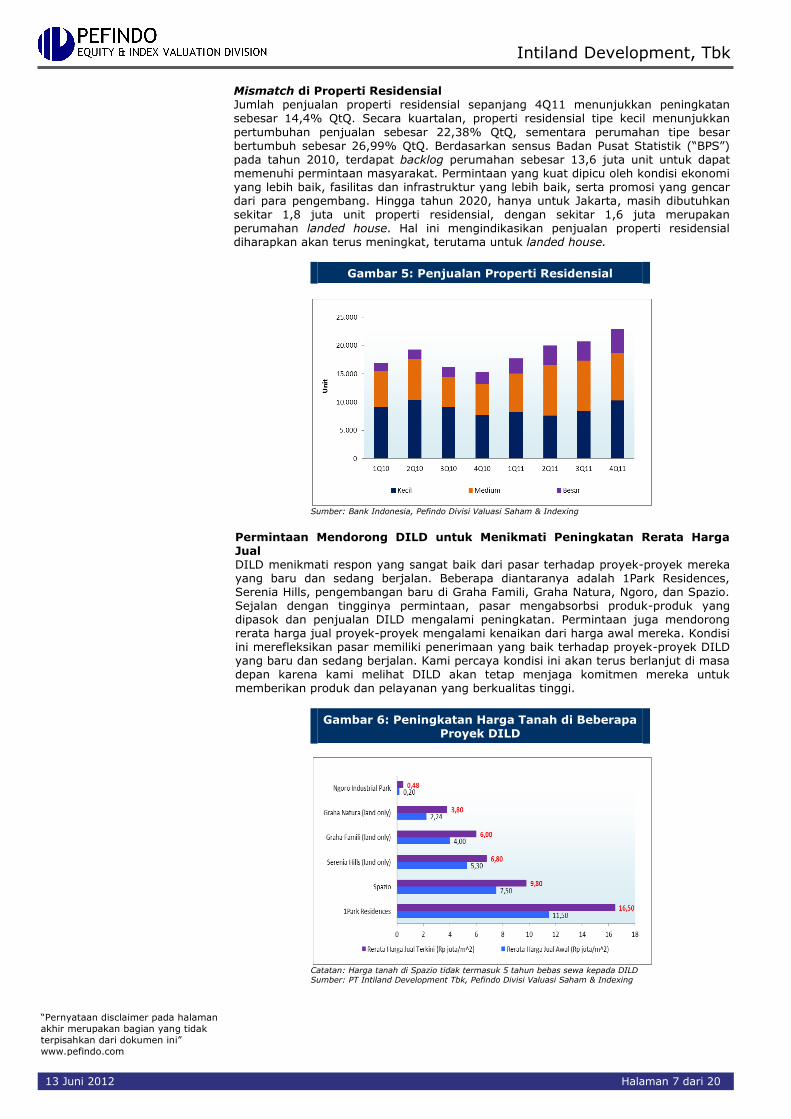
Mismatch di Properti Residensial Jumlah penjualan properti residensial sepanjang 4Q11 menunjukkan peningkatan sebesar 14,4% QtQ. Secara kuartalan, properti residensial tipe kecil menunjukkan
pertumbuhan penjualan sebesar 22,38% QtQ, sementara perumahan tipe besar bertumbuh sebesar 26,99% QtQ. Berdasarkan sensus Badan Pusat Statistik (“BPS”) pada tahun 2010, terdapat backlog perumahan sebesar 13,6 juta unit untuk dapat memenuhi permintaan masyarakat. Permintaan yang kuat dipicu oleh kondisi ekonomi yang lebih baik, fasilitas dan infrastruktur yang lebih baik, serta promosi yang gencar dari para pengembang. Hingga tahun 2020, hanya untuk Jakarta, masih dibutuhkan sekitar 1,8 juta unit properti residensial, dengan sekitar 1,6 juta merupakan perumahan landed house. Hal ini mengindikasikan penjualan properti residensial diharapkan akan terus meningkat, terutama untuk landed house.
Gambar 5: Penjualan Properti Residensial
Sumber: Bank Indonesia, Pefindo Divisi Valuasi Saham & Indexing
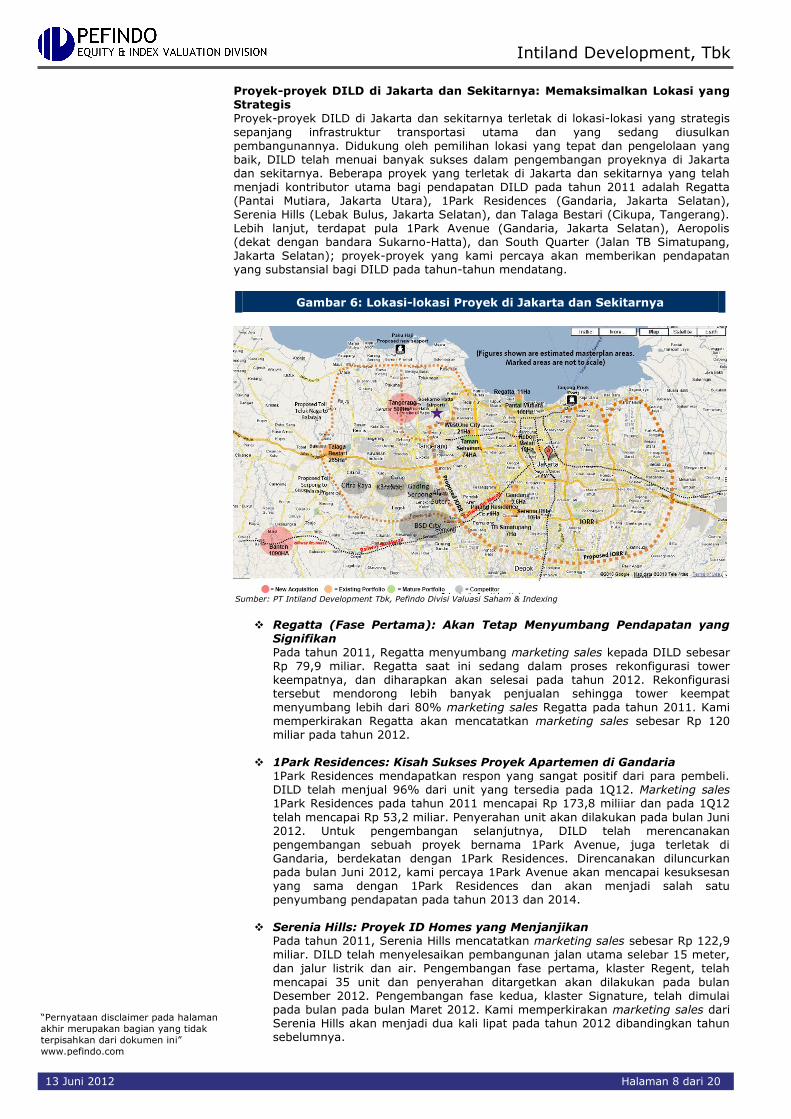
Permintaan Mendorong DILD untuk Menikmati Peningkatan Rerata Harga Jual DILD menikmati respon yang sangat baik dari pasar terhadap proyek-proyek mereka yang baru dan sedang berjalan. Beberapa diantaranya adalah 1Park Residences, Serenia Hills, pengembangan baru di Graha Famili, Graha Natura, Ngoro, dan Spazio. Sejalan dengan tingginya permintaan, pasar mengabsorbsi produk-produk yang dipasok dan penjualan DILD mengalami peningkatan. Permintaan juga mendorong rerata harga jual proyek-proyek mengalami kenaikan dari harga awal mereka. Kondisi ini merefleksikan pasar memiliki penerimaan yang baik terhadap proyek-proyek DILD yang baru dan sedang berjalan. Kami percaya kondisi ini akan terus berlanjut di masa depan karena kami melihat DILD akan tetap menjaga komitmen mereka untuk memberikan produk dan pelayanan yang berkualitas tinggi.
Gambar 6: Peningkatan Harga Tanah di Beberapa Proyek DILD
Catatan: Harga tanah di Spazio tidak termasuk 5 tahun bebas sewa kepada DILD Sumber: PT Intiland Development Tbk, Pefindo Divisi Valuasi Saham & Indexing
“Pernyataan disclaimer pada halaman
akhir merupakan bagian yang tidak
terpisahkan dari dokumen ini”
www.pefindo.com
Intiland Development, Tbk
13 Juni 2012 Halaman 8 dari 20
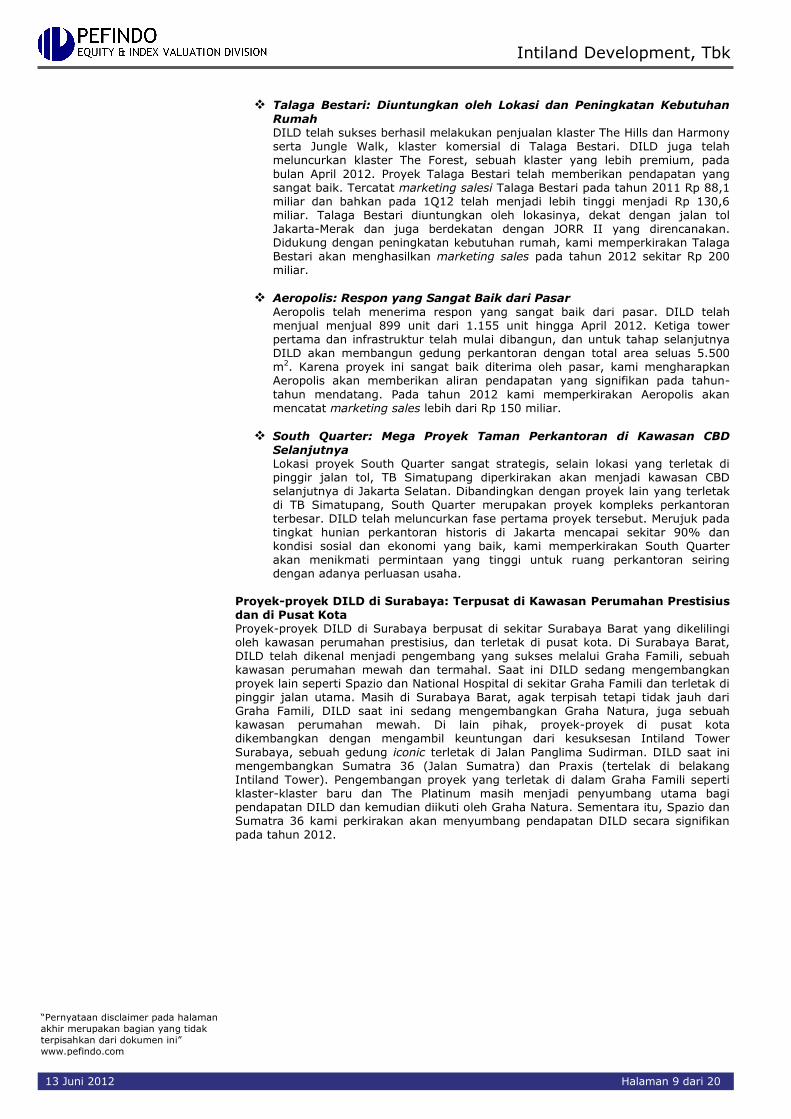
Proyek-proyek DILD di Jakarta dan Sekitarnya: Memaksimalkan Lokasi yang Strategis Proyek-proyek DILD di Jakarta dan sekitarnya terletak di lokasi-lokasi yang strategis
sepanjang infrastruktur transportasi utama dan yang sedang diusulkan pembangunannya. Didukung oleh pemilihan lokasi yang tepat dan pengelolaan yang baik, DILD telah menuai banyak sukses dalam pengembangan proyeknya di Jakarta dan sekitarnya. Beberapa proyek yang terletak di Jakarta dan sekitarnya yang telah menjadi kontributor utama bagi pendapatan DILD pada tahun 2011 adalah Regatta (Pantai Mutiara, Jakarta Utara), 1Park Residences (Gandaria, Jakarta Selatan), Serenia Hills (Lebak Bulus, Jakarta Selatan), dan Talaga Bestari (Cikupa, Tangerang). Lebih lanjut, terdapat pula 1Park Avenue (Gandaria, Jakarta Selatan), Aeropolis (dekat dengan bandara Sukarno-Hatta), dan South Quarter (Jalan TB Simatupang, Jakarta Selatan); proyek-proyek yang kami percaya akan memberikan pendapatan yang substansial bagi DILD pada tahun-tahun mendatang.
Gambar 6: Lokasi-lokasi Proyek di Jakarta dan Sekitarnya
Sumber: PT Intiland Development Tbk, Pefindo Divisi Valuasi Saham & Indexing
Regatta (Fase Pertama): Akan Tetap Menyumbang Pendapatan yang
Signifikan
Pada tahun 2011, Regatta menyumbang marketing sales kepada DILD sebesar Rp 79,9 miliar. Regatta saat ini sedang dalam proses rekonfigurasi tower keempatnya, dan diharapkan akan selesai pada tahun 2012. Rekonfigurasi tersebut mendorong lebih banyak penjualan sehingga tower keempat menyumbang lebih dari 80% marketing sales Regatta pada tahun 2011. Kami memperkirakan Regatta akan mencatatkan marketing sales sebesar Rp 120 miliar pada tahun 2012.
1Park Residences: Kisah Sukses Proyek Apartemen di Gandaria
1Park Residences mendapatkan respon yang sangat positif dari para pembeli. DILD telah menjual 96% dari unit yang tersedia pada 1Q12. Marketing sales 1Park Residences pada tahun 2011 mencapai Rp 173,8 miliiar dan pada 1Q12
telah mencapai Rp 53,2 miliar. Penyerahan unit akan dilakukan pada bulan Juni 2012. Untuk pengembangan selanjutnya, DILD telah merencanakan pengembangan sebuah proyek bernama 1Park Avenue, juga terletak di Gandaria, berdekatan dengan 1Park Residences. Direncanakan diluncurkan pada bulan Juni 2012, kami percaya 1Park Avenue akan mencapai kesuksesan yang sama dengan 1Park Residences dan akan menjadi salah satu penyumbang pendapatan pada tahun 2013 dan 2014.
Serenia Hills: Proyek ID Homes yang Menjanjikan Pada tahun 2011, Serenia Hills mencatatkan marketing sales sebesar Rp 122,9 miliar. DILD telah menyelesaikan pembangunan jalan utama selebar 15 meter, dan jalur listrik dan air. Pengembangan fase pertama, klaster Regent, telah
mencapai 35 unit dan penyerahan ditargetkan akan dilakukan pada bulan Desember 2012. Pengembangan fase kedua, klaster Signature, telah dimulai pada bulan pada bulan Maret 2012. Kami memperkirakan marketing sales dari Serenia Hills akan menjadi dua kali lipat pada tahun 2012 dibandingkan tahun sebelumnya.
“Pernyataan disclaimer pada halaman
akhir merupakan bagian yang tidak
terpisahkan dari dokumen ini”
www.pefindo.com
Intiland Development, Tbk
13 Juni 2012 Halaman 9 dari 20
Talaga Bestari: Diuntungkan oleh Lokasi dan Peningkatan Kebutuhan
Rumah DILD telah sukses berhasil melakukan penjualan klaster The Hills dan Harmony serta Jungle Walk, klaster komersial di Talaga Bestari. DILD juga telah meluncurkan klaster The Forest, sebuah klaster yang lebih premium, pada
bulan April 2012. Proyek Talaga Bestari telah memberikan pendapatan yang sangat baik. Tercatat marketing salesi Talaga Bestari pada tahun 2011 Rp 88,1 miliar dan bahkan pada 1Q12 telah menjadi lebih tinggi menjadi Rp 130,6 miliar. Talaga Bestari diuntungkan oleh lokasinya, dekat dengan jalan tol Jakarta-Merak dan juga berdekatan dengan JORR II yang direncanakan. Didukung dengan peningkatan kebutuhan rumah, kami memperkirakan Talaga Bestari akan menghasilkan marketing sales pada tahun 2012 sekitar Rp 200 miliar.
Aeropolis: Respon yang Sangat Baik dari Pasar Aeropolis telah menerima respon yang sangat baik dari pasar. DILD telah menjual menjual 899 unit dari 1.155 unit hingga April 2012. Ketiga tower pertama dan infrastruktur telah mulai dibangun, dan untuk tahap selanjutnya DILD akan membangun gedung perkantoran dengan total area seluas 5.500 m2. Karena proyek ini sangat baik diterima oleh pasar, kami mengharapkan Aeropolis akan memberikan aliran pendapatan yang signifikan pada tahun-
tahun mendatang. Pada tahun 2012 kami memperkirakan Aeropolis akan mencatat marketing sales lebih dari Rp 150 miliar.
South Quarter: Mega Proyek Taman Perkantoran di Kawasan CBD
Selanjutnya Lokasi proyek South Quarter sangat strategis, selain lokasi yang terletak di pinggir jalan tol, TB Simatupang diperkirakan akan menjadi kawasan CBD selanjutnya di Jakarta Selatan. Dibandingkan dengan proyek lain yang terletak di TB Simatupang, South Quarter merupakan proyek kompleks perkantoran terbesar. DILD telah meluncurkan fase pertama proyek tersebut. Merujuk pada tingkat hunian perkantoran historis di Jakarta mencapai sekitar 90% dan kondisi sosial dan ekonomi yang baik, kami memperkirakan South Quarter akan menikmati permintaan yang tinggi untuk ruang perkantoran seiring dengan adanya perluasan usaha.
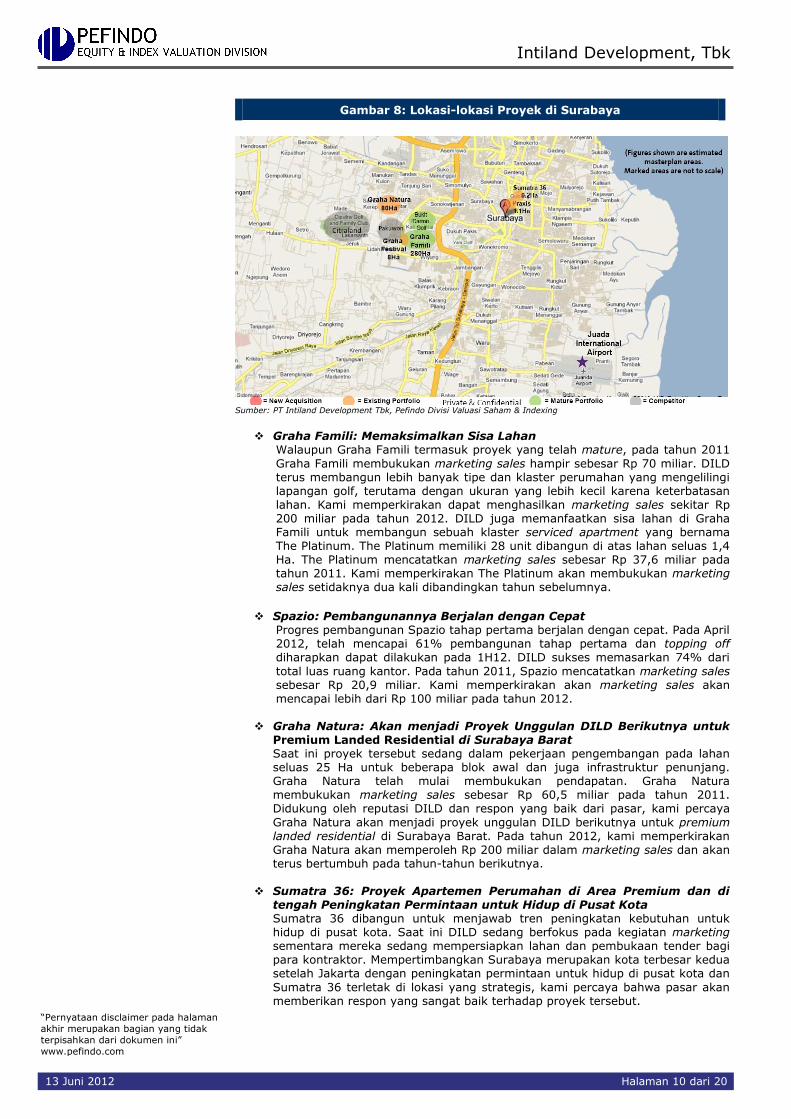
Proyek-proyek DILD di Surabaya: Terpusat di Kawasan Perumahan Prestisius dan di Pusat Kota Proyek-proyek DILD di Surabaya berpusat di sekitar Surabaya Barat yang dikelilingi oleh kawasan perumahan prestisius, dan terletak di pusat kota. Di Surabaya Barat, DILD telah dikenal menjadi pengembang yang sukses melalui Graha Famili, sebuah kawasan perumahan mewah dan termahal. Saat ini DILD sedang mengembangkan proyek lain seperti Spazio dan National Hospital di sekitar Graha Famili dan terletak di pinggir jalan utama. Masih di Surabaya Barat, agak terpisah tetapi tidak jauh dari Graha Famili, DILD saat ini sedang mengembangkan Graha Natura, juga sebuah kawasan perumahan mewah. Di lain pihak, proyek-proyek di pusat kota dikembangkan dengan mengambil keuntungan dari kesuksesan Intiland Tower
Surabaya, sebuah gedung iconic terletak di Jalan Panglima Sudirman. DILD saat ini mengembangkan Sumatra 36 (Jalan Sumatra) dan Praxis (tertelak di belakang Intiland Tower). Pengembangan proyek yang terletak di dalam Graha Famili seperti klaster-klaster baru dan The Platinum masih menjadi penyumbang utama bagi pendapatan DILD dan kemudian diikuti oleh Graha Natura. Sementara itu, Spazio dan Sumatra 36 kami perkirakan akan menyumbang pendapatan DILD secara signifikan pada tahun 2012.
“Pernyataan disclaimer pada halaman
akhir merupakan bagian yang tidak
terpisahkan dari dokumen ini”
www.pefindo.com
Intiland Development, Tbk
13 Juni 2012 Halaman 10 dari 20
Gambar 8: Lokasi-lokasi Proyek di Surabaya
Sumber: PT Intiland Development Tbk, Pefindo Divisi Valuasi Saham & Indexing
Graha Famili: Memaksimalkan Sisa Lahan Walaupun Graha Famili termasuk proyek yang telah mature, pada tahun 2011
Graha Famili membukukan marketing sales hampir sebesar Rp 70 miliar. DILD terus membangun lebih banyak tipe dan klaster perumahan yang mengelilingi lapangan golf, terutama dengan ukuran yang lebih kecil karena keterbatasan lahan. Kami memperkirakan dapat menghasilkan marketing sales sekitar Rp 200 miliar pada tahun 2012. DILD juga memanfaatkan sisa lahan di Graha Famili untuk membangun sebuah klaster serviced apartment yang bernama The Platinum. The Platinum memiliki 28 unit dibangun di atas lahan seluas 1,4 Ha. The Platinum mencatatkan marketing sales sebesar Rp 37,6 miliar pada tahun 2011. Kami memperkirakan The Platinum akan membukukan marketing sales setidaknya dua kali dibandingkan tahun sebelumnya.
Spazio: Pembangunannya Berjalan dengan Cepat
Progres pembangunan Spazio tahap pertama berjalan dengan cepat. Pada April 2012, telah mencapai 61% pembangunan tahap pertama dan topping off diharapkan dapat dilakukan pada 1H12. DILD sukses memasarkan 74% dari
total luas ruang kantor. Pada tahun 2011, Spazio mencatatkan marketing sales sebesar Rp 20,9 miliar. Kami memperkirakan akan marketing sales akan mencapai lebih dari Rp 100 miliar pada tahun 2012.
Graha Natura: Akan menjadi Proyek Unggulan DILD Berikutnya untuk Premium Landed Residential di Surabaya Barat Saat ini proyek tersebut sedang dalam pekerjaan pengembangan pada lahan seluas 25 Ha untuk beberapa blok awal dan juga infrastruktur penunjang. Graha Natura telah mulai membukukan pendapatan. Graha Natura membukukan marketing sales sebesar Rp 60,5 miliar pada tahun 2011. Didukung oleh reputasi DILD dan respon yang baik dari pasar, kami percaya
Graha Natura akan menjadi proyek unggulan DILD berikutnya untuk premium landed residential di Surabaya Barat. Pada tahun 2012, kami memperkirakan Graha Natura akan memperoleh Rp 200 miliar dalam marketing sales dan akan terus bertumbuh pada tahun-tahun berikutnya.
Sumatra 36: Proyek Apartemen Perumahan di Area Premium dan di
tengah Peningkatan Permintaan untuk Hidup di Pusat Kota Sumatra 36 dibangun untuk menjawab tren peningkatan kebutuhan untuk hidup di pusat kota. Saat ini DILD sedang berfokus pada kegiatan marketing sementara mereka sedang mempersiapkan lahan dan pembukaan tender bagi para kontraktor. Mempertimbangkan Surabaya merupakan kota terbesar kedua setelah Jakarta dengan peningkatan permintaan untuk hidup di pusat kota dan
Sumatra 36 terletak di lokasi yang strategis, kami percaya bahwa pasar akan memberikan respon yang sangat baik terhadap proyek tersebut.
“Pernyataan disclaimer pada halaman
akhir merupakan bagian yang tidak
terpisahkan dari dokumen ini”
www.pefindo.com
Intiland Development, Tbk
13 Juni 2012 Halaman 11 dari 20
Modern Hospital: Terletak di Kawasan Premium di Surabaya Barat Pembangunan National Hospital telah memasuki penyelesaian ditargetkan mulai beroperasi pada awal 2H12. Dikelilingi oleh kawasan perumahan
premium dan dilengkapi dengan teknologi kesehatan modern, National Hospita akan menjadi alternatif yang sangat baik bagi mereka yang mencari perawatan medis berkualitas tinggi di Surabaya dan Jawa Timur.
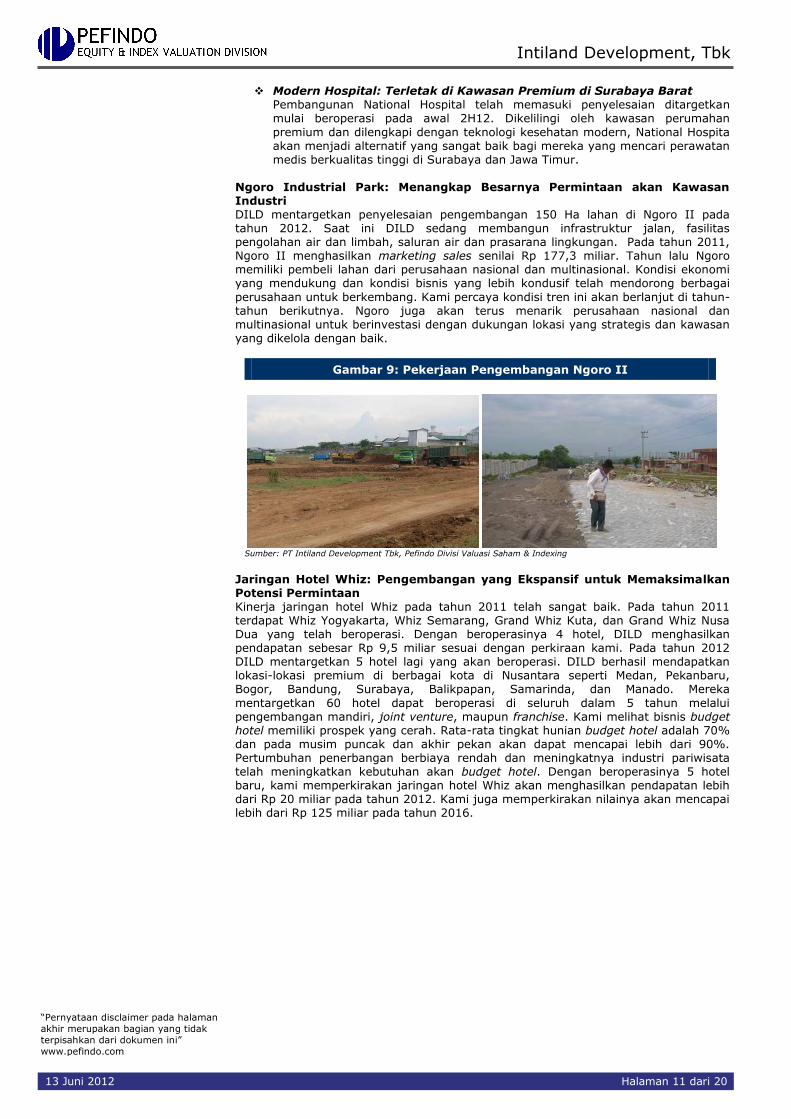
Ngoro Industrial Park: Menangkap Besarnya Permintaan akan Kawasan Industri DILD mentargetkan penyelesaian pengembangan 150 Ha lahan di Ngoro II pada tahun 2012. Saat ini DILD sedang membangun infrastruktur jalan, fasilitas pengolahan air dan limbah, saluran air dan prasarana lingkungan. Pada tahun 2011, Ngoro II menghasilkan marketing sales senilai Rp 177,3 miliar. Tahun lalu Ngoro memiliki pembeli lahan dari perusahaan nasional dan multinasional. Kondisi ekonomi yang mendukung dan kondisi bisnis yang lebih kondusif telah mendorong berbagai
perusahaan untuk berkembang. Kami percaya kondisi tren ini akan berlanjut di tahun-tahun berikutnya. Ngoro juga akan terus menarik perusahaan nasional dan multinasional untuk berinvestasi dengan dukungan lokasi yang strategis dan kawasan yang dikelola dengan baik.
Gambar 9: Pekerjaan Pengembangan Ngoro II
Sumber: PT Intiland Development Tbk, Pefindo Divisi Valuasi Saham & Indexing
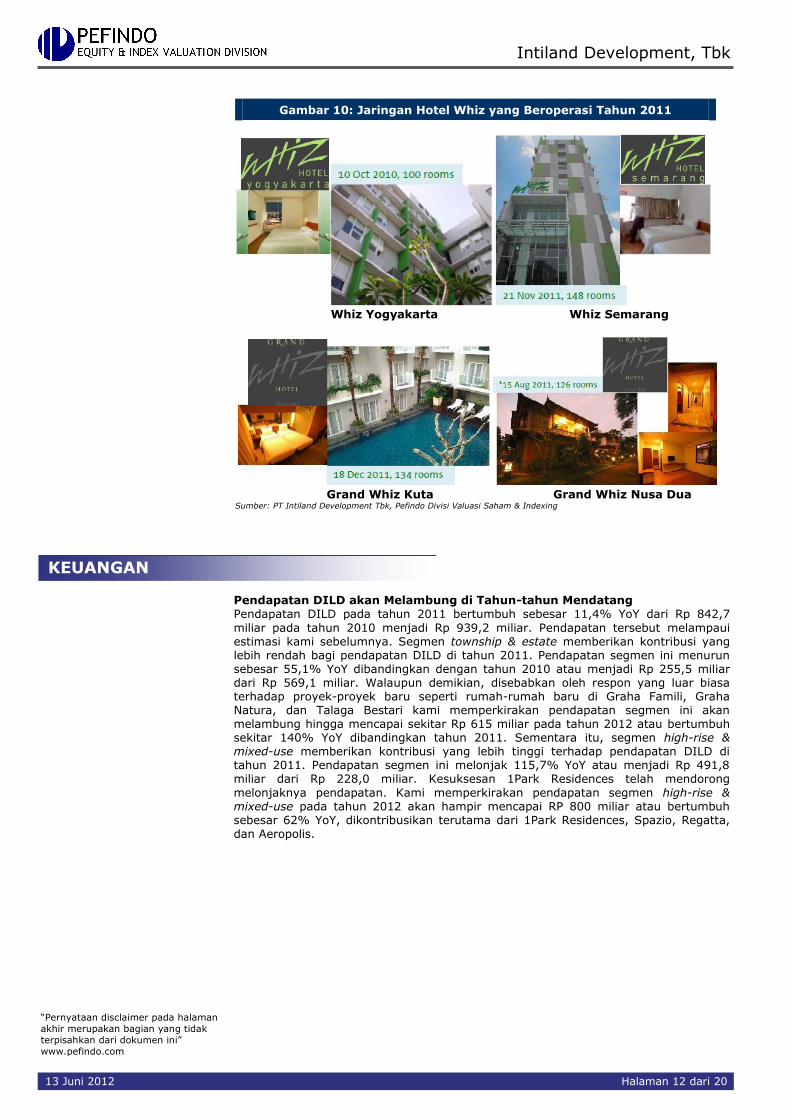
Jaringan Hotel Whiz: Pengembangan yang Ekspansif untuk Memaksimalkan Potensi Permintaan Kinerja jaringan hotel Whiz pada tahun 2011 telah sangat baik. Pada tahun 2011 terdapat Whiz Yogyakarta, Whiz Semarang, Grand Whiz Kuta, dan Grand Whiz Nusa Dua yang telah beroperasi. Dengan beroperasinya 4 hotel, DILD menghasilkan pendapatan sebesar Rp 9,5 miliar sesuai dengan perkiraan kami. Pada tahun 2012 DILD mentargetkan 5 hotel lagi yang akan beroperasi. DILD berhasil mendapatkan lokasi-lokasi premium di berbagai kota di Nusantara seperti Medan, Pekanbaru, Bogor, Bandung, Surabaya, Balikpapan, Samarinda, dan Manado. Mereka
mentargetkan 60 hotel dapat beroperasi di seluruh dalam 5 tahun melalui pengembangan mandiri, joint venture, maupun franchise. Kami melihat bisnis budget hotel memiliki prospek yang cerah. Rata-rata tingkat hunian budget hotel adalah 70% dan pada musim puncak dan akhir pekan akan dapat mencapai lebih dari 90%. Pertumbuhan penerbangan berbiaya rendah dan meningkatnya industri pariwisata telah meningkatkan kebutuhan akan budget hotel. Dengan beroperasinya 5 hotel baru, kami memperkirakan jaringan hotel Whiz akan menghasilkan pendapatan lebih dari Rp 20 miliar pada tahun 2012. Kami juga memperkirakan nilainya akan mencapai lebih dari Rp 125 miliar pada tahun 2016.
“Pernyataan disclaimer pada halaman
akhir merupakan bagian yang tidak
terpisahkan dari dokumen ini”
www.pefindo.com
Intiland Development, Tbk
13 Juni 2012 Halaman 12 dari 20
Gambar 10: Jaringan Hotel Whiz yang Beroperasi Tahun 2011
Whiz Yogyakarta Whiz Semarang
Grand Whiz Kuta Grand Whiz Nusa Dua Sumber: PT Intiland Development Tbk, Pefindo Divisi Valuasi Saham & Indexing
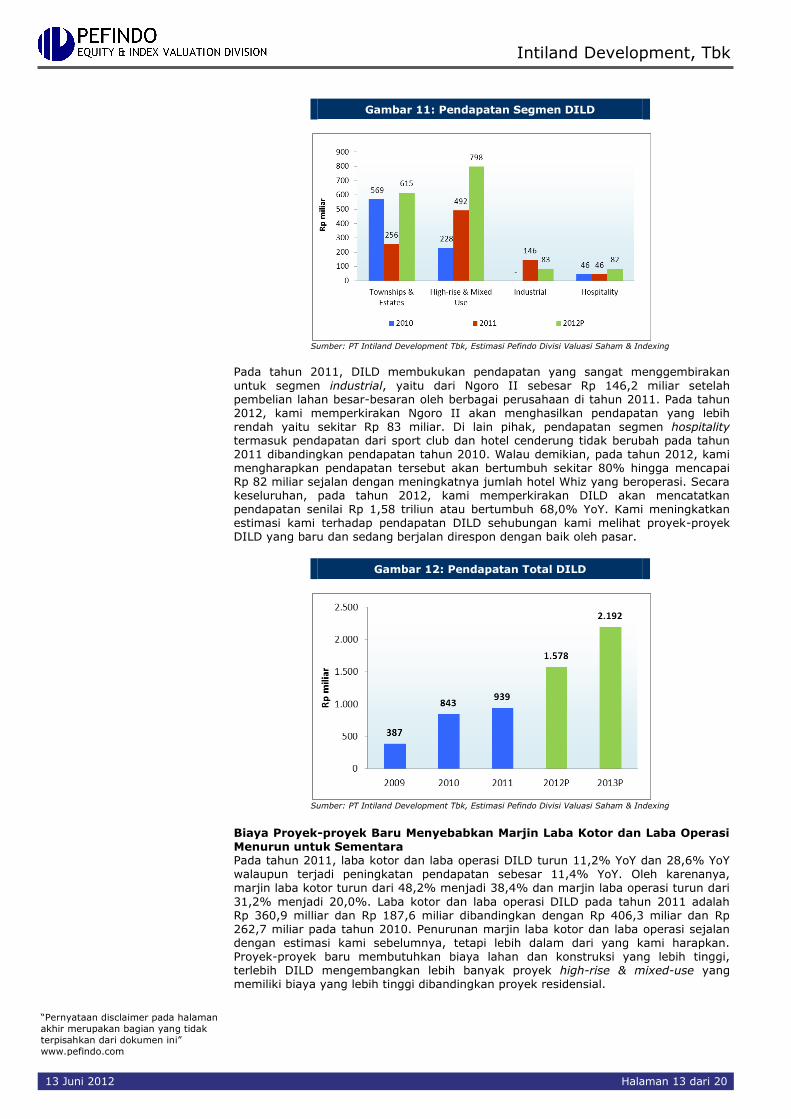
Pendapatan DILD akan Melambung di Tahun-tahun Mendatang Pendapatan DILD pada tahun 2011 bertumbuh sebesar 11,4% YoY dari Rp 842,7
miliar pada tahun 2010 menjadi Rp 939,2 miliar. Pendapatan tersebut melampaui estimasi kami sebelumnya. Segmen township & estate memberikan kontribusi yang lebih rendah bagi pendapatan DILD di tahun 2011. Pendapatan segmen ini menurun sebesar 55,1% YoY dibandingkan dengan tahun 2010 atau menjadi Rp 255,5 miliar dari Rp 569,1 miliar. Walaupun demikian, disebabkan oleh respon yang luar biasa terhadap proyek-proyek baru seperti rumah-rumah baru di Graha Famili, Graha Natura, dan Talaga Bestari kami memperkirakan pendapatan segmen ini akan melambung hingga mencapai sekitar Rp 615 miliar pada tahun 2012 atau bertumbuh sekitar 140% YoY dibandingkan tahun 2011. Sementara itu, segmen high-rise & mixed-use memberikan kontribusi yang lebih tinggi terhadap pendapatan DILD di tahun 2011. Pendapatan segmen ini melonjak 115,7% YoY atau menjadi Rp 491,8 miliar dari Rp 228,0 miliar. Kesuksesan 1Park Residences telah mendorong
melonjaknya pendapatan. Kami memperkirakan pendapatan segmen high-rise & mixed-use pada tahun 2012 akan hampir mencapai RP 800 miliar atau bertumbuh sebesar 62% YoY, dikontribusikan terutama dari 1Park Residences, Spazio, Regatta, dan Aeropolis.
KEUANGAN
“Pernyataan disclaimer pada halaman
akhir merupakan bagian yang tidak
terpisahkan dari dokumen ini”
www.pefindo.com
Intiland Development, Tbk
13 Juni 2012 Halaman 13 dari 20
Gambar 11: Pendapatan Segmen DILD
Sumber: PT Intiland Development Tbk, Estimasi Pefindo Divisi Valuasi Saham & Indexing
Pada tahun 2011, DILD membukukan pendapatan yang sangat menggembirakan
untuk segmen industrial, yaitu dari Ngoro II sebesar Rp 146,2 miliar setelah pembelian lahan besar-besaran oleh berbagai perusahaan di tahun 2011. Pada tahun 2012, kami memperkirakan Ngoro II akan menghasilkan pendapatan yang lebih rendah yaitu sekitar Rp 83 miliar. Di lain pihak, pendapatan segmen hospitality termasuk pendapatan dari sport club dan hotel cenderung tidak berubah pada tahun 2011 dibandingkan pendapatan tahun 2010. Walau demikian, pada tahun 2012, kami mengharapkan pendapatan tersebut akan bertumbuh sekitar 80% hingga mencapai Rp 82 miliar sejalan dengan meningkatnya jumlah hotel Whiz yang beroperasi. Secara keseluruhan, pada tahun 2012, kami memperkirakan DILD akan mencatatkan pendapatan senilai Rp 1,58 triliun atau bertumbuh 68,0% YoY. Kami meningkatkan estimasi kami terhadap pendapatan DILD sehubungan kami melihat proyek-proyek DILD yang baru dan sedang berjalan direspon dengan baik oleh pasar.
Gambar 12: Pendapatan Total DILD
Sumber: PT Intiland Development Tbk, Estimasi Pefindo Divisi Valuasi Saham & Indexing
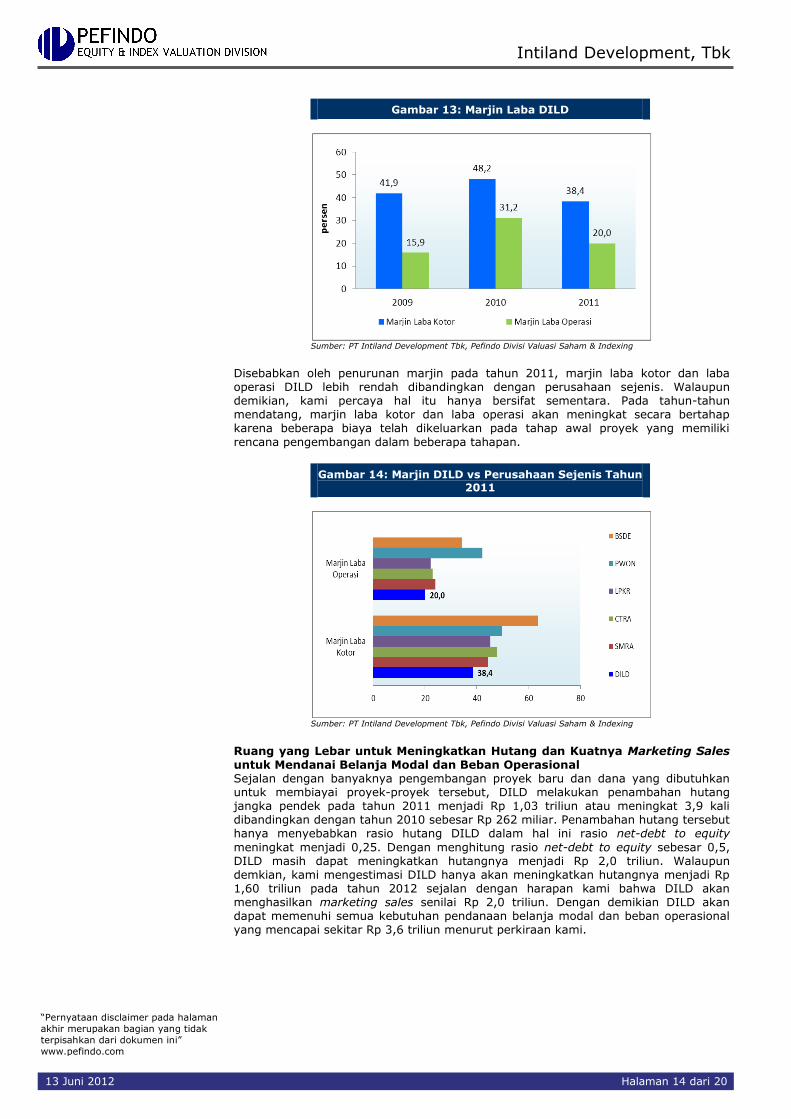
Biaya Proyek-proyek Baru Menyebabkan Marjin Laba Kotor dan Laba Operasi Menurun untuk Sementara Pada tahun 2011, laba kotor dan laba operasi DILD turun 11,2% YoY dan 28,6% YoY walaupun terjadi peningkatan pendapatan sebesar 11,4% YoY. Oleh karenanya, marjin laba kotor turun dari 48,2% menjadi 38,4% dan marjin laba operasi turun dari
31,2% menjadi 20,0%. Laba kotor dan laba operasi DILD pada tahun 2011 adalah Rp 360,9 milliar dan Rp 187,6 miliar dibandingkan dengan Rp 406,3 miliar dan Rp 262,7 miliar pada tahun 2010. Penurunan marjin laba kotor dan laba operasi sejalan dengan estimasi kami sebelumnya, tetapi lebih dalam dari yang kami harapkan. Proyek-proyek baru membutuhkan biaya lahan dan konstruksi yang lebih tinggi, terlebih DILD mengembangkan lebih banyak proyek high-rise & mixed-use yang memiliki biaya yang lebih tinggi dibandingkan proyek residensial.
“Pernyataan disclaimer pada halaman
akhir merupakan bagian yang tidak
terpisahkan dari dokumen ini”
www.pefindo.com
Intiland Development, Tbk
13 Juni 2012 Halaman 14 dari 20
Gambar 13: Marjin Laba DILD
Sumber: PT Intiland Development Tbk, Pefindo Divisi Valuasi Saham & Indexing
Disebabkan oleh penurunan marjin pada tahun 2011, marjin laba kotor dan laba operasi DILD lebih rendah dibandingkan dengan perusahaan sejenis. Walaupun demikian, kami percaya hal itu hanya bersifat sementara. Pada tahun-tahun mendatang, marjin laba kotor dan laba operasi akan meningkat secara bertahap karena beberapa biaya telah dikeluarkan pada tahap awal proyek yang memiliki
rencana pengembangan dalam beberapa tahapan.
Gambar 14: Marjin DILD vs Perusahaan Sejenis Tahun
2011
Sumber: PT Intiland Development Tbk, Pefindo Divisi Valuasi Saham & Indexing
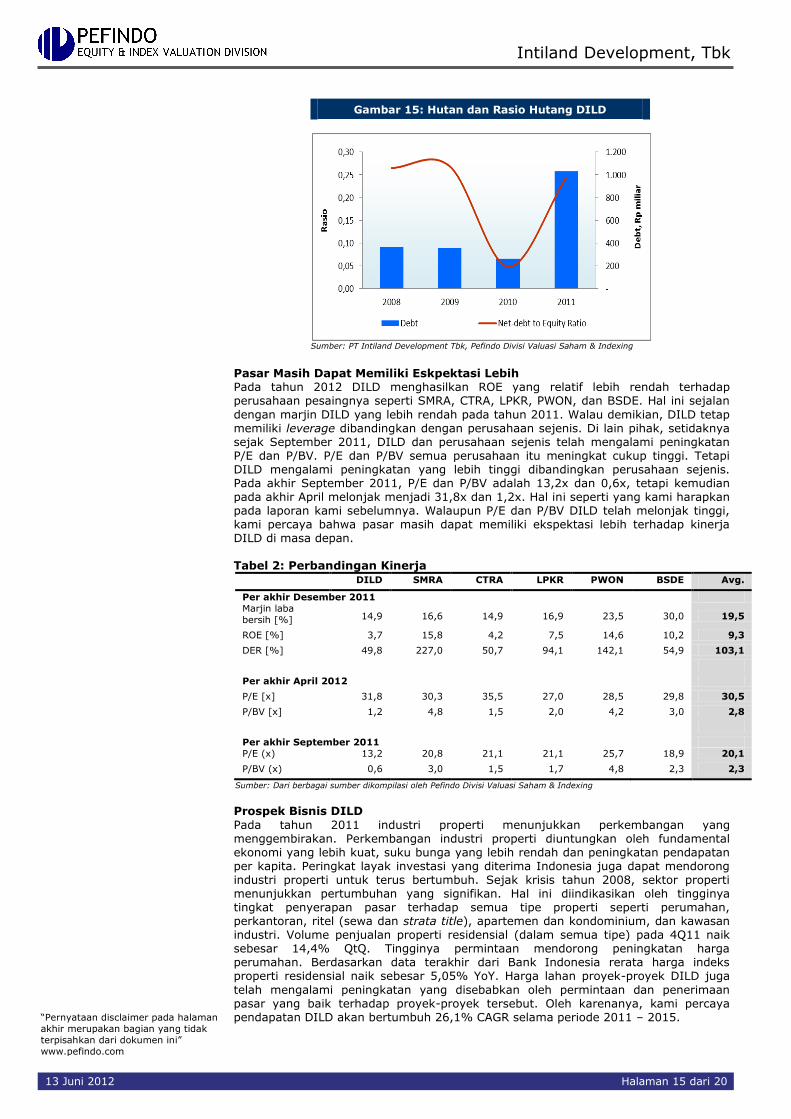
Ruang yang Lebar untuk Meningkatkan Hutang dan Kuatnya Marketing Sales untuk Mendanai Belanja Modal dan Beban Operasional Sejalan dengan banyaknya pengembangan proyek baru dan dana yang dibutuhkan untuk membiayai proyek-proyek tersebut, DILD melakukan penambahan hutang jangka pendek pada tahun 2011 menjadi Rp 1,03 triliun atau meningkat 3,9 kali dibandingkan dengan tahun 2010 sebesar Rp 262 miliar. Penambahan hutang tersebut hanya menyebabkan rasio hutang DILD dalam hal ini rasio net-debt to equity
meningkat menjadi 0,25. Dengan menghitung rasio net-debt to equity sebesar 0,5, DILD masih dapat meningkatkan hutangnya menjadi Rp 2,0 triliun. Walaupun demkian, kami mengestimasi DILD hanya akan meningkatkan hutangnya menjadi Rp 1,60 triliun pada tahun 2012 sejalan dengan harapan kami bahwa DILD akan menghasilkan marketing sales senilai Rp 2,0 triliun. Dengan demikian DILD akan dapat memenuhi semua kebutuhan pendanaan belanja modal dan beban operasional yang mencapai sekitar Rp 3,6 triliun menurut perkiraan kami.
“Pernyataan disclaimer pada halaman
akhir merupakan bagian yang tidak
terpisahkan dari dokumen ini”
www.pefindo.com
Intiland Development, Tbk
13 Juni 2012 Halaman 15 dari 20
Gambar 15: Hutan dan Rasio Hutang DILD
Sumber: PT Intiland Development Tbk, Pefindo Divisi Valuasi Saham & Indexing
Pasar Masih Dapat Memiliki Eskpektasi Lebih Pada tahun 2012 DILD menghasilkan ROE yang relatif lebih rendah terhadap perusahaan pesaingnya seperti SMRA, CTRA, LPKR, PWON, dan BSDE. Hal ini sejalan
dengan marjin DILD yang lebih rendah pada tahun 2011. Walau demikian, DILD tetap memiliki leverage dibandingkan dengan perusahaan sejenis. Di lain pihak, setidaknya sejak September 2011, DILD dan perusahaan sejenis telah mengalami peningkatan P/E dan P/BV. P/E dan P/BV semua perusahaan itu meningkat cukup tinggi. Tetapi DILD mengalami peningkatan yang lebih tinggi dibandingkan perusahaan sejenis. Pada akhir September 2011, P/E dan P/BV adalah 13,2x dan 0,6x, tetapi kemudian pada akhir April melonjak menjadi 31,8x dan 1,2x. Hal ini seperti yang kami harapkan pada laporan kami sebelumnya. Walaupun P/E dan P/BV DILD telah melonjak tinggi, kami percaya bahwa pasar masih dapat memiliki ekspektasi lebih terhadap kinerja DILD di masa depan. Tabel 2: Perbandingan Kinerja
DILD SMRA CTRA LPKR PWON BSDE Avg.
Per akhir Desember 2011
Marjin laba
bersih [%] 14,9 16,6 14,9 16,9 23,5 30,0 19,5
ROE [%] 3,7 15,8 4,2 7,5 14,6 10,2 9,3
DER [%] 49,8 227,0 50,7 94,1 142,1 54,9 103,1
Per akhir April 2012
P/E [x] 31,8 30,3 35,5 27,0 28,5 29,8 30,5
P/BV [x] 1,2 4,8 1,5 2,0 4,2 3,0 2,8
Per akhir September 2011
P/E (x) 13,2 20,8 21,1 21,1 25,7 18,9 20,1
P/BV (x) 0,6 3,0 1,5 1,7 4,8 2,3 2,3
Sumber: Dari berbagai sumber dikompilasi oleh Pefindo Divisi Valuasi Saham & Indexing Prospek Bisnis DILD
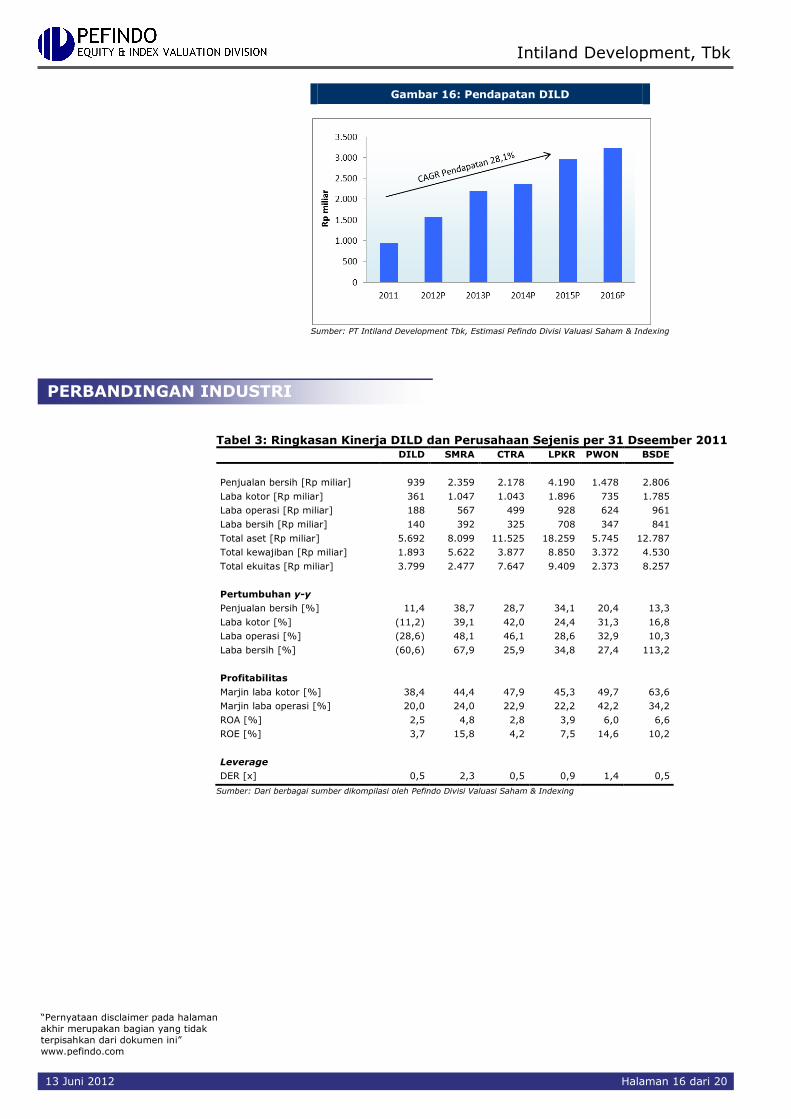
Pada tahun 2011 industri properti menunjukkan perkembangan yang menggembirakan. Perkembangan industri properti diuntungkan oleh fundamental ekonomi yang lebih kuat, suku bunga yang lebih rendah dan peningkatan pendapatan per kapita. Peringkat layak investasi yang diterima Indonesia juga dapat mendorong industri properti untuk terus bertumbuh. Sejak krisis tahun 2008, sektor properti menunjukkan pertumbuhan yang signifikan. Hal ini diindikasikan oleh tingginya tingkat penyerapan pasar terhadap semua tipe properti seperti perumahan, perkantoran, ritel (sewa dan strata title), apartemen dan kondominium, dan kawasan industri. Volume penjualan properti residensial (dalam semua tipe) pada 4Q11 naik sebesar 14,4% QtQ. Tingginya permintaan mendorong peningkatan harga perumahan. Berdasarkan data terakhir dari Bank Indonesia rerata harga indeks properti residensial naik sebesar 5,05% YoY. Harga lahan proyek-proyek DILD juga
telah mengalami peningkatan yang disebabkan oleh permintaan dan penerimaan pasar yang baik terhadap proyek-proyek tersebut. Oleh karenanya, kami percaya pendapatan DILD akan bertumbuh 26,1% CAGR selama periode 2011 – 2015.
“Pernyataan disclaimer pada halaman
akhir merupakan bagian yang tidak
terpisahkan dari dokumen ini”
www.pefindo.com
Intiland Development, Tbk
13 Juni 2012 Halaman 16 dari 20
Gambar 16: Pendapatan DILD
Sumber: PT Intiland Development Tbk, Estimasi Pefindo Divisi Valuasi Saham & Indexing
Tabel 3: Ringkasan Kinerja DILD dan Perusahaan Sejenis per 31 Dseember 2011 DILD SMRA CTRA LPKR PWON BSDE
Penjualan bersih [Rp miliar] 939 2.359 2.178 4.190 1.478 2.806
Laba kotor [Rp miliar] 361 1.047 1.043 1.896 735 1.785
Laba operasi [Rp miliar] 188 567 499 928 624 961
Laba bersih [Rp miliar] 140 392 325 708 347 841
Total aset [Rp miliar] 5.692 8.099 11.525 18.259 5.745 12.787
Total kewajiban [Rp miliar] 1.893 5.622 3.877 8.850 3.372 4.530
Total ekuitas [Rp miliar] 3.799 2.477 7.647 9.409 2.373 8.257
Pertumbuhan y-y
Penjualan bersih [%] 11,4 38,7 28,7 34,1 20,4 13,3
Laba kotor [%] (11,2) 39,1 42,0 24,4 31,3 16,8
Laba operasi [%] (28,6) 48,1 46,1 28,6 32,9 10,3
Laba bersih [%] (60,6) 67,9 25,9 34,8 27,4 113,2
Profitabilitas
Marjin laba kotor [%] 38,4 44,4 47,9 45,3 49,7 63,6
Marjin laba operasi [%] 20,0 24,0 22,9 22,2 42,2 34,2
ROA [%] 2,5 4,8 2,8 3,9 6,0 6,6
ROE [%] 3,7 15,8 4,2 7,5 14,6 10,2
Leverage
DER [x] 0,5 2,3 0,5 0,9 1,4 0,5
Sumber: Dari berbagai sumber dikompilasi oleh Pefindo Divisi Valuasi Saham & Indexing
PERBANDINGAN INDUSTRI
“Pernyataan disclaimer pada halaman
akhir merupakan bagian yang tidak
terpisahkan dari dokumen ini”
www.pefindo.com
Intiland Development, Tbk
13 Juni 2012 Halaman 17 dari 20
PENILAIAN
Metodologi Penilaian Kami mengaplikasikan metode Discounted Cash Flow (DCF) sebagai metode penilaian utama dengan pertimbangan bahwa pertumbuhan pendapatan adalah merupakan faktor utama yang mempengaruhi nilai (value driver) jika dibandingkan pertumbuhan aset. Selanjutnya, kami juga mengaplikasikan Guideline Company Method (GCM) sebagai metode pembanding lainnya.
Penilaian ini didasarkan pada nilai 100% saham per tanggal 12 Juni 2012 dan Laporan Keuangan per tanggal 31 Desember 2011 sebagai dasar dilakukannya analisis fundamental.
Estimasi Nilai
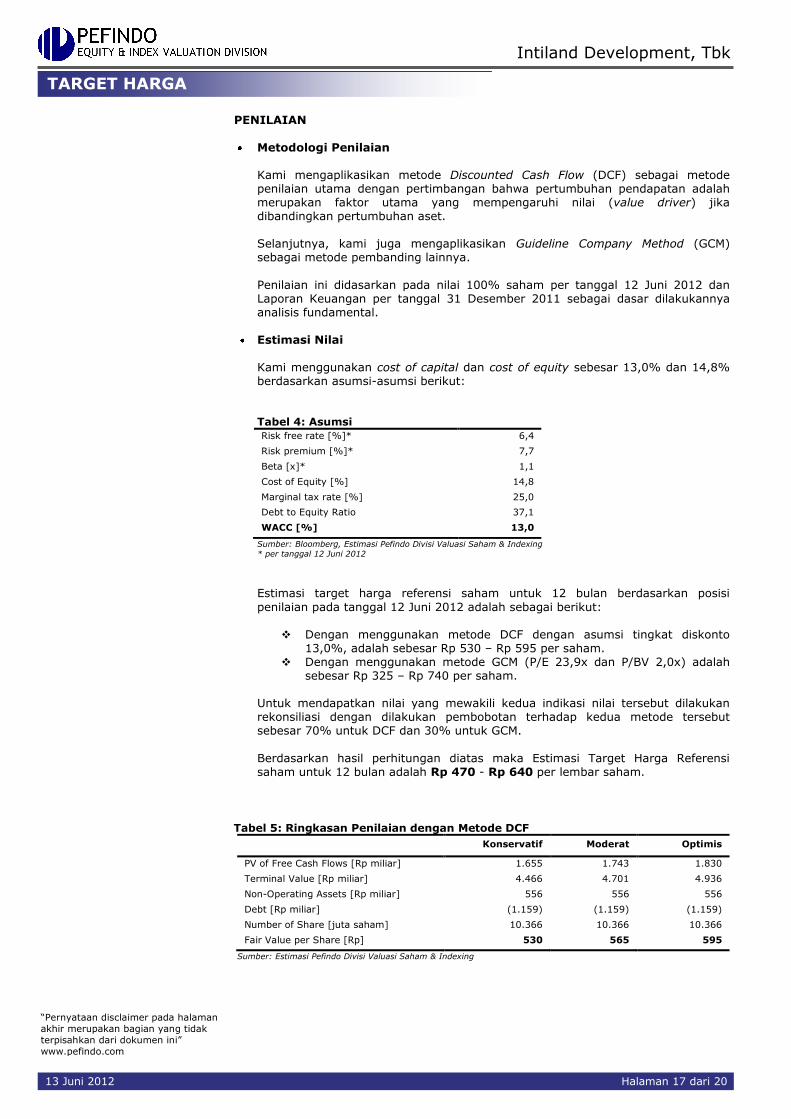
Kami menggunakan cost of capital dan cost of equity sebesar 13,0% dan 14,8% berdasarkan asumsi-asumsi berikut: Tabel 4: Asumsi
Risk free rate [%]* 6,4
Risk premium [%]* 7,7
Beta [x]* 1,1
Cost of Equity [%] 14,8
Marginal tax rate [%] 25,0
Debt to Equity Ratio 37,1
WACC [%] 13,0
Sumber: Bloomberg, Estimasi Pefindo Divisi Valuasi Saham & Indexing
* per tanggal 12 Juni 2012
Estimasi target harga referensi saham untuk 12 bulan berdasarkan posisi
penilaian pada tanggal 12 Juni 2012 adalah sebagai berikut:
Dengan menggunakan metode DCF dengan asumsi tingkat diskonto 13,0%, adalah sebesar Rp 530 – Rp 595 per saham.
Dengan menggunakan metode GCM (P/E 23,9x dan P/BV 2,0x) adalah sebesar Rp 325 – Rp 740 per saham.
Untuk mendapatkan nilai yang mewakili kedua indikasi nilai tersebut dilakukan rekonsiliasi dengan dilakukan pembobotan terhadap kedua metode tersebut sebesar 70% untuk DCF dan 30% untuk GCM.
Berdasarkan hasil perhitungan diatas maka Estimasi Target Harga Referensi saham untuk 12 bulan adalah Rp 470 - Rp 640 per lembar saham.
Tabel 5: Ringkasan Penilaian dengan Metode DCF
Konservatif Moderat Optimis
PV of Free Cash Flows [Rp miliar] 1.655 1.743 1.830
Terminal Value [Rp miliar] 4.466 4.701 4.936
Non-Operating Assets [Rp miliar] 556 556 556
Debt [Rp miliar] (1.159) (1.159) (1.159)
Number of Share [juta saham] 10.366 10.366 10.366
Fair Value per Share [Rp] 530 565 595
Sumber: Estimasi Pefindo Divisi Valuasi Saham & Indexing
TARGET HARGA
“Pernyataan disclaimer pada halaman
akhir merupakan bagian yang tidak
terpisahkan dari dokumen ini”
www.pefindo.com
Intiland Development, Tbk
13 Juni 2012 Halaman 18 dari 20
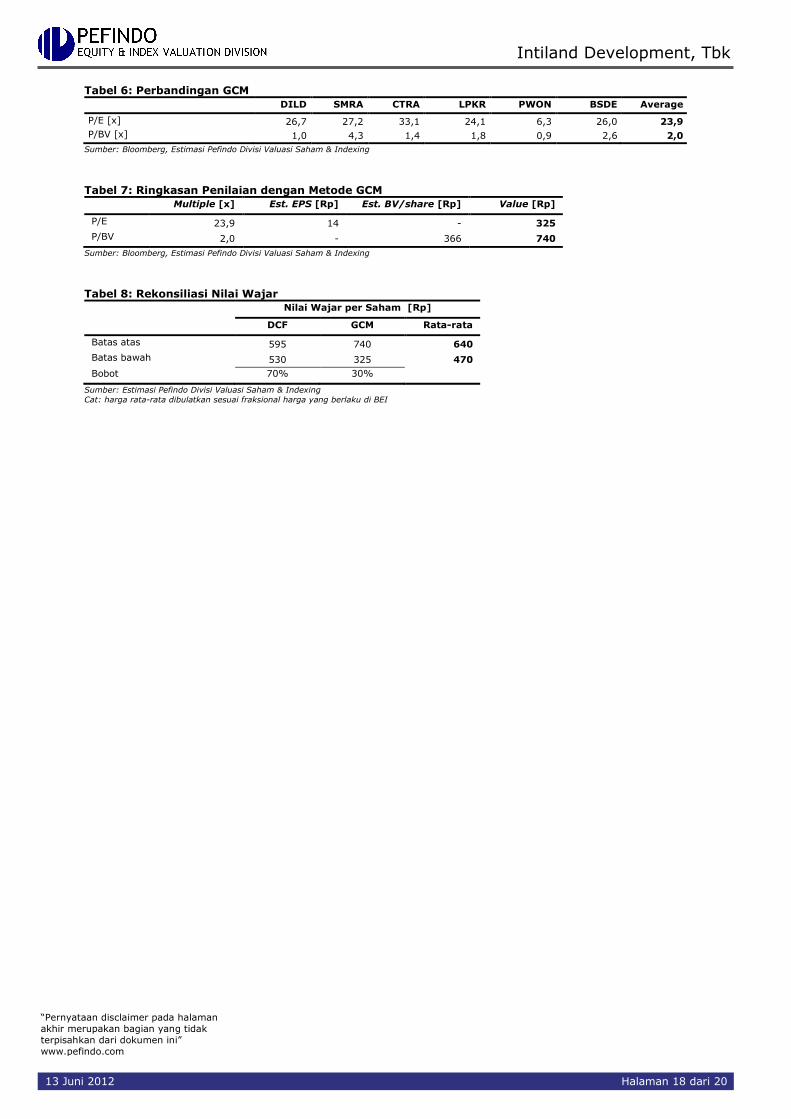
Tabel 6: Perbandingan GCM
DILD SMRA CTRA LPKR PWON BSDE Average
P/E [x] 26,7 27,2 33,1 24,1 6,3 26,0 23,9
P/BV [x] 1,0 4,3 1,4 1,8 0,9 2,6 2,0
Sumber: Bloomberg, Estimasi Pefindo Divisi Valuasi Saham & Indexing
Tabel 7: Ringkasan Penilaian dengan Metode GCM
Multiple [x] Est. EPS [Rp] Est. BV/share [Rp] Value [Rp]
P/E 23,9 14 - 325
P/BV 2,0 - 366 740
Sumber: Bloomberg, Estimasi Pefindo Divisi Valuasi Saham & Indexing
Tabel 8: Rekonsiliasi Nilai Wajar
Nilai Wajar per Saham [Rp]
DCF GCM Rata-rata
Batas atas 595 740 640
Batas bawah 530 325 470
Bobot 70% 30%
Sumber: Estimasi Pefindo Divisi Valuasi Saham & Indexing
Cat: harga rata-rata dibulatkan sesuai fraksional harga yang berlaku di BEI
“Pernyataan disclaimer pada halaman
akhir merupakan bagian yang tidak
terpisahkan dari dokumen ini”
www.pefindo.com
Intiland Development, Tbk
13 Juni 2012 Halaman 19 dari 20
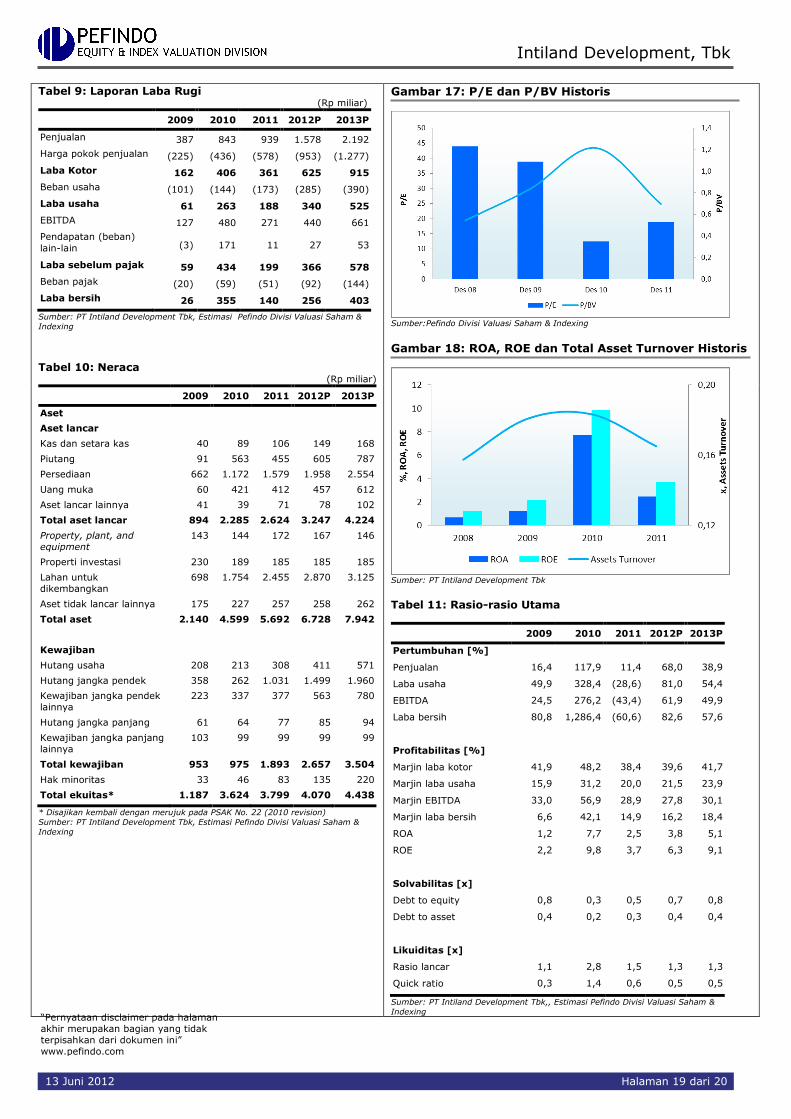
Tabel 9: Laporan Laba Rugi (Rp miliar)
2009 2010 2011 2012P 2013P
Penjualan 387 843 939 1.578 2.192
Harga pokok penjualan (225) (436) (578) (953) (1.277)
Laba Kotor 162 406 361 625 915
Beban usaha (101) (144) (173) (285) (390)
Laba usaha 61 263 188 340 525
EBITDA 127 480 271 440 661
Pendapatan (beban)
lain-lain (3) 171 11 27 53
Laba sebelum pajak 59 434 199 366 578
Beban pajak (20) (59) (51) (92) (144)
Laba bersih 26 355 140 256 403
Sumber: PT Intiland Development Tbk, Estimasi Pefindo Divisi Valuasi Saham &
Indexing
Tabel 10: Neraca
(Rp miliar)
Gambar 17: P/E dan P/BV Historis
Sumber:Pefindo Divisi Valuasi Saham & Indexing
Gambar 18: ROA, ROE dan Total Asset Turnover Historis
Sumber: PT Intiland Development Tbk
Tabel 11: Rasio-rasio Utama
2009 2010 2011 2012P 2013P
Pertumbuhan [%]
Penjualan 16,4 117,9 11,4 68,0 38,9
Laba usaha 49,9 328,4 (28,6) 81,0 54,4
EBITDA 24,5 276,2 (43,4) 61,9 49,9
Laba bersih 80,8 1,286,4 (60,6) 82,6 57,6
Profitabilitas [%]
Marjin laba kotor 41,9 48,2 38,4 39,6 41,7
Marjin laba usaha 15,9 31,2 20,0 21,5 23,9
Marjin EBITDA 33,0 56,9 28,9 27,8 30,1
Marjin laba bersih 6,6 42,1 14,9 16,2 18,4
ROA 1,2 7,7 2,5 3,8 5,1
ROE 2,2 9,8 3,7 6,3 9,1
Solvabilitas [x]
Debt to equity 0,8 0,3 0,5 0,7 0,8
Debt to asset 0,4 0,2 0,3 0,4 0,4
Likuiditas [x]
Rasio lancar 1,1 2,8 1,5 1,3 1,3
Quick ratio 0,3 1,4 0,6 0,5 0,5
Sumber: PT Intiland Development Tbk,, Estimasi Pefindo Divisi Valuasi Saham &
Indexing
2009 2010 2011 2012P 2013P
Aset
Aset lancar
Kas dan setara kas 40 89 106 149 168
Piutang 91 563 455 605 787
Persediaan 662 1.172 1.579 1.958 2.554
Uang muka 60 421 412 457 612
Aset lancar lainnya 41 39 71 78 102
Total aset lancar 894 2.285 2.624 3.247 4.224
Property, plant, and
equipment
143 144 172 167 146
Properti investasi 230 189 185 185 185
Lahan untuk
dikembangkan
698 1.754 2.455 2.870 3.125
Aset tidak lancar lainnya 175 227 257 258 262
Total aset 2.140 4.599 5.692 6.728 7.942
Kewajiban
Hutang usaha 208 213 308 411 571
Hutang jangka pendek 358 262 1.031 1.499 1.960
Kewajiban jangka pendek
lainnya
223 337 377 563 780
Hutang jangka panjang 61 64 77 85 94
Kewajiban jangka panjang
lainnya
103 99 99 99 99
Total kewajiban 953 975 1.893 2.657 3.504
Hak minoritas 33 46 83 135 220
Total ekuitas* 1.187 3.624 3.799 4.070 4.438
* Disajikan kembali dengan merujuk pada PSAK No. 22 (2010 revision)
Sumber: PT Intiland Development Tbk, Estimasi Pefindo Divisi Valuasi Saham &
Indexing
“Pernyataan disclaimer pada halaman
akhir merupakan bagian yang tidak
terpisahkan dari dokumen ini”
www.pefindo.com
Intiland Development, Tbk
13 Juni 2012 Halaman 20 dari 20
DISCLAIMER
Laporan ini dibuat berdasarkan sumber-sumber yang kami anggap terpercaya dan dapat diandalkan. Namun kami tidak menjamin kelengkapan, keakuratan atau kecukupannya. Dengan demikian kami tidak bertanggung jawab atas segala keputusan investasi yang diambil berdasarkan laporan ini. Adapun asumsi, opini, dan perkiraan merupakan hasil dari pertimbangan internal kami per tanggal penilaian (cut off date), dan kami dapat mengubah pertimbangan diatas sewaktu-waktu tanpa pemberitahuan terlebih dahulu. Kami tidak bertanggung jawab atas kekeliruan atau kelalaian yang terjadi akibat penggunaan laporan ini. Kinerja dimasa lalu tidak selalu dapat dijadikan acuan hasil masa depan. Laporan ini bukan merupakan rekomendasi penawaran, pembelian atau menahan suatu saham tertentu. Laporan ini mungkin tidak sesuai untuk beberapa investor. Seluruh opini dalam laporan ini te lah disampaikan dengan itikad baik, namun sewaktu-waktu dapat berubah tanpa pemberitahuan terlebih dahulu, dan disajikan dengan benar per tanggal diterbitkan laporan ini. Harga, nilai, atau pendapatan dari setiap saham Perseroan yang disajikan dalam laporan ini kemungkinan dapat lebih rendah dari harapan pemodal, dan pemodal juga mungkin mendapatkan pengembalian yang lebih rendah dari nilai investasi yang ditanamkan. Investasi didefinisikan sebagai pendapatan yang kemungkinan besar diterima dimasa depan, namun nilai dari pendapatan yang akan diterima tersebut kemungkinan besar juga akan berfluktuasi. Untuk saham Perseroan yang penyajian laporan keuangannya didenominasi dalam mata uang selain Rupiah, perubahan nilai tukar mata uang tersebut kemungkinan dapat menurunkan nilai, harga, atau pendapatan investasi pemodal. Informasi dalam laporan ini bukan merupakan pertimbangan pajak dalam mengambil suatu keputusan investasi. Target harga saham dalam Laporan ini merupakan nilai fundamental, bukan merupakan Nilai Pasar Wajar, dan bukan merupakan harga acuan transaksi yang diwajibkan oleh peraturan perundang-undangan yang berlaku. Laporan target harga saham yang diterbitkan oleh Pefindo Divisi Valuasi Saham dan Indexing bukan merupakan rekomendasi untuk membeli, menjual, atau menahan suatu saham tertentu, dan tidak dapat dianggap sebagai nasehat investasi oleh Pefindo Divisi Valuasi Saham dan Indexing yang behubungan dengan cakupan Jasa Pefindo kepada, atau kaitannya kepada, beberapa pihak, termasuk emiten, penasehat keuangan, pialang saham, investment banks, institusi keuangan dan perantara keuangan, dalam kaitannya menerima imbalan atau keuntungan lainnya dari pihak tersebut, Laporan ini tidak ditujukan untuk pemodal tertentu dan tidak dapat dijadikan bagian dari tujuan investasi terhadap suatu saham dan juga bukan merupakan rekomendasi investasi terhadap suatu saham tertentu atau suatu strategi investasi. Sebelum melakukan tindakan dari hasil laporan ini, pemodal disarankan untuk mempertimbangkan terlebih dahulu kesesuaian situasi dan kondisi dan, jika dibutuhkan, mintalah bantuan penasehat keuangan. PEFINDO memisahkan kegiatan Valuasi Saham dengan kegiatan Pemeringkatan untuk menjaga independensi dan objektivitas dari proses dan produk kegiatan analitis. PEFINDO telah menetapkan kebijakan dan prosedur untuk menjaga kerahasiaan informasi non-publik tertentu yang diterima
sehubungan dengan proses analitis. Keseluruhan proses, metodologi dan database yang digunakan dalam penyusunan Laporan Target Harga Referensi Saham ini secara keseluruhan adalah berbeda dengan proses, metodologi dan database yang digunakan PEFINDO dalam melakukan pemeringkatan. Laporan ini dibuat dan disiapkan Pefindo Divisi Valuasi Saham dan Indexing dengan tujuan untuk meningkatkan transparansi harga saham yang tercatat di Bursa Efek Indonesia. Laporan ini juga bebas dari pengaruh tekanan atau paksaan dari Bursa maupun Perseroan yang dinilai. Pefindo Divisi Valuasi Saham dan Indexing akan menerima imbalan sebesar Rp.40.000.000,- dari Perseroan yang dinilai untuk 2 (dua) kali pelaporan per tahun. Untuk keterangan lebih lanjut, dapat mengunjungi website kami di http://www.pefindo.com Laporan ini dibuat dan disiapkan oleh Pefindo Divisi Valuasi Saham dan Indexing. Di Indonesia Laporan ini dipublikasikan pada website kami dan juga pada website Bursa Efek Indonesia.
Page 1 of 18
Contact: Equity & Index Valuation Division Phone: (6221) 7278 2380 [email protected]
“Disclaimer statement in the last page is an
integral part of this report”
www.pefindo.com
Intiland Development, Tbk Secondary Report
Equity Valuation
June 13th, 2012
Target Price
Low High 470 640
Property and Real Estate
Stock Performance
Source: Bloomberg
Stock Information Rp
Ticker code DILD
Market price as of June 12th, 2012 360
Market price – 52 week high 435
Market price – 52 week low 184
Market cap – 52 week high (bn) 4,509
Market cap – 52 week low (bn) 1,907
Market Value Added & Market Risk
Source:PT Intiland Development, Pefindo Equity & Index Valuation Division
Stock Valuation Last Current
High 770 640
Low 530 470
Shareholders (%)
UBS AG Singapore 22.24
Credit Suisse Singapore 20.06
PT Permata Ratna Mulia 7.28
Others (each below 5%) 50.42
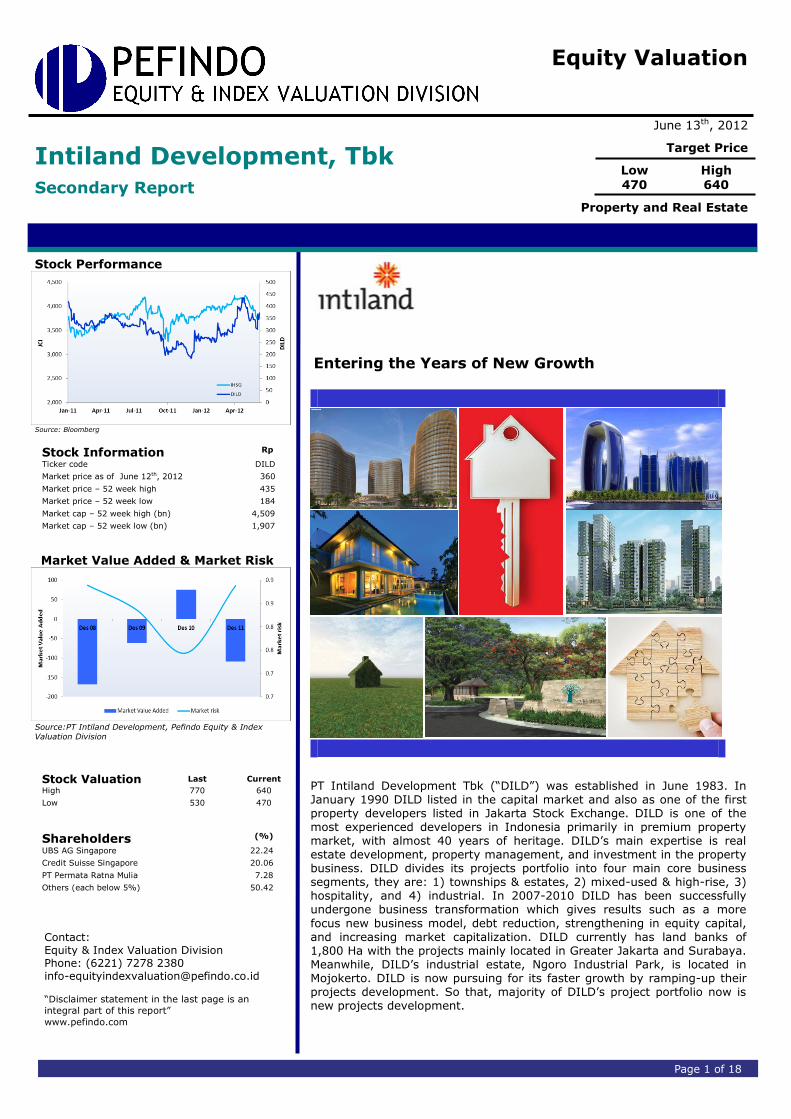
Entering the Years of New Growth
PT Intiland Development Tbk (“DILD”) was established in June 1983. In January 1990 DILD listed in the capital market and also as one of the first property developers listed in Jakarta Stock Exchange. DILD is one of the most experienced developers in Indonesia primarily in premium property market, with almost 40 years of heritage. DILD’s main expertise is real estate development, property management, and investment in the property business. DILD divides its projects portfolio into four main core business segments, they are: 1) townships & estates, 2) mixed-used & high-rise, 3) hospitality, and 4) industrial. In 2007-2010 DILD has been successfully undergone business transformation which gives results such as a more
focus new business model, debt reduction, strengthening in equity capital, and increasing market capitalization. DILD currently has land banks of 1,800 Ha with the projects mainly located in Greater Jakarta and Surabaya. Meanwhile, DILD’s industrial estate, Ngoro Industrial Park, is located in Mojokerto. DILD is now pursuing for its faster growth by ramping-up their projects development. So that, majority of DILD’s project portfolio now is new projects development.
“Disclaimer statement in the last page
is an integral part of this report”
www.pefindo.com
Intiland Development, Tbk
June 13th, 2012 Page 2 of 18
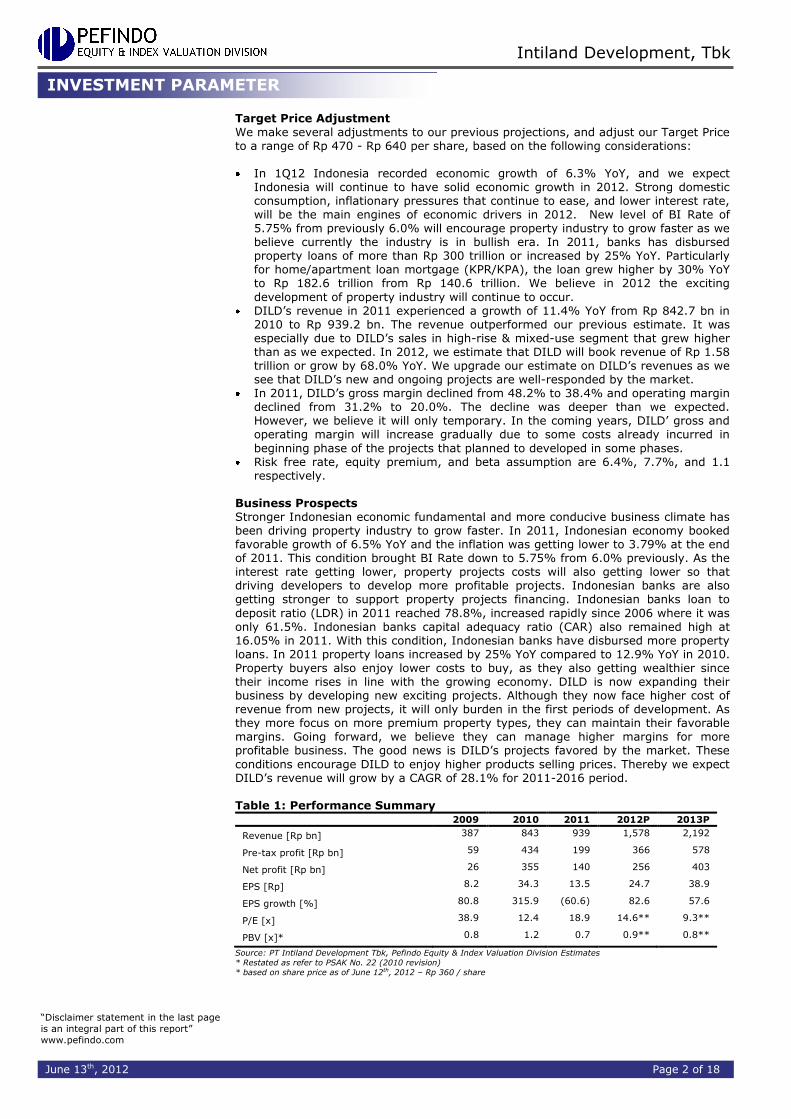
Target Price Adjustment
We make several adjustments to our previous projections, and adjust our Target Price to a range of Rp 470 - Rp 640 per share, based on the following considerations: In 1Q12 Indonesia recorded economic growth of 6.3% YoY, and we expect
Indonesia will continue to have solid economic growth in 2012. Strong domestic consumption, inflationary pressures that continue to ease, and lower interest rate, will be the main engines of economic drivers in 2012. New level of BI Rate of 5.75% from previously 6.0% will encourage property industry to grow faster as we believe currently the industry is in bullish era. In 2011, banks has disbursed property loans of more than Rp 300 trillion or increased by 25% YoY. Particularly for home/apartment loan mortgage (KPR/KPA), the loan grew higher by 30% YoY to Rp 182.6 trillion from Rp 140.6 trillion. We believe in 2012 the exciting
development of property industry will continue to occur. DILD’s revenue in 2011 experienced a growth of 11.4% YoY from Rp 842.7 bn in
2010 to Rp 939.2 bn. The revenue outperformed our previous estimate. It was especially due to DILD’s sales in high-rise & mixed-use segment that grew higher than as we expected. In 2012, we estimate that DILD will book revenue of Rp 1.58 trillion or grow by 68.0% YoY. We upgrade our estimate on DILD’s revenues as we see that DILD’s new and ongoing projects are well-responded by the market.
In 2011, DILD’s gross margin declined from 48.2% to 38.4% and operating margin declined from 31.2% to 20.0%. The decline was deeper than we expected. However, we believe it will only temporary. In the coming years, DILD’ gross and operating margin will increase gradually due to some costs already incurred in
beginning phase of the projects that planned to developed in some phases. Risk free rate, equity premium, and beta assumption are 6.4%, 7.7%, and 1.1
respectively. Business Prospects Stronger Indonesian economic fundamental and more conducive business climate has been driving property industry to grow faster. In 2011, Indonesian economy booked favorable growth of 6.5% YoY and the inflation was getting lower to 3.79% at the end of 2011. This condition brought BI Rate down to 5.75% from 6.0% previously. As the interest rate getting lower, property projects costs will also getting lower so that driving developers to develop more profitable projects. Indonesian banks are also getting stronger to support property projects financing. Indonesian banks loan to
deposit ratio (LDR) in 2011 reached 78.8%, increased rapidly since 2006 where it was only 61.5%. Indonesian banks capital adequacy ratio (CAR) also remained high at 16.05% in 2011. With this condition, Indonesian banks have disbursed more property loans. In 2011 property loans increased by 25% YoY compared to 12.9% YoY in 2010. Property buyers also enjoy lower costs to buy, as they also getting wealthier since their income rises in line with the growing economy. DILD is now expanding their business by developing new exciting projects. Although they now face higher cost of revenue from new projects, it will only burden in the first periods of development. As they more focus on more premium property types, they can maintain their favorable margins. Going forward, we believe they can manage higher margins for more profitable business. The good news is DILD’s projects favored by the market. These
conditions encourage DILD to enjoy higher products selling prices. Thereby we expect DILD’s revenue will grow by a CAGR of 28.1% for 2011-2016 period. Table 1: Performance Summary
2009 2010 2011 2012P 2013P
Revenue [Rp bn] 387 843 939 1,578 2,192
Pre-tax profit [Rp bn] 59 434 199 366 578
Net profit [Rp bn] 26 355 140 256 403
EPS [Rp] 8.2 34.3 13.5 24.7 38.9
EPS growth [%] 80.8 315.9 (60.6) 82.6 57.6
P/E [x] 38.9 12.4 18.9 14.6** 9.3**
PBV [x]* 0.8 1.2 0.7 0.9** 0.8**
Source: PT Intiland Development Tbk, Pefindo Equity & Index Valuation Division Estimates
* Restated as refer to PSAK No. 22 (2010 revision)
* based on share price as of June 12th, 2012 – Rp 360 / share
INVESTMENT PARAMETER
“Disclaimer statement in the last page
is an integral part of this report”
www.pefindo.com
Intiland Development, Tbk
June 13th, 2012 Page 3 of 18
Growth-Value Map provides overview of market expectations for the companies listed
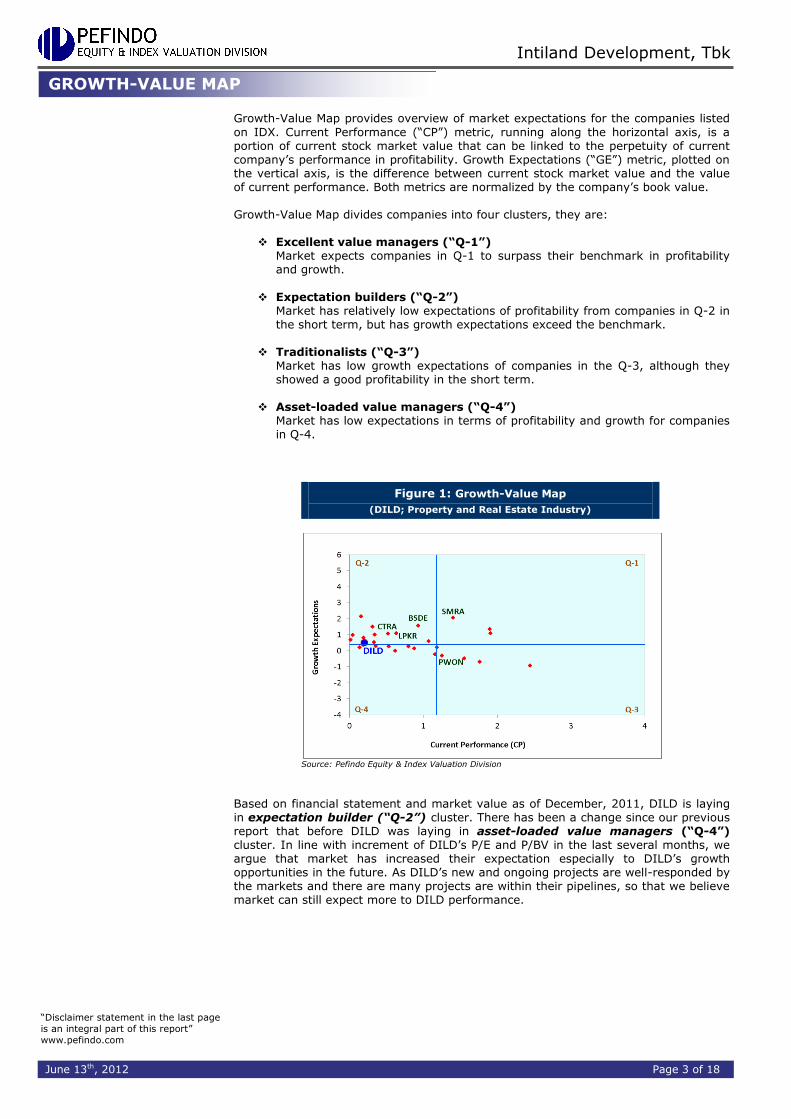
on IDX. Current Performance (“CP”) metric, running along the horizontal axis, is a portion of current stock market value that can be linked to the perpetuity of current company’s performance in profitability. Growth Expectations (“GE”) metric, plotted on the vertical axis, is the difference between current stock market value and the value of current performance. Both metrics are normalized by the company’s book value. Growth-Value Map divides companies into four clusters, they are:
Excellent value managers (“Q-1”) Market expects companies in Q-1 to surpass their benchmark in profitability and growth.
Expectation builders (“Q-2”) Market has relatively low expectations of profitability from companies in Q-2 in the short term, but has growth expectations exceed the benchmark.
Traditionalists (“Q-3”) Market has low growth expectations of companies in the Q-3, although they showed a good profitability in the short term.
Asset-loaded value managers (“Q-4”)
Market has low expectations in terms of profitability and growth for companies in Q-4.
Figure 1: Growth-Value Map
(DILD; Property and Real Estate Industry)
Source: Pefindo Equity & Index Valuation Division
Based on financial statement and market value as of December, 2011, DILD is laying in expectation builder (“Q-2”) cluster. There has been a change since our previous report that before DILD was laying in asset-loaded value managers (“Q-4”) cluster. In line with increment of DILD’s P/E and P/BV in the last several months, we argue that market has increased their expectation especially to DILD’s growth opportunities in the future. As DILD’s new and ongoing projects are well-responded by the markets and there are many projects are within their pipelines, so that we believe market can still expect more to DILD performance.
GROWTH-VALUE MAP
“Disclaimer statement in the last page
is an integral part of this report”
www.pefindo.com
Intiland Development, Tbk
June 13th, 2012 Page 4 of 18
Indonesian Banks are Getting Stronger
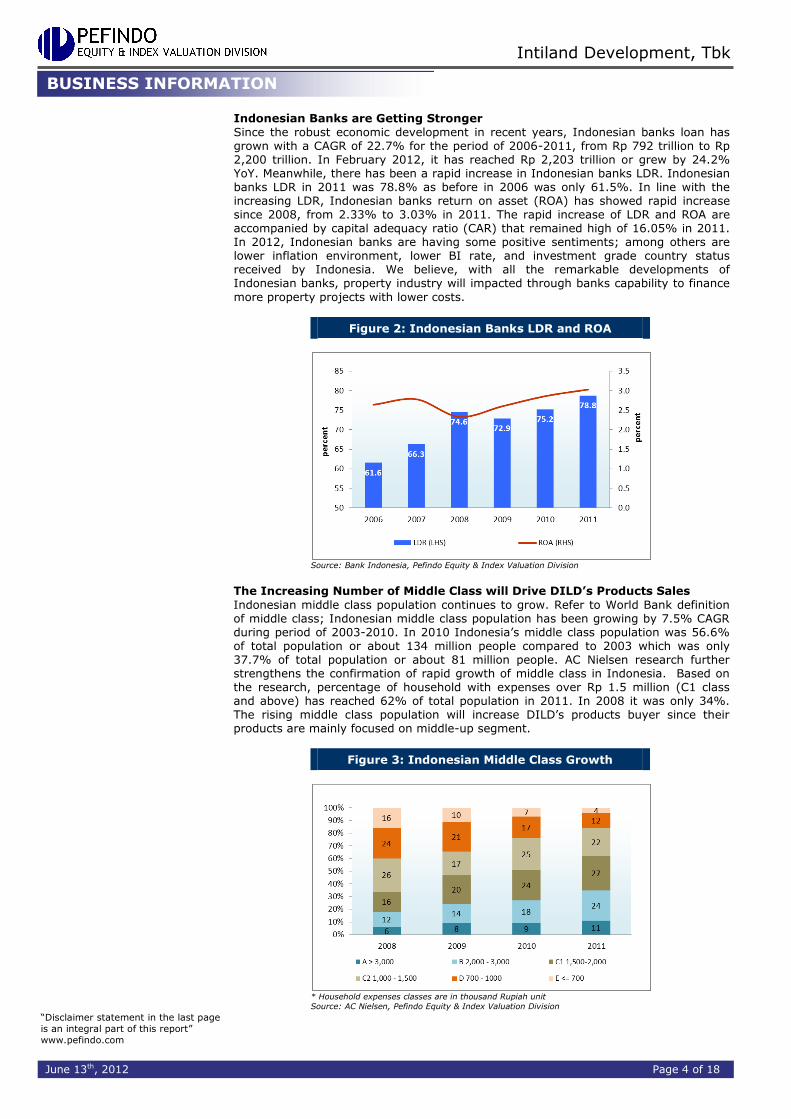
Since the robust economic development in recent years, Indonesian banks loan has grown with a CAGR of 22.7% for the period of 2006-2011, from Rp 792 trillion to Rp 2,200 trillion. In February 2012, it has reached Rp 2,203 trillion or grew by 24.2% YoY. Meanwhile, there has been a rapid increase in Indonesian banks LDR. Indonesian banks LDR in 2011 was 78.8% as before in 2006 was only 61.5%. In line with the increasing LDR, Indonesian banks return on asset (ROA) has showed rapid increase since 2008, from 2.33% to 3.03% in 2011. The rapid increase of LDR and ROA are accompanied by capital adequacy ratio (CAR) that remained high of 16.05% in 2011. In 2012, Indonesian banks are having some positive sentiments; among others are lower inflation environment, lower BI rate, and investment grade country status received by Indonesia. We believe, with all the remarkable developments of Indonesian banks, property industry will impacted through banks capability to finance
more property projects with lower costs.
Figure 2: Indonesian Banks LDR and ROA
Source: Bank Indonesia, Pefindo Equity & Index Valuation Division
The Increasing Number of Middle Class will Drive DILD’s Products Sales
Indonesian middle class population continues to grow. Refer to World Bank definition of middle class; Indonesian middle class population has been growing by 7.5% CAGR during period of 2003-2010. In 2010 Indonesia’s middle class population was 56.6% of total population or about 134 million people compared to 2003 which was only 37.7% of total population or about 81 million people. AC Nielsen research further strengthens the confirmation of rapid growth of middle class in Indonesia. Based on the research, percentage of household with expenses over Rp 1.5 million (C1 class and above) has reached 62% of total population in 2011. In 2008 it was only 34%. The rising middle class population will increase DILD’s products buyer since their products are mainly focused on middle-up segment.
Figure 3: Indonesian Middle Class Growth
* Household expenses classes are in thousand Rupiah unit
Source: AC Nielsen, Pefindo Equity & Index Valuation Division
BUSINESS INFORMATION
“Disclaimer statement in the last page
is an integral part of this report”
www.pefindo.com
Intiland Development, Tbk
June 13th, 2012 Page 5 of 18
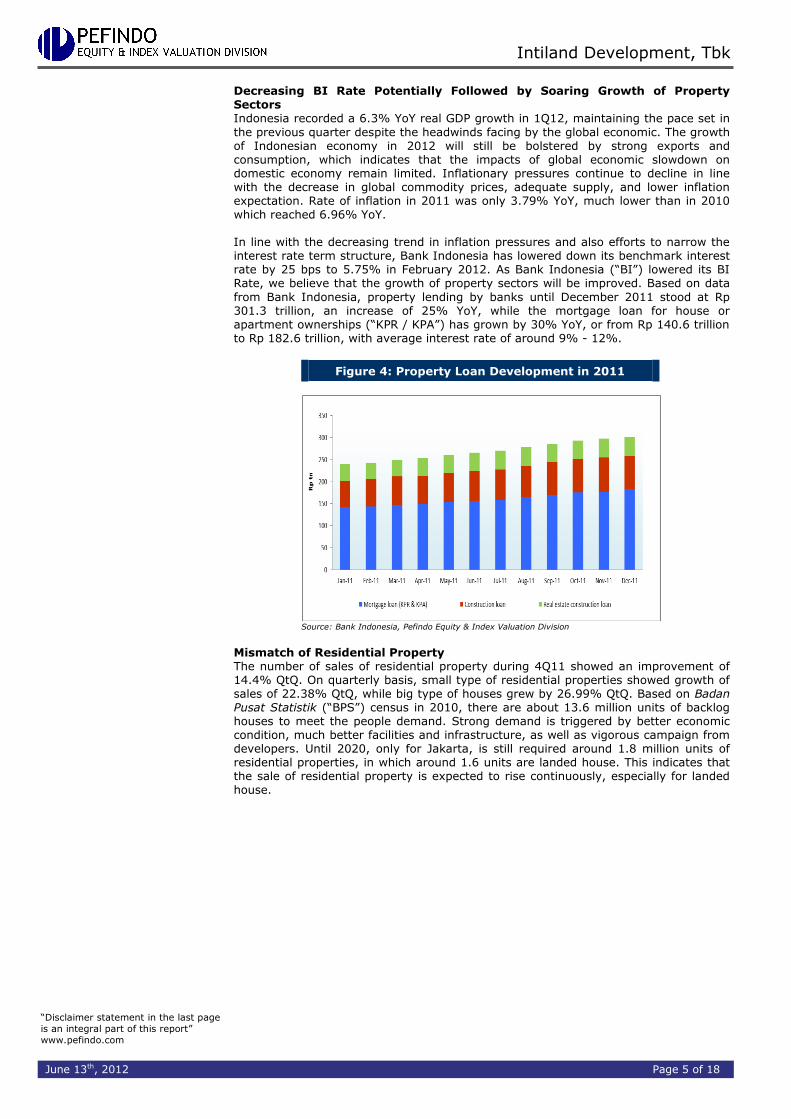
Decreasing BI Rate Potentially Followed by Soaring Growth of Property Sectors Indonesia recorded a 6.3% YoY real GDP growth in 1Q12, maintaining the pace set in
the previous quarter despite the headwinds facing by the global economic. The growth of Indonesian economy in 2012 will still be bolstered by strong exports and consumption, which indicates that the impacts of global economic slowdown on domestic economy remain limited. Inflationary pressures continue to decline in line with the decrease in global commodity prices, adequate supply, and lower inflation expectation. Rate of inflation in 2011 was only 3.79% YoY, much lower than in 2010 which reached 6.96% YoY. In line with the decreasing trend in inflation pressures and also efforts to narrow the interest rate term structure, Bank Indonesia has lowered down its benchmark interest rate by 25 bps to 5.75% in February 2012. As Bank Indonesia (“BI”) lowered its BI Rate, we believe that the growth of property sectors will be improved. Based on data
from Bank Indonesia, property lending by banks until December 2011 stood at Rp 301.3 trillion, an increase of 25% YoY, while the mortgage loan for house or apartment ownerships (“KPR / KPA”) has grown by 30% YoY, or from Rp 140.6 trillion to Rp 182.6 trillion, with average interest rate of around 9% - 12%.
Figure 4: Property Loan Development in 2011
Source: Bank Indonesia, Pefindo Equity & Index Valuation Division
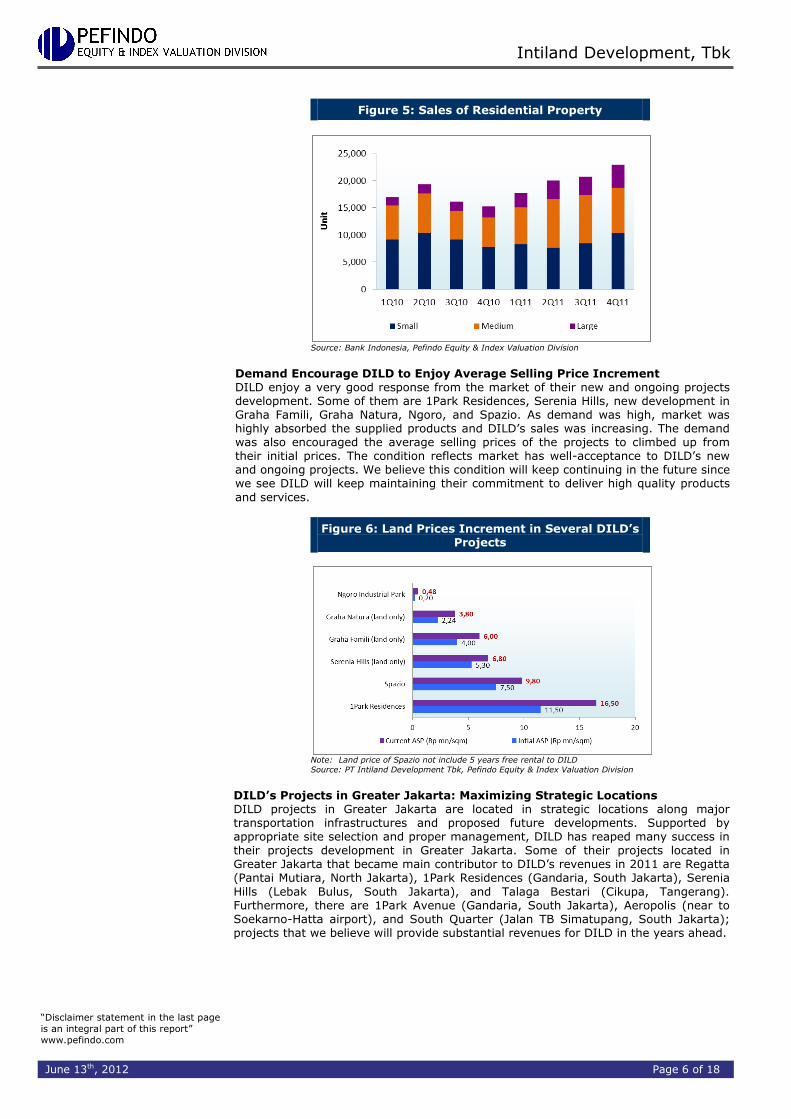
Mismatch of Residential Property The number of sales of residential property during 4Q11 showed an improvement of 14.4% QtQ. On quarterly basis, small type of residential properties showed growth of sales of 22.38% QtQ, while big type of houses grew by 26.99% QtQ. Based on Badan Pusat Statistik (“BPS”) census in 2010, there are about 13.6 million units of backlog houses to meet the people demand. Strong demand is triggered by better economic condition, much better facilities and infrastructure, as well as vigorous campaign from developers. Until 2020, only for Jakarta, is still required around 1.8 million units of residential properties, in which around 1.6 units are landed house. This indicates that the sale of residential property is expected to rise continuously, especially for landed house.
“Disclaimer statement in the last page
is an integral part of this report”
www.pefindo.com
Intiland Development, Tbk
June 13th, 2012 Page 6 of 18
Figure 5: Sales of Residential Property
Source: Bank Indonesia, Pefindo Equity & Index Valuation Division
Demand Encourage DILD to Enjoy Average Selling Price Increment DILD enjoy a very good response from the market of their new and ongoing projects development. Some of them are 1Park Residences, Serenia Hills, new development in Graha Famili, Graha Natura, Ngoro, and Spazio. As demand was high, market was highly absorbed the supplied products and DILD’s sales was increasing. The demand was also encouraged the average selling prices of the projects to climbed up from their initial prices. The condition reflects market has well-acceptance to DILD’s new and ongoing projects. We believe this condition will keep continuing in the future since we see DILD will keep maintaining their commitment to deliver high quality products
and services.
Figure 6: Land Prices Increment in Several DILD’s Projects
Note: Land price of Spazio not include 5 years free rental to DILD
Source: PT Intiland Development Tbk, Pefindo Equity & Index Valuation Division
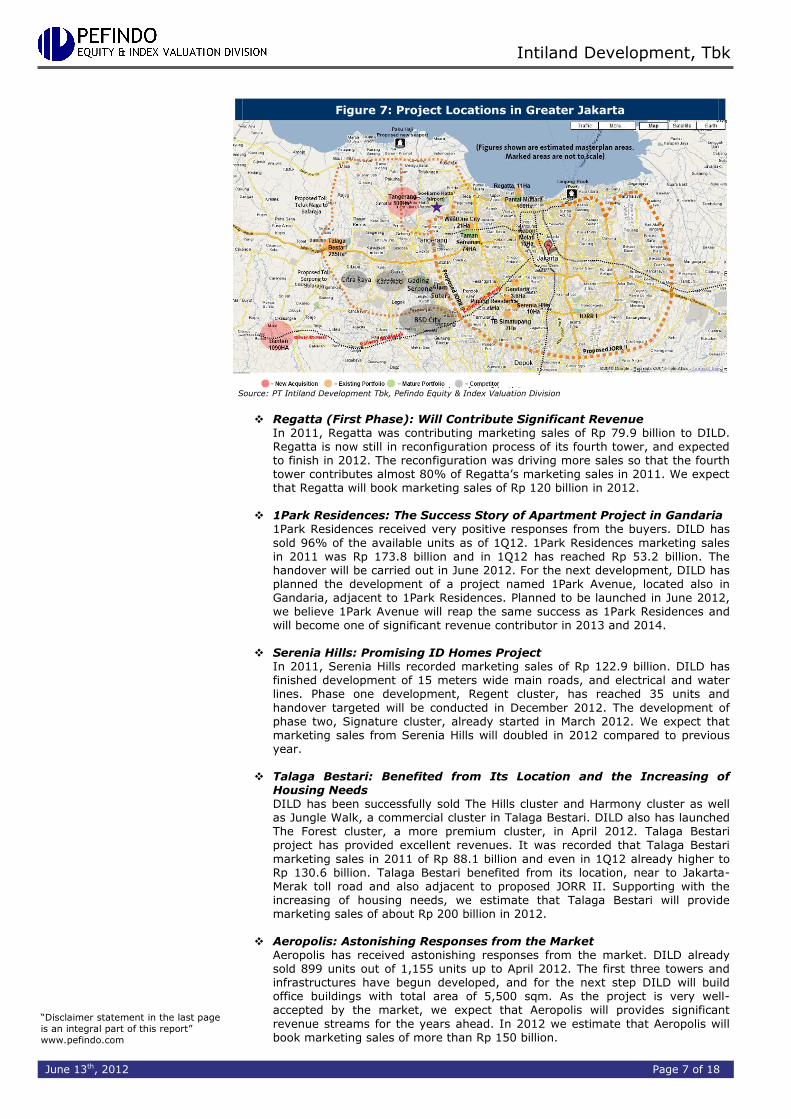
DILD’s Projects in Greater Jakarta: Maximizing Strategic Locations DILD projects in Greater Jakarta are located in strategic locations along major transportation infrastructures and proposed future developments. Supported by appropriate site selection and proper management, DILD has reaped many success in their projects development in Greater Jakarta. Some of their projects located in Greater Jakarta that became main contributor to DILD’s revenues in 2011 are Regatta (Pantai Mutiara, North Jakarta), 1Park Residences (Gandaria, South Jakarta), Serenia
Hills (Lebak Bulus, South Jakarta), and Talaga Bestari (Cikupa, Tangerang). Furthermore, there are 1Park Avenue (Gandaria, South Jakarta), Aeropolis (near to Soekarno-Hatta airport), and South Quarter (Jalan TB Simatupang, South Jakarta); projects that we believe will provide substantial revenues for DILD in the years ahead.
“Disclaimer statement in the last page
is an integral part of this report”
www.pefindo.com
Intiland Development, Tbk
June 13th, 2012 Page 7 of 18
Figure 7: Project Locations in Greater Jakarta
Source: PT Intiland Development Tbk, Pefindo Equity & Index Valuation Division
Regatta (First Phase): Will Contribute Significant Revenue
In 2011, Regatta was contributing marketing sales of Rp 79.9 billion to DILD. Regatta is now still in reconfiguration process of its fourth tower, and expected to finish in 2012. The reconfiguration was driving more sales so that the fourth tower contributes almost 80% of Regatta’s marketing sales in 2011. We expect that Regatta will book marketing sales of Rp 120 billion in 2012.
1Park Residences: The Success Story of Apartment Project in Gandaria
1Park Residences received very positive responses from the buyers. DILD has
sold 96% of the available units as of 1Q12. 1Park Residences marketing sales in 2011 was Rp 173.8 billion and in 1Q12 has reached Rp 53.2 billion. The handover will be carried out in June 2012. For the next development, DILD has planned the development of a project named 1Park Avenue, located also in Gandaria, adjacent to 1Park Residences. Planned to be launched in June 2012, we believe 1Park Avenue will reap the same success as 1Park Residences and will become one of significant revenue contributor in 2013 and 2014.
Serenia Hills: Promising ID Homes Project In 2011, Serenia Hills recorded marketing sales of Rp 122.9 billion. DILD has finished development of 15 meters wide main roads, and electrical and water lines. Phase one development, Regent cluster, has reached 35 units and
handover targeted will be conducted in December 2012. The development of phase two, Signature cluster, already started in March 2012. We expect that marketing sales from Serenia Hills will doubled in 2012 compared to previous year.
Talaga Bestari: Benefited from Its Location and the Increasing of
Housing Needs DILD has been successfully sold The Hills cluster and Harmony cluster as well as Jungle Walk, a commercial cluster in Talaga Bestari. DILD also has launched The Forest cluster, a more premium cluster, in April 2012. Talaga Bestari project has provided excellent revenues. It was recorded that Talaga Bestari
marketing sales in 2011 of Rp 88.1 billion and even in 1Q12 already higher to Rp 130.6 billion. Talaga Bestari benefited from its location, near to Jakarta-Merak toll road and also adjacent to proposed JORR II. Supporting with the increasing of housing needs, we estimate that Talaga Bestari will provide marketing sales of about Rp 200 billion in 2012.
Aeropolis: Astonishing Responses from the Market
Aeropolis has received astonishing responses from the market. DILD already sold 899 units out of 1,155 units up to April 2012. The first three towers and infrastructures have begun developed, and for the next step DILD will build office buildings with total area of 5,500 sqm. As the project is very well-accepted by the market, we expect that Aeropolis will provides significant
revenue streams for the years ahead. In 2012 we estimate that Aeropolis will book marketing sales of more than Rp 150 billion.
“Disclaimer statement in the last page
is an integral part of this report”
www.pefindo.com
Intiland Development, Tbk
June 13th, 2012 Page 8 of 18
South Quarter: Office Park Mega Project in the next CBD Area
South Quarter project location is very strategic, besides located at the side of a
toll road; TB Simatupang is estimated to become the next CBD area in South Jakarta. Compared to other projects in TB Simatupang, South Quarter is the largest office complex project. DILD is already launched the first phase of the project. Regarding to historical office occupancy level in Jakarta was around 90% and favorable of social and economic conditions, we expect South Quarter will enjoying high demand for office space as companies expand.
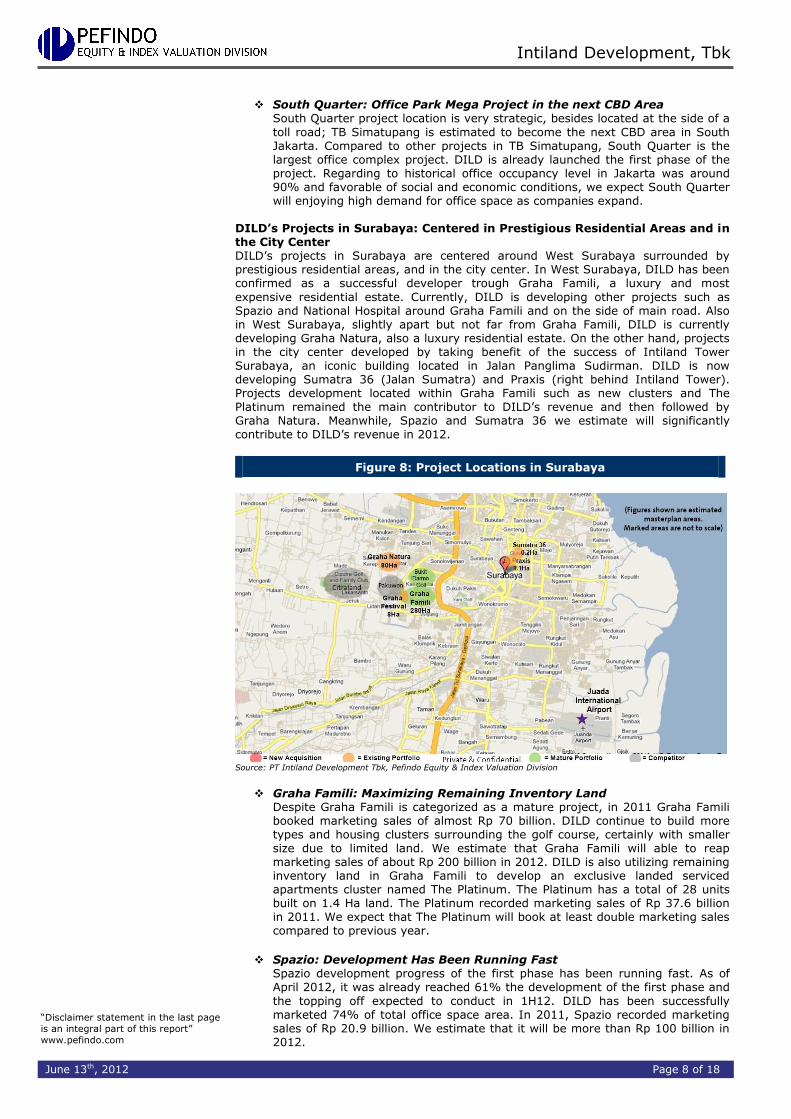
DILD’s Projects in Surabaya: Centered in Prestigious Residential Areas and in the City Center DILD’s projects in Surabaya are centered around West Surabaya surrounded by prestigious residential areas, and in the city center. In West Surabaya, DILD has been confirmed as a successful developer trough Graha Famili, a luxury and most
expensive residential estate. Currently, DILD is developing other projects such as Spazio and National Hospital around Graha Famili and on the side of main road. Also in West Surabaya, slightly apart but not far from Graha Famili, DILD is currently developing Graha Natura, also a luxury residential estate. On the other hand, projects in the city center developed by taking benefit of the success of Intiland Tower Surabaya, an iconic building located in Jalan Panglima Sudirman. DILD is now developing Sumatra 36 (Jalan Sumatra) and Praxis (right behind Intiland Tower). Projects development located within Graha Famili such as new clusters and The Platinum remained the main contributor to DILD’s revenue and then followed by Graha Natura. Meanwhile, Spazio and Sumatra 36 we estimate will significantly contribute to DILD’s revenue in 2012.
Figure 8: Project Locations in Surabaya
Source: PT Intiland Development Tbk, Pefindo Equity & Index Valuation Division
Graha Famili: Maximizing Remaining Inventory Land Despite Graha Famili is categorized as a mature project, in 2011 Graha Famili booked marketing sales of almost Rp 70 billion. DILD continue to build more types and housing clusters surrounding the golf course, certainly with smaller size due to limited land. We estimate that Graha Famili will able to reap marketing sales of about Rp 200 billion in 2012. DILD is also utilizing remaining inventory land in Graha Famili to develop an exclusive landed serviced apartments cluster named The Platinum. The Platinum has a total of 28 units built on 1.4 Ha land. The Platinum recorded marketing sales of Rp 37.6 billion in 2011. We expect that The Platinum will book at least double marketing sales compared to previous year.
Spazio: Development Has Been Running Fast
Spazio development progress of the first phase has been running fast. As of April 2012, it was already reached 61% the development of the first phase and
the topping off expected to conduct in 1H12. DILD has been successfully marketed 74% of total office space area. In 2011, Spazio recorded marketing sales of Rp 20.9 billion. We estimate that it will be more than Rp 100 billion in 2012.
“Disclaimer statement in the last page
is an integral part of this report”
www.pefindo.com
Intiland Development, Tbk
June 13th, 2012 Page 9 of 18
Graha Natura: Will Be the Next DILD’s Flagship Premium Landed
Residential Project in West Surabaya
Currently the project is undergoing land development works in 25 Ha land sale area for the first few blocks and also supporting infrastructures. Graha Natura is already starting to booked revenue. Graha Natura booked marketing sales of Rp 60.5 billion in 2011. Supported by DILD’s reputation and well-responses from the market, we believe Graha Natura will be the next DILD’s flagship premium landed residential project in West Surabaya. In 2012, we estimate Graha Natura will achieve Rp 200 billion in marketing sales and continue growing for the next years.
Sumatra 36: Housing Apartment Project in Prime Area and in the
middle of Increasing Demand of Living in the City Center Sumatra 36 is built to answer increasing trend of the need to live in the city
center. Currently DILD is focusing on marketing activities while they are preparing for the land and opening tender for the contractors. Considering Surabaya is the second biggest city after Jakarta with the increasing demand living in the city center and Sumatra 36 is located in strategic location, we believe that market will give excellent responses to the project.
Modern Hospital: Located in Premium Area in West Surabaya
The development of National Hospital has entered the finishing work and targeted to commence its operation at the beginning of 2H12. Surrounding with premium residential estates and equipped with modern medical technology, National Hospital will be a very good alternative for them that looking for high
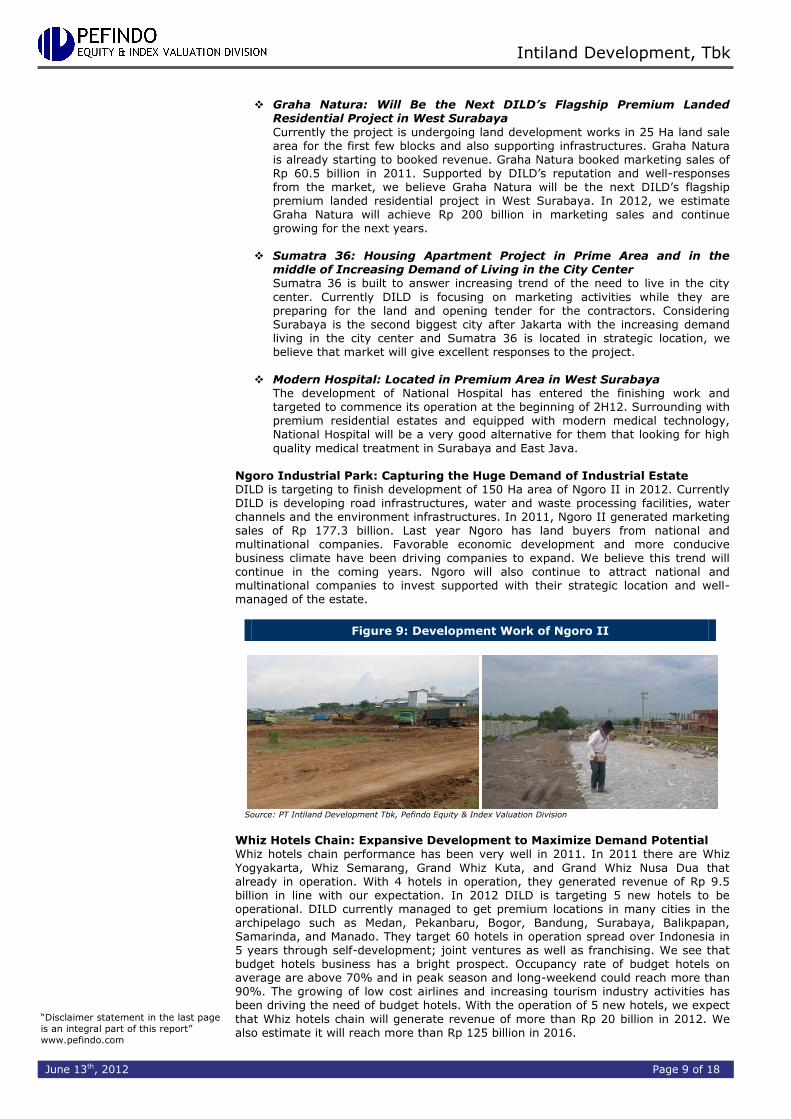
quality medical treatment in Surabaya and East Java. Ngoro Industrial Park: Capturing the Huge Demand of Industrial Estate DILD is targeting to finish development of 150 Ha area of Ngoro II in 2012. Currently DILD is developing road infrastructures, water and waste processing facilities, water channels and the environment infrastructures. In 2011, Ngoro II generated marketing sales of Rp 177.3 billion. Last year Ngoro has land buyers from national and multinational companies. Favorable economic development and more conducive business climate have been driving companies to expand. We believe this trend will continue in the coming years. Ngoro will also continue to attract national and multinational companies to invest supported with their strategic location and well-managed of the estate.
Figure 9: Development Work of Ngoro II
Source: PT Intiland Development Tbk, Pefindo Equity & Index Valuation Division
Whiz Hotels Chain: Expansive Development to Maximize Demand Potential Whiz hotels chain performance has been very well in 2011. In 2011 there are Whiz
Yogyakarta, Whiz Semarang, Grand Whiz Kuta, and Grand Whiz Nusa Dua that already in operation. With 4 hotels in operation, they generated revenue of Rp 9.5 billion in line with our expectation. In 2012 DILD is targeting 5 new hotels to be operational. DILD currently managed to get premium locations in many cities in the archipelago such as Medan, Pekanbaru, Bogor, Bandung, Surabaya, Balikpapan, Samarinda, and Manado. They target 60 hotels in operation spread over Indonesia in 5 years through self-development; joint ventures as well as franchising. We see that budget hotels business has a bright prospect. Occupancy rate of budget hotels on average are above 70% and in peak season and long-weekend could reach more than 90%. The growing of low cost airlines and increasing tourism industry activities has been driving the need of budget hotels. With the operation of 5 new hotels, we expect
that Whiz hotels chain will generate revenue of more than Rp 20 billion in 2012. We also estimate it will reach more than Rp 125 billion in 2016.
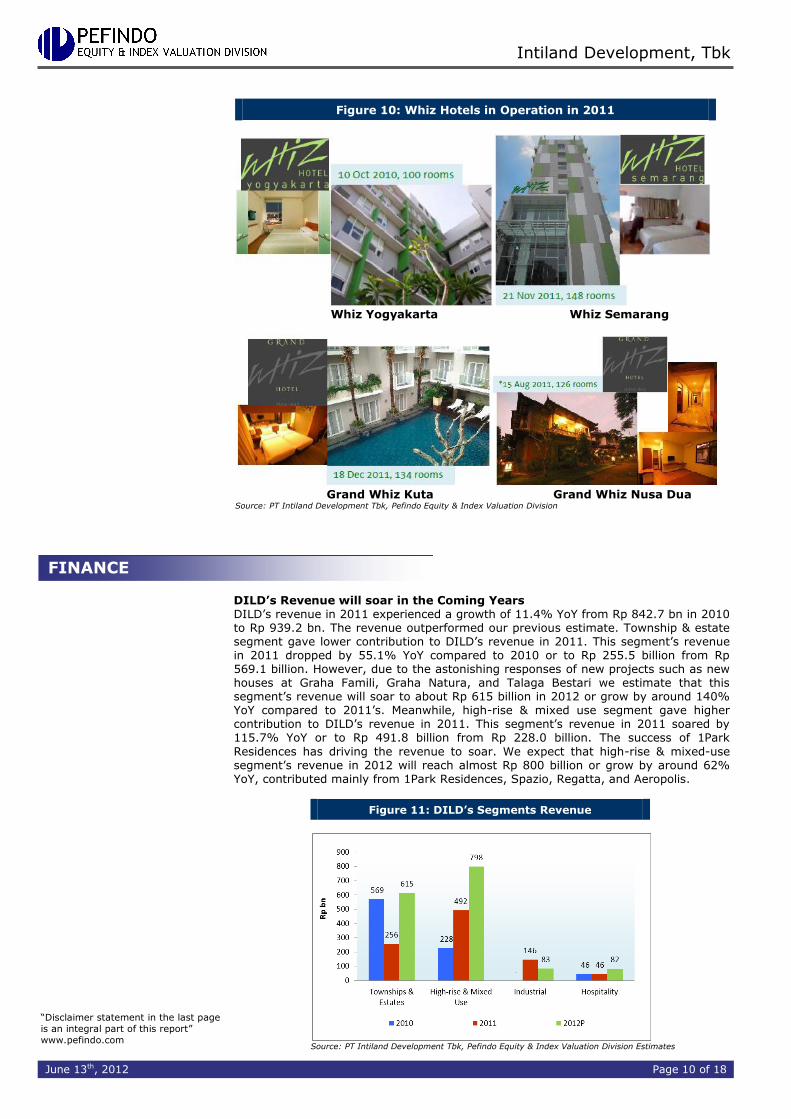
“Disclaimer statement in the last page
is an integral part of this report”
www.pefindo.com
Intiland Development, Tbk
June 13th, 2012 Page 10 of 18
Figure 10: Whiz Hotels in Operation in 2011
Whiz Yogyakarta Whiz Semarang
Grand Whiz Kuta Grand Whiz Nusa Dua Source: PT Intiland Development Tbk, Pefindo Equity & Index Valuation Division
DILD’s Revenue will soar in the Coming Years DILD’s revenue in 2011 experienced a growth of 11.4% YoY from Rp 842.7 bn in 2010 to Rp 939.2 bn. The revenue outperformed our previous estimate. Township & estate segment gave lower contribution to DILD’s revenue in 2011. This segment’s revenue in 2011 dropped by 55.1% YoY compared to 2010 or to Rp 255.5 billion from Rp 569.1 billion. However, due to the astonishing responses of new projects such as new houses at Graha Famili, Graha Natura, and Talaga Bestari we estimate that this segment’s revenue will soar to about Rp 615 billion in 2012 or grow by around 140% YoY compared to 2011’s. Meanwhile, high-rise & mixed use segment gave higher contribution to DILD’s revenue in 2011. This segment’s revenue in 2011 soared by 115.7% YoY or to Rp 491.8 billion from Rp 228.0 billion. The success of 1Park
Residences has driving the revenue to soar. We expect that high-rise & mixed-use segment’s revenue in 2012 will reach almost Rp 800 billion or grow by around 62% YoY, contributed mainly from 1Park Residences, Spazio, Regatta, and Aeropolis.
Figure 11: DILD’s Segments Revenue
Source: PT Intiland Development Tbk, Pefindo Equity & Index Valuation Division Estimates
FINANCE
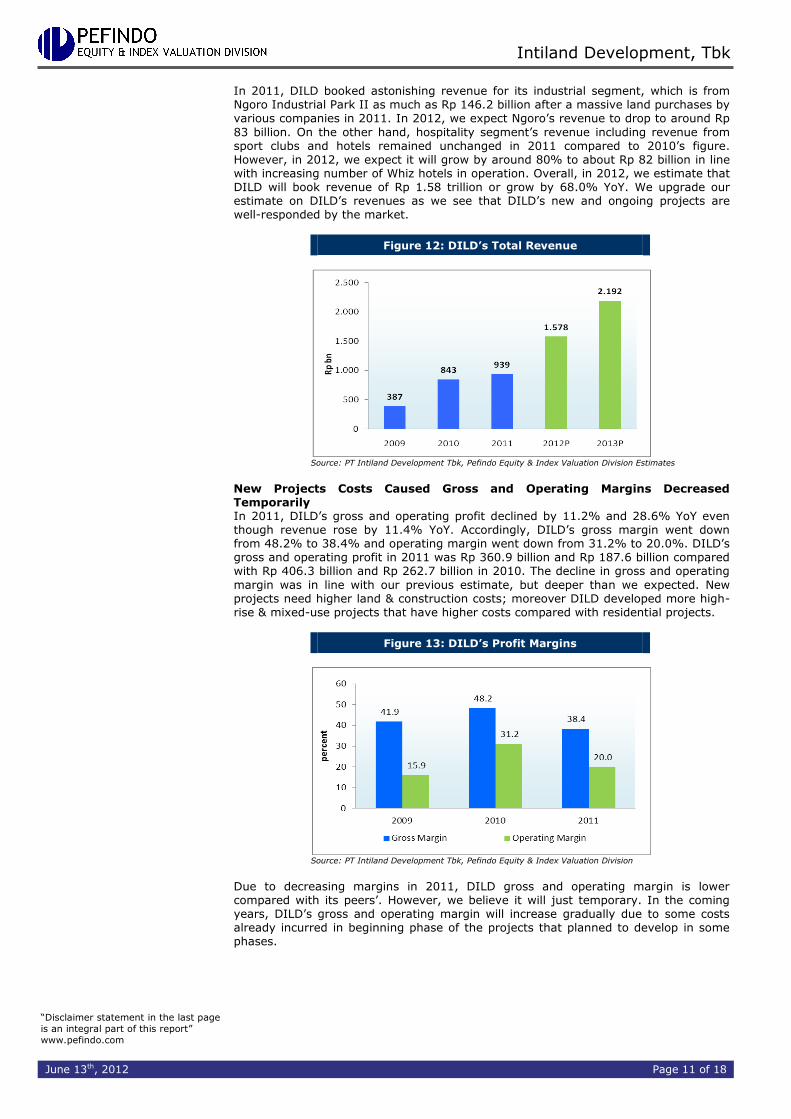
“Disclaimer statement in the last page
is an integral part of this report”
www.pefindo.com
Intiland Development, Tbk
June 13th, 2012 Page 11 of 18
In 2011, DILD booked astonishing revenue for its industrial segment, which is from Ngoro Industrial Park II as much as Rp 146.2 billion after a massive land purchases by various companies in 2011. In 2012, we expect Ngoro’s revenue to drop to around Rp
83 billion. On the other hand, hospitality segment’s revenue including revenue from sport clubs and hotels remained unchanged in 2011 compared to 2010’s figure. However, in 2012, we expect it will grow by around 80% to about Rp 82 billion in line with increasing number of Whiz hotels in operation. Overall, in 2012, we estimate that DILD will book revenue of Rp 1.58 trillion or grow by 68.0% YoY. We upgrade our estimate on DILD’s revenues as we see that DILD’s new and ongoing projects are well-responded by the market.
Figure 12: DILD’s Total Revenue
Source: PT Intiland Development Tbk, Pefindo Equity & Index Valuation Division Estimates
New Projects Costs Caused Gross and Operating Margins Decreased Temporarily In 2011, DILD’s gross and operating profit declined by 11.2% and 28.6% YoY even though revenue rose by 11.4% YoY. Accordingly, DILD’s gross margin went down from 48.2% to 38.4% and operating margin went down from 31.2% to 20.0%. DILD’s gross and operating profit in 2011 was Rp 360.9 billion and Rp 187.6 billion compared with Rp 406.3 billion and Rp 262.7 billion in 2010. The decline in gross and operating
margin was in line with our previous estimate, but deeper than we expected. New projects need higher land & construction costs; moreover DILD developed more high-rise & mixed-use projects that have higher costs compared with residential projects.
Figure 13: DILD’s Profit Margins
Source: PT Intiland Development Tbk, Pefindo Equity & Index Valuation Division
Due to decreasing margins in 2011, DILD gross and operating margin is lower compared with its peers’. However, we believe it will just temporary. In the coming years, DILD’s gross and operating margin will increase gradually due to some costs already incurred in beginning phase of the projects that planned to develop in some phases.
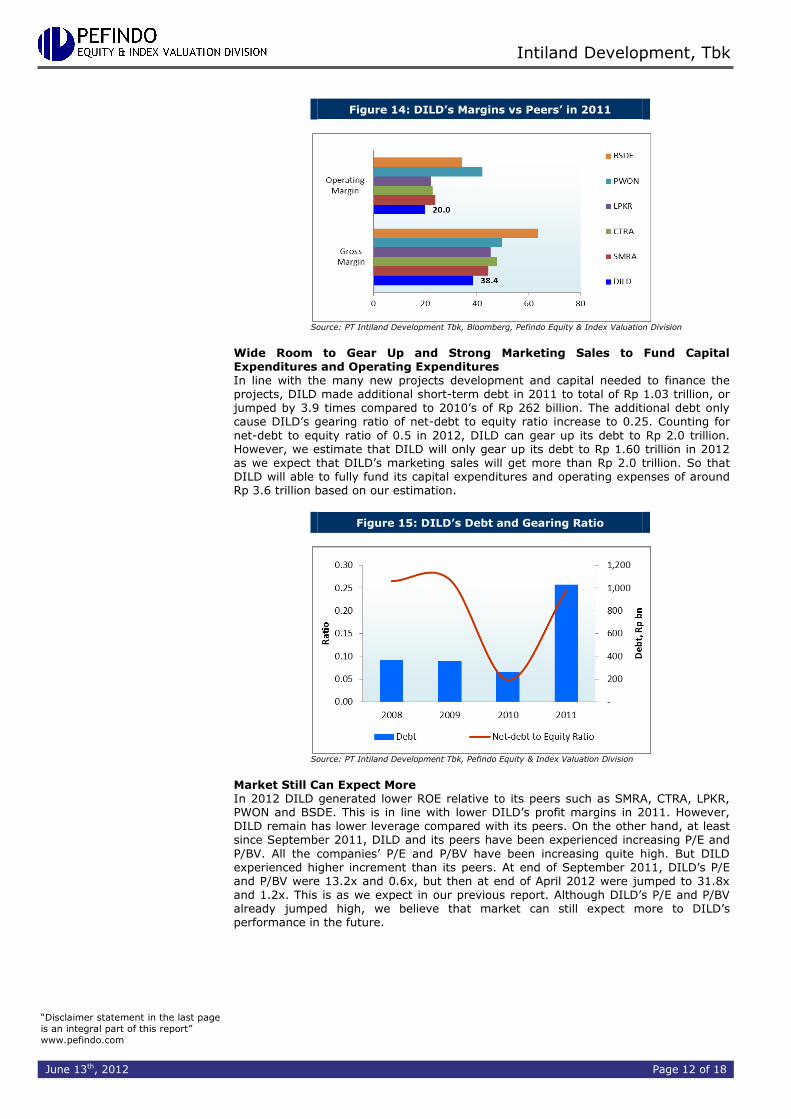
“Disclaimer statement in the last page
is an integral part of this report”
www.pefindo.com
Intiland Development, Tbk
June 13th, 2012 Page 12 of 18
Figure 14: DILD’s Margins vs Peers’ in 2011
Source: PT Intiland Development Tbk, Bloomberg, Pefindo Equity & Index Valuation Division
Wide Room to Gear Up and Strong Marketing Sales to Fund Capital Expenditures and Operating Expenditures In line with the many new projects development and capital needed to finance the projects, DILD made additional short-term debt in 2011 to total of Rp 1.03 trillion, or jumped by 3.9 times compared to 2010’s of Rp 262 billion. The additional debt only cause DILD’s gearing ratio of net-debt to equity ratio increase to 0.25. Counting for
net-debt to equity ratio of 0.5 in 2012, DILD can gear up its debt to Rp 2.0 trillion. However, we estimate that DILD will only gear up its debt to Rp 1.60 trillion in 2012 as we expect that DILD’s marketing sales will get more than Rp 2.0 trillion. So that DILD will able to fully fund its capital expenditures and operating expenses of around Rp 3.6 trillion based on our estimation.
Figure 15: DILD’s Debt and Gearing Ratio
Source: PT Intiland Development Tbk, Pefindo Equity & Index Valuation Division
Market Still Can Expect More In 2012 DILD generated lower ROE relative to its peers such as SMRA, CTRA, LPKR, PWON and BSDE. This is in line with lower DILD’s profit margins in 2011. However, DILD remain has lower leverage compared with its peers. On the other hand, at least since September 2011, DILD and its peers have been experienced increasing P/E and
P/BV. All the companies’ P/E and P/BV have been increasing quite high. But DILD experienced higher increment than its peers. At end of September 2011, DILD’s P/E and P/BV were 13.2x and 0.6x, but then at end of April 2012 were jumped to 31.8x and 1.2x. This is as we expect in our previous report. Although DILD’s P/E and P/BV already jumped high, we believe that market can still expect more to DILD’s performance in the future.
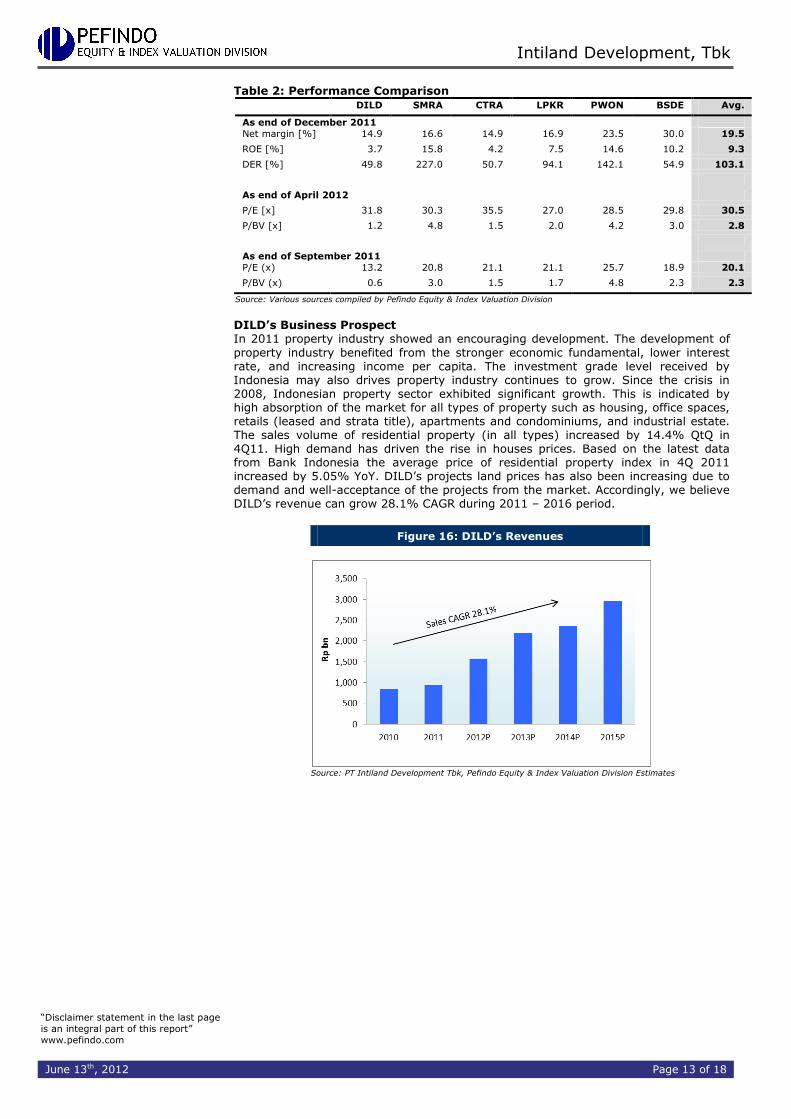
“Disclaimer statement in the last page
is an integral part of this report”
www.pefindo.com
Intiland Development, Tbk
June 13th, 2012 Page 13 of 18
Table 2: Performance Comparison DILD SMRA CTRA LPKR PWON BSDE Avg.
As end of December 2011
Net margin [%] 14.9 16.6 14.9 16.9 23.5 30.0 19.5
ROE [%] 3.7 15.8 4.2 7.5 14.6 10.2 9.3
DER [%] 49.8 227.0 50.7 94.1 142.1 54.9 103.1
As end of April 2012
P/E [x] 31.8 30.3 35.5 27.0 28.5 29.8 30.5
P/BV [x] 1.2 4.8 1.5 2.0 4.2 3.0 2.8
As end of September 2011
P/E (x) 13.2 20.8 21.1 21.1 25.7 18.9 20.1
P/BV (x) 0.6 3.0 1.5 1.7 4.8 2.3 2.3
Source: Various sources compiled by Pefindo Equity & Index Valuation Division
DILD’s Business Prospect In 2011 property industry showed an encouraging development. The development of
property industry benefited from the stronger economic fundamental, lower interest rate, and increasing income per capita. The investment grade level received by Indonesia may also drives property industry continues to grow. Since the crisis in 2008, Indonesian property sector exhibited significant growth. This is indicated by high absorption of the market for all types of property such as housing, office spaces, retails (leased and strata title), apartments and condominiums, and industrial estate. The sales volume of residential property (in all types) increased by 14.4% QtQ in 4Q11. High demand has driven the rise in houses prices. Based on the latest data from Bank Indonesia the average price of residential property index in 4Q 2011 increased by 5.05% YoY. DILD’s projects land prices has also been increasing due to demand and well-acceptance of the projects from the market. Accordingly, we believe DILD’s revenue can grow 28.1% CAGR during 2011 – 2016 period.
Figure 16: DILD’s Revenues
Source: PT Intiland Development Tbk, Pefindo Equity & Index Valuation Division Estimates
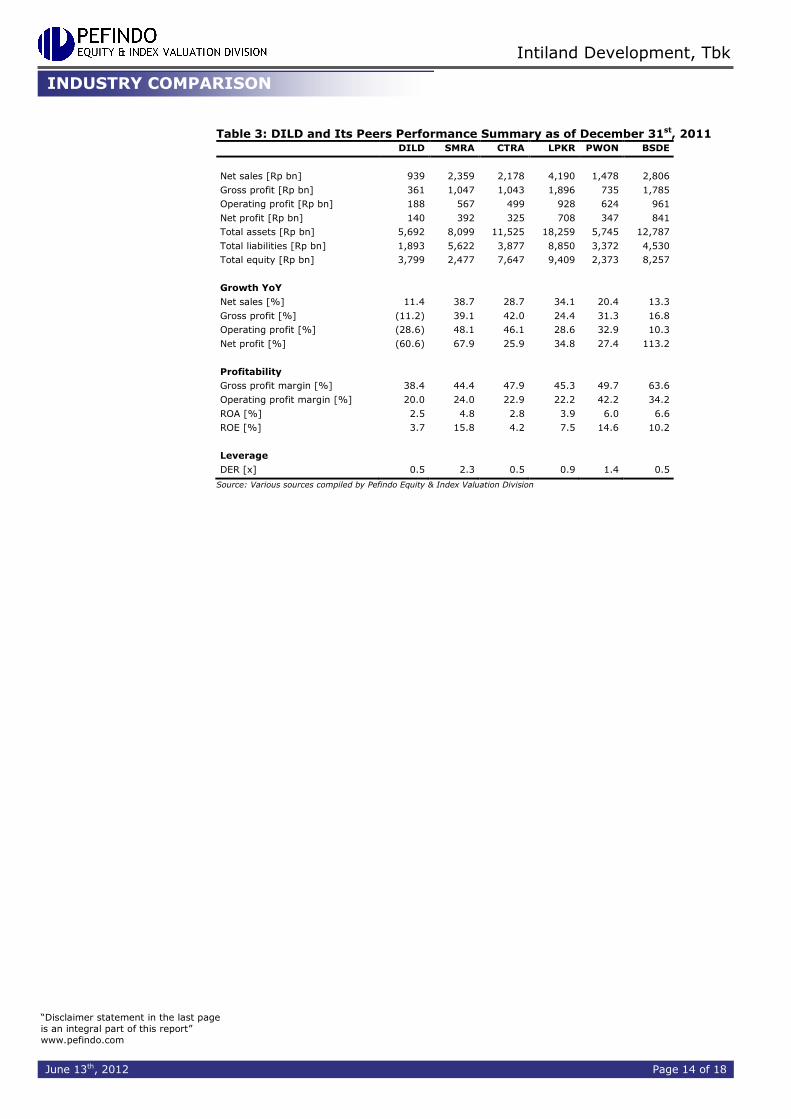
“Disclaimer statement in the last page
is an integral part of this report”
www.pefindo.com
Intiland Development, Tbk
June 13th, 2012 Page 14 of 18
Table 3: DILD and Its Peers Performance Summary as of December 31st, 2011 DILD SMRA CTRA LPKR PWON BSDE
Net sales [Rp bn] 939 2,359 2,178 4,190 1,478 2,806
Gross profit [Rp bn] 361 1,047 1,043 1,896 735 1,785
Operating profit [Rp bn] 188 567 499 928 624 961
Net profit [Rp bn] 140 392 325 708 347 841
Total assets [Rp bn] 5,692 8,099 11,525 18,259 5,745 12,787
Total liabilities [Rp bn] 1,893 5,622 3,877 8,850 3,372 4,530
Total equity [Rp bn] 3,799 2,477 7,647 9,409 2,373 8,257
Growth YoY
Net sales [%] 11.4 38.7 28.7 34.1 20.4 13.3
Gross profit [%] (11.2) 39.1 42.0 24.4 31.3 16.8
Operating profit [%] (28.6) 48.1 46.1 28.6 32.9 10.3
Net profit [%] (60.6) 67.9 25.9 34.8 27.4 113.2
Profitability
Gross profit margin [%] 38.4 44.4 47.9 45.3 49.7 63.6
Operating profit margin [%] 20.0 24.0 22.9 22.2 42.2 34.2
ROA [%] 2.5 4.8 2.8 3.9 6.0 6.6
ROE [%] 3.7 15.8 4.2 7.5 14.6 10.2
Leverage
DER [x] 0.5 2.3 0.5 0.9 1.4 0.5
Source: Various sources compiled by Pefindo Equity & Index Valuation Division
INDUSTRY COMPARISON
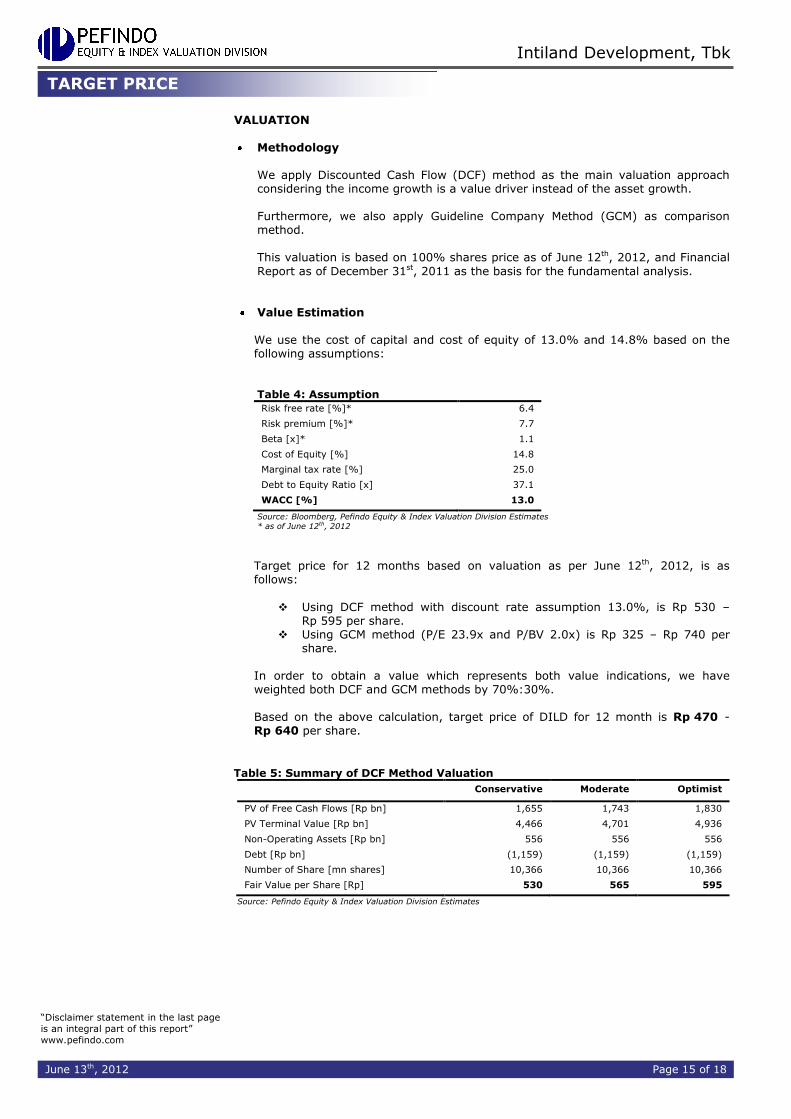
“Disclaimer statement in the last page
is an integral part of this report”
www.pefindo.com
Intiland Development, Tbk
June 13th, 2012 Page 15 of 18
VALUATION
Methodology We apply Discounted Cash Flow (DCF) method as the main valuation approach considering the income growth is a value driver instead of the asset growth. Furthermore, we also apply Guideline Company Method (GCM) as comparison method. This valuation is based on 100% shares price as of June 12th, 2012, and Financial
Report as of December 31st, 2011 as the basis for the fundamental analysis.
Value Estimation
We use the cost of capital and cost of equity of 13.0% and 14.8% based on the following assumptions: Table 4: Assumption
Risk free rate [%]* 6.4
Risk premium [%]* 7.7
Beta [x]* 1.1
Cost of Equity [%] 14.8
Marginal tax rate [%] 25.0
Debt to Equity Ratio [x] 37.1
WACC [%] 13.0
Source: Bloomberg, Pefindo Equity & Index Valuation Division Estimates * as of June 12th, 2012
Target price for 12 months based on valuation as per June 12th, 2012, is as follows:
Using DCF method with discount rate assumption 13.0%, is Rp 530 – Rp 595 per share.
Using GCM method (P/E 23.9x and P/BV 2.0x) is Rp 325 – Rp 740 per share.
In order to obtain a value which represents both value indications, we have weighted both DCF and GCM methods by 70%:30%. Based on the above calculation, target price of DILD for 12 month is Rp 470 - Rp 640 per share.
Table 5: Summary of DCF Method Valuation
Conservative Moderate Optimist
PV of Free Cash Flows [Rp bn] 1,655 1,743 1,830
PV Terminal Value [Rp bn] 4,466 4,701 4,936
Non-Operating Assets [Rp bn] 556 556 556
Debt [Rp bn] (1,159) (1,159) (1,159)
Number of Share [mn shares] 10,366 10,366 10,366
Fair Value per Share [Rp] 530 565 595
Source: Pefindo Equity & Index Valuation Division Estimates
TARGET PRICE
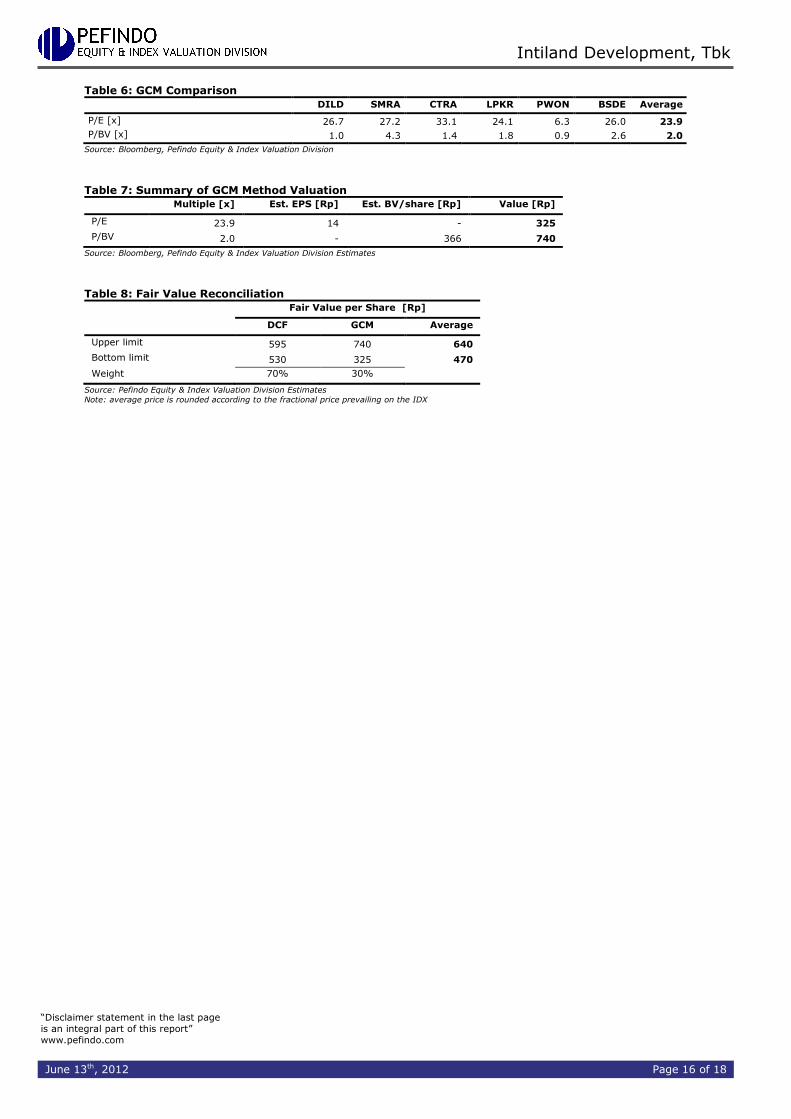
“Disclaimer statement in the last page
is an integral part of this report”
www.pefindo.com
Intiland Development, Tbk
June 13th, 2012 Page 16 of 18
Table 6: GCM Comparison
DILD SMRA CTRA LPKR PWON BSDE Average
P/E [x] 26.7 27.2 33.1 24.1 6.3 26.0 23.9
P/BV [x] 1.0 4.3 1.4 1.8 0.9 2.6 2.0
Source: Bloomberg, Pefindo Equity & Index Valuation Division Table 7: Summary of GCM Method Valuation
Multiple [x] Est. EPS [Rp] Est. BV/share [Rp] Value [Rp]
P/E 23.9 14 - 325
P/BV 2.0 - 366 740
Source: Bloomberg, Pefindo Equity & Index Valuation Division Estimates
Table 8: Fair Value Reconciliation
Fair Value per Share [Rp]
DCF GCM Average
Upper limit 595 740 640
Bottom limit 530 325 470
Weight 70% 30%
Source: Pefindo Equity & Index Valuation Division Estimates
Note: average price is rounded according to the fractional price prevailing on the IDX
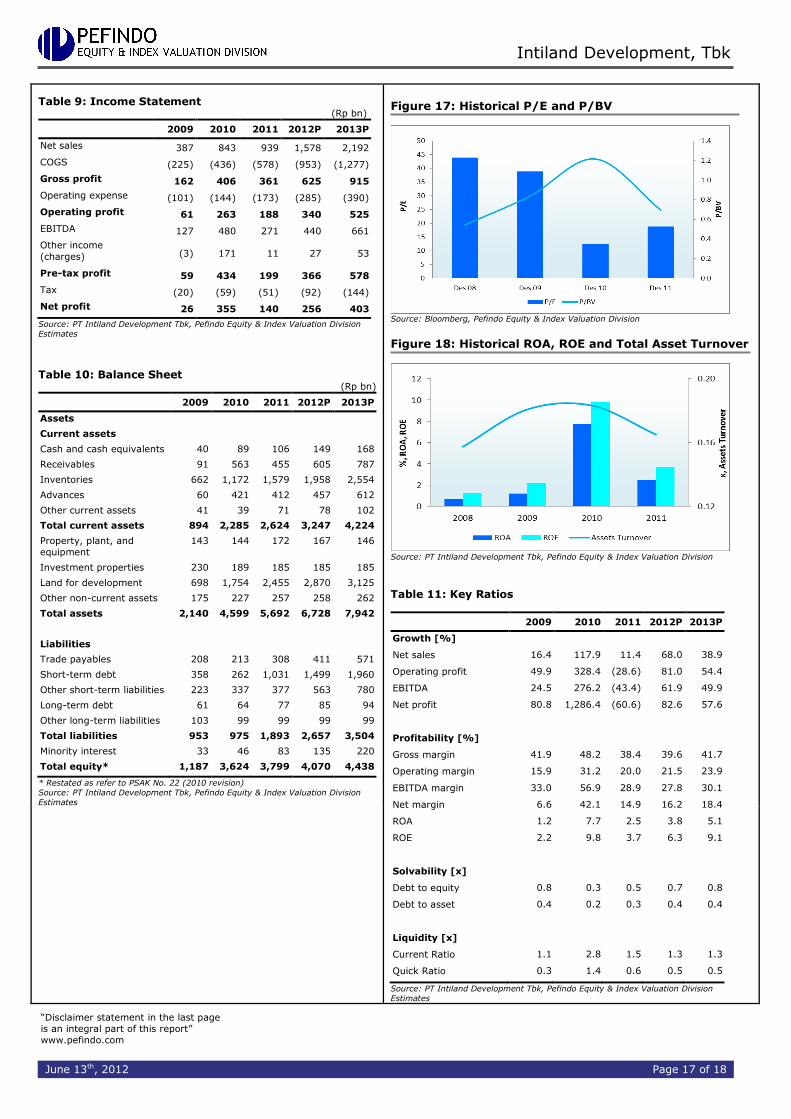
“Disclaimer statement in the last page
is an integral part of this report”
www.pefindo.com
Intiland Development, Tbk
June 13th, 2012 Page 17 of 18
Table 9: Income Statement (Rp bn)
2009 2010 2011 2012P 2013P
Net sales 387 843 939 1,578 2,192
COGS (225) (436) (578) (953) (1,277)
Gross profit 162 406 361 625 915
Operating expense (101) (144) (173) (285) (390)
Operating profit 61 263 188 340 525
EBITDA 127 480 271 440 661
Other income
(charges) (3) 171 11 27 53
Pre-tax profit 59 434 199 366 578
Tax (20) (59) (51) (92) (144)
Net profit 26 355 140 256 403
Source: PT Intiland Development Tbk, Pefindo Equity & Index Valuation Division
Estimates
Table 10: Balance Sheet
(Rp bn)
2009 2010 2011 2012P 2013P
Assets
Current assets
Cash and cash equivalents 40 89 106 149 168
Receivables 91 563 455 605 787
Inventories 662 1,172 1,579 1,958 2,554
Advances 60 421 412 457 612
Other current assets 41 39 71 78 102
Total current assets 894 2,285 2,624 3,247 4,224
Property, plant, and
equipment
143 144 172 167 146
Investment properties 230 189 185 185 185
Land for development 698 1,754 2,455 2,870 3,125
Other non-current assets 175 227 257 258 262
Total assets 2,140 4,599 5,692 6,728 7,942
Liabilities
Trade payables 208 213 308 411 571
Short-term debt 358 262 1,031 1,499 1,960
Other short-term liabilities 223 337 377 563 780
Long-term debt 61 64 77 85 94
Other long-term liabilities 103 99 99 99 99
Total liabilities 953 975 1,893 2,657 3,504
Minority interest 33 46 83 135 220
Total equity* 1,187 3,624 3,799 4,070 4,438
* Restated as refer to PSAK No. 22 (2010 revision)
Source: PT Intiland Development Tbk, Pefindo Equity & Index Valuation Division
Estimates
Figure 17: Historical P/E and P/BV
Source: Bloomberg, Pefindo Equity & Index Valuation Division
Figure 18: Historical ROA, ROE and Total Asset Turnover
Source: PT Intiland Development Tbk, Pefindo Equity & Index Valuation Division
Table 11: Key Ratios
2009 2010 2011 2012P 2013P
Growth [%]
Net sales 16.4 117.9 11.4 68.0 38.9
Operating profit 49.9 328.4 (28.6) 81.0 54.4
EBITDA 24.5 276.2 (43.4) 61.9 49.9
Net profit 80.8 1,286.4 (60.6) 82.6 57.6
Profitability [%]
Gross margin 41.9 48.2 38.4 39.6 41.7
Operating margin 15.9 31.2 20.0 21.5 23.9
EBITDA margin 33.0 56.9 28.9 27.8 30.1
Net margin 6.6 42.1 14.9 16.2 18.4
ROA 1.2 7.7 2.5 3.8 5.1
ROE 2.2 9.8 3.7 6.3 9.1
Solvability [x]
Debt to equity 0.8 0.3 0.5 0.7 0.8
Debt to asset 0.4 0.2 0.3 0.4 0.4
Liquidity [x]
Current Ratio 1.1 2.8 1.5 1.3 1.3
Quick Ratio 0.3 1.4 0.6 0.5 0.5
Source: PT Intiland Development Tbk, Pefindo Equity & Index Valuation Division
Estimates
“Disclaimer statement in the last page
is an integral part of this report”
www.pefindo.com
Intiland Development, Tbk
June 13th, 2012 Page 18 of 18
DISCLAIMER
This report was prepared based on the trusted and reliable sources. Nevertheless, we do not guarantee its completeness, accuracy and adequacy. Therefore we do not responsible of any investment decision making based on this report. As for any assumptions, opinions and predictions were solely our internal judgments as per reporting date, and those judgments are subject to change without further notice. We do not responsible for mistake and negligence occurred by using this report. Last performance could not always be used as reference for future outcome. This report is not an offering recommendation, purchase or holds particular shares. This report might not be suitable for some investors. All opinion in this report has been presented fairly as per issuing date with good intentions; however it could be change at any time without further notice. The price, value or income from each share of the Company stated in this report might lower than the investor expectation and investor might obtain lower return than the invested amount. Investment is defined as the probable income that will be received in the future; nonetheless such return may possibly fluctuate. As for the Company which its share is denominated other than Rupiah, the foreign exchange fluctuation may reduce the value, price or investor investment return. This report does not contain any information for tax consideration in investment decision making. The share price target in this report is a fundamental value, not a fair market value nor a transaction price reference required by the regulations. The share price target issued by Pefindo Equity & Index Valuation Division is not a recommendation to buy, sell or hold particular shares and it could not be considered as an investment advice from Pefindo Equity & Index Valuation Division as its scope of service to, or in relation to some parties, including listed companies, financial advisor, broker, investment bank, financial institution and intermediary, in correlation with receiving rewards or any other benefits from that parties. This report is not intended for particular investor and cannot be used as part of investment objective on particular shares and neither an investment recommendation on particular shares or an investment strategy. We strongly recommended investor to consider the suitable situation and condition at first before making decision in relation with the figure in this report. If it is necessary, kindly contact your financial advisor. PEFINDO keeps the activities of Equity Valuation separate from Ratings to preserve independence and objectivity of its analytical processes and products. PEFINDO has established policies and procedures to maintain the confidentiality of certain non-public information received in connection with each analytical process. The entire process, methodology and the database used in the preparation of the Reference Share Price Target Report as a whole is different from the processes, methodologies and databases used PEFINDO in doing the rating. This report was prepared and composed by Pefindo Equity & Index Valuation Division with the objective to enhance shares price transparency of listed companies in Indonesia Stock Exchange (IDX). This report is also free of
other party’s influence, pressure or force either from IDX or the listed company which reviewed by Pefindo Equity & Index Valuation Division. Pefindo Equity & Index Valuation Division will earn reward amounting to Rp 40 mn from the reviewed company for issuing report twice per year. For further information, please visit our website at http://www.pefindo.com This report is prepared and composed by Pefindo Equity & Index Valuation Division. In Indonesia, this report is published in our website and in IDX website.